

Abstract
Human induced pluripotent stem cell (iPSC) lines are a powerful tool for studying development and disease, but the considerable phenotypic variation between lines makes it challenging to replicate key findings and integrate data across research groups. To address this issue, we sub-cloned candidate human iPSC lines and deeply characterized their genetic properties using whole genome sequencing, their genomic stability upon CRISPR/Cas9-based gene editing, and their phenotypic properties including differentiation to commonly-used cell types. These studies identified KOLF2.1J as an all-around well-performing iPSC line. We then shared KOLF2.1J with groups around the world who tested its performance in head-to-head comparisons with their own preferred iPSC lines across a diverse range of differentiation protocols and functional assays. On the strength of these findings, we have made KOLF2.1J and its gene-edited derivative clones readily accessible to promote the standardization required for large-scale collaborative science in the stem cell field.
Keywords: iPSC, pluripotent, reference, stem cell line, p53, karyotype, whole-genome, single-cell, CRISPR
eTOC blurb
Merkle and colleagues deeply characterized candidate human induced pluripotent stem cell (iPSC) lines to identify a common reference line. The KOLF2.1J line performed well across all tested assays and was therefore selected for large scale genomic engineering and distribution.
Graphical Abstract

Introduction
Human iPSCs are increasingly used to model diseases since they capture genetic contributors to disease risk and can be differentiated into relevant cell populations. Additionally, the genomes of iPSCs can be edited to introduce or correct disease-associated variants.1–3 For example, comparing control hiPSCs with isogenic knock-in of Mendelian variants associated with Alzheimer’s disease (AD) identified convergent transcriptomic events after differentiation into neurons1 or non-neuronal cells.2 In theory, the results of isogenic experiments could be compared across genetic variants, cell types, and analysis modalities by different groups. However, the use of different cell lines by different groups creates an obstacle to data integration, since genetic background influences cellular phenotypes.4–6 This issue has been recognized by communities working with model organisms, who appreciated that the benefits of a common reference outweigh the idiosyncrasies of a particular line or strain, since key results obtained on one genetic background can always be tested on another.7–9 Consequently, there is a large, unmet need in the stem cell field for common, well-characterized cell lines.
Several recent efforts have sought to address these challenges by developing gene-edited iPSC clones from a common parental cell line and making these available to the community. For example, the Allen Cell Collection (https://www.allencell.org/genomics.html) generated a series of publicly available, gene-edited reporters from the WTC11 iPSC line derived from a healthy donor.10,11 Here, we sought to identify a common cell line to facilitate large-scale collaborative studies such as the iPSC Neurodegenerative Disease Initiative (iNDI) from the NIH’s Center for Alzheimer’s and Related Dementias (CARD). The aim of this initiative is to generate hundreds of single nucleotide variant (SNV) knock-in, revertant, gene knockout, and endogenously-tagged CRISPR/Cas9-edited iPSC derivative lines relevant to Alzheimer’s Disease and Related Dementias (ADRD) on well characterized genetic backgrounds.12 To select candidate cell lines for this purpose, we first accounted for the freedom to modify and distribute the line and its derivatives, and then deeply characterized the genomic status, functional characteristics, and differentiation potential of multiple candidate iPSC lines, leading to the identification of KOLF2.1J as a lead reference cell line.
Results
Rationale and establishment of clonal candidate cell sub-lines
We set out to identify one or more deeply characterized human pluripotent stem cell lines to serve as a common reference for the field.12,13 Since human embryonic stem cell (hESC) lines face usage restrictions in many countries, we chose to prioritize hiPSC lines to enable a reference line to be globally shared. Although we are firm believers in the value of generating a series of reference lines from both genetically male and female donors of diverse genetic ancestries, we initially prioritized male lines due to the possibility that random X-chromosome inactivation may contribute to variance in gene expression14,15 and because several genetic disorders that we plan to model are X-linked and thus more frequently expressed in males. We therefore searched public repositories and curated a series of iPSC lines, many of which have already been whole genome sequenced. We then focused on a subset of lines with broad consents for data sharing and further dissemination of the line and its derivatives, and identified KOLF2_C1, KUCG3, LNGPI1, MS19-ES-H, NCRM1, NCRM5, NN0003932, NN0004297, and PGP1 (Table S1A).
After obtaining these lines, we found that the vial of MS19-ES-H we obtained was prone to spontaneous differentiation, and therefore excluded it from further study. We then single-cell cloned each of the remaining parental cell lines (Table S1A) to reduce heterogeneity from genetic and epigenetic drift in culture. We refer to these derivatives as “sub-lines” that retain the name of the parental cell line. Simultaneously, we used CRISPR/Cas9 editing (see Methods) to correct a mutation present in one copy of ARID2 in the KOLF2-C1 line16 and named our sub-line KOLF2.1J to indicate its derivation at Jackson Laboratories and distinguish it from a similar sub-line derived in parallel at the Wellcome Sanger Institute (KOLF2.1S; Andrew Bassett, personal communication). We selected one to four sub-lines per parental cell line for further expansion based on their typical stem cell morphology under phase contrast microscopy and normal karyotype from the analysis of >20 Giemsa-band metaphase chromosome spreads. Almost all tested sub-lines were euploid (46; XY; Table S1B), but some sub-lines harbored aberrant cells. For example, 2 of the 20 analyzed spreads from a KUCG3 sub-line showed a gain of chromosome 12. We therefore selected a single clonal sub-line from each parental line for further expansion into 192 replicate stock vials to ensure that they could be distributed and used as a similar passage to the characterizations described in this study (Table S1C). To extend the standard karyotypic analysis, we analyzed 181 to 200 high-quality metaphase spreads for selected sub-lines at chromosomes 1, 2 and 3 by directional genomic hybridization.17 This data established that selected sub-lines (except for KUCG3) were karyotypically normal (Table S1D), as later further confirmed by whole genome sequencing (WGS) and by the analysis of gene-edited cell clones.
Morphology and proliferation rates
Each sub-line had the morphology expected for hiPSCs, including a high nuclear to cytoplasmic ratio, prominent nucleoli, growth in colonies with well-defined borders, and an absence of differentiated cells (Figure 1A). To compare their survival and growth rates, we dissociated each sub-line to a single-cell suspension, imaged cultures at 24 and 48 hours after plating to calculate their confluence, and then dissociated and counted cells 48 hours after plating. There was a significant difference between the sub-lines in their total cell numbers after 48 hours (one-way ANOVA, F7, 24= 185.1, p<0.0001; Figure 1B). Additionally, there was a significant main effect of time (two-way repeated measures ANOVA; F2,80= 1836, p<0.0001) and cell sub-line (F7,80= 97.85, p<0.0001), on confluency as well as a time × cell sub-line interaction (F14,80=45.76, p<0.0001; Figure 1C, Table S1E). These results show that all sub-lines had similar morphology but varied in their survival and proliferation rates.
Figure 1: Growth, gene expression, and P53 pathway integrity of candidate cell sub-lines.
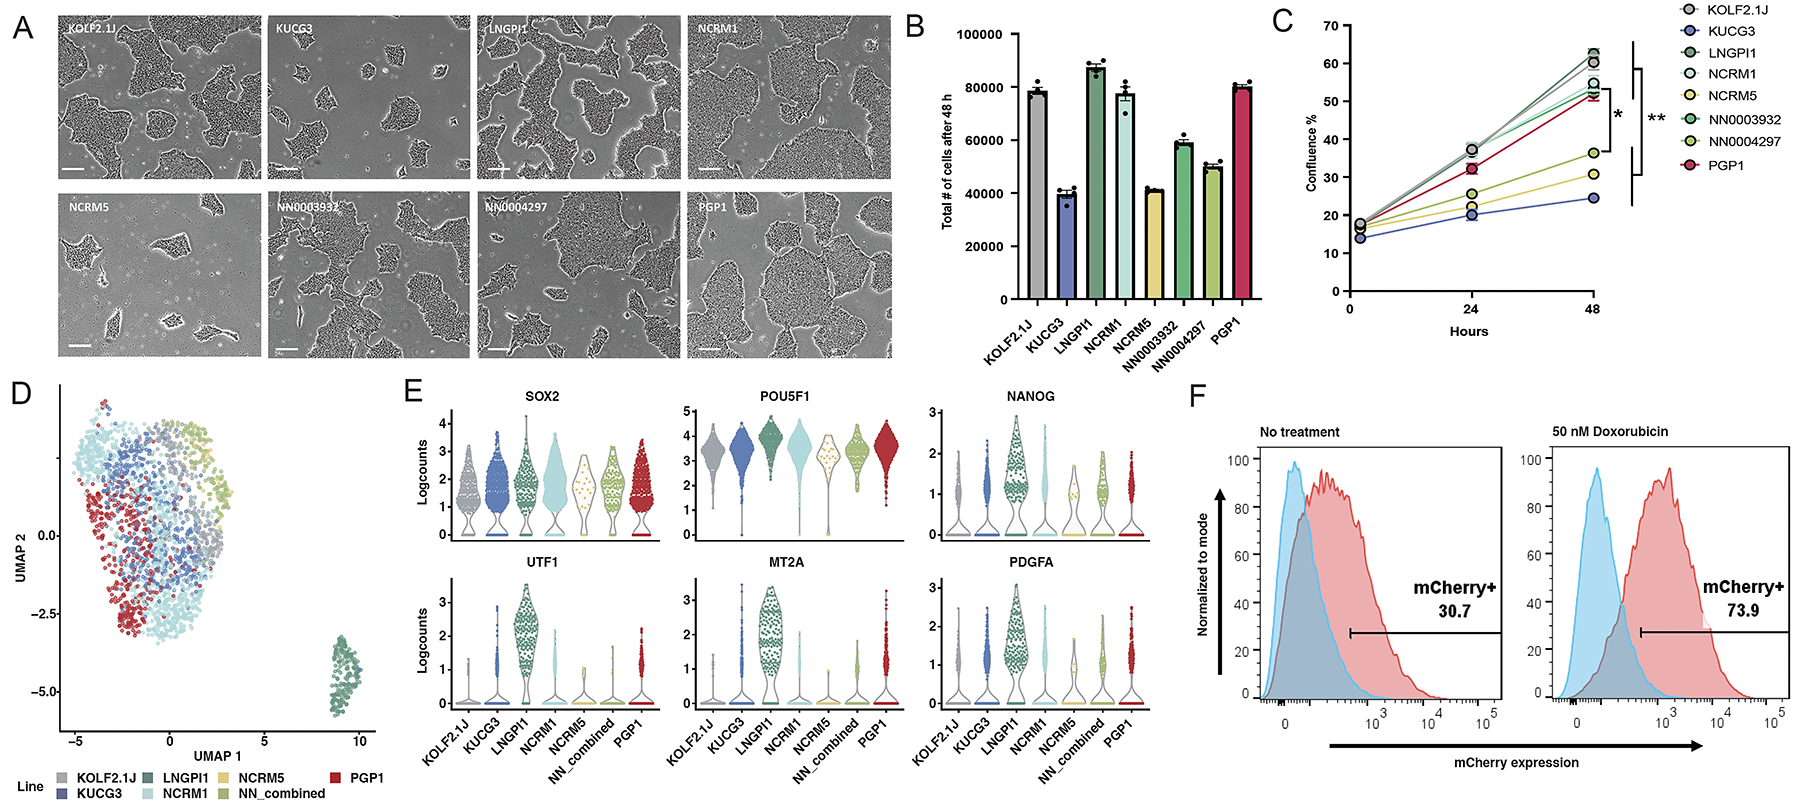
(A) Representative phase contrast photomicrographs of colony morphology of the eight iPSC sub-lines on day 3 after replating. Scale bars indicate 100 μm.
(B) Mean and SEM (n=4) of the total number of cells 48h after plating 30,000 cells/well.
(C) Mean and SEM (n=6) of percent confluence at 0, 24 and 48 h after plating 30,000 cells/well.
(D) UMAP projection of 2,270 iPSC cells color-coded by cell sub-line. There are two distinct groupings of cells, with the large group being composed of the 6 out of 7 sub-line and the small outlier group being composed of the LNGPI1 sub-line.
(E) Beeswarm plots showing expression of selected genes associated with undifferentiated stem cells (top row) or poor neuronal differentiation potential (bottom row).
(F) A mCherry PiggyBac reporter assay confirms the baseline activity (left plot) of the p53 pathway in KOLF2.1J (red) relative to TP53 knockout cells (blue), which is further inducible in response to the DNA damaging agent doxorubicin (right plot).
Stem Cell Marker Expression
The eight selected sub-lines were immunostained with antibodies against undifferentiated stem cell markers TRA-1-60 and NANOG, and the percentage of immunopositive cells was quantified by flow cytometry analysis. We found that all analyzed sub-lines are >90% positive for both markers, except PGP1, which was 84.2% positive for NANOG (Figure S1A).
Next, we performed single-cell RNA sequencing (scRNA-seq) on all eight iPSC sub-lines (Figure 1D). We pooled them together for joint library preparation and sequencing to minimize technical sources of variation, and then used genetic diversity to assign each cell to a sub-line.18 Since sub-lines NN0003932 and NN0004297 were derived from the same donor, these are represented in our dataset as NN_combined (Figures 1D, S1B). UMAP projection of the data from 2,270 single cells revealed two distinct groups of cells, the largest corresponding to six genetically distinct sub-lines and one small outlier group primarily from one sub-line, LNGPI1 (Figure 1D). Louvain clustering identified 5 clusters within the larger group that arise largely from cell cycle states of the proliferative cells (Figure S1C–D) and 1 cluster within the smaller group that is composed of the LNGPI1 sub-line (Figure 1D). Comparison of stem cell markers across the 7 genetically distinct sub-lines showed consistent expression of core stem cell marker genes including SOX2, POU5F1 and NANOG (Figure 1E, S1E) but LNGPI1 expressed higher levels of UTF1 and other genes associated with inefficient neuronal differentiation.18 Together, these findings show that all analyzed iPSC sub-lines had gene expression patterns consistent with undifferentiated stem cells, and 6 of the 7 genetically distinct sub-lines showed similar transcriptional profiles.
Integrity of the p53 response to DNA damage
Established iPSC lines can acquire genetic changes that impart a growth advantage in culture.19 Of these, mutations in the TP53 gene are recurrent20,21 and loss of a functional p53 pathway may be selected for during CRISPR editing and clonal expansion.22 To measure p53 pathway function in our hiPSC sub-lines, we transfected cells with a reporter plasmid that contains 13 copies of a p53 DNA binding site linked to mCherry, and quantified mCherry expression by flow cytometry in response to treatment with vehicle or the DNA-damaging agent doxorubicin. This analysis showed doxorubicin activated reporter expression in all eight selected sub-lines compared to TP53 knockout cells (Figure S2). To confirm these results, we developed a more stable version of the P53 reporter based on an integrating piggyBac transposon and observed similar baseline and damage-induced activity of the P53 pathway (Figure 1F). These results confirm integrity of the p53 pathway in all lines, with particularly robust responses in KOLF2.1J, LNGPI1, NCRM1, and PGP1.
Genomic characterization by whole genome sequencing (WGS)
To understand the genetic background of each sub-line, we sequenced their genomes at >30x coverage. The distribution of insertion-deletion (indel), loss-of-function (LOF), and missense single-nucleotide variants (SNVs) was similar across all lines (Figure 2A) and similar to human populations in the gnomAD database.23 When we restricted our analysis to variants with a gnomAD allele frequency of <0.001 and CADD phred score of >30,18 we observed a modest number of such potentially deleterious variants per cell line (Figure 2B, Table S2A). As the goal of iNDI is to model neurodegenerative diseases, we next examined WGS data for known pathogenic mutations in ADRD-associated genes. We identified heterozygous LOF variants in DRD4 (rs587776842 in NN0003932 and NN0004297) and MPDZ (rs376078512 in KUCG3) but these were not the pathogenic homozygous state.24,25 Next, we tested for the presence of genetic variants that have a strong to moderate association with ADRD. Specifically, we screened for variants in the AD risk gene APOE (rs429358 and rs7412), the frontotemporal dementia-associated variant rs3173615 in TMEM106B, and the MAPT haplotype rs180054 associated with risk of Parkinson’s disease (PD). We found that NCRM1 and NCRM5 carry the AD risk allele APOE E4, and identified variants in other genes known to be risk factors for ADRD (Table S3A). Finally, we calculated polygenic risk scores (PRS) for all iPSC lines based on their cumulative burden of common genetic variants associated with AD or PD26,27 and found that their PRS falls within the expected range of the population (Figure 2C). Together, these findings show that the candidate sub-lines have relatively neutral genetic risk for ADRD.
Figure 2. Genetic analyses of eight candidate iPSC sub-lines.
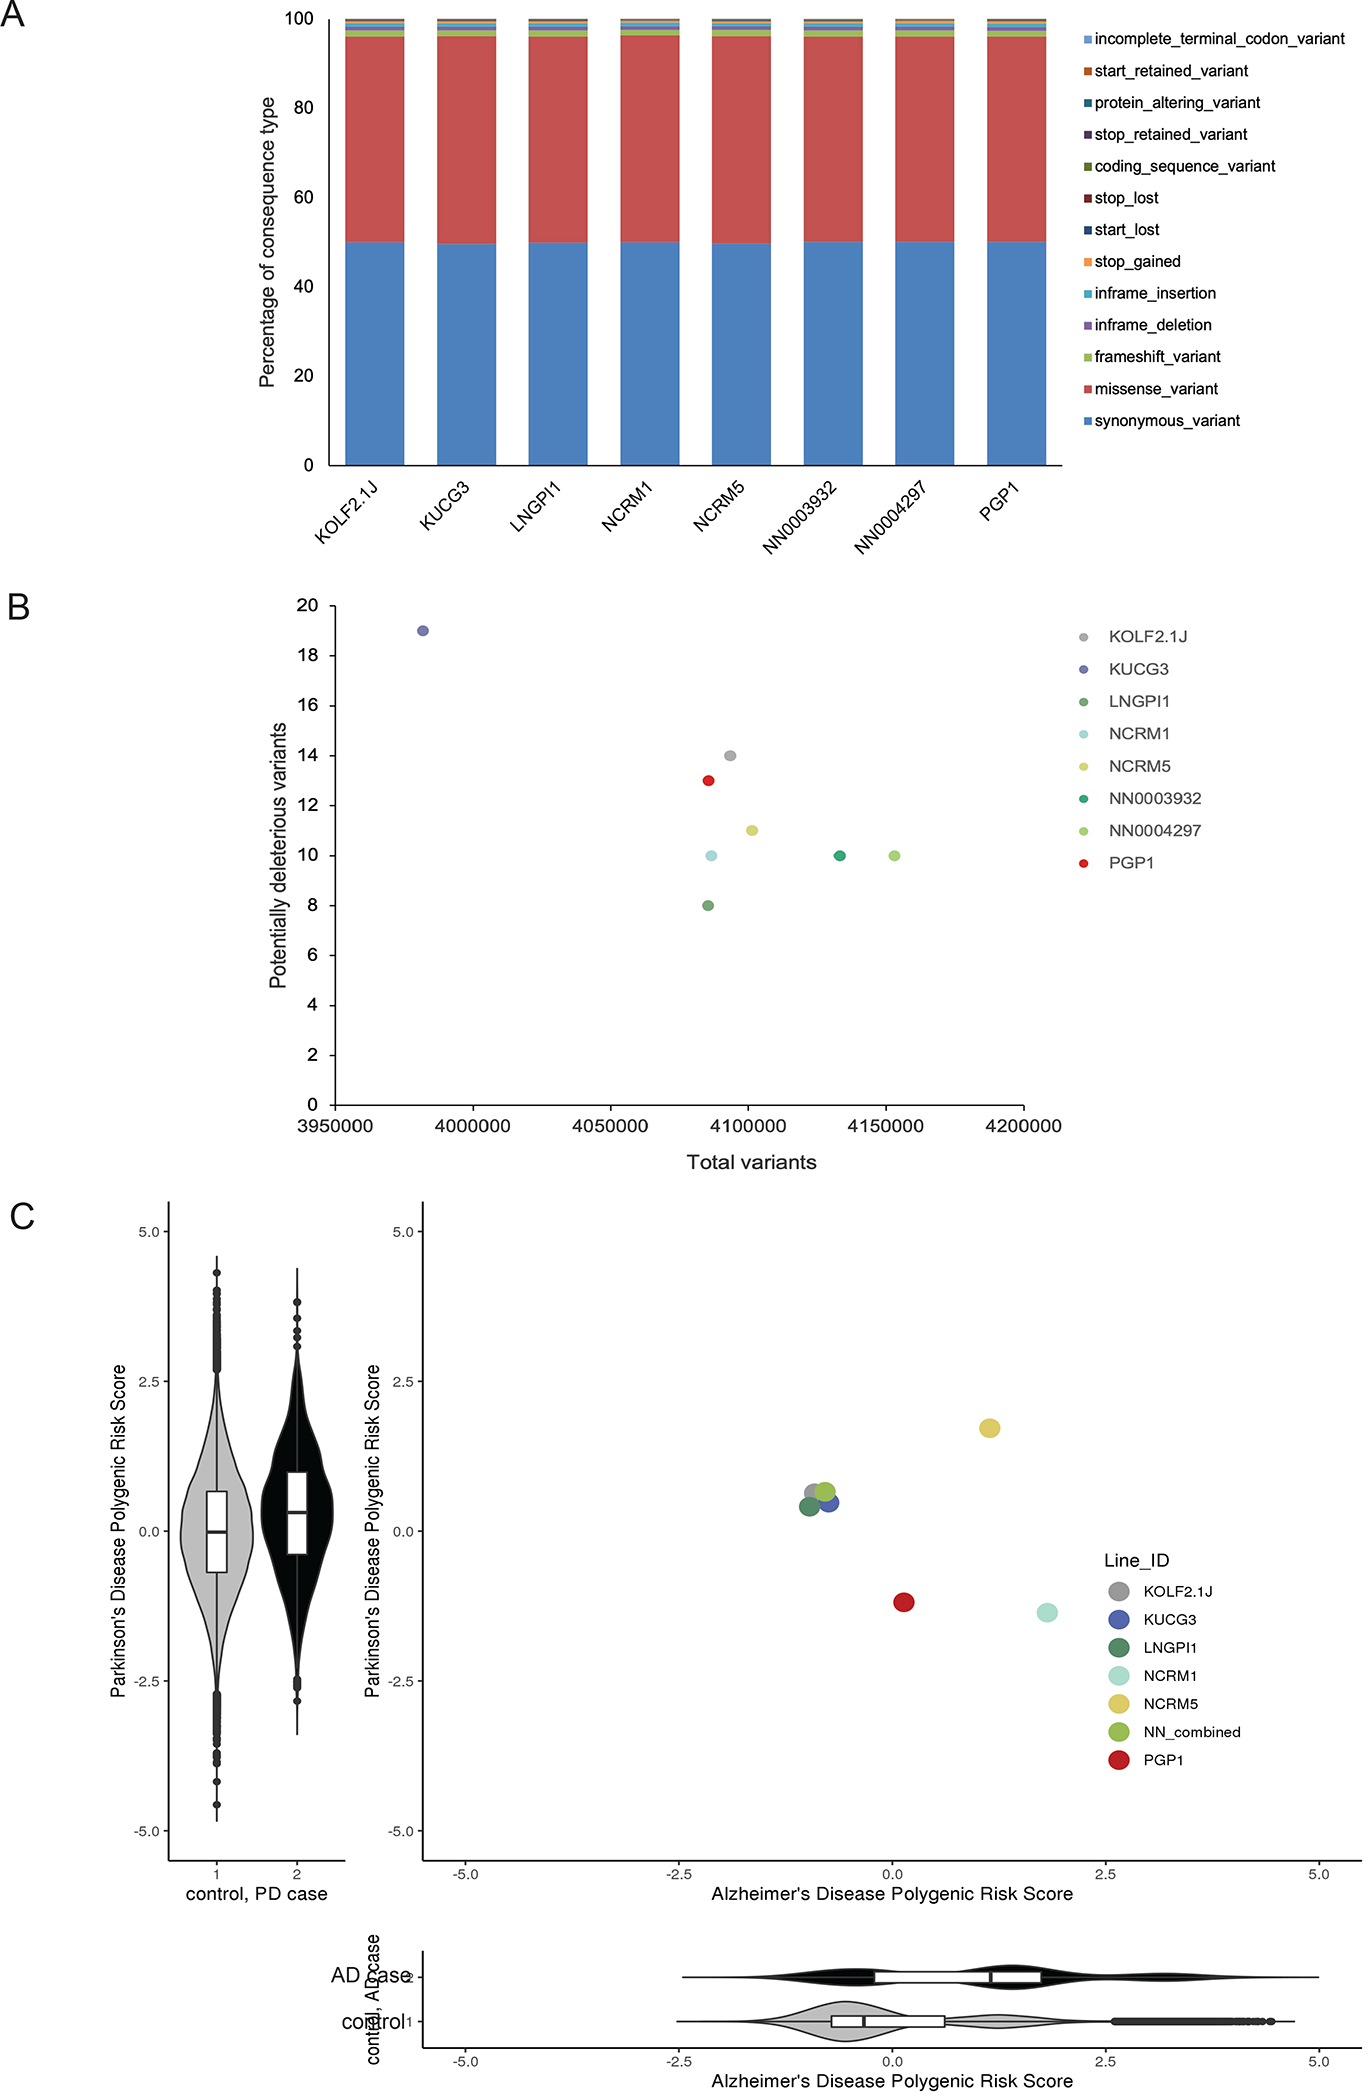
(A) The percentage of genetic variant types present in the 8 candidate iPSC sub-lines, grouped by their bioinformatically predicted consequences on coding sequences.
(B) The number of rare (gnomAD AF<0.001) predicted deleterious (CADD phred >30) variants identified in the 8 iPSC sub-lines versus the total number of identified variants.
(C) Polygenic risk scores (PRS) for Alzheimer’s disease (AD) and Parkinson’s disease (PD) are shown alongside the population-centered Z score distribution for PD PRS (y-axis) in 2995 PD cases (black) and 96,215 controls (grey) from the UK Biobank, and a similar PRS distribution for AD polygenic risk score (x-axis) in 2337 AD cases (grey) and the same controls.
CRISPR-based gene editing potential
As many groups will want to edit the genomes of the selected hiPSC sub-line, we next characterized the efficiency with which a SNV could be introduced. Using improved conditions for homology-directed repair,28,29 we introduced a G to C SNV in exon 1 of the TIMP3 gene located at Chr22q12.3,30 resulting in an S38C missense mutation. Twenty-four edited clones from each sub-line were genotyped by Sanger sequencing of PCR amplicons spanning the targeted site of the TIMP3 locus to quantify frequency of six possible genotypes (WT/WT, WT/SNV, WT/indel, SNV/SNV, SNV/indel, and indel/indel; Figure 3A). The overall editing efficiency of homozygous (SNV/SNV) was over 40% (Figure 3B). We also found that ratio of SNV/WT and SNV/SNV edits generated by homology directed repair (HDR) to indels generated from non-homologous end joining (NHEJ) varied across the sub-lines, with a higher frequency of WT/indel and SNV/indel clones observed in NN0003932 and NCRM1, respectively.
Figure 3. Comparative gene editing efficiency.
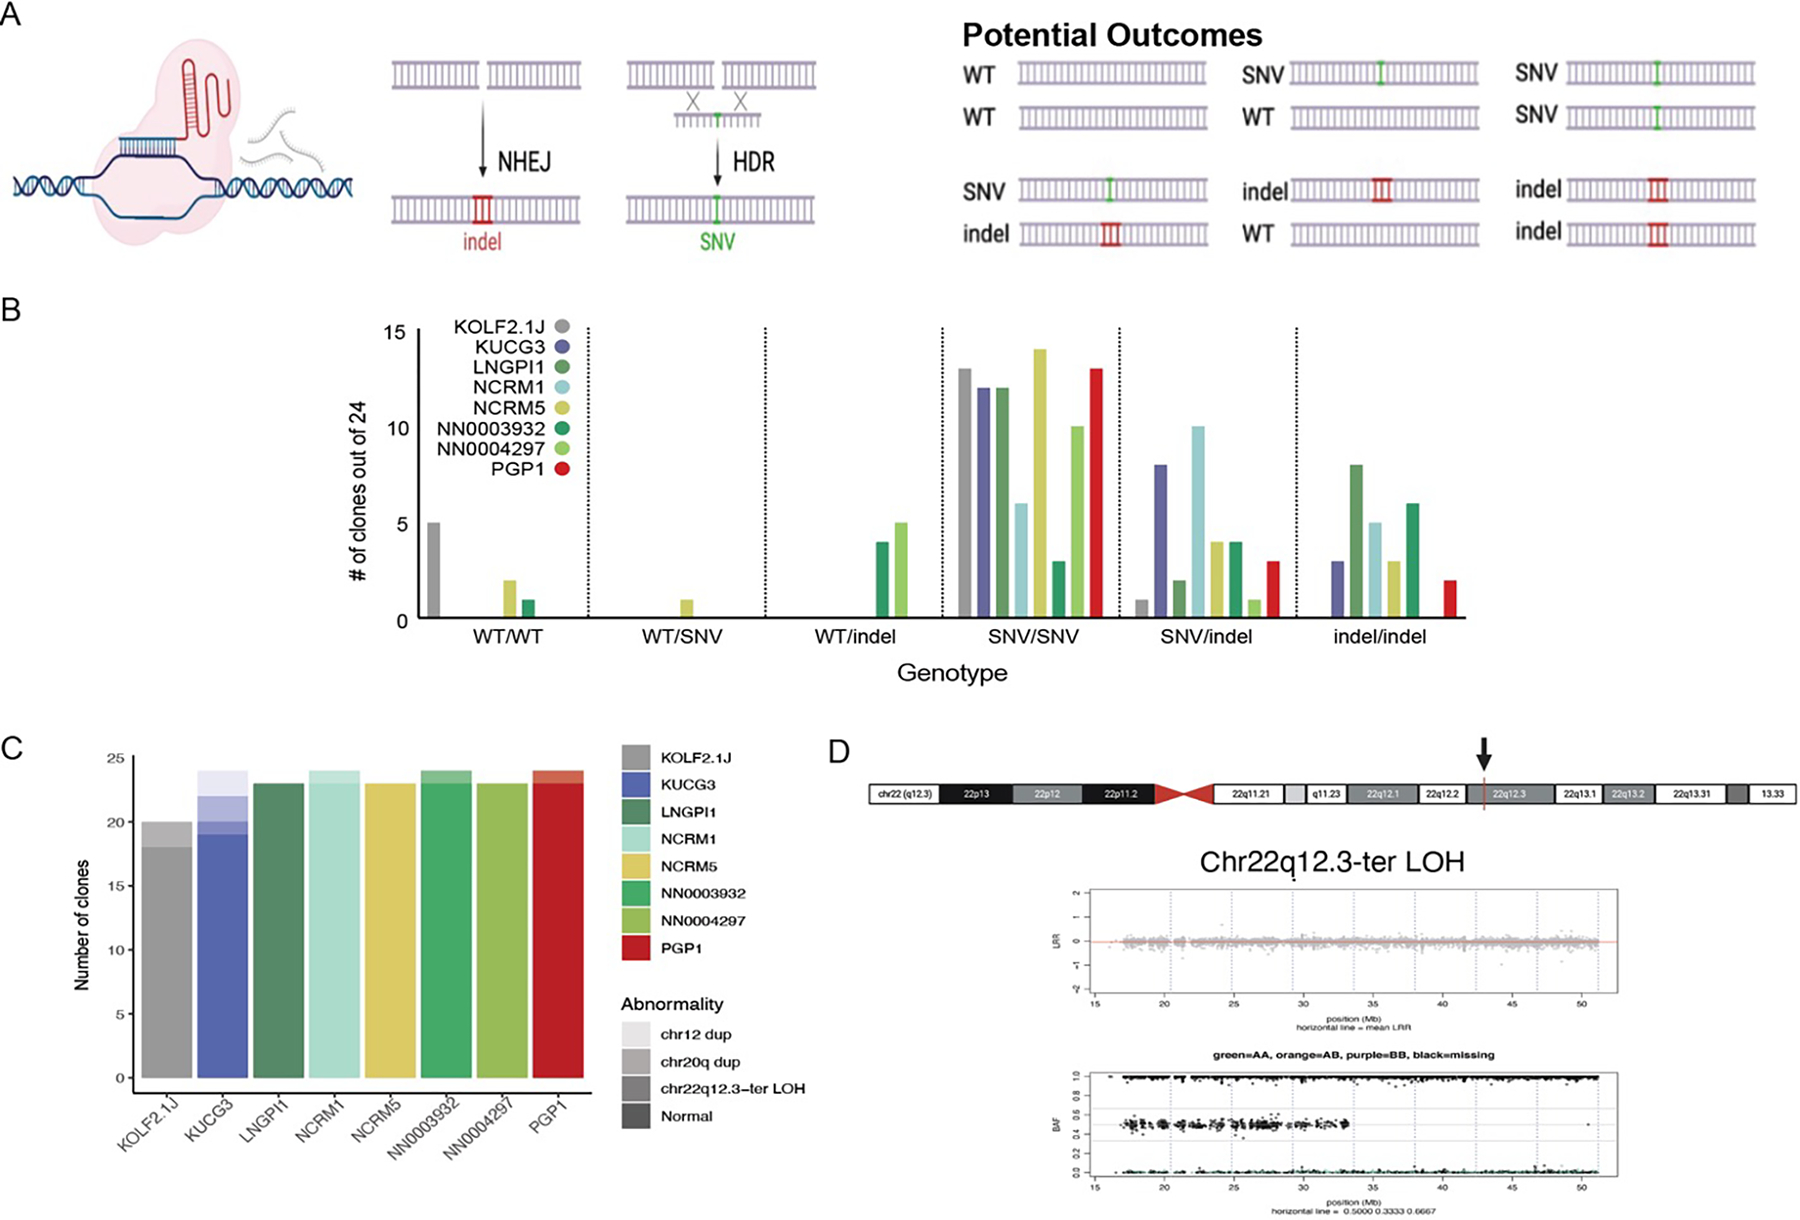
(A) Schematic of the gene editing experiment, showing how a CRISPR/Cas9-induced double strand break can lead to the formation of insertion/deletion mutations (indels) via the non-homologous end joining (NHEJ) pathway or be repaired with a single-stranded oligodeoxynucleotide via the homology-directed repair (HDR) pathway to introduce a single nucleotide variant (SNV) of interest and resulting in 6 potential alleles. Figure created with BioRender.com
(B) The number of clones out of 24 expressing each possible genotype at the targeted SNV for each analyzed sub-line.
(C) Number of genomic abnormalities observed among 20–24 analyzed clones across the eight analyzed sub-lines.
(D) Ideogram of chromosome 22 with the TIMP3 gene in 22q12.3 indicated by a red bar and black arrow, using the UCSC Genome Browser. NeuroArray genotyping revealed Chr22 CN-LOH from chr22q12.3-ter in clones derived from the KOLF2.1J sub-line. Upper plots show Log R ratio (LRR) where the mean LRR (red line) is 0 for the normal clone and >1 for the abnormal clones, and middle panels show the B allele frequency (BAF) for bi-allelic probes along the arrays with evidence of duplicated alleles across the chromosome.
As CRISPR/Cas9-induced DNA double strand breaks can lead to undesired editing 31,32 and because chromosomal abnormalities that confer growth advantage can be selected for in culture, we evaluated genomic fidelity of gene-edited clones using the NeuroChip DNA microarray.33 Our WGS data confirmed that parental sub-lines were clearly genetically distinct as determined by pi-hat,34 except for clones NN0003932 and NN004297 derived from the same donor (Figure S3A). We also found very high concordance across the genome (pi-hat >0.986) when comparing gene-edited clones with their parental sub-lines using DNA microarray data, suggesting that the number of SNVs acquired during CRISPR editing was lower than the theoretical limit set by the call rates for this array (>0.968; Table S3B, Figure S3B). We then examined the microarray data to evaluate the frequency of large chromosomal abnormalities in the edited clones (Table S3B). From 185 edited clones, we identified 10 clones with chromosomal abnormalities, which involved chr12 (2 clones), chr20 (2 clones) or chr22 (6 clones).35–41 Clones derived from the KUCG3 sub-line had duplications of chr12 (Figure S3C) previously observed by karyotyping, suggesting the sub-line harbored mosaic variants at the time of gene editing. In contrast, the absence of this variant in any of the other sub-lines (181/185, 98%) support our earlier findings that sub-lines are karyotypically normal.
We also observed recurrent chr22 abnormalities in two homozygous edited clones of KOLF2.1J and one clone each of KUCG3, NCRM1, NN0003932 and PGP1. This abnormality represents copy-neutral loss of heterozygosity (CN-LOH) from the telomere to the region of chr22q12.3 (Figure 3D) containing the target of gene editing, TIMP3. Intrigued by this finding, we further explored the nature and frequency of genomic variants that emerge upon CRISPR/Cas9-based gene editing by targeting additional genetic loci, as described in detail elsewhere.28 We found that the majority (98%, 430/440 total) of clones tested lacked detectable acquired structural variants, in marked contrast to earlier reports that CN-LOH events can be common upon gene editing.31 Together, these results suggest that except for KUCG3, tested iPSC sub-lines do not contain mosaic populations of large genetic variants or readily acquire them upon gene editing.
Differentiation Potential
Since the generation of disease-relevant cell types is an important application of hiPSCs, we tested the ability of sub-lines to support cell differentiation, with an emphasis on the neural lineage. We tested four established protocols, two of which use small molecules and two of which were based on the overexpression of transcription factors (Figure 4A–B). Specifically, we directed the differentiation of iPSCs into either cortical or hypothalamic neurons and expressed either the transcription factor NGN2 to induce the formation of excitatory forebrain neurons (iNeuron, or hNGN2), or the transcription factors NGN2, ISL1, and LHX3 to induce the formation of lower motor neurons (iLowerMotorneurons, or hNIL). To assess differentiation efficiency, we profiled the differentiated cells using single-cell RNA-sequencing.
Figure 4. Differentiation potential of candidate cell sub-lines.
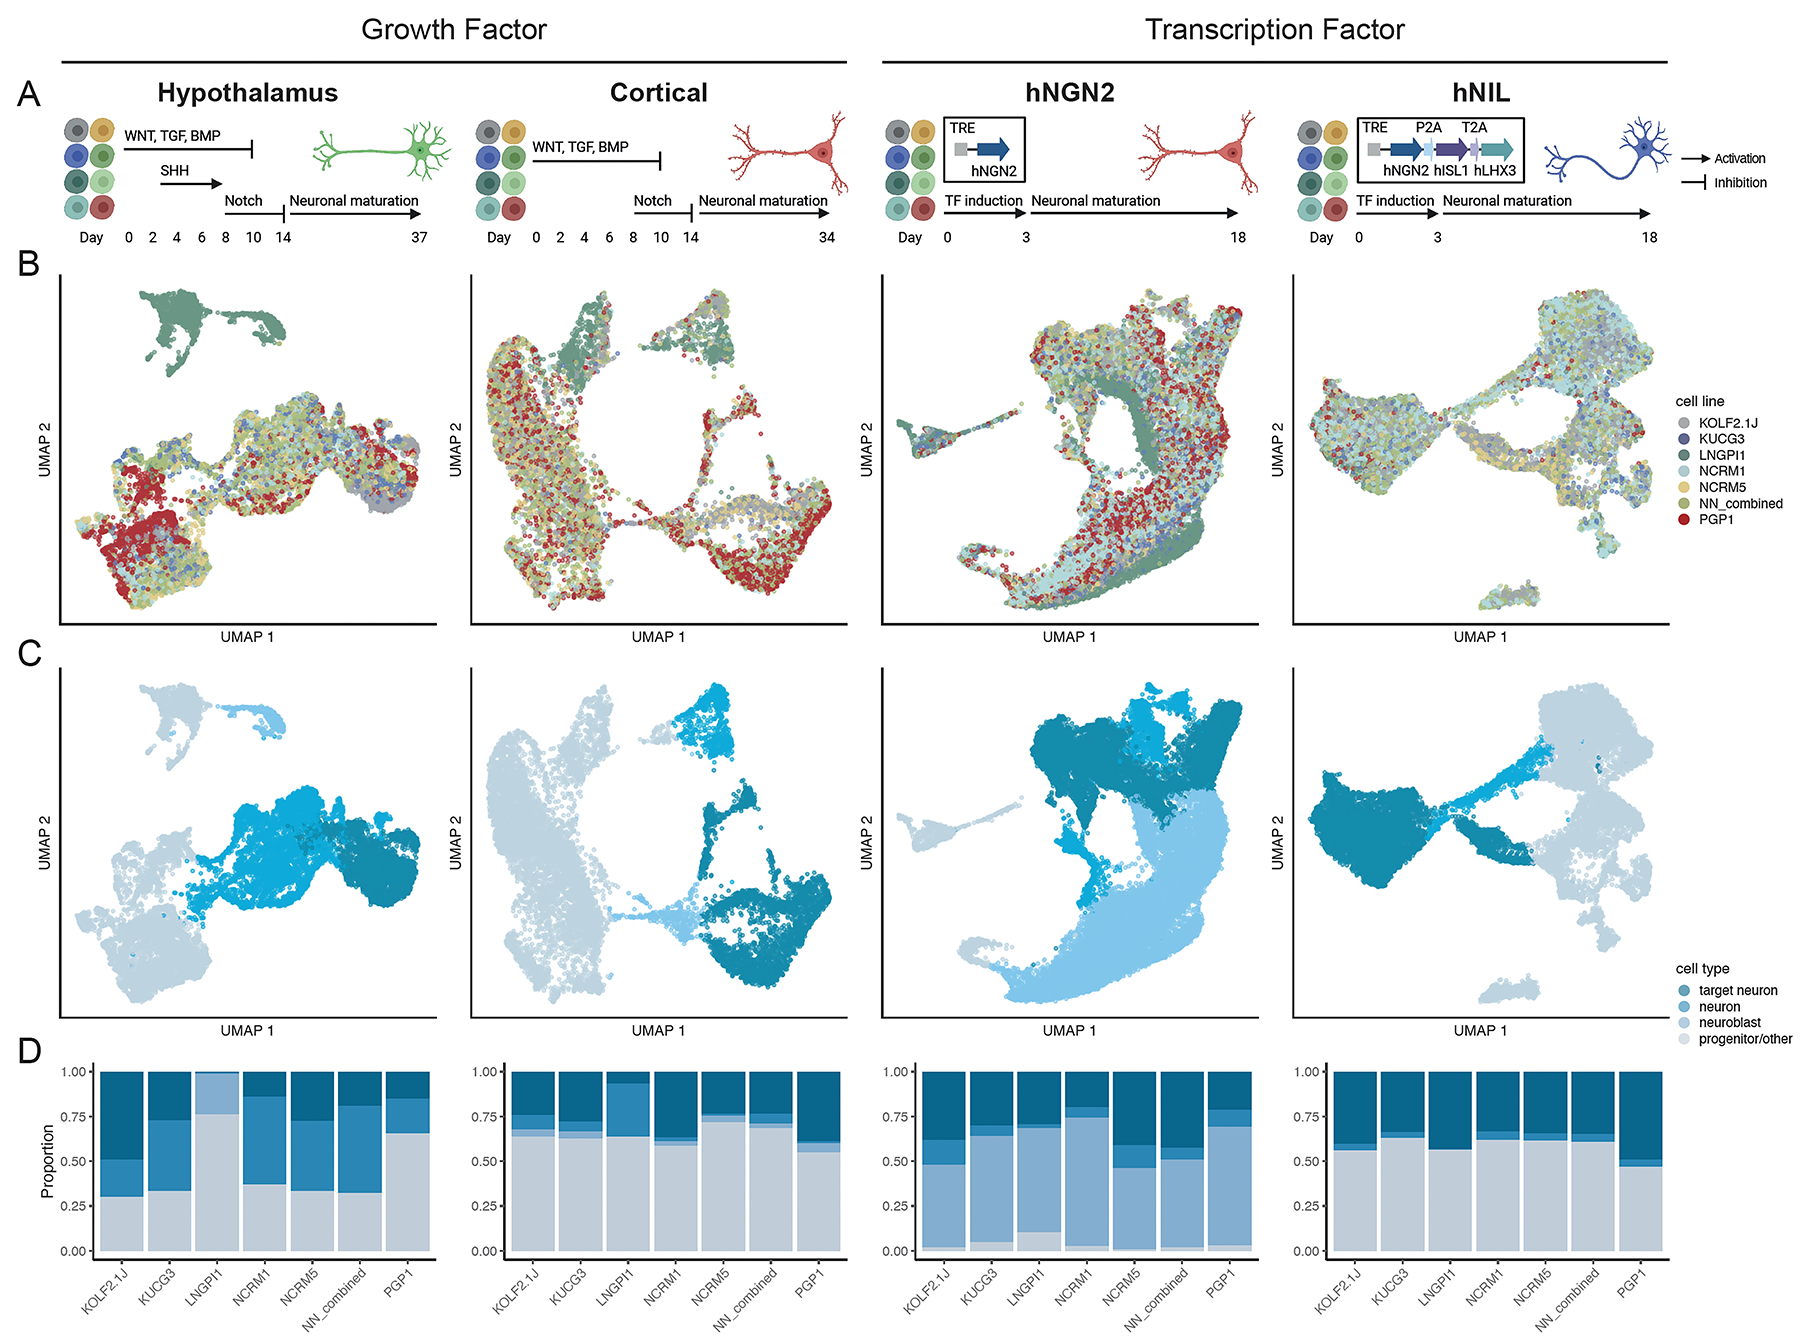
(A) Schematic of experimental design for four differentiation protocols evaluated in this study: hypothalamus and cortical differentiation (growth factor-based protocols), and hNGN2 and hNIL differentiation (transcription factor-based protocols). See STAR methods for detailed descriptions of differentiation protocols. Figure created with BioRender.com
(B and C) UMAP plot for each differentiation colored by cell sub-line (B) and cell type (C). Cell type classification is derived from grouping each cluster into target neuron, neuron, neuroblast and progenitor/other categories based on the cluster annotation (Figure S4).
(D) Bar plot showing proportion of cells assigned to each cell type per cell sub-line.
After quality control, demultiplexing and doublet removal, we obtained 12,818 cells from the hypothalamic protocol, 9,656 cells from the cortical protocol, 27,708 cells from the iNeuron protocol, and 18,008 cells from the iLowerMotorneurons protocol. As described above, cell sub-line identity was assigned to each cell using genotype information from the scRNA-seq reads. Louvain clustering revealed 17 clusters for hypothalamic differentiation and 13 clusters for the other 3 differentiations, which were then annotated using literature-curated genes indicative of cell identity (Figure S4). We then grouped clusters into four categories based on their expression of indicative genes: target neuron, neurons, immature neurons, or progenitor/other (Figures 4C and S4), and defined differentiation efficiency as the percentage of cells from each cell sub-line that gave rise to the target cell type (Figures 4D and S5).
We found that across all four differentiation protocols, cell sub-lines consistently generated the target cell type but varied in their differentiation efficiency (Figure S5E–H). We observed that the KOLF2.1J, NCRM5, and NN_combined sub-lines consistently generated a substantial fraction of target cell types, whereas LNGPI1 did not perform well in directed differentiation protocols, as suggested by its gene expression profile in the pluripotent state (Figure 1D). Overall, the variable performance of their differentiation efficiency provides another phenotypic readout to guide the rational selection of a cell line for future development.
Selection of KOLF2.1J as a reference cell line
Having deeply characterized the genetic and phenotypic properties of the eight lead sub-lines, we next asked if any of them showed favorable properties across all of the measures we tested (Table S4). We removed LNGPI1 from consideration due to its unusual gene expression in the pluripotent state and poor differentiation properties. We also eliminated PGP1 due to possible residual expression of reprogramming factors suggested by GFP expression during FACS analysis, though we alert readers to the fact that other integration-free versions of this cell line exist.42 Though all sub-lines were amenable to CRISPR/Cas9-mediated gene editing of individual DNA bases, NN0003932 and NCRM1 showed relatively low gene editing efficiencies at the tested locus. Cell sub-lines KUCG3, NCRM5, and NN0004297 were amenable to gene editing and differentiated well, but appeared to have slow growth kinetics relative to the other sub-lines, including KOLF2.1J. Consequently, since KOLF2.1J performed well across all tested assays, and was found to harbor APOE3/E3 (Table S3A), we selected it as a candidate reference iPSC sub-line.
KOLF2.1J lacks genetic variants likely to cause neurological disease
We reasoned that any reference iPSC selected for large-scale studies should be extensively tested for the presence of genetic variants that might hinder the interpretation of molecular and cellular phenotypes in its differentiated progeny. First, we tested whether the process of editing ARID2 in KOLF2.1J might have introduced unwanted mutations or culture adaptations. We therefore submitted both KOLF2.1J and the parental KOLF2-C1 line for 10x Genomics linked-read sequencing to generate phased genotyping data to complement our earlier 150 bp WGS (Figure 5A). We then called high confidence and high quality SNV and indels and tested for variants that were rare (gnomAD allele frequency < 0.001) or deleterious (CADD phred score >30). Only 25 coding variants were observed in KOLF2.1J but not KOLF2-C1, and none of them were predicted to be rare or deleterious (Table S2B; Figure 5C). These findings suggest that the process of editing ARID2 did not select for concerning variants, consistent with the remarkable genetic stability observed upon gene editing (Figures 3 and S3).
Figure 5. Whole genome sequencing of KOLF2.1J and the KOLF2-C1 parental line.
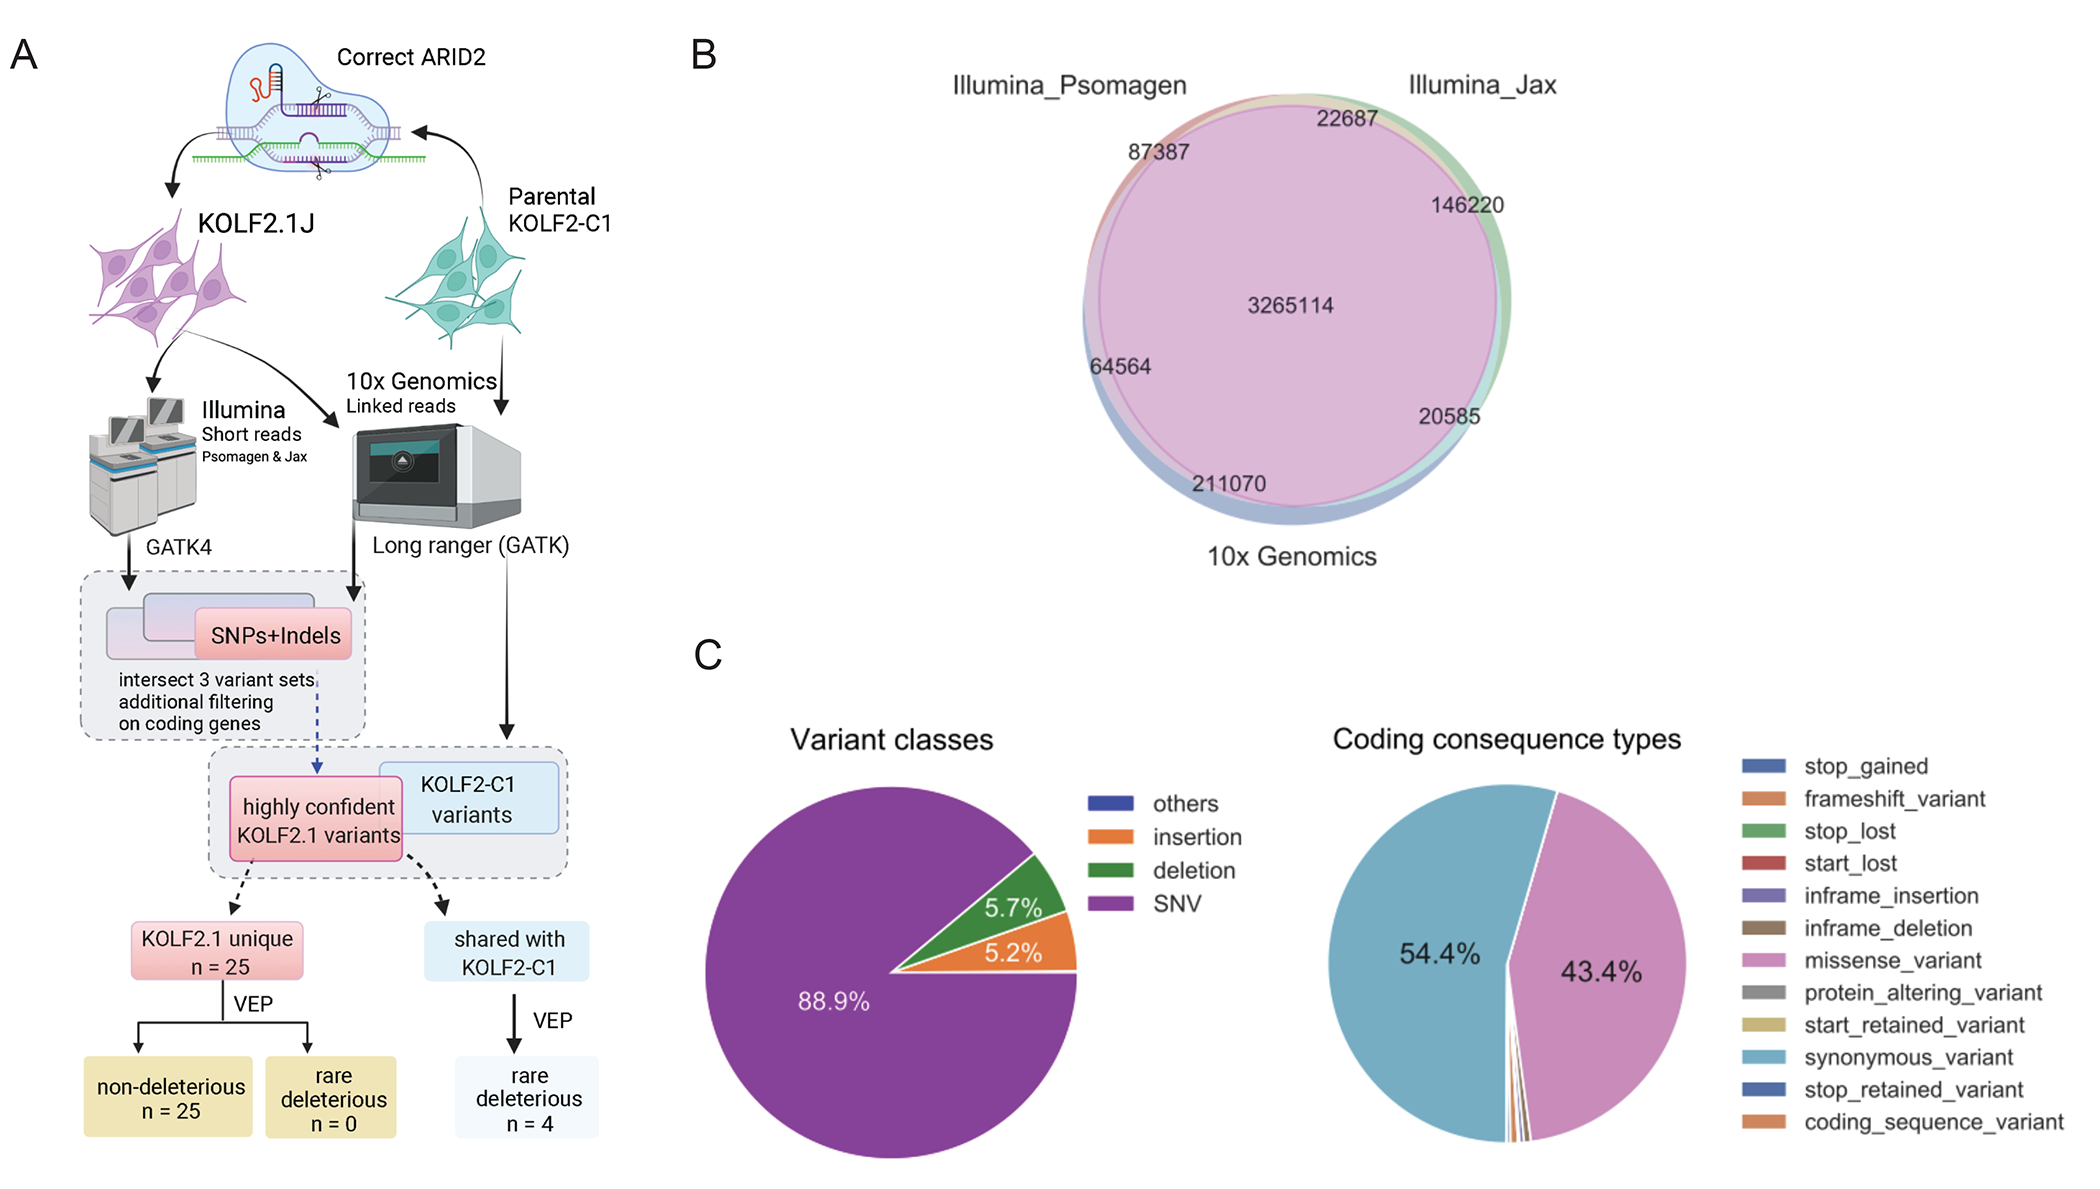
(A) Flowchart of the discovery, filtering, annotations, and comparisons of SNP/indel variants in the ARID2-corrected KOLF2.1J and its parental line KOLF2-C1. Schematic created with BioRender.com
(B) The consensus variant calls for KOLF2.1J from two Illumina short sequencing services (Psomagen and Jax) and one linked-read sequencing platform (10x Genomics).
(C) The genetic compositions of the variant classes (left) and their effect on coding genes (right) for the 3.28 million high-confidence SNPs and indels in KOLF2.1J.
Next, we asked if KOLF2.1J might harbor other variants of concern that had been inherited from the KOLF2-C1 or the fibroblasts from which it was derived. Analysis of ~30x WGS data showed that the overall burden of potentially deleterious SNVs in KOLF2.1J was similar to that of other iPSC lines (Figure 2B). We reasoned that combining two distinct short-read WGS datasets with the linked-read WGS dataset would enable us to filter out sequencing errors and increase our power to identify rare and potentially deleterious genetic variants. Indeed, this approach revealed 40 such variants in KOLF2.1J (Figure 5B, Table S2D). To gain insight into the origin of these variants, we manually reviewed sequencing data from the KOLF fibroblasts from which the KOLF-C1 parental line was derived and found that the vast majority of these variants (37/40, 93%) were already present in the donor fibroblasts and many of them were likely inherited from the germline. Other variants were only seen in a subset of sequencing reads, suggesting they arose as somatic mutations in a subset of the fibroblasts rather than during iPSC reprogramming, culture, or sub-cloning.43
To predict which of these variants might impact cellular phenotypes of KOLF2.1J or its differentiated progeny, we prioritised genes predicted to be loss-intolerant (score < 0.03) by LoFtool44 or listed as haploinsufficient in ClinGen.45 We observed variants in three such genes, including the previously described splice site disruption in COL3A1,16 a gene that is associated with the vascular disease Ehlers-Danlos Syndrome (OMIM 130050). Given the role of this gene in extracellular matrix (ECM) production, we speculate that the variant will not affect most neural cell types, but urge caution if using KOLF2.1J to study cell lineages or co-culture systems that interact with the ECM. We also observed a truncating variant in the homeobox gene SHOX that is associated with short stature (OMIM 127300) and might alter cellular phenotypes in iPSC-derived skeletal cells, but likely not cells of the neural lineage. Finally, we observed a variant in the caspase-interacting gene DEDD that is not associated with human disease in OMIM. Together with G-band karyotyping and dGH data showing the absence of large structural variants, these findings suggest that the genome of KOLF2.1J does not harbor genetic variants that would substantially compromise the use of this sub-line for modeling neurological disease.
Distribution and community-based characterization of KOLF2.1J
To rigorously benchmark the performance of KOLF2.1J relative to other lines, we distributed it to groups who returned information on its growth and differentiation potential using independent approaches established in their laboratories. KOLF2.1J has been cultured and differentiated into numerous cell types, including three-germ layer cells (Figure 6A), cortical glutamatergic neurons (Figures 6B–C; S6A–F), cortical forebrain neurons (Figure 6D–F), skeletal myocytes (Figure S6G), motor neurons (Figures 6G; S6H–I), astrocytes (Figure 6H), microglia and macrophages (Figures 6I, S6J–K), and dopaminergic progenitors, neurons, and organoids (Figures 6J, S6L–M), using established differentiation protocols (Table S5). To rigorously test its performance, nine other research groups carried out 10 distinct differentiation protocols or assays to compare KOLF2.1J head-to-head with a total of 12 other iPSC lines.
Figure 6. Performance of KOLF2.1J and established hPSC lines in head-to-head comparisons.
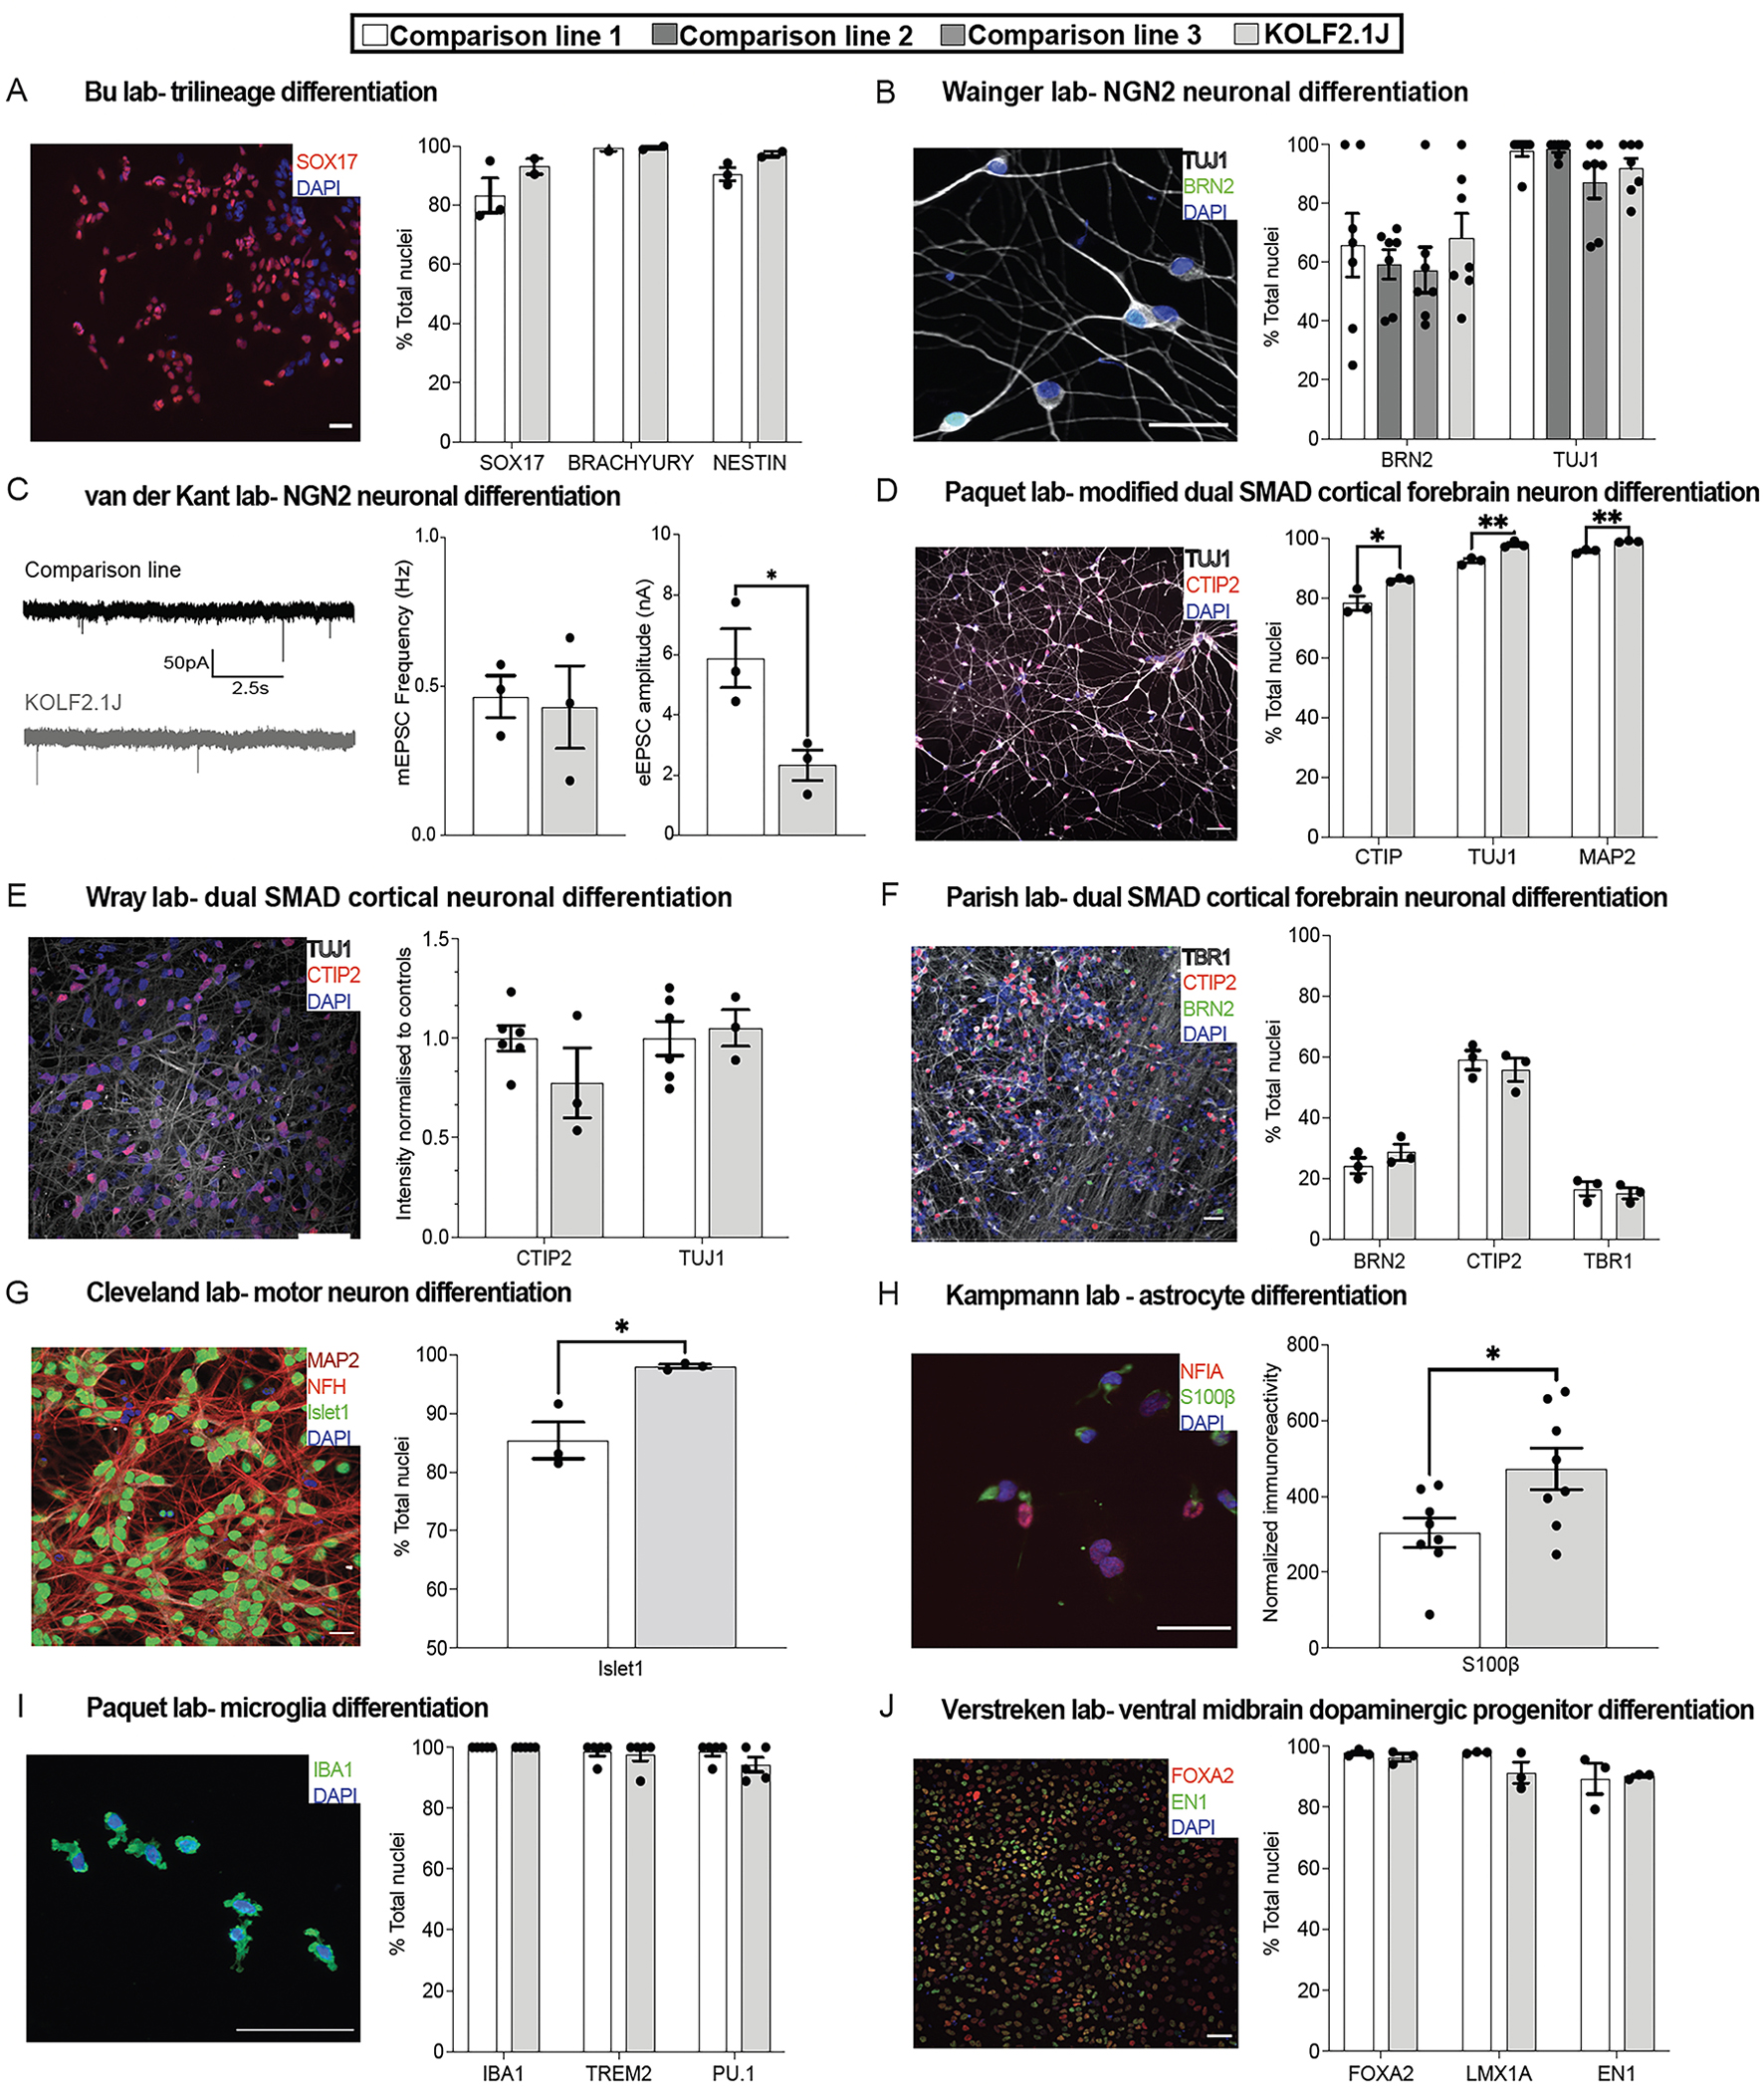
In all figure panels, the performance of KOLF2.1J is shown relative to a comparison line, with the providing laboratory and differentiation method indicated. Photomicrographs of immunostaining (or recording traces) are shown to the left of each panel, where scale bars represent 50 μm and nuclear markers are in blue. Quantification of phenotypic outcomes are given on the right, where N=3 differentiations were analyzed for each cell line and unpaired t-tests were used to calculate significance unless otherwise stated. *p<0.05, **p<0.01.
(A) Multi-lineage differentiation to endoderm (SOX17), mesoderm (brachyury), or ectoderm (nestin) reveals no significant differences between KOLF2.1J and APOE3 ALSTEM. All data not shown.
(B) NGN2-induced neuronal differentiation quantified by the expression of the neuronal marker TUJ1 (grey) and the cortical layer 2/3 marker BRN2 (green) show similar expression across KOLF2.1J and comparison lines ND50003, ND50004, and 11a. n=7 wells/line, N=1 differentiation. Kruskal-Wallis test for each marker.
(C) Patch clamp analysis of NGN2-induced neurons derived from BioniC13 and KOLF2.1J lines show spontaneous miniature excitatory postsynaptic currents (mEPSCs, left) in similar frequencies between the lines (center), though KOLF2.1J-derived cells appeared to have a lower excitatory EPSC amplitude (right).
(D) A greater proportion of KOLF2.1J-derived cortical neurons generated by directed differentiation expressed the deep-layer cortical marker CTIP2 and TUJ1 than the Thermo Fisher A18944 comparison line (D).
(E) In another group, directed cortical neuron differentiation yielded similar expression of Tuj1 (grey) CTIP2 (red) as the comparison lines RBi001 and Ctrl1. Comparison lines averaged together, N=3–6 differentiations/line.
(F) KOLF2.1J and H9 neurons had similar expression of BRN2 (green), CTIP2 (red), and TBR1 (grey) following directed differentiation.
(G) Greater efficiency of Islet1 expression was observed following differentiation of KOLF2.1J into motor neurons, compared to the CVB cell line.
(H) KOLF2.1J and WTC11 cell lines were differentiated into astrocytes and immunostained for S100β (green) and NFIA (red, left), revealing a higher intensity of S100β immunoreactivity in KOLF2.1J. N=8 differentiations.
(I) Microglial differentiation of KOLF2.1J and A18944 revealed no significant differences in the expression of the IBA1, TREM2, or PU.1 marker genes. Mann-Whitney test for each marker.
(J) Differentiation of KOLF2.1J and SFC065 towards ventral midbrain dopaminergic neurons showed similar percentages of cells expressing the marker genes EN1 (green) and FOXA2 (red). Mann-Whitney test for EN1 expression.
Specifically, we did not observe significant differences in the potential of KOLF2.1J and a comparison line to differentiate into all three germ layers as determined by quantifying the percentage of cells immunopositive for the endoderm marker SOX17 (unpaired t-test, t3=1.25, p=0.30), the mesoderm marker brachyury (unpaired t-test; t2=0.13, p=0.91), or the ectoderm marker Nestin (unpaired t-test, t3=2.39, p=0.10; Figure 6A). Upon differentiation to glutamatergic cortical neurons through over-expression of NGN2 (Figure 6B), we did not observe significant differences between KOLF2.1J and three comparison lines in the expression of cortical markers BRN2 (Shapiro-Wilk normality test, p<0.05; Kruskal-Wallis test, H3=1.24, p=0.74) or TUJ1 (Shapiro-Wilk normality test, p<0.05; Kruskal-Wallis test, H3=6.48, p=0.09). To test the functionality of these NGN2-induced cells by patch-clamp electrophysiology, we grew them on glial islands to encourage them to make synaptic connections with themselves46–48 and recorded spontaneous miniature excitatory postsynaptic currents (mEPSCs) in the absence of stimulation (Figure 6C). We did not observe significant differences in their mEPSC frequency (unpaired t-test, t4=0.23, p=0.83) or amplitude (unpaired t-test, t4=0.40, p=0.71; data not shown). After inducing action potentials to record evoked excitatory postsynaptic currents (eEPSCs), we found that the KOLF2.1J-derived neurons had lower absolute amplitudes relative to the comparison line (unpaired t-test, t4=3.24, p<0.05) although there was no difference in the paired-pulse ratio (unpaired t-test, t4= 0.85, p=0.44, Figure S6E), suggesting that these differences cannot be attributed to a change in synaptic release probability.
Next, we generated cortical forebrain neurons using a modified dual SMAD protocol and found that KOLF2.1J produced a slightly greater percentage of cells expressing the neuronal markers TUJ1 (unpaired t-test, t4=6.08, p<0.01), MAP2 (unpaired t-test, t4=7.80, p<0.01), and the neuronal subtype marker CTIP2 (unpaired t-test; t4=3.25, p<0.05, Figure 6D) compared to the A18944 comparison line. These differences were not observed in other groups using a slightly different protocol and examining the intensity of TUJ1 (unpaired t-test; t7=0.37, p=0.72) and CTIP2 (unpaired t-test; t7=1.54, p=0.17, Figure 6E), or the percentage of cells expressing CTIP2 (unpaired t-test, t4=0.65, p=0.55), BRN2 (unpaired t-test, t4=1.21, p=0.29), or TBR1 expression (unpaired t-test, t4=0.52, p=0.63; Figure 6F). Upon differentiation to motor neurons, we found that KOLF2.1J generated a greater percentage of cells expressing Islet 1 relative to a comparison line (unpaired t-test, t4=3.99, p<0.05, Figure 6G). Upon astrocyte differentiation, KOLF2.1J-derived cells also had greater normalized immunoreactivity for S100β (unpaired t-test, t14=2.51, p<0.05, Figure 6H). KOLF2.1J and a comparison line were similarly efficient at producing cells expressing IBA1 (identical values, t-test was not performed), TREM2 (Shapiro-Wilk normality test, p<0.001; Mann-Whitney test, U=12, p>0.99), or PU.1 (Shapiro-Wilk normality test, p<0.001; Mann-Whitney test, U=6.50, p=0.29) following differentiation into microglia (Figure 6I), and there were no differences in total cell numbers (unpaired t-test, t4=1.50, p=0.21; data not shown). Finally, when differentiated into dopaminergic neurons, KOLF2.1J and a comparison line had similar expression levels of FOXA2 (unpaired t-test, t4=1.01, p=0.37), LMX1A (unpaired t-test, t4=1.91, p=0.13), and EN1 (Shapiro-Wilk normality test, p<0.05; Mann-Whitney test, U=3, p=0.70) expression (Figure 6J). Together, these data show that KOLF2.1J can be robustly and reproducibly differentiated into diverse functional central nervous system cell types.
Having established its robust performance, we coordinated the distribution of KOLF2.1J and its gene-edited derivatives from The Jackson Laboratories via a public-facing website (https://www.jax.org/jax-mice-and-services/ipsc). Since we generated master banks of these cells prior to characterization in this study, users can be confident that distributed cell lines will have similar genetic and phenotypic properties. In addition to the cell line being readily obtainable, KOLF2.1J can be broadly used by academic groups since it was derived from material obtained under broad consent, and the accompanying material transfer agreement (MTA) is not burdensome. Our vision is that the deep genotypic and phenotypic characterization of this cell line, its proven performance in many laboratories, and its relative ease of distribution will lead to its widespread adoption by groups seeking to work with a trusted iPSC line to further the larger aim of improving reproducibility and collaboration in the field.
Discussion
Groups working with model organisms often found that results obtained on one genetic background did not replicate on another, and that the advantages of working on a common genetic background outweigh the inherent limitations of a particular strain. For example, in spite of its idiosyncrasies, the inbred C57Bl/6J sub-strain has become the mouse model of choice in many laboratories around the world and is distributed by organizations that perform extensive quality control to prevent genetic drift. In comparison, human iPSCs were discovered recently49 and thousands of iPSC lines have been generated and used to model disease,50 provide HLA-matched donors for cell transplantation,51 and probe the functional effects of common genetic variants on gene expression.52,53 However, the use of iPSC lines has not yet been accompanied by the widespread adoption of a common reference line, likely due to a lack of knowledge about the lines that would enable their rational selection. While some studies have performed genetic analysis of large-scale collections of hESC54 and hiPSC lines,55 there are few studies that combine deep genetic and phenotypic characterization to support rational cell line selection. To address this issue, we sub-cloned cell lines to ensure they represented homogenous cell populations, and then expanded and banked them prior to deep characterization to ensure their genomic and phenotypic properties upon distribution would be similar to those reported in here.
We believe that KOLF2.1J is an excellent choice to become a commonly used iPSC line for several reasons. First, the parental KOLF2-C1 line was reprogrammed using non-integrating methods under feeder-free conditions in chemically defined media and substrates, and its provenance and ethical derivation are well-documented.55 Second, both the parental line28,29,56 and KOLF2.1J retain genomic integrity during multiple rounds of efficient CRISPR/Cas9-based gene editing.28 Third, the characterization of both the KOLF2-C1 parental line16 and the current study indicates that KOLF2.1J is free of genetic variants predicted to perturb cellular phenotypes in cells of the neural lineage (Table S2C). Fourth, KOLF2.1J performed well across all tested assays we used. Fifth, to complement the international collaborative effort that went into the initial selection of KOLF2.1J, we used a “team science” approach to confirm its strong performance in head-to-head competitions with iPSC lines established in nine other research groups (Figure 6). Finally, we established a pipeline to distribute KOLF2.1J and its derivatives (https://www.jax.org/jax-mice-and-services/ipsc) to lower the regulatory and logistical hurdles that can frustrate the sharing of other cell lines.
Despite its good overall performance relative to other cell lines, we make no claims that KOLF2.1J is an ideal line for all purposes, just as no given individual (or strain of model organism) is free of defects. Each individual carries multiple loss-of-function mutations23 and the fibroblasts from which KOLF2-C1 was derived had also acquired somatic mutations in genes including in ARID2, which was then corrected to produce KOLF2.1J. While the other variants we identified are of unclear potential significance, we anticipate that some groups may wish to introduce additional gene corrections to further improve the utility of KOLF2.1J. While we hope that many groups will see the value of a common reference line, which in this case is genetically male and of European ancestry, we simultaneously advocate for the establishment of other reference lines that are genetically female and/or derived from individuals of more diverse genetic ancestry. One such line might be the WTC11 due to its East Asian genetic background, established performance in gene editing10 and CRISPR screens,57,58 and its presence of a potentially neuroprotective variant (rs1990621) in TMEM106B59 that could be relevant to groups studying genetic modifiers of cellular vulnerability. Indeed, we hope that the workflow described in this study can serve as a blueprint to enable other groups to identify and promote additional reference iPSC lines. To facilitate such efforts, we have made the code and sequencing data from this study freely available at https://github.com/NIH-CARD/INDI-README (doi: 10.5281/zenodo.7086734) and the Alzheimer’s Disease Workbench (https://fair.addi.ad-datainitiative.org/#/data/datasets/a_reference_induced_pluripotent_stem_cell_line_for_large_scale_collaborative_studies), respectively.
Limitations of study
While we provided a thorough characterization of candidate iPSC lines in this study, it was not comprehensive. We examined eight hiPSC sub-lines and it is possible that other lines might be more suitable for other purposes. We did not assess structural variants smaller than the detection limit of G-band karyotyping, directional genomic hybridization, and DNA microarray analysis (approximately 5 Mbp) or larger than approximately 50 bp as assessed by short-read whole genome sequencing. For KOLF2.1J, we have not found recurrent abnormalities that support cell survival such as chr20 duplication,60 but encourage users to routinely survey lines after additional editing and passages in culture. The p53 reporter assay indicated that this pathway was robustly inducible in all tested cell sub-lines, suggesting that any advantages in growth rate are not due to acquisition of oncogenic potential, but we cannot formally exclude this possibility. Since our primary motivation for selecting a well-performing iPSC line was to generate transformative foundational data and resources for ADRD through the iNDI initiative, our differentiation analysis was biased toward the neural lineage.
STAR Methods
RESOURCE AVAILABILITY
Lead contact
Further information and requests for resources and reagents should be directed to and will be fulfilled by the lead contact, Florian T. Merkle (fm436@medschl.cam.ac.uk).
Materials availability
Cell lines and sub-lines used in this study are available upon request pending approval from the original suppliers of these lines.
KOLF2.1J and its derivatives are available from The Jackson Laboratories at https://www.jax.org/jax-mice-and-services/ipsc.
Plasmids generated in this study have been deposited to Addgene and are listed in the Key Resources Table.
| REAGENT or RESOURCE | SOURCE | IDENTIFIER |
|---|---|---|
| Antibodies | ||
| TRA-1-60 monoclonal antibody, DyLight 488 conjugate | Life Technology | MA1-023-D488X; RRID: AB_2536700 |
| Mouse IgM Isotype Control, DyLight 488 conjugate | Life Technology | MA1-194-D488; RRID: AB_2536969 |
| CABS352A4 Milli-Mark Anti-Nanog-Alexa Fluor 488 Antibody | EMD Millipore | FCAB352A4; RRID: AB_10807973 |
| Rabbit IgG isotype control, AlexaFluor 488 conjugate | Cell Signaling | 4340S; RRID:AB_2612400 |
| Mouse anti-Nestin | Abcam | ab18102; RRID:AB_444246 |
| Goat anti-brachyury | R&D Systems | AF2085; RRID:AB_2200235 |
| Mouse anti-SOX17 | Abcam | ab84990; RRID:AB_1861437 |
| Goat anti-FOXA2 | R&D Systems | AF2400; RRID:AB_2294104 |
| Rabbit anti-Lmx1 | Merck Millipore | AB10533; RRID:AB_10805970 |
| Rabbit anti-Brn2 | Cell Signaling | 12137S; RRID:AB_2797827 |
| Chicken anti-Tuj1 | Aves | TUJ-0020; RRID:AB_2315518 |
| Mouse anti-MAP2 | EMD Millipore | MAB3418; RRID:AB_11212326 |
| Sheep anti-LAMP1 AlexaFluor 488-conjugated | R&D Systems | IC7985G |
| donkey anti-goat, Alexa Fluor 561 | Thermo Fisher Scientific | A-21432; RRID:AB_2535853 |
| donkey anti-goat, Alexa Fluor 647 | Thermo Fisher Scientific | A32849; RRID:AB_2762840 |
| Rabbit anti-Tuj1 | Covance | MRB-435P; RRID:AB_663339 |
| Chicken anti-MAP2 | Abcam | ab92434; RRID:AB_2138147 |
| Rat anti-Ctip2 | Abcam | ab18465; RRID:AB_2064130 |
| Rabbit anti-PU.1 | Cell Signaling | 2258S; RRID:AB_2186909 |
| Goat anti-TREM2 | Bio-Techne | AF1828; RRID:AB_2208689 |
| Rabbit anti-Iba1 | Invitrogen | PA5-27436; RRID:AB_2544912 |
| Mouse anti-Tuj1 | Promega | G7121; RRID:AB_430874 |
| Rabbit anti-Nanog | Abcam | ab21624; RRID:AB_446437 |
| Rabbit anti-Sox2 | Abcam | ab137385; RRID:AB_2814892 |
| Rabbit anti-Oct4 | Abcam | ab181557; RRID:AB_2687916 |
| Mouse anti-SSEA4 | Thermo Fisher | MC813-70; RRID:AB_1502065 |
| Rabbit anti-Nanog | Cell Signaling Technology | 4903T; RRID:AB_10559205 |
| Mouse anti-Pax3 | Developmental studies Hybridoma Bank | PAX3; RRID: AB_528426 |
| rabbit anti-MyoD | Proteintech | 18943-1-AP; RRID:AB_10603467 |
| Mouse anti-myogenin | Developmental studies Hybridoma Bank | PCRP-MYOG-1C5; RRID:AB_2722260 |
| Rabbit anti-MAP2 | Abcam | ab32454; RRID:AB_776174 |
| Rabbit anti-NeuN | Cell Signaling | 24307; RRID:AB_2651140 |
| Rabbit anti-beta-Tubulin III | Abcam | ab18207; RRID:AB_444319 |
| Rabbit anti-PSD95 | Abcam | ab18258; RRID:AB_444362 |
| Mouse anti-vGLUT1 | Sigma | MAB5502; RRID:AB_262185 |
| Rabbit anti-TBR1 | Abcam | ab31940; RRID:AB_2200219 |
| Goat anti-Brn2 | Santa Cruz | sc-6029; RRID:AB_2167385 |
| Rabbit anti-beta-Tubulin III | Sigma Aldrich | T2200; RRID:AB_262133 |
| Mouse anti-HB9 | DSHB | 81.5c10; RRID:AB_2145209 |
| Mouse anti-SMI32 | Biolegend | 801702, RRID: AB_2715852 |
| Mouse anti-Islet 1/2 | DSHB | 39.4D5; RRID:AB_2314683 |
| Rabbit anti-NF-H | Millipore | ab1989; RRID:AB_11212727 |
| Mouse anti-neurofilament H | Biolegend | 801702; RRID:AB_2715852 |
| Rabbit anti-Iba1 | Wako Chemicals | 019-19741, RRID: AB_839504 |
| Mouse anti-CD133/1 | Miltenyi Biotec | 130-113-108; RRID:AB_2725937 |
| PerCP-Cy5.5 mouse anti-CD27 | BD Pharmingen | 560834; RRID:AB_10561839 |
| goat anti-Oct3/4 | Santa Cruz | SC-8628; RRID:AB_653551 |
| Mouse anti-Ki67 | BD pharmingen | 550609; RRID:AB_393778 |
| Mouse anti-Satb2 | Abcam | AB51502; RRID:AB_882455 |
| Mouse anti-Brn2 | Santa Cruz | SC-393324; RRID:AB_2737347 |
| Mouse anti-S100β | Sigma Aldrich | S2532; RRID:AB_477499 |
| Rabbit anti-NFIA | Sigma Aldrich | HPA008884; RRID:AB_1854421 |
| Goat anti-Iba1 | Novus Biologicals | NB100-1028; RRID:AB_521594 |
| Mouse anti-STEM101 | Takara | Y40400; RRID:AB_2895096 |
| Mouse anti-EN1 | DSHB | 4G11; RRID:AB_528219 |
| Rabbit anti-LMX1A/B | Millipore | AB10533; RRID:AB_10013681 |
| Mouse anti-FOXA2 | Santa Cruz | sc-101060; RRID:AB_1124660 |
| Goat anti-FOXA2 | R&D Systems | AF2400; RRID:AB_2294104 |
| Mouse anti-Nurr1 | Perseus Proteomics | PP-N1404-0C |
| Rabbit anti-TH | EMD Millipore | AB152; RRID:AB_390204 |
| Mouse anti-TH | EMD Millipore | MAB318; RRID:AB_2313764 |
| Rabbit anti-Nurr1 | Millipore Sigma | N6413; RRID:AB_1841046 |
| Mouse anti-GFAP | EMD Millipore | IF03L; RRID:AB_2294571 |
| Chemicals, peptides, and recombinant proteins | ||
| Accutase | Stemcell Technologies | 7920 |
| Knockout serum replacement | Thermo Fisher Scientific | 10828028 |
| ReLeSR | STEMCELL Technologies | 100-0484 |
| P3 Primary Cell 4D-Nucleofector X Kit L | Lonza | V4XP-3024 |
| StemFlex medium | Thermo Fisher Scientific | A3349401 |
| RevitaCell™ Supplement | Thermo Fisher Scientific | A2644501 |
| Alt-R® S.p. HiFi Cas9 Nuclease V3 | Integrated DNA Technologies | 1081061 |
| Alt-R™ HDR Donor Oligo | Integrated DNA Technologies | N/A |
| Alt-R™ HDR Enhancer V2 | Integrated DNA Technologies | 10007921 |
| LongAmp Taq DNA polymerase | New England Biolabs | M0323S |
| KaryoMAX Colcemid Solution | Thermo Fisher Scientific | 15212012 |
| DPBS | Thermo Fisher Scientific | 14190-144 |
| Hoechst 33258 | Millipore Sigma | 94403 |
| Exonuclease III | New England Biolabs | M0206L |
| Essential 8 medium | Thermo Fisher Scientific | A1517001 |
| Y-27632 | Selleck Chem | S1049 |
| Doxorubicin | Bio-Techne | 2252 |
| Puromycin | Millipore Sigma | P8833 |
| 4’,6-diamidino-2-phenylindole | Thermo Fisher Scientific | D1306 |
| Lipofectamine Stem | Invitrogen | STEM00015 |
| Accutase | Thermo Fisher Scientific | A1110501 |
| Knockout DMEM/F12 | Thermo Fisher Scientific | 12660012 |
| N2 supplement | Thermo Fisher Scientific | 17502048 |
| Non-essential amino acids | Thermo Fisher Scientific | 11140035 |
| Glutamax | Thermo Fisher Scientific | 31331093 |
| Doxycycline | Sigma-Aldrich | D9891 |
| Brainphys media | Stem Cell Technologies | 5790 |
| B27 supplement | Thermo Fisher Scientific | 17504044 |
| BDNF | PeproTech | 450-02 |
| NT3 | PeproTech | 450-03 |
| Laminin | R&D Systems | 3446-005-01 |
| Compound E | Stem Cell Technologies | 73952 |
| poly-L-ornithine (PLO) | Sigma-Aldrich | A-004-M |
| Culture One Supplement | Thermo Fisher Scientific | A3320201 |
| BrdU | Sigma-Aldrich | B9285 |
| GDNF | PeproTech | 450-10 |
| mTeSR1 | STEMCELL Technologies | 85850 |
| Y-27632 | Tocris Bioscience | 1254 |
| Neurobasal-A | Thermo Fisher Scientific | 1088802 |
| DMEM/F12 with GlutaMAX | Thermo Fisher Scientific | 10565-018 |
| Sodium bicarbonate | Thermo Fisher Scientific | 25080-094 |
| Ascorbic acid | Sigma-Adrich | A4403 |
| pencillin-streptomycin | Thermo Fisher Scientific | 15140122 |
| SAG | Thermo Fisher Scientific | 56-666-01MG |
| Purmorphamine | Calbiochem | 540220 |
| TrypLE | Thermo Fisher Scientific | 12604013 |
| LDN-193189 | Stemgent | 04-1974 |
| DNase I | Worthington | LK003170 |
| SB431542 | Sigma-Aldrich | S4317 |
| XAV939 | Stemgent | 04-1946 |
| Hoechst 33342 | Thermo Fisher Scientific | H3570 |
| NeuroFluo | STEMCELL Tech | 1801 |
| NucBlue | Invitrogen | R37605 |
| Critical commercial assays | ||
| DNeasy Blood and Tissue kit | Qiagen | 69581 |
| Synthetic sgRNA CRISPR Kit | Synthego | custom |
| Chromium Single Cell 3’ Reagent kit V3.1 | 10× Genomics | PN-1000128 |
| Amaxa 4D nucleofector | Lonza | CA137 |
| Human Stem Cell Nucleofector Kit 1 | Lonza | VPH-5012 |
| STEMdiff Trilineage Differentiation kit | Stemcell Technologies | 5230 |
| Primary Cell 96-well nucleofector kit | Amaxa | V4SP-3096 |
| SiR-tubulin kit | Cytoskeleton, Inc. | CY-SC002 |
| Deposited data | ||
| Whole genome sequencing data (fastq & vcf files) | Alzheimer’s Disease Workbench | DOI: https://doi.org/10.34688/KOLF2.1J.2021.12.14 |
| single-cell RNA sequencing (fastq files) | Alzheimer’s Disease Workbench | DOI: https://doi.org/10.34688/KOLF2.1J.2021.12.14 |
| Cell Culture Maintenance protocol | Protocols.IO | DOI: 10.17504/protocols.io.n2bvjxm2nlk5/v1 |
| Piggybac-TO-NGN2 transfection protocol | Protocols.IO | DOI: 10.17504/protocols.io.q26g744b1gwz/v1 |
| Experimental models: Cell lines | ||
| KOLF2-C1 (TP53 deficient) | The Jackson Laboratory | custom |
| HG-002 | National Institute of Standards and Technology | RM8391 |
| KOLF2.1J | The Jackson Laboratory | hPSCreg: WTSli018-B-12 |
| KUCG3 | Wellcome Trust Institute | custom |
| NCRM1 | NINDS Human Cell and Data Repository | RRID: CVCL_1E71 |
| NCRM5 | NINDS Human Cell and Data Repository | RRID: CVCL_1E75 |
| PGP1 | Synthego | RRID: CVCL_F182 |
| LNGPI1 | NIH | custom |
| NN0003932 | NINDS Human Cell and Data Repository | RRID: CVCL_SA24 |
| NN0004297 | NINDS Human Cell and Data Repository | RRID: CVCL_SA24 |
| APOE3 | ALSTEM | iPS26 |
| 11a | Harvard University | RRID: CVCL_8987 |
| ND50003 | NINDS Human Cell and Data Repository | RRID: CVCL_EZ99 |
| ND50004 | NINDS Human Cell and Data Repository | RRID: CVCL_FA00 |
| 0524-1 | Stanford University School of Medicine | RRID: CVCL_B5FW |
| Bioni010-C-13 | European Bank for Induced Pluripotent Stem Cells | RRID: CVCL_RF90 |
| A18944 | Thermo Fisher | A18944 |
| RBi001 | Sigma Aldrich | RRID: CVCL_9S35 |
| Ctrl1 | Wray lab | Sposito et al. (2015) |
| H9 | WiCell | RRID: CVCL_1240 |
| CVB | Coriell Institute | RRID: CVCL_1N86 |
| WTC11 | Coriell Institute | RRID: CVCL_Y803 |
| SFC065 | European Bank for Induced Pluripotent Stem Cells | RRID: CVCL_RC67 |
| Oligonucleotides | ||
| sgRNA to ARID2 (AAAAGATCACTTGCTAATGCCGG) | Synthego | Synthetic sgRNA Kit, modified |
| wildtype ARID2 sequence (ACGTATGCACTCTCCTATCAAATGAAAGCAAGCACGTCATGCAACTTGAAAAAGATCCTAAAATCATCACTTTACTACTTGCTAATGCCGGGGTGTTTGACGACAGTAAGTTTTAAGCTG | IDT | Alt-R HDR Donor Oligo |
| Forward PCR primer for ARID2 (TTGGCAATGATGGCCAAATGGTATG) | IDT | custom |
| Reverse PCR primer for ARID2 (AAAACCCACAACTAGCAAA) | IDT | custom |
| Forward Sanger sequencing primer for ARID2 (GTCAAAGTTATGGGCTGTCC) | IDT | custom |
| Reverse Sanger primer for ARID2 (GTTGACAAACAAAAAGTACTTTCTCC) | IDT | custom |
| Cas9 sgRNA to TIMP3 (CCAGGAGCGCTTACCGATGT/CGG) | Synthego | Synthetic sgRNA Kit, modified |
| Plasmids | ||
| PB-TO-hNGN2 | Addgene | 172115 |
| PB-TO-hNIL | Addgene | 172113 |
| pEIF1a::Transposase | Addgene | 172116 |
| PG13-mCherry | Addgene | 16442 |
| pCMV-hyPBase | Wellcome Trust Sanger Institute | custom |
| PB-PG13-mCherry-EF1a-PuroR-EGFP | custom | custom |
| 4xmito-mEmerald | Addgene | 54160 |
| pLenti-PGK-LifeAct-GFP-W | Addgene | 51010 |
| pEGFP vector | Clontech | 632370 |
| pEIF1a::Cox8(1–26)::eGFP | Twist Technologies | custom |
| pTetO-Ngn2-Puro | Addgene | 52047 |
| FUΔGW-rtTa | Addgene | 19780 |
| MK-EF1a-mScarlet | custom | Tian et al. 2019 |
| pUCM-CLYBL-hNIL | Addgene | 105841 |
| pZT-C13-R1 | Addgene | 62197 |
| pZT-C13-L1 | Addgene | 62196 |
| Software and algorithms | ||
| Code for scRNA-seq and array-based genotyping analyses | GitHub | DOI: 10.5281/zenodo.7086734 |
| HaplotypeCaller, PairedSingleSampleWf, and JointGenotypingWf workflows | Github | https://github.com/gatk-workflows/broad-prod-wgs-germline-snps-indels |
| ANNOVAR | Wang et al. 2010 | |
| PLINK (v1.9) | Kunkle et al. 2019 | |
| Manta algorithm (Version 1.6.0) | Github | https://github.com/Illumina/manta |
| Structural variant tool kit | Github | https://github.com/broadinstitute/gatk-sv |
| 10× Genomics LongRanger | 10X Genomics | https://support.10xgenomics.com/genome-exome/software/pipelines/latest/using/wgs |
| SeqManPro | DNAStar | https://www.dnastar.com/software/lasergene/molecular-biology/ |
| Synthego ICE | Synthego | https://ice.synthego.com/ |
| GenomeStudio Software | Illumina | https://www.illumina.com/techniques/microarrays/array-data-analysis-experimental-design/genomestudio.html |
| GWASTools package | Gogarten et al. 2012 | |
| samtools (v1.14) | Danecek et al. 2021 | |
| IGV 2.11.9 | Robinson et al. 2017 | |
| DropletUtils R package | Lun et al. 2019 | |
| logNormCounts function | Lun, McCarthy, and Marioni 2016 | |
| CellCycleScoring function from Seurat R package | Hao et al. 2021 | |
| scds R package | Bais and Kostka 2020 | |
| Batchelor R package | Haghverdi et al. 2018 | |
| Uniform Manifold Approximation and Projection (UMAP) two-dimensional embedding | McInnes et al. 2018 | |
| Louvain method (cluster_louvain function) | Csárdi and Nepusz 2006 | |
| 10× Genomics VarTrix and Vireo tools | Huang, McCarthy, and Stegle 2019 | |
Data and code availability
Whole genome sequencing and single-cell RNA-sequencing data have been deposited to the Alzheimer’s Disease Workbench and are publicly available as of the date of publication at https://doi.org/10.34688/KOLF2.1J.2021.12.14. The DOI is also listed in the Key Resource Table
All original code has been deposited on Github and is publicly available as of the date of publication. DOIs are also listed in the Key Resources Table.
Cell culture maintenance and Piggybac-TO-NGN2 transfection protocols are available on Protocols.IO at https://dx.doi.org/10.17504/protocols.io.n2bvjxm2nlk5/v1 and https://dx.doi.org/10.17504/protocols.io.q26g744b1gwz/v1, respectively. DOIs are also listed in the Key Resources Table.
EXPERIMENTAL MODEL AND SUBJECT DETAILS
Cell Lines
Eight candidate human iPSC lines derived from individuals of European genetic ancestry and XY sex chromosome status were put through a uniform workflow for sub-line generation, expansion, and archiving as described in Table S1. Other cell lines used for comparison are listed in the Key Resources Table and described in the Method Details section below. All human iPSCs and ESCs used in this study were previously generated and reported to be derived from material obtained under informed consent and appropriate ethical approvals. Gene editing and other work with these lines as part of this study was performed under approved protocols from our respective institutions.
METHOD DETAILS
Sub-cloning
All iPS cell lines were maintained feeder-free in complete StemFlex media (Thermo Fisher) without the addition of antibiotics. StemFlex was replaced every other day and cells were incubated at 37°C/5%CO2. Upon addition of the provided 10x StemFlex supplement, complete StemFlex media was stored at 4°C for less than one month, and only the volume needed for a given experiment was removed and pre-warmed to room temperature before use. Following thawing and single-cell plating, RevitaCell (Thermo Fisher) at a 1x concentration was included in the media for one day to improve survival of iPSCs in a single-cell state.
To generate clonal sub-lines, iPSC lines were first thawed and plated in Matrigel (Corning)-coated 24-well plates (for low cell number vials) or Synthemax (Corning)-coated 6-well plates (for high cell number vials). Cells were further expanded into Synthemax-coated 6-well plates. The cells were allowed to replicate over several days until they reached near confluency. Spent media was collected and tested by qPCR for Mycoplasma by the UCONN Stem Cell Core. Cells were detached as a single-cell suspension by gentle scraping after a 10 minute incubation at 37°C in Accutase (Stemcell Technologies). To generate well separated iPSC colonies, 1000 cells were plated onto a Synthemax-coated 10cm dish and incubated for 9–10 days. This resulted in a variable total number of iPSC colonies per cell line (Table S1A). For each cell line, 8 colonies were manually picked into wells of a Matrigel-coated 24-well plate and grown to near confluence. During this incubation, cell morphology was observed daily under the microscope. Of these 8 clones, 3 clones per cell line with minimal or no observable cell differentiation were further expanded into Synthemax-coated wells of a 6-well plate. This provided sufficient cells to both cryopreserve each sub-line and prepare cells for G-band karyotyping. After a 7 minute 37°C Accutase treatment, cells were gently scraped in Knockout serum replacement (Thermo Fisher) containing 10% DMSO, aliquoted into cryovials, and stored at −80°C for one day before being moved to vapor-phase liquid nitrogen storage. The remaining cells were washed in DPBS−/− and cell pellets were stored at −80°C.
Expansion of selected sub-lines
Each of the 8 selected iPS cell lines were expanded into 2 × 96-well Matrix plates (Thermo Fisher). Briefly, cells were thawed into a single well each of a Synthemax-coated 6-well plate. Once confluent, the cells were clump passaged using ReLeSR into a Synthemax-coated 10 cm plate. These were subsequently expanded by clump passaging into 6 × 10 cm plates. Cells were treated with Accutase, gently scraped in cold Knockout serum replacement with 10% DMSO, pooled, and distributed to 192 individual minivials of 2 open-capped 96-well Matrix plates. Minivials were topped with 100 μl of sterile paraffin oil (Sigma-Aldrich), frozen at −80°C for one day, and stored in vapor-phase liquid nitrogen.
The expanded Matrix plate stocks for all 8 lines were tested as follows. One minivial was removed from liquid nitrogen and the cells were thawed and transferred, leaving the oil behind, into a well of a 96-well V-bottom plate. The V-bottom plate was spun at 300×g for 5 min, and the supernatant was removed. The cell pellet was gently resuspended in complete StemFlex with RevitaCell and incubated in a single well of a Synthemax-coated 6-well plate. After incubation to near confluency, the cells were clump passaged at a 1:10 dilution with ReLeSR into multiple wells of a Synthemax-coated 6-well plate for mock editing, nucleic acid preparation, Mycoplasma testing, and Directional Genomic Hybridization, as described below.
Genetic correction of the KOLF2-C1 cell line
CRISPR-Cas9 editing of KOLF2-C1 hiPSCs was performed to correct a 19bp pathogenic deletion in one copy of the ARID2 gene.16 Cells were grown in a 5% CO2, 37C incubator in StemFlex media (Thermo Fisher) on Synthemax-treated wells (Synthemax II; Corning) and dissociated to single cells with Accutase (Stemcell Technologies). In a volume of 0.1 mL P3 Primary Cell P3 buffer (Lonza), 8 × 10⁵ KOLF2-C1 cells were nucleofected using the Lonza Amaxa 4D nucleofector (program CA137) with 20 mg Cas9 protein (HiFi v3; IDT), 16 mg single guide RNA targeted to the deleted ARID2 allele (5’-AAAAGATCACTTGCTAATGCCGG…−3’; chemically-modified; Synthego), and 200 pmol of a 120-mer oligonucleotide repair template (desalted Ultramer; IDT) corresponding to wild-type sequence (5’-ACGTATGCACTCTCCTATCAAATGAAAGCAAGCACGTCATGCAACTTGAAAAAGATCCTAAAATCATCACTTTACTACTTGCTAATGCCGGGGTGTTTGACGACAGTAAGTTTTAAGCTG-3’; deleted sequence underlined). Cas9 ribonucleoprotein complexes were assembled in vitro for 30 min prior to nucleofection. The nucleofected cells were seeded onto one well of a Synthemax-treated 6-well plate in StemFlex media containing 1X RevitaCell (Thermo Fisher) and 30 mM Alt-R HDR Enhancer (IDT) and cultured at 32℃ (cold shock) for three days. After 24 hrs, the media was changed to remove HDR Enhancer and RevitaCell. At 72 hrs, the media was replenished and the cells were cultured to confluency at 37℃. Following the cloning of single-cell derived colonies, confluent wells of replicate 96-well plates were archived and lysed for genotyping. The target region was amplified by PCR (950 bp amplicon; forward primer, 5’-TTGGCAATGATGGCCAAATGGTATG-3’; reverse primer, 5’-AAAACCCACAACTAGCAAACCCTAC-3’) using LongAmp polymerase (NEB) and subjected to Sanger sequencing (forward primer, 5’-GTCAAAGTTATGGGCTGTCC-3’; reverse primer, 5’-GTTGACAAACAAAAAGTACTTTCTCC-3’). From a screen of 96 clones, four ARID2-corrected clones were identified (A2, A11, E3, H5) and expanded for karyotyping. All clones showed a normal karyotype, and clone A2 was selected for further characterization (designated KOLF2.1J).
G-band karyotyping
To prepare cells for G-band karyotyping, sub-lines were clump passaged using ReLeSR (Stemcell Technologies) 1:2 into wells of a 6-well plate and incubated overnight. Sub-lines from parental cells KOLF2.1J, NCRM1, NCRM5, and PGP1 were prepared for karyotyping by the Cytogenetics Laboratory at The Jackson Laboratory for Genomic Medicine. Specific sub-lines KUCG3-C1, LNGPI1-C1, NN0003932-C3, and NN0004297-C1 were processed by the Cellular Engineering laboratory at The Jackson Laboratory for Genomic Medicine according to the fixation protocol recommended by KromaTiD and shipped to KromaTiD for karyotyping.
Briefly, colcemid (Thermo) was added to a final concentration of 0.1μg/ml and cells were incubated for 4 hrs. Cells were then treated with Accutase for 10 min, detached by gentle scraping in DPBS−/−, and collected in a 15ml polystyrene conical tube. The single-cell suspension was spun for 10 min at 1000rpm at RT. The supernatant was mostly removed, leaving 1ml remaining on the cell pellet. The cell pellet was resuspended by vigorous flicking and 6ml of RT 75mM KCl was added to induce osmotic swelling. The cell mixture was incubated at RT and inverted slowly every 5 min. After 30 min, 1.5 ml of freshly made fixative (3:1 methanol:acetic acid) was added, mixed by slow inversion, and the swollen cells were spun at 1000rpm for 10 min at RT. The supernatant was mostly removed, leaving 1 ml remaining on the cell pellet. The cell pellet was resuspended by vigorous flicking and 5ml of fixative was added in a dropwise fashion while the cells were gently vortexed. Cells were incubated in fixative for 20 min at RT, then spun down at 1000rpm for 10 min at RT, before transfer to a cryovial for shipment. For samples analyzed by the JAX Cytogenetics Laboratory, 15 cells (metaphases) were counted and sexed, and 5 cells were analyzed for each sample. For samples analyzed by KromaTiD, 20 cells (metaphases) were analyzed for each sample.
Directional Genomic Hybridization (dGH™)
To assess the genomic stability of edited samples, KromaTiD’s directional genomic hybridization (dGH™) was performed using an assay consisting of dGH chromatid paints for human chromosomes 1, 2 and 3 in a single color. For 8 samples of human iPSCs, live, actively dividing cultures were prepared for dGH by adding 5.0 mM 5-bromo-deoxyuridine (BrdU) and 1.0 mM 5-bromo-deoxycytidine (BrdC) to the cell culture media for the duration of one division cycle, as described elsewhere.63 At 4 h prior to harvest, colcemid was added to a final concentration of 0.1 μg/ml to each sample. The samples were harvested and fixed in 3:1 methanol/acetic acid, and metaphase spreads were prepared for each sample using standard cytogenetic techniques.64 To remove the replicated strand in each metaphase chromosome, prepared slides of metaphase spreads singly substituted with BrdU and BrdC were submersed in Hoechst 33258 (Millipore Sigma) for 15 min, selectively photolysed using a SpectroLinker XL 1500 UV Crosslinker equipped with 365nm UV bulbs for 35 min, followed by exonucleolytic degradation of the nicked DNA with Exonuclease III (New England Biolabs) for 35 min. A hybridization mixture consisting of probe and hybridization buffer was applied to the slides, cover-slipped, and sealed with rubber cement. Slides were denatured in situ at 68°C for 3 min, incubated overnight at 37°C, and then washed 5X in 2× SSC at 43°C. Slides were mounted in Vectashield with DAPI, and images of metaphase spreads were acquired on an Applied Spectral Imaging Harmony system using a Zeiss Axio Imager.Z2m microscope equipped with a Basler acA2440-35um camera, and a Lumencor SOLA SE-FISH LED light source, using a 100x objective. A total of 200 metaphase spreads from each sample were scored for genomic structural rearrangements including translocations, inversions, sister chromatid exchanges, insertions, deletions and other complex structural rearrangements involving the painted chromosomes, as well for dicentric or acentric chromosomes present in the metaphase spread. One sample had insufficient material to score 200 spreads. For this sample, 181 spreads were scored. dGH sample preparation was performed on a single cell line to establish the timing for analog addition and harvest, with the belief that all 8 cell lines had similar growth characteristics. However, the cell cycle timing proved to be different enough between the 8 cell lines to affect dGH. This resulted in a percentage of scorable cells that was quite low for some samples, requiring use of many prepared slides to achieve the desired scored sample size. Note that for KUCG3, the entire sample was consumed before 200 scorable cells could be observed, and a total of 181 spreads were scored. The samples ranged from 9 scored metaphases per slide (LNGPI1) to 67 scored metaphases per slide (NCRM1). Chromosomes 1, 2, and 3 combined comprise 23% of the human genome, and results can be used to extrapolate event rates across the whole genome. Results were reported as the rate of total events per sample, with a breakdown of event rates by event type.
Proliferation rates
iPSCs were maintained in Essential 8 medium (Thermo Fisher) on Matrigel (1:100, Corning)-coated plates and passaged at 70–80% confluence with Accutase (Thermo Fisher) to a single-cell suspension. Dissociated iPSCs were plated onto a Matrigel coated 48 well plates at 30,000 cells/well in Essential 8 medium and 10 μM Rock inhibitor Y-27632 (SelleckChem, n=6 wells per line). After 24 hr, the media was changed to Essential 8 medium. Plates were scanned in an Incucyte® S3 Live-Cell Analysis System every 24 h and confluence was analysed with Incucyte software, Basic Analysis. After 48 hr, iPSCs were dissociated with Accutase and total cell numbers were counted (n=4 wells per line).
Flow cytometry analysis of stem cell markers
iPSCs were dissociated into single cells using TrypLE (Thermo Fisher) for 5–10 minutes, pelleted by centrifugation at 200×g for 5 minutes, and then fixed in 500 μL 4% paraformaldehyde for 10–15 minutes at room temperature. After fixation, cell pellets were washed with 1mL PBS, and incubated with 50 μl of permeabilization buffer (PBS plus 2% FBS and 0.2% Tween-20) for 10 minutes. During the permeabilization, 1 μl antibody was diluted in a 5 μl permeabilization buffer and added to 96-well for each staining reaction, then 50 μl permeabilized cells were added to each well and incubated for 1 hour at 4°C with mixing occasionally. After staining, cell pellets were washed and resuspended with 200 μl per-well PBS for flow cytometry analysis. The antibodies and isotype controls used were: TRA-1-60 Monoclonal Antibody (TRA-1-60), DyLight 488 conjugate (Life Technology); Mouse IgM Isotype Control, DyLight 488 conjugate (Life Technology); CABS352A4 Milli-Mark™ Anti-Nanog-Alexa Fluor 488 Antibody, NT (EMD Millipore); Rabbit IgG isotype control, AlexaFluor 488 conjugate (Cell Signaling).
p53 reporter assay
iPSCs were maintained in StemFlex medium (Thermo Fisher) on Synthemax II-SC substrate (Corning). For the plasmid-based assay, at 70% confluence, the culture medium was replaced with fresh medium supplemented with RevitaCell (Thermo Fisher) five hours before nucleofection. Cells were dissociated with pre-warmed Accutase (StemCell Technologies) at 37°C for 7 minutes and 4×10⁵ cells were transferred to a well of a 96-well V-bottom plate (Corning) then centrifuged at 100×g for 3 minutes. Cell pellets were resuspended with 20 μL of P3 Primary Cell Buffer (Lonza) containing 5 μg of the PG13-mCherry reporter plasmid and transferred to a well of a 16-well Nucleocuvette strip, followed by nucleofection with the 4D-Nucleofector Unit (Lonza) using the CA-137 pulse code. After nucleofection, 1.5×10⁵ cells (for the no treatment group) or 2.5×10⁵ cells (for the doxorubicin treatment group) were seeded in the StemFlex medium supplemented with RevitaCell on a well of a 48-well plate coated with Matrigel hESC-Qualified Matrix (Corning). One day after nucleofection, the medium was changed to StemFlex without RevitaCell. Two days after nucleofection, the medium was changed to StemFlex with or without 20 nM doxorubicin (Bio-Techne). Three days after nucleofection, cells were dissociated with Accutase and mCherry expression in the singlet cell population was analyzed using a FACSymphony A5 flow cytometer (BD Biosciences).
For the transposon-based P53 reporter assay, 2×10⁵ cells were nucleofected with the PB-PG13-mCherry-EF1a-PuroR-EGFP and pCMV-hyPBase plasmids (0.75 μg each) with the 4D-Nucleofector Unit using the condition described above, and seeded onto a well of a Synthemax-coated 12-well plate. Transposon-integrated cells were selected by adding 2 μg/mL puromycin (MilliporeSigma) to the StemFlex medium for 3 days or longer. Selected cells were transferred to a Matrigel-coated 24-well plate followed by 50 nM doxorubicin (or vehicle) treatment for 24 hours. Cells were dissociated with Accutase, and mCherry expression in the EGFP positive singlet cell population was analyzed using the BD LSR II flow cytometer (BD Biosciences).
TP53-deficient KOLF2 cells (W Skarnes, unpublished) were used as a negative control. Non-viable cells were excluded by staining with 4’,6-diamidino-2-phenylindole (Thermo Fisher). Flow-cytometric data were analyzed using FlowJo software (BD Biosciences).
DNA and RNA preparation
DNA and RNA extraction was performed by the JAX Genome Technologies service, quantified by TapeStation (Agilent), and assigned a DIN or RIN value. The extracted DNA and RNA from each of the 8 sub-lines was submitted to Psomagen for Illumina short read whole genome sequencing. From an additional well, high molecular weight genomic DNA extraction was performed by the JAX Genome Technologies service, quantified by TapeStation (Agilent), and assigned a DIN value. The DNA from each of the 8 sub-lines was submitted to Psomagen for 10x Genomics long read whole genome sequencing. From an additional well, genomic DNA for each sub-line was also prepared using the DNeasy Blood and Tissue kit (Qiagen) and submitted to the JAX Genome Technologies service for Illumina short read whole genome sequencing.
CRISPR/Cas9 genome editing
Editing was performed on each iPSC sub-line by high-throughput engineering of a missense mutation (S38C) in exon 1 of the TIMP3 gene, using optimized conditions for homology-directed repair (HDR).29 Cas9 sgRNA to TIMP3 (CCAGGAGCGCTTACCGATGT/CGG) was chemically synthesized with 2’-O-methyl and 3’-phosphorothioate end modifications (Synthego CRISPRevolution sgRNA) and resuspended in TE buffer at a concentration of 4 μg/μl. RNP was formed by combining SpCas9 nuclease (HiFi V3, IDT) with sgRNA at a molar ratio of 1:4. A 100-nt single stranded oligo donor (ssODN) containing a G to C SNV was synthesized with HDR-optimized end modifications (Alt-R™ HDR Donor Oligo, IDT) and resuspended in DPBS−/− at a concentration of 200 pmol/μl. For high-throughput introduction of Cas9 RNP and ssODN into human iPS cells, 8 wells were transfected using Amaxa nucleofection with P3 Primary Cell 4D-Nucleofector 16-well Strips (Lonza). Each well contained a single-cell suspension of 1.6 × 10⁵ cells in 20 μl of Primary Cell P3 buffer with supplement (Lonza) containing 2 μg Cas9, 1.6μg sgRNA, and 40 pmol ssODN. Nucleofection was performed using Amaxa program CA-137. Immediately following electroporation, cells were distributed to wells of a Matrigel-coated 24-well plate containing StemFlex, RevitaCell, and 30 μM final Alt-R® HDR enhancer (IDT). Cells were incubated at 32°C for 3 days before transfer to 37°C. At 24h post-nucleofection, and every other day thereafter, the media was replaced with only StemFlex. Upon reaching near confluency, cells were single-cell-plated into Synthemax-coated 10cm dishes as described above. At Day 10, 24 colonies per cell sub-line were manually picked as described29 and incubated in Matrigel-coated 96-well plates for 4–5 days before being frozen down.
Crude cell lysates for each clone were prepared as described30 and used to amplify a 896 bp genomic region containing the CRISPR target site. Sanger sequencing of purified PCR products was carried out by the Genome Technologies service at The Jackson Laboratory in Bar Harbor, Maine. Sequence traces were aligned and analysed using SeqManPro (https://www.dnastar.com/software/lasergene/molecular-biology/) and Synthego ICE (https://ice.synthego.com/).
Two additional wells of each clone were lysed, pooled, and genomic DNA was purified using the 96-well high-throughput DNeasy Blood and Tissue kit (Qiagen). Array-based genotyping was performed on the resulting genomic DNA.
Plasmids
The plasmids PB-TO-hNGN2 (Addgene plasmid #172115), PB-TO-hNIL (NGN2, ISL1, and LHX3, Addgene plasmid #172113), EFa1-Transposase (Addgene plasmid #172116) were used for transcription factor-based differentiation experiments. For the p53 reporter assay performed on all sub-lines, the PG13-mCherry p53 reporter plasmid was generated by replacing the luciferase sequence of PG13-Luc reporter plasmid61 (Addgene), which contains 13 copies of a p53-binding site followed by the polyoma promoter, with the mCherry sequence by the In-Fusion HD Cloning Plus kit (Takara). For the transposon-based p53 reporter assay performed on KOLF2.1J, the pCMV-hyPBase plasmid was obtained from Wellcome Trust Sanger Institute.62 The PB-PG13-mCherry-EF1a-PuroR-EGFP plasmid, generated by inserting the PG13-mCherry sequence into the PB-EF1a-PuroR-EGFP plasmid (H Oguro, unpublished), contains the PiggyBac 3’-inverted terminal repeat (PB 3’ITR), 5’-HS4 chicken β-globin (cHS4) insulator, PG13-mCherry reporter, woodchuck hepatitis virus post-transcriptional regulatory element (WPRE), bovine growth hormone polyadenylation signal (BGHpA), EF1α promoter, puromycin registrant gene, P2A peptide, EGFP, BGHpA, cHS4 insulator, and PB 5’ITR, in this order.
Transcription Factor-NGN2 differentiation into cortical neurons
We expressed human NGN2 under a tetracycline-inducible promoter as previously described70 using a PiggyBac system for delivery. iPSCs were transfected with PB-TO-hNGN2 vector in a 1:2 ratio (transposase:vector) using Lipofectamine Stem (Invitrogen), then selected after 24–48 hrs for 3 to 14 days with 8 μg/mL of puromycin (Sigma-Aldrich).
iPSCs with a stably integrated human NGN2 were single-cell dissociated using Accutase (Thermo Fisher) and plated at a concentration of 1.5×10⁶ per well of a Matrigel-coated (1:100, Corning) 6 well plate for 3 days with neuronal induction media (NIM: Knockout DMEM/F12, 1X N2 Supplement, 1X Non-Essential Amino Acids, 1X Glutamax (all from Thermo Fisher), 10 μM Rock inhibitor Y-27632 (SelleckChem) and 2 μg/mL doxycycline (Sigma-Aldrich)). On day 3, 1.5×10⁶ cells were replated onto a poly-L-ornithine coated (PLO, Sigma-Aldrich) 6-well plate for 14 days using Brainphys (Stem Cell Technologies) 1X B27 Supplement (Thermo Fisher), 10 ng/mL BDNF (PeproTech), 10 ng/mL NT3 (PeproTech), 1 μg/mL Laminin (R&D Systems) and 2 μg/mL doxycycline (Sigma-Aldrich). For neuronal maintenance, half of the media was changed every 2–3 days.
Transcription Factor-based differentiation into hNIL-expressing Lower Motor Neurons
Over-expression of NGN2-ISL1-LHX3 (hNIL)70 was performed as described with a PiggyBac system for delivery. iPSCs were transfected with PB-TO-hNIL vector in a 1:2 ratio (transposase:vector) using Lipofectamine Stem (Invitrogen), then selected after 24–48 hours for 3 to 14 days with 8 μg/mL of puromycin (Sigma-Aldrich). The iPSCs with a stably integrated human NIL under a tetracycline-inducible promoter were exposed to 2 μg/mL doxycycline in neuronal induction medium (NIM). Briefly, on day 0 the iPSCs were single-cell dissociated using Accutase (Thermo Fisher) and plated at a concentration of 1.5×10⁶ per well of a Matrigel-coated (1:100, Corning) 10 cm dish in Essential 8 medium (Thermo Fisher) and 10 μM Rock inhibitor Y-27632 (SelleckChem). On day 1, the media was changed with NIM: DMEM/F12, 1X N2, 1X Non-Essential Amino Acids, 1X Glutamax (all reagents were from Thermo Fisher), containing 10μM Rock inhibitor Y-27632, 2 μg/ml doxycycline (SelleckChem), and 0.2 μM Compound E (Stem Cell Technologies). On day 3, 1×10⁶ cells per were re-plated onto one well of a poly-L-ornithine (PLO, Sigma-Aldrich) and 15 μg/mL Laminin-coated (R&D Systems) 6-well plate in NIM with 10μM Rock inhibitor Y-27632 (SelleckChem), 2 μg/mL doxycycline (Sigma-Aldrich), 0.2 μM Compound E (Stem Cell Technologies), 1 μg/mL Laminin (R&D Systems) and 40 μM BrdU (Sigma-Aldrich). On day 4, the media was changed to NIM with 1X B27 Supplement (Thermo Fisher), 1X Culture One Supplement (Thermo Fisher), 1 μg/mL Laminin (R&D Systems), 20 ng/mL BDNF (PeproTech), 20 ng/mL GDNF (PeproTech) and 10 ng/mL NT3 (PeproTech). On day 7, half of the media was changed. On day 10, half of the media was changed with Neurobasal, 1X B27, 1X N2, 1X Culture One (all from Thermo Fisher), 40 ng/mL BDNF (PeproTech), 40 ng/mL GDNF (PeproTech), 20 ng/mL NT3 (PeproTech), 1 μg/mL Laminin (R&D Systems) and 2 μg/mL doxycycline (Sigma-Aldrich). For neuronal maintenance, half media was changed every 2–3 days.
Directed differentiation to cortical and hypothalamic lineages
Prior to differentiation, hiPSC cell lines were maintained in mTeSR1 on geltrex (1:100, Thermo Fisher) and passaged with EDTA (0.5 μM, pH 8.0, Thermo Fisher) at 60–80% confluence. For each line, we confirmed that colonies had clearly defined borders and cultures lacked differentiated cells when viewed under a phase contrast microscope. Lines were passaged at least twice under these conditions before differentiation experiments were initiated, and lines were synchronized by adjusting split ratios so that the last passage was 3–4 days before plating for differentiation. For differentiation, hiPSC lines were dissociated to a single-cell suspension with TrypLE, counted, and plated onto coated plates. Cell lines were pooled for cortical differentiation, and grown separately for hypothalamic differentiation. For cortical and hypothalamic differentiation we followed published methods.71,72
Briefly, dissociated hiPSCs were plated at 1×10⁴ cells/cm2 into 6-well plates in the presence of 10 μM ROCK inhibitor (Y-27632, Tocris Bioscience). Cortical and hypothalamic differentiation took place on a substrate of geltrex (1:100) in N2B27 media containing 500 ml Neurobasal-A (Thermo Fisher), 500 ml DMEM/F12 with GlutaMAX (Thermo Fisher), 10 ml Glutamax (Thermo Fisher), 10 ml sodium bicarbonate (Thermo Fisher), 5 ml MEM Nonessential Amino Acids (Thermo Fisher), 1 ml 200 mM ascorbic acid (Sigma-Aldrich) 10 ml 100x penicillin-streptomycin (Thermo Fisher), 20 ml 50x B27 supplement (Thermo Fisher), 10 ml 100x N2 supplement (Thermo Fisher). Patterning to forebrain progenitors in this medium was directed using 100 nM LDN-193189 (Stemgent), 10 μM SB431542 (Sigma-Aldrich), and 2 μM XAV939 (Stemgent). The concentrations of these small molecules were adjusted over time as previously described,71 and for hypothalamic differentiation the small molecules SAG (Thermo Fisher) and purmorphamine (Calbiochem) were each added to a final concentration of 1 μM from day 2–8 of differentiation. To assess the efficiency of differentiation and the identity of progenitors, cells were plated in a separate 48-well plate at 4×10⁵ cells/well on day 11 and fixed for immunofluorescence assay on day 16.
Cell dissociation for single-cell RNA sequencing
iNeurons and iLowerMotorneurons were washed once with PBS after 17 days of differentiation. The lines were then either differentiated in separate wells and pooled in a single tube at the end of differentiation, or the lines were pooled at the beginning of differentiation and were resuspended in 1x PBS-0.04% BSA (Jackson Immunoresearch) and washed 3 additional times with this solution after single-cell dissociation. Single-cell pellets were resuspended in 1x PBS-0.04% BSA, counted using an automated cell counter (Countess II) and the concentration was adjusted to 1×10⁶ cells/mL.
Cortical and hypothalamic neurons were washed once with 1X DPBS (Thermo Fisher) before adding TrypLE containing 20 units/ml of papain after 5 weeks of differentiation (34 days for cortical and 37 days for hypothalamic). Cultures were incubated at 37°C until the cells physically detached from each other when viewed under a phase contrast microscope and could be readily dissociated with a P1000 pipette. Enzyme mix was aspirated and cells were dissociated with a P1000 in DMEM:F12 (Thermo Fisher) supplemented with 10 μM Rock inhibitor, 33 μg/ml DNase I (Worthington), and 45 uM Actinomycin D to block dissociation-induced transcription. The resulting cell suspension for each separate well was passed through a 40 μm cell strainer and brought to 10 ml in the dissociation solution centrifuged at 160x g for 5 minutes. For cortical differentiations, each well was uniquely barcoded using cholesterol-modified MULTIseq oligonucleotides to facilitate cell pooling during droplet-based single-cell cDNA library preparation based on a published protocol.73 After two additional washes, cells were resuspended in 1x DPBS containing 0.04% BSA (Sigma) and washed 3 additional times in 1x DPBS containing 0.04% BSA. Single-cell suspensions were counted using an automated cell counter (Countess II).
Immunofluorescence and imaging
Cells were fixed in 4% paraformaldehyde for 10 min at room temperature and washed 3x in PBS. Afterwards, the cells were incubated in blocking solution composed of PBS, 0.2% Triton-X and 4% donkey serum for 1 hr at 4°C. Primary antibody, anti-FOXA2 (R&D Systems) and anti-Lmx1 (Merck Millipore) were added 1:100 into blocking solution (PBS, 5 % donkey serum, 0.1 % Triton X10) and the cells were incubated for 2 hr at room temperature. Samples were washed in 3x blocking solution before the addition of 1:500 donkey anti-goat IgG secondary antibody, Alexa Fluor® 561 (Thermo Fisher) and 1:500 donkey anti-goat IgG (H+L) secondary antibody, Alexa Fluor® 647 (Thermo Fisher) to the cells for 1 hr at room temperature. Samples were washed 3x in blocking solution and 1x in PBS. 1:1000 Hoechst 33342 (Thermo Fisher) was added to the cells in PBS before imaging them.
Trilineage differentiation (Bu lab)
KOLF2.1J iPSCs were thawed and plated onto a Matrigel-coated dish in mTSER1 (Stemcell Technologies) containing 10 mM rock inhibitor Y27632 (Sigma-Aldrich). Medium change with mTSeR1 without a rock inhibitor was performed daily after the first 24 h. Pluripotency of KOLF2.1J iPSCs was evaluated by three germ layer differentiation using STEMdiff Trilineage Differentiation kit (Stemcell Technologies) following the manufacturer’s instructions. Cells were passaged with Accutase (Stemcell Technologies) when approximately 70% confluent and plated onto Matrigel-coated 24-well plates with mTeSR1 containing rock inhibitor at a density of 10,000 cells/well. After 24h, lineage-specific differentiation medium was exchanged daily for either 5 days (endoderm and mesoderm) or 7 days (ectoderm).
Differentiation was confirmed by immunostaining specific markers of each germ layer (Ectoderm: Nestin; Mesoderm: Brachyury; Endoderm: SOX17). Cells were fixed in 4% PFA in PBS for 10 min, permeabilized with 0.2% Triton X-100 in PBS for 10 min and blocked for 60 min in blocking buffer (1% bovine serum albumin in PBS), at room temperature. Cells were then incubated overnight at 4°C with primary antibodies diluted in blocking buffer: mouse anti-Nestin (1:300, Abcam); goat anti-Brachyury (1:300, R&D Systems); mouse anti-SOX17 (1:300, Abcam); followed by incubation with Alexa fluor anti-goat or anti-mouse IgG secondary antibody diluted in blocking buffer, at room temperature for 1 h in the dark (1:400, Thermo Fisher). Images were acquired using a Keyence digital microscope.
Trilineage differentiation efficiency was quantified to establish a comparison with a commercial APOE3 iPSC line from ALSTEM. Images (n=2–5) from separate (2 or 3) endoderm, mesoderm, and ectoderm differentiation experiments were quantified using Fiji to determine the percentage of Sox17-positive cells (endoderm), Brachyury-positive cells (mesoderm) and Nestin-positive cells (ectoderm; Figure 6A).
Cortical neuron differentiation (iNDI)
KOLF2.1J iPSCs were differentiated into hNGN2-expressing cortical neurons using an established protocol,70 as described in the main manuscript. For the neurite outgrowth experiments, cytosolic mScarlet (MK-EF1a-mScarlet) was transduced in KOLF2.1J with stably integrated human NGN2 using a lentivirus expressing cytosolic mScarlet to identify neurite.58 The course of the neuron differentiation was recorded by scanning using an Incucyte® S3 Live-Cell Analysis System with a 20X objective. Imaging was performed every 24 h at 37°C for 28 days. Phase images were acquired for every time point (Figure S6A).
Cortical neuron differentiation (Wainger lab)
To assess neuronal differentiation efficiency, KOLF2.1J was compared to two control iPSC lines in the NINDS Human Cell and Data Repository (ND50003, ND50004) and a third control line (11a).82 iPSCs were plated in T75 flasks (Thermo Fisher) coated with Vitronectin XF (Stemcell Technologies) according to manufacturer instructions. iPSCs were cultured in mTeSR plus (Stemcell Technologies) and media was changed every 2–3 days. To generate iPSCs with a stable tet-inducible NGN2 construct, 2.75μg PiggyBac transposase and 2.75μg tet-NGN2 (both from Michael Ward) were nucleofected using a Nucleofector I (Lonza, protocol A-23) and the Human Stem Cell Nucleofector Kit 1 (Lonza). To improve survival after nucleofection, mTeSR plus was supplemented with CET (50nM Chroman 1, MedChem Express; 5uM Emricasan, Selleckchem; 0.7uM Trans-ISRIB, Tocris).83 The next day, CET was removed and replaced with puromycin (InvivoGen, 10ug/mL) to select for tet-NGN2 integration. Cells were continually supplemented with puromycin until all cells were positive for BFP2, indicating all remaining cells had integrated the tet-NGN2 construct. To differentiate iPSCs into i3 neurons, 12 million iPSCs were diluted in induction media (DMEM/F12, Life Technologies; N2 supplement, Gibco; NEAA, Corning; Glutamax, Thermo Fisher; Penicillin/Streptomycin, Life Technologies; 2μg/mL Doxycycline, Millipore Sigma) supplemented with CET and plated into a T175 flask (Fisher Scientific) coated with Vitronectin XF. The next day, media was exchanged for fresh induction media without CET. The following day differentiated i3 neurons were treated with accutase (Thermo Fisher), counted, and frozen in batches of 1 million cells/vial (500 μL freezing media: 40% FBS, Hyclone; 10% DMSO, Millipore Sigma; 50% induction media; CET). Differentiated i3 neurons were plated at 40,000 cells/well in induction media with CET in 96-well plates [Cellvis coated with PDL (Millipore Sigma) and Laminin (Life Technologies) according to manufacturer recommendations]. The next day, induction media was exchanged with cortical neuron media (Neurobasal, Life Technologies; B27 supplement, Gibco; Glutamax, Thermo Fisher; Penicillin/Streptomycin, Life Technologies; 50mM NaCl, Millipore Sigma; 10ng/mL NT-3, Peprotech; 10ng/mL BDNF, Life Technologies) supplemented with 10uM U/FdU (Millipore Sigma). Two days later, media was exchanged for fresh cortical neuron media without U/FdU. Thereafter, half the media was exchanged every 2–3 days. Cells were fixed 7 days after thawing using 4% formaldehyde (Life Technologies) for 15 min. Cells were then blocked and permeabilized for 1 h in PBT (1xPBS, Gibco; 0.5% Triton-X, Millipore Sigma; 1% BSA, Millipore Sigma) and then incubated overnight in primary antibody solution: PBT with rabbit anti-Brn2 (1:1000; Cell Signaling), chicken anti-Tuj1 (1:500; Aves), and Hoechst (1:1000; Thermo Fisher). Cells were then washed 2x with PBS and incubated for 1 h in donkey anti-rabbit 488 (1:1000; Thermo Fisher) or donkey anti-chicken 647 (1:1000; Jackson Immunoresearch) secondary solution in PBT. Samples were then washed 2x with PBS and imaged on a Zeiss LSM900. Images were quantified using custom MATLAB scripts (Figure 6B).
Excitatory glutamatergic neuron differentiation (Holzbaur lab)
KOLF2.1J differentiation to NGN2-expressing neurons was performed using an established protocol.70 In short, doxycycline-inducible human NGN2 was stably expressed in wild-type KOLF2.1J iPSCs using a PiggyBac vector. Following puromycin selection, iPSCs were differentiated into excitatory glutamatergic neurons with 2 μg/mL doxycycline. Following 72 h of incubation with doxycycline, neurons were dissociated with Accutase (Sigma) and cryo-preserved. On day of use, pre-differentiated neurons were thawed and plated at a density of 300,000 neurons per imaging dish (MatTek) coated with poly-L-ornithine. iPSC-derived neurons were cultured in BrainPhys Neuronal Medium (StemCell) supplemented with 2% B27 (GIBCO), 10 ng/mL BDNF (PeproTech), 10 ng/mL NT-3 (PeproTech), and 1 μg/mL mouse laminin (Corning). To visualize mitochondria, cells were transfected with a PGK-Mito-mEmerald plasmid. To engineer the plasmid, a parent plasmid was obtained from Addgene expressing 4xMito-mEmerald behind a CMV promoter. This insert was put behind a PGK promoter made by PCR using pLenti-PGK-LifeAct-GFP-W (Addgene) as the template, with the vector backbone from a pEGFP vector (Clontech). iPSC-derived neurons were transfected at DIV18 (72 h prior to fixation) with 4 μL Lipofectamine Stem Transfection Reagent (Thermo Fisher) and 1.25 μg plasmid DNA per dish. At DIV21, iPSC-derived neurons were fixed with 4% PFA supplemented with 4% sucrose (w/v) for 10 min at 37°C. Neurons were then permeabilized with 0.2% Triton-X in PBS for 15 min at room temperature. After washing three times with PBS, neurons were blocked for 1 h at room temperature with 5% goat serum and 1% BSA in PBS. Neurons were incubated in primary antibodies mouse anti-MAP2 (1:200; EMD Millipore) and sheep anti-LAMP1 AlexaFluor 488-conjugated (1:20; R&D Systems) diluted in blocking solution overnight at 4°C, washed three times with PBS, and then incubated in secondary antibody goat anti-mouse IgG AlexaFluor 594 (1:2000, Thermo Fisher) diluted in blocking solution for 1 h at room temperature. Nuclear counterstaining was performed with Hoechst dye (Thermo Fisher). Fixed iPSC-derived neurons were imaged on a PerkinElmer UltraView Vox Spinning Disk Confocal system with a Nikon Eclipse Ti inverted microscope, a Hamamatsu EMCCD C9100-50 camera controlled by Volocity software, and an Apochromat 100× 1.49 NA oil immersion objective. Z-stacks were collected at 0.15 nm/step (Figure S6B).
Cortical, medium spiny neuron, and dopaminergic neuron co-cultures (Schüle lab)
To generate mixed cultures of cortical, medium spiny (MSN), and dopaminergic neurons, KOLF2.1J iPSCs were first individually neuralized to pre-patterned forebrain, lateral ganglionic eminence, and floor-plate neural progenitor cells (NPCs) by chemical induction.84–87 KOLF2.1J iPSCs were plated at a concentration of 300,000 cells/cm2 in 2 ml of a 1:1 mixture of Stemflex and KSR media (15% knockout serum replacement (KSR), 1x penicillin-streptomycin, 1x GlutaMAX, 1x NEAA, 0.1mM b-mercaptoethanol in Knockout DMEM/F12) containing 1 uM Thiazovivin (THZ) in a Matrigel (1:50 in KnockOut DMEM) - coated well of a 6 well plate. On day 0, media was replaced with 3 ml of (100% KRS media), and cultures were supplemented with small molecules according to the region-specific patterning protocol (see below: (1) forebrain, (2) lateral ganglionic eminence, (3) floorplate NPCs). Starting day 4, KSR Media was gradually shifted to N2B27 media [1x Penicillin Streptomycin, 1x GlutaMAX, 1x NEAA, 0.5x B27 without vitamin A, 0.5x N2 in Neurobasal:DMEM/F12 (1:1)] until day 8 on which 100% N2B27 Media was used. On day 13, splitting (1:1) was performed with Accutase, and cells were replated into a Matrigel (1:80)-coated well. On day 15, cells were split up onto two Matrigel-coated wells (splitting 1:2). On day 20, three NPC types were detached with Accutase, counted, and combined (1:1:1) in N2B27 media containing 0.5% fetal bovine serum (FBS) and 1 mM THZ.
- Forebrain NPCs pre-patterned to derive into cortical neurons were generated from iPSCs according to an adapted protocol.84,86 To increase the outcome of PAX6-positive cells, we applied dual SMAD-inhibition by LDN/SB431542 instead of noggin/SB431542.88 We further applied wingless/integrated (Wnt) pathway inhibition by exposure to IWP-2;89 see below table).
Day of Neuralization Supplements Base Media Media changes Day −1 THZ (1 μM) Stemflex (50%) \ KSR (50%) Day 0 – 3 LDN (500 nm), SB431542 (10 μM), IWP-2 (1 μM) KSR (100%) Every 2nd day Day 4 – 5 LDN (500 nm), SB431542 (10 μM) KSR (66%) \ N2B27 (33%) Every 2nd day Day 6 – 7 LDN (500 nm) KSR (33%) \ N2B27 (66%) Every day Day 11 – 12 LDN (500 nm) N2B27 (100%) Every day Day 11 – 13 **THZ (1 μM) 24h before and after splitting N2B27 (100%) Every day Day 14 – 20 THZ (1 μM) N2B27 (100%) Every 2nd day - Lateral ganglionic eminence NPCs pre-patterned to derive into GABAergic medium spiny neurons (MSNs) were generated from iPSCs according to a modified protocol.84,87 Exposure to SB431542 was reduced to 6 days (Day 0 to Day 6), while we started to supplement Activin A on day 8 till day 20. We further adapted the LDN concentration to 500 nM and included IWP-2 (see below table).
Day of Neuralization Supplements Base Media Media changes Day −1 THZ (1 μM) Stemflex (50%) \ KSR (50%) Day 0 – 3 LDN (500 nm), SB431542 (10 μM), IWP-2 (1 μM) KSR (100%) Every 2nd day Day 4 – 5 LDN (500 nm), SB431542 (10 μM) KSR (66%) \ N2B27 (33%) Every 2nd day Day 6 – 7 LDN (500 nm) KSR (33%) \ N2B27 (66%) Every day Day 8 – 13 LDN (500 nm), ActivinA (25ng/ml)
**THZ (1 μM) 24h before and after splittingN2B27 (100%) Every day Day 14 – 20 ActivinA (25ngjml), THZ (1 μM) N2B27 (100%) Every 2nd day - For floor plate-induction of NPCs, we used a modified dual SMAD-inhibition protocol.85 The concentration of LDN was adapted to 500 nM. We further optimized the time point of FGF8 exposure starting subsequently to SAG/purmorphamine (purm) exposure from day 7 (see below table).
Day of Neuralization Supplements Base Media Media changes Day −1 THZ (1 μM) Stemflex (50%) \ KSR (50%) Day 0 LDN (500 nm), SB431542 (10 μM) KSR (100%) Day 1 – 2 LDN (500 nm), SB431542 (10 μM), SAG (2 μM), Purm (2 μM) KSR (100%) Every 2nd day Day 3 LDN (500 nm), SB431542 (10 μM), SAG (2 μM), Purm (2 μM), CHIR (3 μM) KSR (100%) Day 4 – 5 LDN (500 nm), SB431542 (10 μM), SAG (2 μM), Purm (2 μM), CHIR (3 μM) KSR (66%) \ N2B27 (33%) Every 2nd day Day 6 LDN (500 nm), SAG (2 μM), Purm (2 μM), CHIR (3 μM) KSR (33%) \ N2B27 (66%) Day 7 LDN (500 nm), CHIR (3 μM), FGF8 (100ng/ml) KSR (33%) \ N2B27 (66%) Day 8 – 15 LDN (500 nm), CHIR (3 μM), FGF8 (100ng/ml)
**THZ (1 μM) 24h before and after splittingN2B27 (100%) Every 2nd day Day 16 – 20 THZ (1 μM) N2B27 (100%) Every 2nd day
Codex multiplex imaging
For CODEX® the NPCs had to be plated and differentiated on specific glass coverslips (22×22 mm Electron Microscopy Sciences). The previous day, glass coverslips were placed in 6 wells and coated with poly-D-Lysine (100μg/ml, 2h at RT)/laminin (10μg/ml, 2h at 37 °C) and then pre-seeded with primary human Ara-C inactivated astrocytes (620 cells/cm2; Sigma-Aldrich) in astrocyte media. Before plating the NPCs, the astrocyte media was taken out of the well. Then the NPCs were gently pipetted at a concentration of 100,000 cells/cm2 in 300 μL of N2B27 media containing THZ (1 μM) onto the glass coverslips only. The NPCs were allowed to attach for 10 min on RT before another 2 ml of N2B27 media containing THZ (1 μM) was carefully added to the well. The following day the media was replaced with 3 ml of terminal differentiation media2 (1x penicillin-streptomycin, 1x GlutaMAX, 1x NEAA, 1x B27 without vitamin A, 20 ng/μL BDNF, 10 ng/μL GDNF, 0.5 mM dibutyryl cAMP, 0.2 mM ascorbic acid, 10 μM DAPT in Neurobasal A) containing 0.5% FBS. NPCs were differentiated into neurons for 30 days. For the first two weeks of differentiation half of the media was changed every 3 days, subsequently, media changes were conducted every 7 days. To prevent neurons from detaching, 1 μg/ml of mouse laminin was added to the media every second media change. Codex multiplex imaging was performed for 10 different antibodies. Fixation, preparation, and staining of the sample, as well as image processing, was conducted as described previously.90,91
SybrGreen Assay of dopaminergic neurons derived from KOLF2.1J and 0524 lines
Using a previously established 96-well SYBR Green qPCR expression array,92 iPSC-derived dopaminergic neurons from KOLF2.1 and 0524-193 were characterized. iPSCs were dissociated with ReLesR and ~2,500,000 cells were pelleted for 5 min by centrifugation (5,000 g at 4°C). The pellet was washed with 1 ml of PBS and again centrifuged at 5,000 g at 4°C. RNA was then extracted using the Purelink™ RNA Mini Kit. To increase RNA yield, iPSC-derived dopaminergic neurons (~500,000) were dissociated and lysed with Purelink™ lysis buffer directly in a 6 well. Subsequently, the cell lysate was transferred to the homogenization tube and RNA extraction was conducted according to the Purelink™ protocol. The RNA concentration was quantified by NanoDrop and 1 μg of RNA was treated with DNase I for 15 min at RT to eliminate contamination with genomic DNA. After inactivating DNase I for 3 min at 65°C for 3 min, HighCapacity cDNA Reverse Transcription kit was used for cDNA reverse transcription. Negative control was generated by adding nuclease-free water instead of RNA. For the reverse transcriptase control RNA was added but not the reverse transcriptase. Each cDNA sample was diluted 1:5 with nuclease-free H2O for a final concentration of 10 ng/μL and stored at −20°C.
The day before the SYBR Green assay, both forward and reverse primers of our genes of interest were pre-plated in triplicates at a final concentration of 300 nM each into a 384-well of an optical PCR plate. Additional wells with GAPDH primers were included for the negative and reverse transcriptase control. After plating the primers, the 384 well-plate was centrifuged at 2,000 rpm for 2 min. To dry out the primers, the plate was then kept in a box at RT for at least 12 h. Then the reaction mix (2.5 μL of PowerUp SYBR Green Master Mix, 1.5 μL of nuclease-free water, and 1 μL of 10ng/ml sample cDNA) was pipetted to the wells that were pre-coated with primers, and the plate was sealed with optical adhesive film. Following another centrifugation step at 2,000 rpm for 2 min, the SYBR Green reaction was run using a QuantStudio 6 Flex.
The cycling conditions indicated in the below were used to amplify cDNA.
| Steps | Temperature | Duration | Cycles |
|---|---|---|---|
| UDG activation | 50 °C | 2 min | |
| Dual-Lock™ Taq DNA polymerase | 95 °C | 2 min | |
| Denaturation | 95 °C | 15 s | 40 |
| Annealing/ extend | 60 °C | 1 min |
The conditions in the below table were used to quantify the melt curve of the PCR product.
| Step | Ramp rate | Temperature | Time |
|---|---|---|---|
| Denaturation | 1.6 °C/s | 95 °C | 15 s |
| Annealing | 1.6 °C/ s | 60 °C | 1 min |
| Dissociation | 0.15 °C/ s | 95 °C | 15 s |
The cycle threshold (Ct) values were used to calculate the fold change (2−ΔΔCt) as a measure of relative gene expression. First, the mean Ct value was calculated for each gene. The mean Ct values were used to determine ΔCt by ΔCt = mean Ct(target gene) − mean Ct(housekeeping gene) (GAPDH). Then ΔΔCt was calculated using ΔΔCt = ΔCt(treated cell( (neuron) − ΔCt(untreated cell) (iPSC). Finally, the fold change was obtained by 2−ΔΔCt (Figure S6C).
Cortical neuron differentiation (Verhage, van der Kant labs)
Cell culture
Cells were differentiated into cortical neurons through forced overexpression of NGN2. iPSCs were infected with high-titer lentiviral particles encoding pTetO-Ngn2-Puro (Addgene) and FUΔGW-rtTa (Addgene) in E8 medium containing 5 μM Rock-inhibitor (RI; TetuBio). The next day, the cells were transferred to N2 medium (DMEM/F12 medium supplemented with 200 mM Glutamax, 20% Dextrose, 1% N2 supplement B (all Life Tech) and 0.1% Pen/Strep (Invitrogen)) containing 2 μg/ml doxycycline hyclate (Sigma-Aldrich) as well as the SMAD inhibitors LDN-193189 (100 nM; Stemgent) and SB431542 (10 μM; Tocris) and the WNT inhibitor XAV939 (2 μM; Stemgent) to start NGN2 expression and neuronal differentiation. The next day, 100% of the medium was exchanged for N2 medium containing doxycycline, inhibitors and 2 μg/ml puromycin (Merck-Millipore). After another day, the medium was changed to N2 containing doxycycline and 10 μM FUDR (Sigma-Aldrich). On the final day, the cells were dissociated and replated on glia islands in neurobasal medium (supplemented with 200 mM Glutamax, 20% Dextrose, NEAA, B27, 0.1% P/S, 0.5% Fetal bovine serum; all Life Tech) containing doxycycline and growth factors BDNF, CNTF and GDNF (all 10 ng/ml; Stem Cell Tech). 2k neurons were plated on 18 mm coverslips covered in glia islands. To create the islands, rat glia were plated on etched coverslips stamped with microdots of 0.1 mg/ml poly-D-lysine (Sigma Aldrich), 0.7 mg/ml rat tail collagen (BD Biosciences) and 10 mM acetic acid as described previously.48 Neurons were kept at 37°C and 5% CO2. 50% of medium was refreshed once a week. Experiments were performed on days 42 to 46 after the start of induction.48
Bioni010-C-13 iPSCs were acquired from the European Bank for Induced Pluripotent Stem Cells (EBiSC, https://ebisc.org/). This iPSC line was CRISPR-engineered to carry the NGN2 induction cassette in the AAVS1 safe-harbor locus.94 Therefore, the line was induced only through the addition of doxycycline and no addition of antibiotics was necessary. In all other aspects it was treated similarly to the KOLF2.1J cell line.
Calcium imaging
6-week old KOLF2.1J neurons were incubated for 10 min with 2 μM Fluo-5F-AM (Molecular Probes; stock in DMSO) at 37°C. Coverslips were transferred to an imaging chamber and perfused with Tyrode’s solution (2 mM CaCL2, 2.5 mM KCl, 119 mM NaCl, 2 mM MgCl2, 30 mM glucose, 25 mM HEPES; ph 7.4). Imaging was acquired on a custom-built microscope (AxioObserver.Z1, Zeiss) with 40x oil objective (NA1.3). Neurons were imaged for 30 s as baseline and then stimulated with 16 trains of 50 action potentials at 50 Hz with a 0.5 s interval. Electrode field stimulation was applied using a stimulus generator (A-385, World Precision Instruments) controlled by a Master-8 (AMPI) to deliver 1 ms pulses of 30 mA. Experiments were performed at room temperature (20–24°C) For calcium influx quantification, 20 neurite-located ROIs (6 × 6 pixels) and background ROIs were measured per neuron in ImageJ (Figure S6D).
Electrophysiology methods
Autaptic neurons were subjected to whole-cell voltage-clamp recordings (Vm = −70 mV). Experiments were performed at room temperature with borosilicate glass pipettes (Science products GmbH, 2.5–4.5 MOhm) filled with (in mM): 136 KCl, 17.8 HEPES, 1 EGTA, 0.6 MgCl2*6H2O, 4 ATP-Mg, 0.3 GTP-Na, 12 phosphocreatine dipotassium salt and 50 U/ml phosphocreatine kinase (pH = 7.3, ~300 mOsmol). External solution (aCSF) contained the following (in mM): 10 HEPES, 10 Glucose, 140 NaCl, 2.4 KCl, 4 MgCl2 and 2 CaCl2 (pH = 7.30, ~300 mOsmol). aCSF was made from stock with HEPES and glucose added freshly, filter-sterilized and stored at 4°C until use. Patch-clamp recordings were performed with a MultiClamp 700B amplifier and Digidata 1550B or an Axopatch 200B amplifier and Digidata 1440A, controlled by Clampex 10.6 software (Molecular Devices). For gap-free recordings of spontaneous miniature EPSCs, the sampling rate was set to 20 kHz and low-pass Bessel filter was set to 5–6 kHz. For episodic stimulations, the sampling rate was set to 10 kHz and low-pass Bessel filter to 2 kHz. Resistance was compensated by 70–80% (bandwidth 7.52 Hz). Action potentials were elicited by a 1 ms depolarization to 30 mV. Recordings were excluded if series resistance was higher than 15 MOhm, if the leak current was larger than 300 pA and if the evoked EPSC was too asynchronous as assessed by a custom-made MATLAB script. Offline analysis was performed with MATLAB R2019a (Mathworks) using custom-written software routines (viewEPSC, downloaded from user vhuson on Github on 6th Jan 2020). Data were tested for normality and homoscedasticity and significance was tested using the Wilcoxon rank sum test with p<0.05 considered as significant (Figures 6C; S6E).
Cortical and microglia differentiations (Paquet lab)
Cortical neuron differentiation
iPSC-derived cortical neurons were generated as previously described with minor modifications.95 Briefly, 1 million iPSCs were plated on day 0 on 12-well tissue culture plates coated with Geltrex in neural induction medium (NI, 0.5x Neurobasal, 0.5x DMEM/F12, 0.1 mg/ml Pen/Strep, 0.5x B27, 0.5x N2, 2 mM Glutamax, 0.1 mM NEAA, 5 μg/ml Insulin, 0.1 mM 2-Mercaptho-Ethanol, 10 μM SB431542, 0.25 μM LDN-193189) and maintained for 8 days. On day 8 cells were dissociated using Accutase (Life Technologies) and resuspended in NI medium at 30 million cells/mL. Cells were plated on dried poly-L-ornithine and laminin-coated (POL; Sigma-Aldrich, Life Technologies) 6-well plates in 200–300 μL spots. Cells were left to adhere for ~45 min and NI medium was added. On day 10 NI was replaced with a neural maintenance medium (NM, which is NI without SB431542 and LDN-193189). Upon the appearance of neural rosettes, 20 ng/mL FGF2 was added for 2 days. When neurons started to form (~day 21), rosettes were isolated manually after treatment with STEMdiff Neural Rosette Selection Reagent (Stemcell Technologies) for 1 h. Rosettes were washed and plated on POL 6-well plates and grown for 7 days. Cortical neurons were harvested with Accutase and plated on POL-coated coverslips at 400,000 per 24-well well and maintained in Neurobasal medium (NB, 1x Neurobasal, 1x B27, 2 mM Glutamax, 0.1 mg/mL Pen/Strep, all Life Technologies) until analysis was performed (Figure 6D).
Microglia differentiation
KOLF2.1J iPSCs were differentiated as described previously (Figure 6I).96,97
Immunostaining and quantifications
Cells were fixed by 4% paraformaldehyde (PFA) for 20 min at RT, washed twice for 5 min with PBST (PBS, 0.1% Triton X-100), incubated in blocking solution (PBST, 3% donkey serum, 0,02% NaN3) for 1 hour, and incubated with primary antibodies in blocking solution (neurons: rabbit anti-Tuj1, 1:500, Covance; chicken anti-MAP2, 1:2000, Abcam; rat anti-CTIP2, 1:200, Abcam. microglia: rabbit anti-PU.1, 1:300, Cell Signal; goat anti-TREM2, 1:400, Bio-Techne; rabbit anti-Iba1, 1:500, Invitrogen) at 4°C overnight. On the next day, cells were washed 4 times for 10min in PBST, and incubated with Alexa488, Alexa555 or Alexa647-conjugated secondary antibodies (Invitrogen) and 4’,6-diamidino-2-phenylindole (DAPI) for 1 h at RT. Finally, cells were washed 4 times for 10min in PBST and mounted on slides for imaging. Images were visualized in a Zeiss Observer widefield microscope. Quantification of purity was performed manually for all microglial staining, as well as MAP2 and TuJ1 for neurons, and using a custom macro in Fiji/ImageJ (National Institutes of Health) for the remaining staining and DAPI. Briefly, the inbuild ImageJ Macro environment was used to write a script that would batch process triple stained ICC images. The script loaded the images from a certain directory, split the image into individual channels and then counted the number of positive cells of each stain after thresholding the image. Size and circularity exclusions were applied to restrict the counting to individual cells rather than clumps. To count DAPI positive cells, the inbuild threshold ‘Yen’ was used and particles with a size between 30–250μm and a circularity between 0.1–1 were counted. Cells were defined by the same size and circularity, but the inbuild threshold ‘Li’ was used to differentiate positive signal from background. Quantification of yield was performed by manually counting cells using a Neubauer chamber at the same time when neurons or hematopoietic microglia precursors are usually frozen for storage.
Cortical neuron differentiation (Cohen lab)
Generation of PB-TO-hNGN2-hiPSCs
An hiPSCs-PB-TO-hNGN2 stable cell line was generated as previously described.70 Briefly, KOLF2.1J wildtype cells were transfected with piggyBac plasmid carrying rrTA and Ngn2-Puro cassette (plasmids gifted from Michael Ward). Transfected cells were selected for stable integration using puromycin treatment (0.5 μg/mL) and propagated as a non-clonal pool. The expression of stem marker genes was validated by immunofluorescence and western blots for rabbit anti-Nanog (Abcam), rabbit anti-Sox2 (Abcam), rabbit anti-Oct4 (Abcam), and mouse anti-SSEA4 (Thermo Fisher).
Differentiation into cortical neurons
hiPSCs-PB-TO-hNGN2 were differentiated into cortical neurons as previously described with slight modification.70 In brief, hiPSCs were seeded in colonies (10–20 cells) at high confluency (50–60%) on Vitronectin coated plates. One day after seeding, the medium was changed to Induction media: DMEM/F12 with HEPES (Gibco); N2 supplement 100X (Gibco); non-essential amino acids 100X (Gibco), and supplemented with Doxycycline at a final concentration of 1μM (Sigma). The medium was changed every day. After 2.5 days, the pre-induced hiPSCs, were passaged in Accutase (StemPro™ Accutase™ Cell Dissociation Reagent, Gibco) and seeded single cell (300,000) on Poly-L-Ornithine (Sigma; 10x stock: 50 mg in 50 ml Borate Buffer) and laminin 10 μg/ml (Gibco) coated plates (Thermo Scientific™ Nunc™ LabTek™ II Chambered Coverglass, 2-well). The day of seeding, the medium was changed to Cortical Neuron Culture Medium (CM): BrainPhys neuronal medium without Phenol-Red (STEMCELL Technologies); B27 supplement, 50X (Gibco); BDNF (10 μg/ml) in PBS containing 0.1% IgG and protease-free BSA (PeproTech); NT-3 (10 μg/ml) in PBS containing 0.1% IgG and protease-free BSA (PeproTech); laminin final con. 1 μg/ml (Gibco). CM medium was initially supplemented with ROCK inhibitor (RevitaCell supplement 100X, Gibco). The day after seeding, the medium was replaced with CM medium without ROCK inhibitor. The i3Neurons were kept for 27 days prior to imaging, with half of the medium replaced at least once per week with freshly prepared CM. Cells were immunostained for different neuronal markers: rabbit anti-MAP2 (Abcam); rabbit anti-NeuN (CellSignalling); rabbit anti-βIII-Tubulin (Abcam); rabbit anti-PSD95 (Abcam); mouse anti-VGLUT1 (Sigma); and rabbit anti-TBR1 (Abcam).
Transfection of i3Neurons
After 29 days of induction (day 27), the i3Neurons were transfected as previously described with some modifications.98 The transfection mix was prepared in Neurobasal (Gibco) with 6 μl of Lipofectamine2000 (Invitrogen), and 6 μg of total DNA divided as follows: 2 μg of pEIF1a::Transposase (gifted by Dr. M. Ward), and 4 μg of pEIF1a::Cox8(1–26)::eGFP (Twist Technologies). The medium of i3Neurons was changed to Neurobasal (without Glutamine) and pre-incubated at least 30 min. before adding the transfection mix. Next, half the medium was removed, and the transfection mix was added dropwise. After 2 hrs of incubation, the medium was completely replaced with CM.
Imaging
24 hrs after transfection the neurons were tested for vitality by NeuroFluo (final concentration 0.20μM, Stemcell Technologies) and NuclBlue (Invitrogen) staining. Images were acquired with a Zeiss 800 Laser Scanning Confocal Microscope with a 63x Objective (Plan-Apochromat 63x/1.40 Oil DIC M27). The NeuroFluo/NuclBlue images and the brightfield images of mitochondria/NuclBlue were taken with a zoom of 0.5x, while the time lapse images were taken with a zoom of 2.2x, every 1.96 seconds for 100 cycles. The cropped timelapse corresponds to cycle 53 and is referred to as the starting time (t=0s) for the fission event observed (Figure S6F).
Cortical neuron differentiation (Wray lab)
Cell Culture
KOLF2.1J iPSCs were differentiated in parallel to previously described control iPSCs99,100 into cortical glutamatergic neurons.86 This protocol generates glutamatergic neurons representative of the six cortical layers in a 100-day period. Briefly, iPSC cells were grown in StemFlex media (Thermo Fisher) on a Geltrex (Thermo Fisher)-coated plate in a humidified 5% CO2. For differentiation, cells were plated at 100% confluency (day 0 in culture) on geltrex-coated plates and grown in a neuronal induced medium which was replaced daily for ~12 days. Neuronal induction media was N2B27 media containing 10 μM SB431542 (Tocris) and 1 μM dorsomorphin (Tocris). N2B27 media consisted of a 1:1 mixture of Dulbecco’s modified eagle medium F12 (DMEM-F12) and Neurobasal supplemented with 0.5× N2, 0.5× B27, 0.5× non-essential amino acids, 1 mM L-glutamine, 25U pen/strep, 10 μM β-mercaptoethanol and 25U insulin. Following 12 days of neuronal induction media, a uniform neuroepithelial layer could be observed. This was passaged using dispase (Life Technologies) and replated in large clumps onto laminin coated wells at a ratio of 1:3 (Sigma) to allow the formation of neuronal rosettes. These were fed every 3 days with N2B27 media and passged with dispase onto fresh laminin-coated wells as required. Once substantial neurogenesis was observed (25–35 days in culture), cells were dissociated to a single-cell suspension using Accutase (Innovative Cell Technologies) and plated onto fresh laminin coated wells. Neurons were plated for the final time at 35 days in culture at a density of 50,000 cells per cm2. Neurons were fed every 72h with N2/B27 media until 100 days in vitro, when corticogenesis is complete, and characterized by immunofluorescence for neuronal markers.
Immunostaining
At 100 DIV, cells were fixed in 4 % (wt/vol) paraformaldehyde (PFA) for 10 min before permeabilization with 0.3 % (vol/vol) Triton-X-100 in PBS for 10 min and blocking with 5 % BSA in PBS for 30 min at RT. After blocking, cells were incubated with rat anti-Ctip2 (1:300; Abcam) and mouse anti-Tuj1 (1:1000; Promega) primary antibodies diluted in the blocking solution overnight at 4°C in a humid chamber. The following day, primary antibodies were removed, and cells were washed with PBS three times for 5 min. After the last wash, the cells were incubated with Alexa Fluor 488 anti-rat and Alexa Fluor 647 anti-mouse (1:1000) secondary antibodies diluted in a blocking buffer for 1h at RT protected from light. Secondary antibodies were then removed, and cells were washed twice with PBS and then counterstained with diamidino-2- phenylindole (DAPI) (Thermo Fisher) at 0.1 μg/ml for 10min at RT and washed three times with PBS. Cells were mounted on microscope glass slides (Thermo Fisher) with ProLong™ Diamond Antifade Mountant (Thermo Fisher). For high content imaging, plates were stored in PBS. Stained cells were imaged using a Zeiss LSM 800 microscope and analysed using Fiji software or for quantification, cells were imaged on the Opera Phenix High Content Screening System (Figure 6E).
Skeletal myocyte differentiation (Raman lab)
Cell Culture
Skeletal myocyte differentiation was performed according to a previously published study.101
Immunostaining
iPSCs, premyogenic progenitors, and myoblasts were plated on 12-mm coverslips in 24-well plates. Myocytes were differentiated on the coverslips for ten days. Cells were washed with PBS and fixed using 4% paraformaldehyde for 15 min at room temperature. Cells were blocked and permeabilized in PBS containing 5% serum and 0.2% Triton X-100 for 1 h at room temperature. The coverslips were then incubated in primary antibodies rabbit anti-Nanog (1:100, Cell Signaling), mouse anti-Pax3 (1:50, DSHB), rabbit anti-MyoD (1:150, Proteintech), and mouse anti-myogenin (1:50, DSHB) diluted in blocking buffer in a humidified chamber overnight at 4°C. Post primary antibody incubation, the coverslips were washed three times with PBS followed by 1 h incubation with appropriate Alexa Fluor-conjugated secondary antibodies in the dark in blocking buffer. Cells were washed with PBS, and nuclei were stained with Hoechst dye (1:5000) and mounted onto slides. The images were collected by using a Nikon A1R with a 60× Plan Apo 1.4-numerical-aperture (NA) objective lens or Zeiss LSM 800 with a 40x/1.3 NA Plan Apochromat oil immersion. Images were analyzed by using FIJI (Figure S6G).
Cortical neuron differentiation (Parish lab)
Cell Culture
KOLF2.1J was differentiated into cortical neurons using a dual SMAD neural induction protocol, as previously described.102 Briefly, KOLF2-1 iPSCs were seeded onto Laminin-521-coated (5 μg/mL) plates at a density of 0.3 × 10⁶ cells/cm2 in mTeSRPlus medium (StemCell Technologies) with 10 μM Rock inhibitor Y-27632 (Tocris Bioscience). 24 hrs later, cells were switched to dual-SMAD inhibition for 11 days in ‘cortex medium’ comprised of 1:1 DMEM/F12 and Neurobasal with 0.5x B27, 0.5x N2, 0.5x ITSA, 1x GlutaMAX, 0.5x Penicillin Streptomycin and 50uM 2-Mercaptoethanol (Life Technologies) and supplemented with 100 nM LDN193189 (Stemgent) and 10 mM SB431542 (R&D Systems). On Day 11 (D11), progenitors were passaged in Accutase (Innovative Cell Technologies) for 5 min at 37°C and transferred to ‘cortex medium’ containing 20 ng/mL fibroblast growth factor 2 (FGF2; R&D Systems) for 8 days. On D19, cultures were again passaged and replated in cortex medium. On D32, cells were passaged and seeded on poly-L-ornithine (0.005% v/v, Sigma-Aldrich, USA) and Laminin-521-coated plates. One week following final plating, neurons were switched to ‘maturation medium’ consisting of 1:1 DMEM/F12 and Neurobasal, 1x B27, 1x N2, 1x ITSA, 1x NEAA, 1x GlutaMAX and 0.5x Penicillin Streptomycin, supplemented with brain-derived neurotrophic factor (BDNF, 40ng/ml; R&D Systems), glial cell-line derived neurotrophic factor (GDNF, 40ng/ml), N6,2′-O-Dibutyryladenosine 3′,5′-cyclic monophosphate (dcAMP, 0.05mM; Tocris Bioscience), ascorbic acid (200nM; Sigma-Aldrich) and laminin (1μg/ml; Sigma-Aldrich).
Immunostaining
Immunostaining of cultures and brain sections were performed as previously described.102 In brief, cultures were fixed in 4% (w/v) paraformaldehyde for 10 min, washed in PBS and incubated overnight in PBS-Azide (0.02% w/v) solution containing 10% (w/v) normal donkey serum (NDS), 0.3% Triton-X and primary antibodies rabbit anti-TBR1 (1:1000; Abcam), rat anti-CTIP2 (1:500; Abcam), and goat anti-BRN2 (1:200, Santa Cruz). The following day, cells were washed, blocked with 10% NDS and incubated in secondary antibodies (AlexaFluor-488, −555 or −647; Jackson ImmunoResearch) for 1.5 hrs. Nuclei were counterstained with DAPI. Images were captured on a Zeiss Axio ObserverZ.1 inverted epifluorescence microscope at 20x and the total number of DAPI, TBR1, CTIP2, and BRN2 immunolabeled cells quantified (Figure 6F).
Motor neuron differentiation (Conklin lab)
Differentiation
KOLF2.1J iPSCs were differentiated to motor neurons by inducible expression of 3 transcription factors in the hNIL transgenic system.70 Briefly, 350,000 KOLF2.1J iPSCs were electroporated (Lonza 4D nucleofector, setting DS-138; Amaxa P3 Primary Cell 96-well Nucleofector kit) with plasmids containing the i3 LMN hNIL inducible construct (pUCM-CLYBL-hNIL, Addgene) and TALENs targeting the CLYBL safe harbor locus (pZT-C13-R1, Addgene; pZT-C13-L1, Addgene). Transfected cells were plated at clonal density and selected with 100μg/mL geneticin starting day 3 after transfection for 10 days, at which point all surviving colonies were observed to express mCherry. Surviving iPSC colonies were pooled and expanded for 5 passages before beginning the differentiation. Differentiation of motor neurons was conducted as described in (2). For day 3 replating, 20,000 cells were passaged into 96-well plastic cell culture dishes. On day 10, cells were fixed with 200 μL 4% PFA added directly to cell culture media (final concentration 2%) and fixed at room temperature for 20 min.
Immunostaining
Cells were permeabilized with 0.1% TritonX in PBS (PBST) for 10 min and blocked with 5% BSA in PBST for 1 h. Cells were incubated with primary antibodies in PBST (rabbit Anti-β-Tubulin III, 1:500, Sigma-Aldrich or mouse Anti-HB9, 1:200, DSHB) at room temperature for 1 h, washed 3x with PBST for 5min, secondary antibodies (Alexa Fluor-594 goat anti-rabbit IgG, Invitrogen, 1:500 or Alexa Fluor-488 goat anti-mouse IgG, Abcam, 1:500) in PBST at room temperature for 45 min, then washed 3x with PBST for 5min with DAPI in the first wash. Cells were imaged on a Keyence BZ-X710 (Figure S6H).
Motor neuron differentiation (Zhang lab)
Cell Culture
Motor neuron differentiation was performed as described previously.103
Immunostaining
On day 18, cells were fixed in 4% paraformaldehyde for 20 min, incubated in PBX (PBS and 0.1% Triton X-100) for 10 min. Cells were incubated in mouse anti-SMI32 (Biolegend) in PBST (PBS and 0.1% Tween-20) with 3% normal donkey serum at 4 °C overnight. Cells were then washed three times in PBST for a total period of 1 h and subsequently incubated in the secondary antibody solution, PBST with 3% normal donkey serum and 1:1000 Donkey anti-mouse Alexa 488, for 3 hrs at room temperature. Cells were washed three times in PBST for a total period of 1 h and then mounted in Prolong Gold with DAPI. Three images were selected per line for quantification (Figure S6I).
Motor neuron differentiation (Cleveland lab)
iPSCs were differentiated to motor neurons as described previously.104 iPSCs were grown in Matrigel-coated plates until 70–90% confluency in mTeSR-Plus medium (~2 days from passaging). Neural induction (day 1) was done by medium change to N2B27 medium (DMEM/F12 + GlutaMAX supplemented with 1% PenStrep, 1:200 N2 supplement, 1:100 B27 Supplement, 150μM Ascorbic Acid) supplemented with 10μM SB431542, 1μM Dorsomorphin and 3μM CHIR99021. Daily media changes were done until day 7, when cells were passaged at 1:6 and medium was changed to N2B27 supplemented with 10μM SB431542, 1μM Dorsomorphin, 200nM Smoothened Agonist (SAG) and 1.5μM Retinoic Acid (RA). Daily medium change were done daily with doubling volumes to adjust for cell density. At day 18, cells were replated using Accutase at a density of 7.5×10⁶ cells in Matrigel-coated 10cm dishes, and fed with N2B27 medium supplemented with 200nM Smoothened Agonist (SAG) and 1.5μM Retinoic Acid (RA). On day 22, cells were passaged onto their final plates or microfluidic chambers coated with 10μg/ml poly-D-lysine, 10μg/ml poly-L-ornithine, and subsequently 20μg/ml laminin, and fed with N2B27 medium supplemented with growth factors (2ng/ml BDNF, CTNF and GDNF), and 2μM DAPT. From day 25 onward, cells were fed every 2–3 days with N2B27 medium containing growth factors.
Immunostaining
Motor Neurons were fixed with 4% PFA for 10 min at room temperature. Permeabilization and blocking were done with 0.01% (w/v) Tween/PBS containing 1.5% BSA for 1 h. Cells were incubated overnight at 4°C in primary antibodies mouse anti-islet1/2 (1:1000, DSHB) and rabbit anti-NF-H (1:500, Millipore) were diluted in 0.01% Triton X-100/1x PBS. Cells were then washed 3 times with 1x PBS, and incubated with secondary antibodies (1:500) for 30 min-1h. After two subsequent washes with 1x PBS, cells were incubated with 1:5000 DAPI for 5 min, and stored in 1x PBS until imaging.
Live imaging using SiR-Tubulin
Motor neurons are incubated with 250nM SiR-Tubulin (Cytoskeleton, Inc.) diluted in culture medium overnight, and imaged the next day. (Figure 6G).
Macrophage differentiation (Bosco lab)
Cell culture
iPSCs were maintained and differentiated as described previously with minor modifications.105 In summary, iPSCs were maintained in mTeSR1 Plus media (Stem Cell Technology) in plates coated with 10μg/mL of Cell Adhere Laminin 521 (Stem Cell Technology) diluted in Dulbecco’s phosphate-buffered saline (DPBS) containing calcium and magnesium (Gibco). Embryoid body (EB) generation was performed by dissociating the iPSCs colonies and plating 104 cells/well into low adherence 96-well plates (Corning) using mTeSR1 Plus media containing 50 ng/mL human bone morphogenetic protein 4 (BMP-4, Fisher Scientific), 50 ng/mL human vascular endothelial growth factor (VEGF, PeproTech), 20 ng/mL human stem cell factor (SCF, PeproTech), and 10uM ROCK inhibitor (Fisher Scientific). Plated cells were centrifuged at 800 rpm for 3 min and half-medium change was performed on day 2. For myeloid maturation, EBs were gently dislodged from the wells and plated on 6 well plates coated with growth factor reduced matrigel (Corning) diluted in KnockOut DMEM/F-12 (Gibco). EBs were maintained in X-VIVO 15 media (Lonza) supplemented with 1% penicillin/streptomycin (Gibco), 1X GlutaMAX (Gibco), 55 μM 2-mercaptoethanol (Gibco), 100 ng/mL human macrophage colony-stimulating factor (M-CSF, PeproTech), and 25 ng/mL human interleukin- 3 (IL-3, PeproTech). Macrophage progenitors were collected weekly during medium change and terminally differentiated into unpolarized iPSC-derived macrophages by culture for seven days in X-VIVO 15 supplemented with 1% penicillin/streptomycin, 1X GlutaMAX, and 100 ng/mL M-CSF at a density of 100,000 cells per cm2. Half-medium change was performed every 3 days.
Immunostaining
iPSC-derived macrophages plated on coverslips were fixed with 4% paraformaldehyde (Fisher Scientific) and processed for immunofluorescence analysis as detailed previously.106 Cells were incubated in a rabbit anti-IBA1 (1:1000, Wako Chemicals) primary antibody.
Immunofluorescence images were collected with a Leica DMI 6000B inverted fluorescent microscope using a 40X air objective and Leica DFC365 FX camera with AF6000 Leica Software v3.1.0 (Leica Microsystems). Stacked images (z=0.2μm) were maximum projected. Brightness and contrast were equally adjusted post-acquisition to improve visualization of fluorescent signals. Brightfield images were acquired on live cells using an EVOS ci inverted microscope (AMG) with 4x and 10x objectives. (Figure S6J).
Astrocyte differentiation (Kampmann lab)
NPC cell culture
KOLF2.1J-derived astrocyte differentiation was conducted according to a previous study.107 KOLF2.1J and WTC11 iPSCs were dissociated with accutase and seeded into Aggrewell 800 plates (Stemcell Technologies) following manufacturer’s specifications at ~2 million cells/well in DMEM/F12 Media (Gibco) with 1X B27 Supplement minus vit A (Gibco) and 1X N2 (Gibco) in 10 nM Rock Inhibitor (Tocris) to generate embryoid bodies (EBs) (Day 1). The next day, the media was exchanged with the same media with Dual SMADi 0.1 μM LDN193189 (Tocris) and 10 μM SB431542 (Tocris), but without a rock inhibitor. Media containing Dual SMADi was exchanged every other day. On day 7, the cultures were plated onto matrigel coated plates. Adherent cultures were then fed with the same media every other day for the next week. On day 14, neural rosettes were released and replated onto matrigel coated plates in NPC media (1X N2, 1X B27, 20 ng/mL FGF2 in 1% BSA in DMEM/F12) and expanded. On day 21, NPCs were stained with PE mouse anti-CD133/1 (Miltenyi Biotec) and PerCP-Cy5.5 mouse anti-CD27 (BD Pharmingen) and CD133+/CD271− populations were sorted with BD FACSAria Fusion. Mouse IgG1κ was used for isotype control (Miltenyi Biotec).
Astrocyte cell culture
CD133+/CD271− NPCs were expanded in NPC media and then plated on matrigel coated plates with Astrocyte Media (ScienCell Research Laboratories). Astrocytes were cultured in astrocyte media over a period of 2 weeks for astrocyte differentiation on 96 well plates (Corning).
Immunostaining
Astrocytes were fixed with 4% paraformaldehyde in PBS for 10 min at room temperature. They were then washed 3 times with DPBS + 0.3% Triton-X 100 (PBSTx) and blocked with 10% Normal Goat Serum + 1% BSA in PBSTx for 1 h at room temperature. Astrocytes were incubated in the following primary antibodies: Mouse anti-S100β (1:500, Sigma-Aldrich) and rabbit anti-NFIA (1:500, Sigma) at 4°C overnight. Following washes in PBSTx, astrocytes were incubated in secondary antibodies goat anti-mouse Alexa Fluor 488 (1:2000, Thermo Fisher) and goat anti-rabbit 568 (1:2000, Thermo Fisher) for 45 min at room temperature. Astrocytes were then washed again in PBSTx, stained with Hoechst, and then washed and stored for imaging in PBS. Plates were imaged on the IN Cell Analyzer 6000 (GE Healthcare), using a 60X 0.7 NA objective, 2×2 binning, with 9 fields per well (Figure 6H).
Microglia differentiation (Kronenberg-Versteeg lab)
Mouse organotypic hippocampal brain slice cultures
Hippocampal slice cultures were prepared from pups at postnatal day 4–6 (P4-6) according to previously published protocols.108,109 In brief, after decapitation, brains of pups were removed, hippocampi dissected and cut perpendicular to the longitudinal axis into 350 μm sections with a tissue chopper. Hippocampal sections were kept in ice-cold preparation buffer (minimum essential medium (MEM, Gibco) supplemented with 2 mM GlutaMAX™ (Gibco) at pH 7.3) until placed onto a humidified porous polyethylene (PTFE) membrane insert (Merck Millipore) in a 6-well plate with 1.2 ml culture medium (20% heat-inactivated horse serum (Gibco) in 1x MEM complemented with GlutaMax™ (1 mM), ascorbic acid (0.00125%, Sigma-Aldrich), insulin (1 μg/ml, Thermo Fisher), CaCl2 (1 mM, Sigma-Aldrich), MgSO4 (2 mM, Sigma-Aldrich) and D-glucose (13 mM, Roth) adjusted to pH 7.3) per well. HSCs were kept at 37 °C in humidified CO2-enriched atmosphere with media changed three times per week.
To allow engraftment of iMacs into OHSCs, endogenous murine microglia were depleted with a mouse-specific ɑ-CSF1R antibody (BioLegend, 5 mg/ml). On day 3–5 post preparation iPSC-derived microglia precursor cells were harvested and drop-grafted onto OHSCs in 1 μl (10,000 cells/μl) of medium per OHSC. Subsequently, iMacs were allowed to integrate into OHSCs and slices were fixed after 2–4 weeks in culture with 4% paraformaldehyde (PFA) in PBS at pH 7.4 for 2h. After fixation, slice cultures were rinsed 3 times with 0.1M PBS for 10 min and stored at 4 °C until further processing.
Human iPSC-derived microglia-like cell differentiation using a 2D protocol
hiPSCs were differentiated as previously described.110 In brief, 10,000 cells/cm2 were plated onto Geltrex (Thermo Fisher) coated 6 well plates. Starting the day after splitting, iPSC were specified to mesoderm with BMP-4 (Miltenyi), VEGF (Miltenyi) and CHIR99021 (Miltenyi) during the first four days of differentiation. Hemangioblast formation was induced by adding FGF-2 (Miltenyi) and maintained with VEGF and FGF-2 from days 4–6. Primitive hematopoiesis was promoted from day 6–10 through Wnt inhibition (Dkk1) and hematopoietic cells were matured from day 12–16 by continued incubation with SCF (R&D Systems), FGF-2, IL-3 (Miltenyi) and IL-6 (Miltenyi).
For the first 8 days of the differentiation protocol, the cells were cultured in a hypoxic environment (5% CO2 and 5% O2) before being moved to a normoxic incubator (5% CO2) after differentiation day 8. Cells were cultured in Stempro Medium (Thermo Fisher) with the addition of the following cytokines: D0 (5 ng/ml BMP4, 50 ng/ml VEGF, and 2 mM CHIR99021), Day 2 (5 ng/ml BMP4, 50 ng/ml VEGF and 5 ng/ml FGF2), Day 4 (15ng/ml VEGF and 5 ng/ml FGF2), Differentiation Day 6 to 10 (10 ng/ml VEGF, 10 ng/ml FGF2, 50 ng/ml SCF, 30 ng/ml DKK-1 (Miltenyi), 10 ng/ml IL-6, and 20 ng/ml IL-3), Differentiation Day 12 and 14 (10 ng/ml FGF2, 50 ng/ml SCF, 10 ng/ml IL-6, and 20 ng/ml IL-3). From day 16 the cells were fed with Stempro supplemented with 50 ng/ml CSF-1 (Miltenyi) with full media changes every 3 days. At D24, Mac precursor cells were harvested, plated at a density of 50,000 cells on Poly-D-Lysine (PDL, Gibco) coated glass coverslips in Co-Culture Medium (CoCu: 50% Neurobasal Medium (Gibco), 50 % DMEM-F12 (Gibco), 1x B27 Supplement with Vitamin A (Gibco), 2 mM GlutaMAX™, 0.1 mM β-mercaptoethanol (Gibco), 100ng/ml IL-34 (Miltenyi Biotec), 20 ng/ml CSF-1) with media changes 3 times a week or drop grafted onto HSCs (as described above).
Immunostaining
Organotypic brain slice cultures were blocked with 5% normal donkey serum (2h) and 0.3% Triton X-100 (Sigma-Aldrich) in PBS. For microglial detection goat anti-Iba1 (1:250, Novus Biologicals) and mouse anti-STEM101 (1:250, TaKaRa) were used in 2% NDS, 0.3% Triton X-100 at 4 °C overnight. Following Alexa-fluorophore-conjugated secondary antibodies were applied in a concentration of 1:250 for 2h at RT: donkey-anti-goat Alexa-647, donkey-anti-mouse Alexa-488, (all Jackson ImmunoResearch). Slices were analyzed with a Zeiss LSM 880 NLO microscope equipped with a 20x water-immersion objective (W Plan-Apochromat x20/1.0, Carl Zeiss, Jena) (Figure S6K).
Dopaminergic neuron differentiation (Verstreken lab)
Cell Culture
On day −1, 400,000 KOLF2-1J or SFC065 (kindly provided by the laboratory of C. Klein) hiPSC/cm2 were seeded in Matrigel-coated 6-well plate wells in StemFlex medium supplemented with 10 μM RI. On day 0, medium was switched to Neurobasal containing 0.5x B27 supplement without vitamin A, 0.5x N2, GlutaMAX, Pen/strep, non-essential amino acids, and LDN193189 (500 nM, Sigma), SB431542 (10 μM, Tocris), SHH-C24II (200 ng/ml, Miltenyi Biotec), Purmorphamine (0.7 μM, Sigma) and 0.7 μM CHIR99021 (Stemcell Technologies). CHIR99021 concentration was raised to 3 μM from day 4 to day 11, moment at which it was withdrawn from the medium. LDN193189 (500 nM, Sigma), SB431542 (10 μM, Tocris), SHH-C24II (200 ng/ml, Miltenyi Biotec), Purmorphamine (0.7 μM, Sigma) were withdrawn from the medium at day 7 and FGF8b (100 ng/mL, R&D Systems) was introduced from day 9 until day 16. At day 11, medium was shifted to Neurobasal-A medium (Life Technologies; 10888-022) supplemented with 1x B27 without Vit. A (Life Technologies; 12587010), 1x GlutaMAX (Life Technologies; 35050-038), 1x PenStrep (Life Technologies; 15140-122), 10 ng/mL BDNF (R&D Systems; 248-BDB-050/CF), 10 ng/mL GDNF (R&D Systems; 212-GD-010), 200 μM ascorbic acid, 0.5 mM dbcAMP (Sigma-Aldrich), 10 μM DAPT (Tocris; 2634). On day 17, ventral midbrain neural progenitors were cryopreserved.
Immunostaining
Cells were fixed at day 17 of differentiation for 15 min in 4% formaldehyde, blocked for 1h at room temperature with 3% normal goat serum + 0.3% Triton X-100 (Sigma) in DPBS supplemented with Ca2+ and Mg2+ (Life Technologies). Primary antibody incubation was done overnight at 4°C with the following antibodies dissolved in blocking solution: mouse anti-EN1 (1:200, DSHB), rabbit anti-LMX1A/B (1:2000, Millipore) and mouse anti-FOXA2 (1:500, Santa Cruz). Secondary antibodies (Life Technologies) were incubated for 1h at room temperature. Coverslips were mounted in Mowiol (Sigma) and imaged on an upright Nikon A1R confocal microscope equipped with a DIC N2 20X lens NA 0.75. Z-stacks were acquired with a pinhole of 1 Airy unit, a Galvano scanner with line averaging of 2, image size of 1024 × 1024 pixels and step intervals of 0.5 μm. Nuclear markers were quantified using QuPath (Figure 6J).111
Dopaminergic neuron differentiation (Arenas lab)
Cell Culture
Dopaminergic neurons were differentiated by seeding KOLF2.1J cells at a density of 200,000 cells/cm2 and differentiating until day 28,112 with the exception of SHH C25II, which was substituted by 2 μM purmorphamine. Briefly, wells were coated with Geltrex (Life Technologies) and cells were cultivated in Neurobasal/N2/B27 (Life Technologies) medium with 2mM L-glutamine (Invitrogen), 250 nM LDN193189 (Stemgent), 10 μM SB431542, 2 μM purmorphamine, 0.7μM CHIR99021, and 10 μM Y27632 (Tocris Bioscience) on day 0 of differentiation and were cultured to day 3 after the removal of Y27632 from day 1. 7.5μM CHIR9901 was supplemented from day 4 and LDN, SB and purmorphamine were withdrawn from day 7. On day 10, cells were shifted to Neurobasal/B27/L-Glu supplemented with 20 ng/mL brain-derived neurotrophic factor (BDNF, R&D Systems), 20 ng/ml glial cell line-derived neurotrophic factor (GDNF, R&D Systems), 1 ng/ml transforming growth factor type b3 (TGFb3, R&D Systems), 0.2 mM ascorbic acid (Sigma), 0.2 mM dibutyryl cAMP (Sigma), and 3 μM CHIR99021. On day 11, cells were dissociated into single cells, and were replated onto plates coated with 15 mg/ml polyornithine,1 mg/ml laminin 111, and 2 mg/ml fibronectin at a density of 500,000 cells/cm2. The mDA differentiation media without CHIR99021 was applied for cell culture and was supplemented with 10 mM DAPT (Sigma) from day 12. On day 15, cells were replated using the same procedure and cultured until day 25 for characterizations.
Immunostaining
Cells were fixed by 4% paraformaldehyde (PFA) for 30 min at 4°C, pre-incubated with 5% donkey serum in PBS with 0.1% Triton X-100 (PBST) for 1 hr, incubated with primary antibodies goat anti-FOXA2 (1:1000, R&D Systems), rabbit anti-LMX1 (1:2000, Millipore), mouse anti-Nurr1 (1:1000, Perseus Proteomics), or rabbit anti-TH (1:1000, Millipore) at 4°C overnight, followed by Alexa488, Alexa555 or Alexa647-conjugated secondary antibodies (Invitrogen) for 1 hr and then 4’,6-diamidino-2-phenylindole (DAPI) for 15 min. Images were visualized in a Zeiss LSM 980 Airyscan microscope (Figure S6L).
Midbrain organoid differentiation (Ahfeldt lab)
Cell culture
For midbrain organoid differentiation, KOLF2.1J cells were cultured in Stemflex™ medium (Thermo Fisher) on Geltrex-coated under conditions of 37°C, 5% CO2 in a humidified incubator. Midbrain organoids were differentiated as detailed previously.113 Briefly, 40×106 iPSCs were seeded in 125-ml disposable spinner flasks (Corning, VWR) in Stemflex + 10μM Rhok inhibitor Y-27632. Flasks were placed on a nine-position stir plate (Dura-Mag) at a speed of 65 rpm. Once spheres reached a size of 300–500μm differentiation was initiated by dual-SMAD inhibition with SB431542 (R&D Systems, 10 μM), LDN193189 (Stemgent, 100 nM), B27-Vit A, and N2 in DMEM-F12. Patterning media was supplemented with CHIR99021 (Stemgent, 3 μM), Purmorphamine (STEMCELL, 2 μM), and SAG (Abcam, 1 μM) for the midbrain-specific patterning.86 Starting day 12, post patterning neural maturation media was composed by DMEM F12 supplemented with N2, B27-VitA, 20 ng/mL GDNF (R&D Systems), 20 ng/mL BDNF (R&D Systems), 0.2 mM ascorbic acid (Sigma), 0.1 mM dibutyryl cAMP (Biolong), 10 μM DAPT (Cayman Chemical). After day 35, spheres were transferred to ultralow attachment plates (Corning, VWR) for long-term cultures in DMEM F12 medium containing N2, B27-VitA, 10 ng/ML GDNF (R&D Systems), 10 ng/mL BDNF (R&D Systems), 0.2 mM ascorbic acid (Sigma).
Immunostaining
For organoid immunohistochemistry (IHC) analysis, at indicated time points midbrain organoids were washed in PBS and fixed with 4% PFA overnight. Fixed organoids were embedded in paraffin and serial sections (4–6 μm) were prepared using a Leica RM2255 microtome. Sections were placed on charged slides and baked overnight at 70°C and IHC was performed on Ventana Benchmark XT. Antigen retrieval with CC1 (citric acid buffer) was performed for 1 h, followed by incubation for 30 min in primary antibodies mouse anti-TH (1:500, EMD Millipore) rabbit anti-NURR1 (1:200, Millipore Sigma), and mouse anti-GFAP (1:10, Millipore). A multimer secondary antibody was used for all samples. IHC sections were imaged using an Aperio VERSA 8 digital slide scanner (Leica Biosystems; Figure S6M).
QUANTIFICATION AND STATISTICAL ANALYSIS
Bioinformatic analysis
Whole genome sequencing and annotation of variants
iPSC lines and a National Institute of Standards and Technology (NIST) reference (HG-002) were sequenced with 30x coverage and paired-end through the Illumina short read sequencing and the 10x Genomics linked-read sequencing by Jax and/or Psomagen, Inc. For Illumina short read data, SNVs and indels were called using the HaplotypeCaller following the Genome Analysis Toolkit (GATK) best practices and executed through the Google genomics alpha pipeline. FASTQ files were processed into unmapped BAM files using the paired-fastq-to-unmapped-bam workflow on the human GRCh38 build. Initial variant calling was performed using the PairedSingleSampleWf. The joint discovery was then executed using the JointGenotypingWf. Variants were filtered using the variant quality score recalibration (VQSR) with default filtering parameters. The structural variant calling was performed using the Manta algorithm (Version 1.6.0) and then standardized using the structural variant tool kit (SVTK). For the 10x Genomics linked-read data, the SNP and indel variants and the structural variants were called using the 10x Genomics LongRanger wgs (version 2.2) pipeline. Sequencing reads were aligned to the human GRCh38 build containing decoy contigs and subjected to variant calling and phasing. The GATK’s HaplotypeCaller mode was applied to call SNPs and Indels. Variants were also annotated using ANNOVAR65 including the ClinVar database (version clinvar_20200316) to identify potential known pathogenic variants. Additionally, all data were screened for loss of function variants (stop, frame-shift and splicing) in iNDI project genes and specific variants of interest including APOE haplotype (rs429358 and rs7412), MAPT haplotype (rs1800547) and TMEM106B (rs3173615) genotype. Polygenic risk scores for AD and PD were calculated using PLINK (v1.9) with the weights of recent GWAS26,27. As a reference population for the polygenic risk score we used AD (Data-Field 131037), PD (Data-Field 131023) and controls (no known neurodegenerative disease, no parent with a known neurodegenerative disease and >=60 years old at recruitment) from the UK Biobank (application ID: 33601)66.
Genotyping array genotyping of subclones
To assess the genomic fidelity of IPSC sub-lines and subclones after editing, DNA was isolated and Illumina genotyping array was performed using the NeuroChip array and standard Illumina genotyping protocols.33 In total 185 subclones were successfully genotyped including at least 20 clones per included IPSC sub-line. Genomic fidelity was assessed using two strategies; 1) comparison between genotyping array data and WGS data and 2) Assessment of genome wide B-allele frequency and Log R ratio values. For the comparison between genotyping array and WGS data, all data was merged using PLINK (v1.9) and only overlapping variants were kept. Potential genetic differences were identified using the --merge-mode 7 option in plink which reports mismatching non-missing calls between two datasets. Variants discordant in more than 33% of the genotyped clones were excluded due to high likelihood of being genotyping errors. Mismatching non-missing calls were plotted using R (v3.6.1) per chromosome and visually inspected for large clusters of discordant array genotypes and WGS. Genotyping array data was also assessed for large events based on the B-allele frequency and Log R ratio values. The B-allele frequency and Log R ratio values were downloaded from Illumina GenomeStudio and processed and plotted using the GWASTools package in R (v3.6.1).67 GenCall score variant filtering thresholds of >0.4 and >0.7 were used to filter out calls likely arising from genotyping errors.
Comparative whole genome sequence analysis of KOLF2-C1 and KOLF2.1J
To retrieve the highly confident variants for KOLF2.1J, the three variant sets originally discovered from its default variant calling pipeline was subjected to filtering to exclude those that did not pass the thresholds of PASS, QUAL >= 30, DP >= 10, QP >= 2.0, and MQ >= 40. After filtering, the variant sets were intersected to generate the 3,278,414 common variants (SNPs/Indels) of high confidence, illustrated in Figure 5B. The common variants were subjected to annotation and effect prediction using VEP. About 88.9% variants were SNVs (Figure 5). Of the coding variants, 54.4% were found to be synonymous, 43.4% were missense, and the remainder were LOF, splice site, or other types of variants (Figure 5). KOLF2.1J highly confident SNPs/Indels were compared to KOLF-C1 SNPs/Indels to exclude the possibility that it gained deleterious variants after editing (Figure 5B). The rare and deleterious coding genes that were unique to KOLF2.1J were predicted using VEP (gnomAD_NFE_AF < 0.001 and CADD_PHRED > 30). Clinical relevance and dosage sensitivity of the predicted deleterious variants was annotated through ClinGen.45 25 protein-coding SNPs/Indels were found in KOLF2.1J but not in KOLF2-C1 (Table S2B). However, none had minor allele frequencies less than 0.001 or a CADD score greater than 30, suggesting that KOLF2.1J didn’t gain deleterious mutations after genomic editing and passaging. Four rare and deleterious variants were found in both KOLF2.1J and KOLF-C1 but were not classified as pathogenic (Table S2C).
Comparison of KOLF2.1J to donor KOLF2 fibroblasts
In order to compare whether variants are acquired in the KOLF2.1J line vs the donor genome, we downloaded fibroblast exome sequencing from the HipSci resource (https://www.hipsci.org). Reads covering the 40 variants of interest (Table S2D) were subset using samtools (v1.14).68 Reads were visually inspected using IGV 2.11.969 and compared to the generated KOLF2.1J WGS data generated for this manuscript. Variant presence was grouped into three categories: 1) Yes, meaning variant was present in fibroblast exome sequencing data at an allelic frequency near 50%, 2) No, meaning variant was not detected in fibroblast exome sequencing data and 3) Low allelic presence, meaning variant was present in <10% of total reads (Table S2D).
Chromium 10x Genomics library and sequencing
For iPSC, iNeurons, and iLowerMotorneurons, single-cell RNA sequencing was performed using Chromium Single Cell 3’ Reagent kit V3.1 (PN-1000128) and 2.5×10⁴ cells per condition were loaded into the 10x Genomics chip G. For cortical and hypothalamic neurons, single-cell suspensions were processed by the Chromium Controller (10x Genomics) using Chromium Single Cell 3’ Reagent Kit v3 (PN-1000075) according to the manufacturer’s specifications. On average, 15,000 cells from each 10x reaction were directly loaded into one inlet of the 10x Genomics chip. Barcoded libraries were sequenced using the Illumina Novaseq 6000 (one lane per 10x chip position) with 75 bp paired-end reads to an average depth of approximately 5×10⁴ reads per cell.
scRNA-seq data processing and quality control
Raw sequencing libraries were processed using 10x Genomics’ Cell Ranger platform (version 3.1). Reads were aligned and quantified to the 10x Genomics provided human reference genome (GRCh38, Ensembl 93). The samples were then grouped based on differentiation protocols and each group were processed independently in subsequent downstream analysis. Droplets containing captured cells were called using the emptyDrops function from the DropletUtils R package,74 using varying UMI threshold per differentiation protocol groups and an FDR of 0.001. Low quality cells and outlier cells were then filtered based on the total unique molecular identifier (UMI) content, number of detected features/genes and fraction of mitochondrial content. Cells were discarded if their UMI content is more than ± 3 median absolute deviation (MAD) away from the median, or the detected features is more than ± 3 MAD away from the median, or the fraction of mitochondrial content is higher than 3 MAD from median. Gene expression levels were normalized using the logNormCounts function from the scran R package,75 with size factors estimated using the computeSizeFactors function. Cells were assigned to cell cycle phases based on the expression of the G2/M and S phase markers76 using the CellCycleScoring function from Seurat R package.77
Doublet detection
Doublet identification was done in two stages: at the individual sample level and across samples within the same differentiation protocol. First, doublets were detected at the individual sample level using the hybrid method (cxds_bcds_hybrid function with estNdbl parameter set to true) from the scds R package.78 This is followed by identification of ‘guilt-by-association’ doublets, where doublets were further identified if there is enrichment of scds’ hybrid-based doublets in the neighboring cells (number of neighbor = 3 for iPSC and 5 for other differentiations). Clustering was then performed on cells in each sample (see below), and this was repeated for each identified cluster to form smaller sub-clusters. Finally, cells were also classified as doublets if cells belong to sub-clusters containing more than 50% of Vireo-identified or MULTI-seq-identified doublets. For doublet identification across samples within the same differentiation protocol, samples were first batch corrected (see below) into a single dataset per differentiation protocol, followed by two rounds of clustering to identify cell sub-clusters. Cells were classified as cross-sample doublets if they belonged to sub-clusters with an enriched fraction of per-sample doublets (>3 MAD away from the median). Cells which were classified as either per-sample doublets, cross-sample doublets, Vireo doublets or MULTIseq doublets were excluded from further downstream analysis.
Batch correction and dimensionality reduction
For each differentiation protocol, samples were combined into a single dataset and corrected for batch effect using the fast MNN function from Batchelor R package79 on the first 50 principal components computed from highly variable genes (HVG). HVG were selected by fitting the mean-variance curve on the normalized gene expression across all samples within a differentiation group with modelGeneVar from scran R package and filtering for genes which have higher variance than the fitted trend. Mitochondrial genes and ribosomal genes for large and small ribosomal subunits were excluded from mean-variance curve fitting as these genes have both high variance and expression. For visualization, Uniform Manifold Approximation and Projection (UMAP) two-dimensional embedding80 were calculated from the corrected principal component with the following settings: spread = 1 and minimum distance = 0.4.
Clustering and annotation
Cells were grouped into clusters for each differentiation protocol using the community detection-based Louvain clustering method. Briefly, shared nearest-neighbor graphs were constructed from the 50 corrected principal components, followed by clustering using the Louvain method (cluster_louvain function) from the igraph R package.81 Each cluster was then manually annotated with cell type based on a list of curated markers (Table S6) and further assigned into one of four cell type groups for evaluating differentiation efficiency of each cell sub-line.
Cell sub-line and replicate demultiplexing
Cell sub-line identity was inferred based on genotype information using 10x Genomics VarTrix and Vireo tools.18 Variant count matrices for captured cells were produced by VarTrix using aligned reads from Cell Ranger output and variants called from whole genome sequencing data (see above). Cell sub-line identity for captured cells were then determined with Vireo using the variant count matrix and variant information. Only variants from 7 cell sub-lines were utilized for demultiplexing as both NN0003932 and NN0004297 (denoted as NN_combined) were derived from the same donor. Replicate demultiplexing of MULTI-seq labeled samples was performed using the deMULTIplex R package. Briefly, MULTI-seq barcode reads from captured cells were aligned to the MULTI-seq barcodes used for labeling each sample, followed by read deduplication based on UMI and generation of MULTIseq barcode count matrix. Replicate classification was then performed on the barcode count matrix iteratively until there are no negative classified cells, followed by a negative-cell reclassification to recover incorrectly classified negative cells.
Statistical analysis
Each experiment used 3 or more experimental samples (where n represents a separate differentiation of the same cell line) and values are presented as mean ± s.e.m. unless otherwise indicated in the text and figure legends. Statistical differences between samples were determined by two-tailed unpaired t-tests unless otherwise indicated. Values of p <0.05 were considered statistically significant unless stated otherwise.
Supplementary Material
Table S1. Selection, cloning and expansion, and growth and genomic integrity analysis of 8 iPSC sub-lines in this study. Related to Figure 1.
Table S2. Whole genome sequencing analysis of the 8 lead iPSC sub-lines, and deeper analysis of KOLF2.1J. Related to Figures 2 and 5.
Table S3. Array-based genotyping of parental and gene-edited iPSC sub-lines. Related to Figures 2 and 3.
Table S4. Summary of iPSC sub-line selection from genotypic and phenotypic analysis. Related to Figures 5 and 6.
Table S5. List of contributing investigators for KOLF2.1J use case and comparative studies. Related to Figure 6.
Table S6. Characterization of differentiation efficiency by single-cell RNA sequencing. Related to Figure 4.
Highlights.
Deep genotyping and phenotyping identified KOLF2.1J as a reference human iPSC line
KOLF2.1J and its gene edited derivates are readily obtainable with minimal restrictions
Human iPSC lines remain genetically stable after our CRISPR/Cas9-based gene editing
Our multifactorial pipeline serves as a blueprint to identify other lead iPSC lines
Acknowledgements
This research was supported in part by the Intramural Research Program of the NIH, National Institute on Aging (NIA), National Institutes of Health, Department of Health and Human Services; project number [ZO1 AG000535], as well as the National Institute of Neurological Disorders and Stroke. A.Y. is supported by an EMBL-EBI/Cambridge Computational Biomedical Postdoctoral Fellowship (EBPOD). V.P. is supported by a UK Regenerative Medicine Platform grant from the Medical Research Council [MR/R015724/1]. F.T.M. is a New York Stem Cell Foundation - Robertson Investigator [NYSCF-R-156] and is supported by the Wellcome Trust and Royal Society [211221/Z/18/Z] and a Ben Barres Early Career Acceleration Award from the Chan Zuckerberg Initiative’s Neurodegeneration Challenge Network (CZI NDCN) [191942] that supported the costs of directed differentiation and single-cell sequencing. J.C.M. acknowledges core funding from the European Molecular Biology Laboratory and from Cancer Research UK [C9545/A29580]. We thank Greg Strachnan and the MRC Metabolic Diseases Unit Imaging Core Facility for assistance with imaging, and Katarzyna Kania and the staff at the Genomics Core Facility of the Cancer Research UK Cambridge Institute for assistance with single-cell library preparation and sequencing. This study utilized the high-performance computational capabilities of the Biowulf Linux cluster at the National Institutes of Health, Bethesda, MD, USA. (http://biowulf.nih.gov). This research has been conducted using the UK Biobank Resource under Application Number 33601. We gratefully acknowledge the contribution of the Scientific Services at The Jackson Laboratory for work described in this publication, including the Cellular Engineering service, the Genome Technologies service for expert assistance with whole genome sequencing and DNA and RNA preparation, the Flow Cytometry service for expertise in the p53 assay, and Scientific Instrument Services. We further thank the Cytogenetics laboratory at JAX for G-band karyotyping and analysis of several iPSC sub-lines.
M.M is supported by the ZonMw-Veni program (09150161810052) from the Dutch Research Council (NWO). R.v.d.K is supported by a CZI NDCN Pilot Grant (2020-222244(5022)). D.P. is supported by grants from the Deutsche Forschungsgemeinschaft (DFG, German Research Foundation) under Germany’s Excellence Strategy within the framework of the Munich Cluster for Systems Neurology (EXC 2145 SyNergy – ID 390857198). M.S.B. is supported by T32AG066596-01 training grant. D.W.C. is funded by R01-NS27036. A.H. is supported by NRSA postdoctoral fellowship F32NS114319. B.J.W is a New York Stem Cell Foundation - Robertson Investigator and is supported by The New York Stem Cell Foundation [NYSCF-I-R44]. S.W and R.G are supported by Alzheimer’s Research UK (ARUK-SRF2016B-2), the UCL Neurogenetic Therapies Programme, generously funded by The Sigrid Rausing Trust and the National Institute for Health Research University College London Hospitals Biomedical Research Centre. E.L is funded by the National Defense Science and Engineering Graduate Fellowship. I.V.L.R. is funded by the California Institute for Regenerative Medicine Scholars Research Training Program (EDUC4-12812) and the Ruth L. Kirschstein National Research Service Award (T32 NS115706). M.K. is funded by a Chan Zuckerberg Initiative Ben Barres Early Career Acceleration award. C.C. is funded by the Marie Skłodowska-Curie Actions - Seal of Excellence FWO and postdoctoral fellowship. P.V. is supported by Mission Lucidity, an ERC consolidator grant, and Research Foundation Flanders (FWO). B.S. and P.V are supported by the CZI NDCN and Amici Lovanienses. L.H is funded by the Deutsche Forschungsgemeinschaft (DFG, German Research Foundation; project number: 471227244). D.D. was supported by T32-AG-000255. E.L.F.H. is funded by NINDS R01 NS060698. M.D. and S.C. are supported by a CZI NDCN Collaborative Pairs Award. M.R is supported by R01GM127557 and the Tufts Springboard Award. J.V.L. is supported by a DOC-PRO4 PhD fellowship from the University of Antwerp and an FWO-Flanders travel grant to perform the research at Gladstone Institute. K.J.C. and K.Z is supported by grants from NIH-NINDS/NIA (R01NS117461), DoD (W81XWH-21-1-0082), Target ALS, and the Frick Foundation for ALS Research. Funding from the Dan and Diane Riccio Fund for Neuroscience, the Angel Fund for ALS research and the Radala Foundation was provided to D.A.B. for this work. L.E. is supported by the Studienstiftung des deutschen Volkes and the International Max Planck Research School (IMPRS) for The Mechanisms of Mental Function and Dysfunction’ (MMFD). D.K-V. is supported by grants from the Chan Zuckerberg Initiative (2020-221779(5022) & 2021-235147) and Alzheimer Forschung Initiative e.V. (20019p). G.L. and E.A. are supported by: EU H2020-MSCA-ITN-2018 (813851), CZI NDCN (2018-191929), EU H2020-FETOPEN (HS-SEQ, 899687), Wallenberg Scholar (KAW2018.0232), ERC Advanced (PreciseCellPD, 884608), SSF (SB16-0065), VR (2020-01426), Hjarnfonden (FO2019-0068), Cancerfonden (CAN2016/572), Karolinska Institutet (StratRegen 2018). L.S. is supported by the Training Program in Stem Cell Biology fellowship from the New York State Department of Health (NYSTEM-C32561GG).
Inclusion and Diversity
We support inclusive, diverse, and equitable conduct of research.
Footnotes
Declaration of interests
S.W.S. is on the scientific advisory council of the Lewy Body Dementia Association and the MSA Coalition. S.W.S. is an editorial board member for the ‘Journal of Parkinson’s Disease’ and ‘JAMA Neurology’. S.W.S. received research support from Cerevel Therapeutics. M.K. serves on the scientific advisory boards of Engine Biosciences, Casma Therapeutics, Cajal Neuroscience and Alector and is a consultant to Modulo Bio and Recursion Therapeutics. Participation by researchers from Data Tecnica International LLC in this project was part of a competitive contract awarded to Data Tecnica International LLC by the National Institutes of Health to support open science research. M.A.N. also currently serves on the scientific advisory board for Clover Therapeutics and is an advisor to Neuron23 Inc. E.A. is founder, shareholder and scientific advisor of Cholestenix Ltd.
Publisher's Disclaimer: This is a PDF file of an article that has undergone enhancements after acceptance, such as the addition of a cover page and metadata, and formatting for readability, but it is not yet the definitive version of record. This version will undergo additional copyediting, typesetting and review before it is published in its final form, but we are providing this version to give early visibility of the article. Please note that, during the production process, errors may be discovered which could affect the content, and all legal disclaimers that apply to the journal pertain.
References
- 1.Kwart D, Gregg A, Scheckel C, Murphy EA, Paquet D, Duffield M, Fak J, Olsen O, Darnell RB, and Tessier-Lavigne M (2019). A Large Panel of Isogenic APP and PSEN1 Mutant Human iPSC Neurons Reveals Shared Endosomal Abnormalities Mediated by APP beta-CTFs, Not Abeta. Neuron 104, 256–270 e255. 10.1016/j.neuron.2019.07.010. [DOI] [PubMed] [Google Scholar]
- 2.Konttinen H, Cabral-da-Silva MEC, Ohtonen S, Wojciechowski S, Shakirzyanova A, Caligola S, Giugno R, Ishchenko Y, Hernandez D, Fazaludeen MF, et al. (2019). PSEN1DeltaE9, APPswe, and APOE4 Confer Disparate Phenotypes in Human iPSC-Derived Microglia. Stem Cell Reports 13, 669–683. 10.1016/j.stemcr.2019.08.004. [DOI] [PMC free article] [PubMed] [Google Scholar]
- 3.Guttikonda SR, Sikkema L, Tchieu J, Saurat N, Walsh RM, Harschnitz O, Ciceri G, Sneeboer M, Mazutis L, Setty M, et al. (2021). Fully defined human pluripotent stem cell-derived microglia and tri-culture system model C3 production in Alzheimer’s disease. Nat Neurosci 24, 343–354. 10.1038/s41593-020-00796-z. [DOI] [PMC free article] [PubMed] [Google Scholar]
- 4.Doetschman T (2009). Influence of genetic background on genetically engineered mouse phenotypes. Methods Mol Biol 530, 423–433. 10.1007/978-1-59745-471-1_23. [DOI] [PMC free article] [PubMed] [Google Scholar]
- 5.Bonyadi M, Rusholme SA, Cousins FM, Su HC, Biron CA, Farrall M, and Akhurst RJ (1997). Mapping of a major genetic modifier of embryonic lethality in TGF beta 1 knockout mice. Nat Genet 15, 207–211. 10.1038/ng0297-207. [DOI] [PubMed] [Google Scholar]
- 6.Threadgill DW, Dlugosz AA, Hansen LA, Tennenbaum T, Lichti U, Yee D, LaMantia C, Mourton T, Herrup K, Harris RC, and et al. (1995). Targeted disruption of mouse EGF receptor: effect of genetic background on mutant phenotype. Science 269, 230–234. 10.1126/science.7618084. [DOI] [PubMed] [Google Scholar]
- 7.Sterken MG, Snoek LB, Kammenga JE, and Andersen EC (2015). The laboratory domestication of Caenorhabditis elegans. Trends Genet 31, 224–231. 10.1016/j.tig.2015.02.009. [DOI] [PMC free article] [PubMed] [Google Scholar]
- 8.Mackay TFC, and Huang W (2018). Charting the genotype-phenotype map: lessons from the Drosophila melanogaster Genetic Reference Panel. Wiley Interdiscip Rev Dev Biol 7. 10.1002/wdev.289. [DOI] [PMC free article] [PubMed] [Google Scholar]
- 9.Sittig LJ, Carbonetto P, Engel KA, Krauss KS, Barrios-Camacho CM, and Palmer AA (2016). Genetic Background Limits Generalizability of Genotype-Phenotype Relationships. Neuron 91, 1253–1259. 10.1016/j.neuron.2016.08.013. [DOI] [PMC free article] [PubMed] [Google Scholar]
- 10.Roberts B, Haupt A, Tucker A, Grancharova T, Arakaki J, Fuqua MA, Nelson A, Hookway C, Ludmann SA, Mueller IA, et al. (2017). Systematic gene tagging using CRISPR/Cas9 in human stem cells to illuminate cell organization. Mol Biol Cell 28, 2854–2874. 10.1091/mbc.E17-03-0209. [DOI] [PMC free article] [PubMed] [Google Scholar]
- 11.Roberts B, Hendershott MC, Arakaki J, Gerbin KA, Malik H, Nelson A, Gehring J, Hookway C, Ludmann SA, Yang R, et al. (2019). Fluorescent Gene Tagging of Transcriptionally Silent Genes in hiPSCs. Stem Cell Reports 12, 1145–1158. 10.1016/j.stemcr.2019.03.001. [DOI] [PMC free article] [PubMed] [Google Scholar]
- 12.Ramos DM, Skarnes WC, Singleton AB, Cookson MR, and Ward ME (2021). Tackling neurodegenerative diseases with genomic engineering: A new stem cell initiative from the NIH. Neuron 109, 1080–1083. 10.1016/j.neuron.2021.03.022. [DOI] [PMC free article] [PubMed] [Google Scholar]
- 13.Reilly L, Peng L, Lara E, Ramos D, Fernandopulle M, Pantazis CB, Stadler J, Santiana M, Dadu A, Iben J, et al. (2021). A fully automated FAIMS-DIA proteomic pipeline for high-throughput characterization of iPSC-derived neurons. bioRxiv, 2021.2011.2024.469921. 10.1101/2021.11.24.469921. [DOI] [Google Scholar]
- 14.Mekhoubad S, Bock C, de Boer AS, Kiskinis E, Meissner A, and Eggan K (2012). Erosion of dosage compensation impacts human iPSC disease modeling. Cell Stem Cell 10, 595–609. 10.1016/j.stem.2012.02.014. [DOI] [PMC free article] [PubMed] [Google Scholar]
- 15.Bar S, Seaton LR, Weissbein U, Eldar-Geva T, and Benvenisty N (2019). Global Characterization of X Chromosome Inactivation in Human Pluripotent Stem Cells. Cell Rep 27, 20–29 e23. 10.1016/j.celrep.2019.03.019. [DOI] [PubMed] [Google Scholar]
- 16.Hildebrandt MR, Reuter MS, Wei W, Tayebi N, Liu J, Sharmin S, Mulder J, Lesperance LS, Brauer PM, Mok RSF, et al. (2019). Precision Health Resource of Control iPSC Lines for Versatile Multilineage Differentiation. Stem Cell Reports 13, 1126–1141. 10.1016/j.stemcr.2019.11.003. [DOI] [PMC free article] [PubMed] [Google Scholar]
- 17.Robinson E, McKenna MJ, Bedford JS, Goodwin EH, Cornforth MN, Bailey SM, and Ray FA (2019). Directional Genomic Hybridization (dGH) for Detection of Intrachromosomal Rearrangements. Methods Mol Biol 1984, 107–116. 10.1007/978-1-4939-9432-8_13. [DOI] [PubMed] [Google Scholar]
- 18.Huang Y, McCarthy DJ, and Stegle O (2019). Vireo: Bayesian demultiplexing of pooled single-cell RNA-seq data without genotype reference. Genome Biol 20, 273. 10.1186/s13059-019-1865-2. [DOI] [PMC free article] [PubMed] [Google Scholar]
- 19.Halliwell J, Barbaric I, and Andrews PW (2020). Acquired genetic changes in human pluripotent stem cells: origins and consequences. Nat Rev Mol Cell Biol 21, 715–728. 10.1038/s41580-020-00292-z. [DOI] [PubMed] [Google Scholar]
- 20.Merkle FT, Ghosh S, Kamitaki N, Mitchell J, Avior Y, Mello C, Kashin S, Mekhoubad S, Ilic D, Charlton M, et al. (2017). Human pluripotent stem cells recurrently acquire and expand dominant negative P53 mutations. Nature 545, 229–233. 10.1038/nature22312. [DOI] [PMC free article] [PubMed] [Google Scholar]
- 21.Avior Y, Lezmi E, Eggan K, and Benvenisty N (2021). Cancer-Related Mutations Identified in Primed Human Pluripotent Stem Cells. Cell Stem Cell 28, 10–11. 10.1016/j.stem.2020.11.013. [DOI] [PubMed] [Google Scholar]
- 22.Ihry RJ, Worringer KA, Salick MR, Frias E, Ho D, Theriault K, Kommineni S, Chen J, Sondey M, Ye C, et al. (2018). p53 inhibits CRISPR-Cas9 engineering in human pluripotent stem cells. Nat Med 24, 939–946. 10.1038/s41591-018-0050-6. [DOI] [PubMed] [Google Scholar]
- 23.Karczewski KJ, Francioli LC, Tiao G, Cummings BB, Alfoldi J, Wang Q, Collins RL, Laricchia KM, Ganna A, Birnbaum DP, et al. (2020). The mutational constraint spectrum quantified from variation in 141,456 humans. Nature 581, 434–443. 10.1038/s41586-020-2308-7. [DOI] [PMC free article] [PubMed] [Google Scholar]
- 24.Nothen MM, Cichon S, Hemmer S, Hebebrand J, Remschmidt H, Lehmkuhl G, Poustka F, Schmidt M, Catalano M, Fimmers R, and et al. (1994). Human dopamine D4 receptor gene: frequent occurrence of a null allele and observation of homozygosity. Hum Mol Genet 3, 2207–2212. 10.1093/hmg/3.12.2207. [DOI] [PubMed] [Google Scholar]
- 25.Shaheen R, Sebai MA, Patel N, Ewida N, Kurdi W, Altweijri I, Sogaty S, Almardawi E, Seidahmed MZ, Alnemri A, et al. (2017). The genetic landscape of familial congenital hydrocephalus. Ann Neurol 81, 890–897. 10.1002/ana.24964. [DOI] [PubMed] [Google Scholar]
- 26.Kunkle BW, Grenier-Boley B, Sims R, Bis JC, Damotte V, Naj AC, Boland A, Vronskaya M, van der Lee SJ, Amlie-Wolf A, et al. (2019). Genetic meta-analysis of diagnosed Alzheimer’s disease identifies new risk loci and implicates Abeta, tau, immunity and lipid processing. Nat Genet 51, 414–430. 10.1038/s41588-019-0358-2. [DOI] [PMC free article] [PubMed] [Google Scholar]
- 27.Nalls MA, Blauwendraat C, Vallerga CL, Heilbron K, Bandres-Ciga S, Chang D, Tan M, Kia DA, Noyce AJ, Xue A, et al. (2019). Identification of novel risk loci, causal insights, and heritable risk for Parkinson’s disease: a meta-analysis of genome-wide association studies. Lancet Neurol 18, 1091–1102. 10.1016/S1474-4422(19)30320-5. [DOI] [PMC free article] [PubMed] [Google Scholar]
- 28.Skarnes WC, Ning G, Giansiracusa S, Cruz AS, Blauwendraat C, Saavedra B, Holden K, Cookson MR, Ward ME, and McDonough JA (2021). Controlling homology-directed repair outcomes in human stem cells with dCas9. bioRxiv, 2021.2012.2016.472942. 10.1101/2021.12.16.472942. [DOI] [Google Scholar]
- 29.Skarnes WC, Pellegrino E, and McDonough JA (2019). Improving homology-directed repair efficiency in human stem cells. Methods 164–165, 18–28. 10.1016/j.ymeth.2019.06.016. [DOI] [PubMed] [Google Scholar]
- 30.Apte SS, Mattei MG, and Olsen BR (1994). Cloning of the cDNA encoding human tissue inhibitor of metalloproteinases-3 (TIMP-3) and mapping of the TIMP3 gene to chromosome 22. Genomics 19, 86–90. 10.1006/geno.1994.1016. [DOI] [PubMed] [Google Scholar]
- 31.Weisheit I, Kroeger JA, Malik R, Klimmt J, Crusius D, Dannert A, Dichgans M, and Paquet D (2020). Detection of Deleterious On-Target Effects after HDR-Mediated CRISPR Editing. Cell Rep 31, 107689. 10.1016/j.celrep.2020.107689. [DOI] [PubMed] [Google Scholar]
- 32.Merkle FT, Neuhausser WM, Santos D, Valen E, Gagnon JA, Maas K, Sandoe J, Schier AF, and Eggan K (2015). Efficient CRISPR-Cas9-mediated generation of knockin human pluripotent stem cells lacking undesired mutations at the targeted locus. Cell Rep 11, 875–883. 10.1016/j.celrep.2015.04.007. [DOI] [PMC free article] [PubMed] [Google Scholar]
- 33.Blauwendraat C, Faghri F, Pihlstrom L, Geiger JT, Elbaz A, Lesage S, Corvol JC, May P, Nicolas A, Abramzon Y, et al. (2017). NeuroChip, an updated version of the NeuroX genotyping platform to rapidly screen for variants associated with neurological diseases. Neurobiol Aging 57, 247 e249–247 e213. 10.1016/j.neurobiolaging.2017.05.009. [DOI] [PMC free article] [PubMed] [Google Scholar]
- 34.Purcell S, Neale B, Todd-Brown K, Thomas L, Ferreira MA, Bender D, Maller J, Sklar P, de Bakker PI, Daly MJ, and Sham PC (2007). PLINK: a tool set for whole-genome association and population-based linkage analyses. Am J Hum Genet 81, 559–575. 10.1086/519795. [DOI] [PMC free article] [PubMed] [Google Scholar]
- 35.International Stem Cell I, Amps K, Andrews PW, Anyfantis G, Armstrong L, Avery S, Baharvand H, Baker J, Baker D, Munoz MB, et al. (2011). Screening ethnically diverse human embryonic stem cells identifies a chromosome 20 minimal amplicon conferring growth advantage. Nat Biotechnol 29, 1132–1144. 10.1038/nbt.2051. [DOI] [PMC free article] [PubMed] [Google Scholar]
- 36.Laurent LC, Ulitsky I, Slavin I, Tran H, Schork A, Morey R, Lynch C, Harness JV, Lee S, Barrero MJ, et al. (2011). Dynamic changes in the copy number of pluripotency and cell proliferation genes in human ESCs and iPSCs during reprogramming and time in culture. Cell Stem Cell 8, 106–118. 10.1016/j.stem.2010.12.003. [DOI] [PMC free article] [PubMed] [Google Scholar]
- 37.Lefort N, Feyeux M, Bas C, Feraud O, Bennaceur-Griscelli A, Tachdjian G, Peschanski M, and Perrier AL (2008). Human embryonic stem cells reveal recurrent genomic instability at 20q11.21. Nat Biotechnol 26, 1364–1366. 10.1038/nbt.1509. [DOI] [PubMed] [Google Scholar]
- 38.Narva E, Autio R, Rahkonen N, Kong L, Harrison N, Kitsberg D, Borghese L, Itskovitz-Eldor J, Rasool O, Dvorak P, et al. (2010). High-resolution DNA analysis of human embryonic stem cell lines reveals culture-induced copy number changes and loss of heterozygosity. Nat Biotechnol 28, 371–377. 10.1038/nbt.1615. [DOI] [PubMed] [Google Scholar]
- 39.Spits C, Mateizel I, Geens M, Mertzanidou A, Staessen C, Vandeskelde Y, Van der Elst J, Liebaers I, and Sermon K (2008). Recurrent chromosomal abnormalities in human embryonic stem cells. Nat Biotechnol 26, 1361–1363. 10.1038/nbt.1510. [DOI] [PubMed] [Google Scholar]
- 40.Wu H, Kim KJ, Mehta K, Paxia S, Sundstrom A, Anantharaman T, Kuraishy AI, Doan T, Ghosh J, Pyle AD, et al. (2008). Copy number variant analysis of human embryonic stem cells. Stem Cells 26, 1484–1489. 10.1634/stemcells.2007-0993. [DOI] [PMC free article] [PubMed] [Google Scholar]
- 41.Markouli C, Couvreu De Deckersberg E, Regin M, Nguyen HT, Zambelli F, Keller A, Dziedzicka D, De Kock J, Tilleman L, Van Nieuwerburgh F, et al. (2019). Gain of 20q11.21 in Human Pluripotent Stem Cells Impairs TGF-beta-Dependent Neuroectodermal Commitment. Stem Cell Reports 13, 163–176. 10.1016/j.stemcr.2019.05.005. [DOI] [PMC free article] [PubMed] [Google Scholar]
- 42.Lee JH, Park IH, Gao Y, Li JB, Li Z, Daley GQ, Zhang K, and Church GM (2009). A robust approach to identifying tissue-specific gene expression regulatory variants using personalized human induced pluripotent stem cells. PLoS Genet 5, e1000718. 10.1371/journal.pgen.1000718. [DOI] [PMC free article] [PubMed] [Google Scholar]
- 43.Rouhani FJ, Zou X, Danecek P, Badja C, Amarante TD, Koh G, Wu Q, Memari Y, Durbin R, Martincorena I, et al. (2022). Substantial somatic genomic variation and selection for BCOR mutations in human induced pluripotent stem cells. Nat Genet 54, 1406–1416. 10.1038/s41588-022-01147-3. [DOI] [PMC free article] [PubMed] [Google Scholar]
- 44.Fadista J, Oskolkov N, Hansson O, and Groop L (2017). LoFtool: a gene intolerance score based on loss-of-function variants in 60 706 individuals. Bioinformatics 33, 471–474. 10.1093/bioinformatics/btv602. [DOI] [PubMed] [Google Scholar]
- 45.Rehm HL, Berg JS, Brooks LD, Bustamante CD, Evans JP, Landrum MJ, Ledbetter DH, Maglott DR, Martin CL, Nussbaum RL, et al. (2015). ClinGen--the Clinical Genome Resource. N Engl J Med 372, 2235–2242. 10.1056/NEJMsr1406261. [DOI] [PMC free article] [PubMed] [Google Scholar]
- 46.Fenske P, Grauel MK, Brockmann MM, Dorrn AL, Trimbuch T, and Rosenmund C (2019). Autaptic cultures of human induced neurons as a versatile platform for studying synaptic function and neuronal morphology. Sci Rep 9, 4890. 10.1038/s41598-019-41259-1. [DOI] [PMC free article] [PubMed] [Google Scholar]
- 47.Rhee HJ, Shaib AH, Rehbach K, Lee C, Seif P, Thomas C, Gideons E, Guenther A, Krutenko T, Hebisch M, et al. (2019). An Autaptic Culture System for Standardized Analyses of iPSC-Derived Human Neurons. Cell Rep 27, 2212–2228 e2217. 10.1016/j.celrep.2019.04.059. [DOI] [PubMed] [Google Scholar]
- 48.Meijer M, Rehbach K, Brunner JW, Classen JA, Lammertse HCA, van Linge LA, Schut D, Krutenko T, Hebisch M, Cornelisse LN, et al. (2019). A Single-Cell Model for Synaptic Transmission and Plasticity in Human iPSC-Derived Neurons. Cell Rep 27, 2199–2211 e2196. 10.1016/j.celrep.2019.04.058. [DOI] [PubMed] [Google Scholar]
- 49.Takahashi K, Tanabe K, Ohnuki M, Narita M, Ichisaka T, Tomoda K, and Yamanaka S (2007). Induction of pluripotent stem cells from adult human fibroblasts by defined factors. Cell 131, 861–872. 10.1016/j.cell.2007.11.019. [DOI] [PubMed] [Google Scholar]
- 50.Bennett DA, Buchman AS, Boyle PA, Barnes LL, Wilson RS, and Schneider JA (2018). Religious Orders Study and Rush Memory and Aging Project. J Alzheimers Dis 64, S161–S189. 10.3233/JAD-179939. [DOI] [PMC free article] [PubMed] [Google Scholar]
- 51.Umekage M, Sato Y, and Takasu N (2019). Overview: an iPS cell stock at CiRA. Inflamm Regen 39, 17. 10.1186/s41232-019-0106-0. [DOI] [PMC free article] [PubMed] [Google Scholar]
- 52.Jerber J, Seaton DD, Cuomo ASE, Kumasaka N, Haldane J, Steer J, Patel M, Pearce D, Andersson M, Bonder MJ, et al. (2021). Population-scale single-cell RNA-seq profiling across dopaminergic neuron differentiation. Nat Genet 53, 304–312. 10.1038/s41588-021-00801-6. [DOI] [PMC free article] [PubMed] [Google Scholar]
- 53.Mitchell JM, Nemesh J, Ghosh S, Handsaker RE, Mello CJ, Meyer D, Raghunathan K, de Rivera H, Tegtmeyer M, Hawes D, et al. (2020). Mapping genetic effects on cellular phenotypes with “cell villages”. bioRxiv, 2020.2006.2029.174383. 10.1101/2020.06.29.174383. [DOI] [Google Scholar]
- 54.Merkle FT, Ghosh S, Genovese G, Handsaker RE, Kashin S, Meyer D, Karczewski KJ, O’Dushlaine C, Pato C, Pato M, et al. (2022). Whole-genome analysis of human embryonic stem cells enables rational line selection based on genetic variation. Cell Stem Cell 29, 472–486 e477. 10.1016/j.stem.2022.01.011. [DOI] [PMC free article] [PubMed] [Google Scholar]
- 55.Kilpinen H, Goncalves A, Leha A, Afzal V, Alasoo K, Ashford S, Bala S, Bensaddek D, Casale FP, Culley OJ, et al. (2017). Common genetic variation drives molecular heterogeneity in human iPSCs. Nature 546, 370–375. 10.1038/nature22403. [DOI] [PMC free article] [PubMed] [Google Scholar]
- 56.Bruntraeger M, Byrne M, Long K, and Bassett AR (2019). Editing the Genome of Human Induced Pluripotent Stem Cells Using CRISPR/Cas9 Ribonucleoprotein Complexes. Methods Mol Biol 1961, 153–183. 10.1007/978-1-4939-9170-9_11. [DOI] [PubMed] [Google Scholar]
- 57.Tian R, Abarientos A, Hong J, Hashemi SH, Yan R, Drager N, Leng K, Nalls MA, Singleton AB, Xu K, et al. (2021). Genome-wide CRISPRi/a screens in human neurons link lysosomal failure to ferroptosis. Nat Neurosci 24, 1020–1034. 10.1038/s41593-021-00862-0. [DOI] [PMC free article] [PubMed] [Google Scholar]
- 58.Tian R, Gachechiladze MA, Ludwig CH, Laurie MT, Hong JY, Nathaniel D, Prabhu AV, Fernandopulle MS, Patel R, Abshari M, et al. (2019). CRISPR Interference-Based Platform for Multimodal Genetic Screens in Human iPSC-Derived Neurons. Neuron 104, 239–255 e212. 10.1016/j.neuron.2019.07.014. [DOI] [PMC free article] [PubMed] [Google Scholar]
- 59.Li Z, Farias FHG, Dube U, Del-Aguila JL, Mihindukulasuriya KA, Fernandez MV, Ibanez L, Budde JP, Wang F, Lake AM, et al. (2020). The TMEM106B FTLD-protective variant, rs1990621, is also associated with increased neuronal proportion. Acta Neuropathol 139, 45–61. 10.1007/s00401-019-02066-0. [DOI] [PMC free article] [PubMed] [Google Scholar]
- 60.Assou S, Girault N, Plinet M, Bouckenheimer J, Sansac C, Combe M, Mianne J, Bourguignon C, Fieldes M, Ahmed E, et al. (2020). Recurrent Genetic Abnormalities in Human Pluripotent Stem Cells: Definition and Routine Detection in Culture Supernatant by Targeted Droplet Digital PCR. Stem Cell Reports 14, 1–8. 10.1016/j.stemcr.2019.12.004. [DOI] [PMC free article] [PubMed] [Google Scholar]
- 61.el-Deiry WS, Tokino T, Velculescu VE, Levy DB, Parsons R, Trent JM, Lin D, Mercer WE, Kinzler KW, and Vogelstein B (1993). WAF1, a potential mediator of p53 tumor suppression. Cell 75, 817–825. 10.1016/0092-8674(93)90500-p. [DOI] [PubMed] [Google Scholar]
- 62.Yusa K, Zhou L, Li MA, Bradley A, and Craig NL (2011). A hyperactive piggyBac transposase for mammalian applications. Proc Natl Acad Sci U S A 108, 1531–1536. 10.1073/pnas.1008322108. [DOI] [PMC free article] [PubMed] [Google Scholar]
- 63.Ray FA, Zimmerman E, Robinson B, Cornforth MN, Bedford JS, Goodwin EH, and Bailey SM (2013). Directional genomic hybridization for chromosomal inversion discovery and detection. Chromosome Res 21, 165–174. 10.1007/s10577-013-9345-0. [DOI] [PMC free article] [PubMed] [Google Scholar]
- 64.Howe B, Umrigar A, and Tsien F (2014). Chromosome preparation from cultured cells. J Vis Exp, e50203. 10.3791/50203. [DOI] [PMC free article] [PubMed] [Google Scholar]
- 65.Wang K, Li M, and Hakonarson H (2010). ANNOVAR: functional annotation of genetic variants from high-throughput sequencing data. Nucleic Acids Res 38, e164. 10.1093/nar/gkq603. [DOI] [PMC free article] [PubMed] [Google Scholar]
- 66.Bycroft C, Freeman C, Petkova D, Band G, Elliott LT, Sharp K, Motyer A, Vukcevic D, Delaneau O, O’Connell J, et al. (2018). The UK Biobank resource with deep phenotyping and genomic data. Nature 562, 203–209. 10.1038/s41586-018-0579-z. [DOI] [PMC free article] [PubMed] [Google Scholar]
- 67.Gogarten SM, Bhangale T, Conomos MP, Laurie CA, McHugh CP, Painter I, Zheng X, Crosslin DR, Levine D, Lumley T, et al. (2012). GWASTools: an R/Bioconductor package for quality control and analysis of genome-wide association studies. Bioinformatics 28, 3329–3331. 10.1093/bioinformatics/bts610. [DOI] [PMC free article] [PubMed] [Google Scholar]
- 68.Danecek P, Bonfield JK, Liddle J, Marshall J, Ohan V, Pollard MO, Whitwham A, Keane T, McCarthy SA, Davies RM, and Li H (2021). Twelve years of SAMtools and BCFtools. Gigascience 10. 10.1093/gigascience/giab008. [DOI] [PMC free article] [PubMed] [Google Scholar]
- 69.Robinson JT, Thorvaldsdottir H, Wenger AM, Zehir A, and Mesirov JP (2017). Variant Review with the Integrative Genomics Viewer. Cancer Res 77, e31–e34. 10.1158/0008-5472.CAN-17-0337. [DOI] [PMC free article] [PubMed] [Google Scholar]
- 70.Fernandopulle MS, Prestil R, Grunseich C, Wang C, Gan L, and Ward ME (2018). Transcription Factor-Mediated Differentiation of Human iPSCs into Neurons. Curr Protoc Cell Biol 79, e51. 10.1002/cpcb.51. [DOI] [PMC free article] [PubMed] [Google Scholar]
- 71.Kirwan P, Jura M, and Merkle FT (2017). Generation and Characterization of Functional Human Hypothalamic Neurons. Curr Protoc Neurosci 81, 3 33 31–33 33 24. 10.1002/cpns.40. [DOI] [PubMed] [Google Scholar]
- 72.Merkle FT, Maroof A, Wataya T, Sasai Y, Studer L, Eggan K, and Schier AF (2015). Generation of neuropeptidergic hypothalamic neurons from human pluripotent stem cells. Development 142, 633–643. 10.1242/dev.117978. [DOI] [PMC free article] [PubMed] [Google Scholar]
- 73.McGinnis CS, Patterson DM, Winkler J, Conrad DN, Hein MY, Srivastava V, Hu JL, Murrow LM, Weissman JS, Werb Z, et al. (2019). MULTI-seq: sample multiplexing for single-cell RNA sequencing using lipid-tagged indices. Nat Methods 16, 619–626. 10.1038/s41592-019-0433-8. [DOI] [PMC free article] [PubMed] [Google Scholar]
- 74.Lun ATL, Riesenfeld S, Andrews T, Dao TP, Gomes T, participants in the 1st Human Cell Atlas J, and Marioni JC (2019). EmptyDrops: distinguishing cells from empty droplets in droplet-based single-cell RNA sequencing data. Genome Biol 20, 63. 10.1186/s13059-019-1662-y. [DOI] [PMC free article] [PubMed] [Google Scholar]
- 75.Lun AT, McCarthy DJ, and Marioni JC (2016). A step-by-step workflow for low-level analysis of single-cell RNA-seq data with Bioconductor. F1000Res 5, 2122. 10.12688/f1000research.9501.2. [DOI] [PMC free article] [PubMed] [Google Scholar]
- 76.Tirosh I, Izar B, Prakadan SM, Wadsworth MH 2nd, Treacy D, Trombetta JJ, Rotem A, Rodman C, Lian C, Murphy G, et al. (2016). Dissecting the multicellular ecosystem of metastatic melanoma by single-cell RNA-seq. Science 352, 189–196. 10.1126/science.aad0501. [DOI] [PMC free article] [PubMed] [Google Scholar]
- 77.Hao Y, Hao S, Andersen-Nissen E, Mauck WM 3rd, Zheng S, Butler A, Lee MJ, Wilk AJ, Darby C, Zager M, et al. (2021). Integrated analysis of multimodal single-cell data. Cell 184, 3573–3587 e3529. 10.1016/j.cell.2021.04.048. [DOI] [PMC free article] [PubMed] [Google Scholar]
- 78.Bais AS, and Kostka D (2020). scds: computational annotation of doublets in single-cell RNA sequencing data. Bioinformatics 36, 1150–1158. 10.1093/bioinformatics/btz698. [DOI] [PMC free article] [PubMed] [Google Scholar]
- 79.Haghverdi L, Lun ATL, Morgan MD, and Marioni JC (2018). Batch effects in single-cell RNA-sequencing data are corrected by matching mutual nearest neighbors. Nat Biotechnol 36, 421–427. 10.1038/nbt.4091. [DOI] [PMC free article] [PubMed] [Google Scholar]
- 80.McInnes L, Healy J, and Melville J (2018). Umap: Uniform manifold approximation and projection for dimension reduction. arXiv preprint arXiv:1802.03426. [Google Scholar]
- 81.Csárdi G, and Nepusz T (2006). The igraph software package for complex network research.
- 82.Boulting GL, Kiskinis E, Croft GF, Amoroso MW, Oakley DH, Wainger BJ, Williams DJ, Kahler DJ, Yamaki M, Davidow L, et al. (2011). A functionally characterized test set of human induced pluripotent stem cells. Nat Biotechnol 29, 279–286. 10.1038/nbt.1783. [DOI] [PMC free article] [PubMed] [Google Scholar]
- 83.Chen Y, Tristan CA, Chen L, Jovanovic VM, Malley C, Chu PH, Ryu S, Deng T, Ormanoglu P, Tao D, et al. (2021). A versatile polypharmacology platform promotes cytoprotection and viability of human pluripotent and differentiated cells. Nat Methods 18, 528–541. 10.1038/s41592-021-01126-2. [DOI] [PMC free article] [PubMed] [Google Scholar]
- 84.Carles Calatayud, E.M.-P., Sandra Fernández-Gallego, and Patrik Verstreken (n.d.). Modular Generation of Cortical, Striatal and Ventral Midbrain Progenitor Cells v1.
- 85.Kriks S, Shim JW, Piao J, Ganat YM, Wakeman DR, Xie Z, Carrillo-Reid L, Auyeung G, Antonacci C, Buch A, et al. (2011). Dopamine neurons derived from human ES cells efficiently engraft in animal models of Parkinson’s disease. Nature 480, 547–551. 10.1038/nature10648. [DOI] [PMC free article] [PubMed] [Google Scholar]
- 86.Shi Y, Kirwan P, and Livesey FJ (2012). Directed differentiation of human pluripotent stem cells to cerebral cortex neurons and neural networks. Nat Protoc 7, 1836–1846. 10.1038/nprot.2012.116. [DOI] [PubMed] [Google Scholar]
- 87.Arber C, Precious SV, Cambray S, Risner-Janiczek JR, Kelly C, Noakes Z, Fjodorova M, Heuer A, Ungless MA, Rodriguez TA, et al. (2015). Activin A directs striatal projection neuron differentiation of human pluripotent stem cells. Development 142, 1375–1386. 10.1242/dev.117093. [DOI] [PMC free article] [PubMed] [Google Scholar]
- 88.Surmacz B, Fox H, Gutteridge A, Fish P, Lubitz S, and Whiting P (2012). Directing differentiation of human embryonic stem cells toward anterior neural ectoderm using small molecules. Stem Cells 30, 1875–1884. 10.1002/stem.1166. [DOI] [PubMed] [Google Scholar]
- 89.Moya N, Cutts J, Gaasterland T, Willert K, and Brafman DA (2014). Endogenous WNT signaling regulates hPSC-derived neural progenitor cell heterogeneity and specifies their regional identity. Stem Cell Reports 3, 1015–1028. 10.1016/j.stemcr.2014.10.004. [DOI] [PMC free article] [PubMed] [Google Scholar]
- 90.Heinrich L, Zafar F, Morato Torres CA, Singh J, Khan A, Chen MY, Hempel C, Nikulina N, Mulholland J, Braubach O, and Schule B (2022). Multiplex imaging of human induced pluripotent stem cell-derived neurons with CO-Detection by indEXing (CODEX) technology. J Neurosci Methods 378, 109653. 10.1016/j.jneumeth.2022.109653. [DOI] [PubMed] [Google Scholar]
- 91.Zafar FTA; Heinrich L; Singh J; Hempel C; Braubch O; Schuele B (2022). Protocol for CODEX Fixation Steps and Primary Antibody Staining for Induced Pluripotent Stem Cell-Derived Neurons.
- 92.Srinivasaraghavan V, Zafar F, and Schuele B (2022). Gene Expression Analysis in Stem Cell-derived Cortical Neuronal Cultures Using Multi-well SYBR Green Quantitative PCR Arrays. Bio-Protocol 12, e4283. 10.21769/BioProtoc.4283. [DOI] [PMC free article] [PubMed] [Google Scholar]
- 93.Khan TA, Revah O, Gordon A, Yoon SJ, Krawisz AK, Goold C, Sun Y, Kim CH, Tian Y, Li MY, et al. (2020). Neuronal defects in a human cellular model of 22q11.2 deletion syndrome. Nat Med 26, 1888–1898. 10.1038/s41591-020-1043-9. [DOI] [PMC free article] [PubMed] [Google Scholar]
- 94.Schmid B, Holst B, Poulsen U, Jorring I, Clausen C, Rasmussen M, Mau-Holzmann UA, Steeg R, Nuthall H, Ebneth A, and Cabrera-Socorro A (2021). Generation of two gene edited iPSC-lines carrying a DOX-inducible NGN2 expression cassette with and without GFP in the AAVS1 locus. Stem Cell Res 52, 102240. 10.1016/j.scr.2021.102240. [DOI] [PubMed] [Google Scholar]
- 95.Paquet D, Kwart D, Chen A, Sproul A, Jacob S, Teo S, Olsen KM, Gregg A, Noggle S, and Tessier-Lavigne M (2016). Efficient introduction of specific homozygous and heterozygous mutations using CRISPR/Cas9. Nature 533, 125–129. 10.1038/nature17664. [DOI] [PubMed] [Google Scholar]
- 96.McQuade A, Coburn M, Tu CH, Hasselmann J, Davtyan H, and Blurton-Jones M (2018). Development and validation of a simplified method to generate human microglia from pluripotent stem cells. Mol Neurodegener 13, 67. 10.1186/s13024-018-0297-x. [DOI] [PMC free article] [PubMed] [Google Scholar]
- 97.Reifschneider A, Robinson S, van Lengerich B, Gnorich J, Logan T, Heindl S, Vogt MA, Weidinger E, Riedl L, Wind K, et al. (2022). Loss of TREM2 rescues hyperactivation of microglia, but not lysosomal deficits and neurotoxicity in models of progranulin deficiency. EMBO J 41, e109108. 10.15252/embj.2021109108. [DOI] [PMC free article] [PubMed] [Google Scholar]
- 98.Dalby B, Cates S, Harris A, Ohki EC, Tilkins ML, Price PJ, and Ciccarone VC (2004). Advanced transfection with Lipofectamine 2000 reagent: primary neurons, siRNA, and high-throughput applications. Methods 33, 95–103. 10.1016/j.ymeth.2003.11.023. [DOI] [PubMed] [Google Scholar]
- 99.Arber C, Toombs J, Lovejoy C, Ryan NS, Paterson RW, Willumsen N, Gkanatsiou E, Portelius E, Blennow K, Heslegrave A, et al. (2020). Familial Alzheimer’s disease patient-derived neurons reveal distinct mutation-specific effects on amyloid beta. Mol Psychiatry 25, 2919–2931. 10.1038/s41380-019-0410-8. [DOI] [PMC free article] [PubMed] [Google Scholar]
- 100.Sposito T, Preza E, Mahoney CJ, Seto-Salvia N, Ryan NS, Morris HR, Arber C, Devine MJ, Houlden H, Warner TT, et al. (2015). Developmental regulation of tau splicing is disrupted in stem cell-derived neurons from frontotemporal dementia patients with the 10 + 16 splice-site mutation in MAPT. Hum Mol Genet 24, 5260–5269. 10.1093/hmg/ddv246. [DOI] [PMC free article] [PubMed] [Google Scholar]
- 101.Chal J, Al Tanoury Z, Hestin M, Gobert B, Aivio S, Hick A, Cherrier T, Nesmith AP, Parker KK, and Pourquie O (2016). Generation of human muscle fibers and satellite-like cells from human pluripotent stem cells in vitro. Nat Protoc 11, 1833–1850. 10.1038/nprot.2016.110. [DOI] [PubMed] [Google Scholar]
- 102.Gantner CW, Hunt CPJ, Niclis JC, Penna V, McDougall SJ, Thompson LH, and Parish CL (2021). FGF-MAPK signaling regulates human deep-layer corticogenesis. Stem Cell Reports 16, 1262–1275. 10.1016/j.stemcr.2021.03.014. [DOI] [PMC free article] [PubMed] [Google Scholar]
- 103.Coyne AN, Zaepfel BL, Hayes L, Fitchman B, Salzberg Y, Luo EC, Bowen K, Trost H, Aigner S, Rigo F, et al. (2020). G4C2 Repeat RNA Initiates a POM121-Mediated Reduction in Specific Nucleoporins in C9orf72 ALS/FTD. Neuron 107, 1124–1140 e1111. 10.1016/j.neuron.2020.06.027. [DOI] [PMC free article] [PubMed] [Google Scholar]
- 104.Martinez FJ, Pratt GA, Van Nostrand EL, Batra R, Huelga SC, Kapeli K, Freese P, Chun SJ, Ling K, Gelboin-Burkhart C, et al. (2016). Protein-RNA Networks Regulated by Normal and ALS-Associated Mutant HNRNPA2B1 in the Nervous System. Neuron 92, 780–795. 10.1016/j.neuron.2016.09.050. [DOI] [PMC free article] [PubMed] [Google Scholar]
- 105.Gutbier S, Wanke F, Dahm N, Rummelin A, Zimmermann S, Christensen K, Kochl F, Rautanen A, Hatje K, Geering B, et al. (2020). Large-Scale Production of Human iPSC-Derived Macrophages for Drug Screening. Int J Mol Sci 21. 10.3390/ijms21134808. [DOI] [PMC free article] [PubMed] [Google Scholar]
- 106.Schmidt EJ, Funes S, McKeon JE, Morgan BR, Boopathy S, O’Connor LC, Bilsel O, Massi F, Jegou A, and Bosco DA (2021). ALS-linked PFN1 variants exhibit loss and gain of functions in the context of formin-induced actin polymerization. Proc Natl Acad Sci U S A 118. 10.1073/pnas.2024605118. [DOI] [PMC free article] [PubMed] [Google Scholar]
- 107.Tcw J, Wang M, Pimenova AA, Bowles KR, Hartley BJ, Lacin E, Machlovi SI, Abdelaal R, Karch CM, Phatnani H, et al. (2017). An Efficient Platform for Astrocyte Differentiation from Human Induced Pluripotent Stem Cells. Stem Cell Reports 9, 600–614. 10.1016/j.stemcr.2017.06.018. [DOI] [PMC free article] [PubMed] [Google Scholar]
- 108.Novotny R, Langer F, Mahler J, Skodras A, Vlachos A, Wegenast-Braun BM, Kaeser SA, Neher JJ, Eisele YS, Pietrowski MJ, et al. (2016). Conversion of Synthetic Abeta to In Vivo Active Seeds and Amyloid Plaque Formation in a Hippocampal Slice Culture Model. J Neurosci 36, 5084–5093. 10.1523/JNEUROSCI.0258-16.2016. [DOI] [PMC free article] [PubMed] [Google Scholar]
- 109.Mayer D, Fischer H, Schneider U, Heimrich B, and Schwemmle M (2005). Borna disease virus replication in organotypic hippocampal slice cultures from rats results in selective damage of dentate granule cells. J Virol 79, 11716–11723. 10.1128/JVI.79.18.11716-11723.2005. [DOI] [PMC free article] [PubMed] [Google Scholar]
- 110.Takata K, Kozaki T, Lee CZW, Thion MS, Otsuka M, Lim S, Utami KH, Fidan K, Park DS, Malleret B, et al. (2017). Induced-Pluripotent-Stem-Cell-Derived Primitive Macrophages Provide a Platform for Modeling Tissue-Resident Macrophage Differentiation and Function. Immunity 47, 183–198 e186. 10.1016/j.immuni.2017.06.017. [DOI] [PubMed] [Google Scholar]
- 111.Bankhead P, Loughrey MB, Fernandez JA, Dombrowski Y, McArt DG, Dunne PD, McQuaid S, Gray RT, Murray LJ, Coleman HG, et al. (2017). QuPath: Open source software for digital pathology image analysis. Sci Rep 7, 16878. 10.1038/s41598-017-17204-5. [DOI] [PMC free article] [PubMed] [Google Scholar]
- 112.Kim TW, Piao J, Koo SY, Kriks S, Chung SY, Betel D, Socci ND, Choi SJ, Zabierowski S, Dubose BN, et al. (2021). Biphasic Activation of WNT Signaling Facilitates the Derivation of Midbrain Dopamine Neurons from hESCs for Translational Use. Cell Stem Cell 28, 343–355 e345. 10.1016/j.stem.2021.01.005. [DOI] [PMC free article] [PubMed] [Google Scholar]
- 113.Sarrafha L, Parfitt GM, Reyes R, Goldman C, Coccia E, Kareva T, and Ahfeldt T (2021). High-throughput generation of midbrain dopaminergic neuron organoids from reporter human pluripotent stem cells. STAR Protoc 2, 100463. 10.1016/j.xpro.2021.100463. [DOI] [PMC free article] [PubMed] [Google Scholar]
Associated Data
This section collects any data citations, data availability statements, or supplementary materials included in this article.
Supplementary Materials
Table S1. Selection, cloning and expansion, and growth and genomic integrity analysis of 8 iPSC sub-lines in this study. Related to Figure 1.
Table S2. Whole genome sequencing analysis of the 8 lead iPSC sub-lines, and deeper analysis of KOLF2.1J. Related to Figures 2 and 5.
Table S3. Array-based genotyping of parental and gene-edited iPSC sub-lines. Related to Figures 2 and 3.
Table S4. Summary of iPSC sub-line selection from genotypic and phenotypic analysis. Related to Figures 5 and 6.
Table S5. List of contributing investigators for KOLF2.1J use case and comparative studies. Related to Figure 6.
Table S6. Characterization of differentiation efficiency by single-cell RNA sequencing. Related to Figure 4.
Data Availability Statement
Whole genome sequencing and single-cell RNA-sequencing data have been deposited to the Alzheimer’s Disease Workbench and are publicly available as of the date of publication at https://doi.org/10.34688/KOLF2.1J.2021.12.14. The DOI is also listed in the Key Resource Table
All original code has been deposited on Github and is publicly available as of the date of publication. DOIs are also listed in the Key Resources Table.
Cell culture maintenance and Piggybac-TO-NGN2 transfection protocols are available on Protocols.IO at https://dx.doi.org/10.17504/protocols.io.n2bvjxm2nlk5/v1 and https://dx.doi.org/10.17504/protocols.io.q26g744b1gwz/v1, respectively. DOIs are also listed in the Key Resources Table.