

Abstract
Cigarette use remains the leading preventable cause of premature mortality in the US, with declines in smoking rates slowing in recent years. One promising target for improved tobacco control is the expanded regulation of tobacco retailers. Evaluations of such policy attempts have largely produced mixed results to date. The objective of this study was to the assess the potential of using a novel, residentially-focused zoning approach to produce a more targeted and equitable reduction in tobacco retailers in high-risk urban settings. We focused on Wilmington, Delaware, a city characterized by high poverty rates, a majority Black population, a disparate number of tobacco retailers, and an elevated smoking prevalence. Through the use of geospatial analyses, we observed disproportionately higher counts of convenience store tobacco retailers in medium- and high-density residential zones in Wilmington relative to the surrounding county. By linking electronic health record (EHR) data from a local health care system and US Census Bureau data, we further found that approximately 80% of Wilmington smokers and 60% of Wilmington youth lived in these residential zones. These findings highlight the potential to more equitably reduce tobacco retailer exposure through a residentially-focused zoning approach. Tobacco control policy and research implications are considered.
Keywords: tobacco retailers, zoning, built environment, smoking, geospatial
INTRODUCTION
Despite more than 50 years of significant progress in tobacco control through the implementation of marketing bans, excise taxes, anti-smoking messaging aimed at shifting social norms, and the dissemination of smoking cessation interventions (U.S. Department of Health and Human Services, 2014; United States Public Health Service, 1964), smoking remains the leading preventable cause of premature mortality in the US (The US Burden of Disease Collaborators, 2018). Smoking currently claims nearly half a million US lives each year (Lariscy, Hummer, & Rogers, 2018), reducing life expectancy among those who smoke by at least a decade (Jha et al., 2013). Declines in smoking rates have slowed in recent years and, absent improved tobacco control, it is projected that approximately 20 million US adults will be current smokers 50 years henceforth (Jeon et al., 2018).
One promising target for improved tobacco control is the expanded regulation of retailers licensed to sell cigarettes (i.e., tobacco retailers). More than 80% of the tobacco industry’s marketing budget, nearly $7 billion annually, is allocated to point-of-sale advertising and retailer price discounts in the US, negating the effects of marketing bans and tobacco excise taxes (Federal Trade Commission, 2016). There is also evidence that for adolescents, living in areas with a high density of tobacco retailers contributes to pro-smoking attitudes (West et al., 2010) and a greater initiation of cigarette smoking (Marsh et al., 2020; Robertson, McGee, Marsh, & Hoek, 2015). Among adults who currently smoke, living in proximity to tobacco retailers can trigger cravings and increased smoking (Kirchner et al., 2013) and has been prospectively associated with a lower likelihood of smoking cessation (Chaiton, Mecredy, & Cohen, 2018; Clemens, Dibben, Pearce, & Shortt, 2020; Pulakka et al., 2016). Taken together, the evidence suggests that exposure to tobacco retailers can undermine the tobacco control measures most credited for reductions in smoking rates.
Nationwide research demonstrates that the greatest concentration of tobacco retailers is found in urban locations, particularly communities low in socioeconomic status (SES) and predominantly composed of racial and ethnic minorities (Rodriguez, Carlos, Adachi-Mejia, Berke, & Sargent, 2013). Comparably, more than seven in ten adults who currently smoke can be classified as having low SES (Levinson, 2017). This juxtaposition of these statistics often raises the so-called “chicken or the egg” question (Schneider, Reid, Peterson, Lowe, & Hughey, 2005): does a greater demand for cigarettes lead to more retailers or do more retailers drive higher smoking rates? In an effort to resist further regulation and limit liability, the tobacco industry has repeatedly claimed that tobacco retailers concentrate in low SES urban communities primarily in response to a greater demand for cigarettes (Risi & Proctor, 2019). However, contrary to the demand-side hypothesis, three converging lines of evidence instead suggest that the tobacco industry deliberately employs supply-side strategies (e.g., subsidizing tobacco retailers) to establish and maintain demand for tobacco products in low SES and segregated communities (Callard & Collishaw, 2013).
First, when the first Surgeon General report on smoking was published in 1964, prior to the implementation of comprehensive tobacco control policies, smoking rates did not vary by SES (Drope et al., 2018). Since then, smoking prevalence has decreased nationally year-over-year, reflecting the success of tobacco control; however, progress has been much slower for low SES groups (U.S. Department of Health and Human Services, 2014). This appears to indicate that demand for cigarettes does not intrinsically vary as a function of SES and, more accurately, tobacco control has been less effective for low-SES groups. Second, an analysis of what were previously undisclosed internal tobacco industry documents produced during the 1970s-1990s revealed a deliberate and sustained effort to target low SES and minority populations in urban settings via retail and other place-based marketing strategies (Yerger, Przewoznik, & Malone, 2007). What is more, the tobacco industry had deemed Black urban residents to be a demographic that required tailored and aggressive marketing strategies in order to reach, further betraying the idea that differences in smoking rates primarily reflect demand-side factors. Third, with regard to smoking cessation, the evidence shows that persons of low SES who smoke are no less interested in quitting and make just as many quit attempts as their more advantaged peers (Kotz & West, 2009). However, these individuals report facing significantly greater barriers to achieving cessation and specifically cite easy access to tobacco products and pro-smoking norms within their communities (Twyman, Bonevski, Paul, & Bryant, 2014). Given the limited options residents in low SES communities have to buy groceries and other essential goods, they often have to rely on convenience “corner stores” where exposure to tobacco products is unavoidable (Caspi et al., 2017).
This body of evidence has prompted increasing calls to implement new supply-side tobacco control policies designed to reduce the number of tobacco retailers, particularly in low SES and predominant racial/ethnic minority urban settings (Ackerman, Etow, Bartel, & Ribisl, 2017). That is, if the tobacco industry’s use of supply-side strategies does, in fact, contribute to the observed SES disparities in smoking rates over and above any demand-side factors (e.g., the use of tobacco to cope with the stresses associated with living in poor communities), then tobacco reduction policies can potentially help to close this gap. Thus far, evaluations of tobacco reduction policies implemented by city governments through a variety of approaches have produced mixed findings (Glasser & Roberts, 2020).
In 2018 New York City passed a tobacco-free pharmacy law, which produced a nearly 7% citywide reduction in tobacco retailer density, defined as the number of retailers per 1000 residents (Giovenco, Spillane, Mauro, & Hernández, 2019). However, this law disproportionately benefitted communities with higher proportions of high SES and non-Hispanic white residents where pharmacies made up a greater proportion of tobacco retailers. In lower SES areas, by contrast, convenience stores or bodegas and other non-pharmacy businesses constitute a larger share of tobacco retailers. The San Francisco Board of Supervisors used a different approach in 2015 when it issued a new citywide ordinance to cap the density of newly licensed tobacco retailers in each of its districts (Vyas, Sturrock, & Ling, 2020). As was the case in New York City, Vyas and colleagues also found evidence of an inequitable reduction in tobacco retailers, which was explained by differences in zoning across the San Francisco districts. Specifically, tobacco retailer reductions were larger in primarily commercial districts compared to districts with a greater share of residential uses. Finally, in 2016 the Philadelphia Board of Health implemented a more comprehensive approach to reducing new tobacco retailers that produced about a 20% reduction in retailer density (Lawman et al., 2020). Contrary to the experience in New York City and San Francisco, Lawman and colleagues observed that the relative reduction in retailer density in Philadelphia was modestly but significantly greater in low-income districts, perhaps reflecting the more comprehensive approach taken by the Board of Health. Nevertheless, tobacco retailer density in low-income districts remained considerably higher than even the density levels observed in districts designated as not low-income prior to the implementation of the policy. The mixed results from these evaluations underscore the importance of considering tobacco retailer and zoning characteristics when developing tobacco retailer reduction policies. Until more effective tobacco retailer reduction policy approaches are crafted, it would be premature to assess their impact on smoking prevalence.
Toward that end, the objective of this study was to the assess the potential of using a novel zoning law approach to produce a more targeted and equitable reduction in tobacco retailers in low SES, predominant racial/ethnic minority urban settings. That is, regulating the use of property to restrict tobacco sales specifically in residential areas may overcome the limitations previously observed for tobacco-free pharmacy laws and citywide density approaches. In addition, zoning laws fall within the jurisdiction of city governments, where tobacco retailer density is typically the greatest (Ackerman et al., 2017). We focused on the use case of the city of Wilmington in New Castle County, Delaware for three reasons. First, Wilmington is representative of other small to medium post-industrial US cities, including its high rate of poverty and majority Black population (NYU Langone Health Department of Population Health, 2020). Second, consistent with national studies demonstrating racial and socioeconomic disparities in tobacco retailer exposure, prior research observed significantly higher rates of tobacco retailer density and smoking prevalence in Wilmington relative to the surrounding county (Siegel, Brooks, Gbadebo, & Laughery, 2019). Third, more than 90% of acute health care in New Castle County is provided by a single health care system (Delaware Health Statistics Center, 2018), which allows for the linkage of area-level tobacco retailer data with patient-level smoking status data. This permits an examination of the relationship between exposure to tobacco retailers and smoking behavior that would otherwise not be possible.
We began our assessment by conducting a geospatial analysis of tobacco retailers by subtype (e.g., convenience stores, pharmacies, liquor stores) and zoning category (e.g., residential, commercial) for Wilmington and other municipalities across the surrounding New Castle County. This helped to establish whether residentially zoned areas warrant targeted tobacco retailer regulation, particularly in low SES and predominant minority municipalities. We then linked patient-level smoking status data from the electronic health record (EHR) of a local health system that provides the vast majority of acute health care in the region. This allowed us to assess the potential of residential zoning regulation to reduce tobacco retailer exposure for individuals who currently use tobacco, potentially facilitating smoking cessation, as well as individuals who formerly used tobacco and are at risk of relapse. Finally, we linked US Census Bureau data to estimate the proportion of Wilmington youth who lived in residential areas to assess the potential impact of zoning policy on smoking initiation among minors. The results of this study can inform the design, implementation, and evaluation of novel policy approaches to more equitable tobacco control.
METHODS
Study Data
Area-level socioeconomic data.
Data from the U.S. Census Bureau’s American Community Survey 5-year estimates were used to describe the population socioeconomic characteristics of each municipal and non-municipal area, including poverty, educational attainment, unemployment, and household income (U.S. Census Bureau, 2021).
Tobacco retailers.
A public state business license database was used to create a directory of establishments with a tobacco retail license that sell directly to consumers (i.e., excluding cigarette affixing agents, wholesalers, internet retailers, and tobacco manufacturers). This database included all establishments with a tobacco retail license issued by Delaware’s Division of Revenue as of April 17, 2019 (Delaware Division of Revenue, 2019). Twenty-two tobacco retailers (3% of county total) were removed because they were located in seven municipalities that were excluded from analysis due to small population size and low tobacco retailer counts. The database was reviewed to remove duplicates and ensure the address corresponded to the storefront. Retailers were then manually classified into one of seven subtypes: gas station convenience stores, convenience stores that do not sell gas, drug stores/pharmacies, grocery stores/supermarkets, liquor stores, tobacco shops, and “other” retailers. These were first classified using a list of common trade names among each subtype, and then by key words in retailers’ trade names (e.g., establishments with “liquor” in the trade name were categorized as liquor stores). Remaining retailers were searched online and classified according to the description listed on their website or in Google Maps. Retailers were geocoded using ArcGIS 10.6 (match rate = 100%, N=620).
Zoning.
Geographic information system (GIS) shapefiles containing municipal zoning information were obtained from New Castle County GIS Services (Division of GIS Services, 2020). New Castle County includes 12 municipalities that establish their own zoning codes, and the remaining land area outside these municipalities is zoned by the county government (hereafter referred to as non-municipal areas). In order to compare Wilmington to the surrounding county, we conducted analyses on Wilmington, the next two most populous municipalities (Newark and Middletown), and the county’s non-municipal areas. Collectively, these areas capture 94% of the county population, 98% of county land, and 97% of county tobacco retailers (U.S. Census Bureau, 2021). Wilmington, Newark, Middletown and New Castle County each independently zone the areas in their jurisdictions; therefore, zoning classifications required standardization for analysis. All zoning classifications were manually recoded according to their general use category as follows: residential, mobile homes, commercial/office, manufacturing/industrial, open space/natural area/agriculture, and university. Residential use zones were further classified as low-, medium-, or high-density according to the housing types and use restrictions specified in each municipality’s zoning code (Middletown, Delaware, 2021; New Castle County, Delaware, 2021; Newark, Delaware, 2021; Wilmington, Delaware, 2021). Low-density residential zones specified single-family detached and semi-detached housing structures and minimum lot sizes. Medium-density residential zones specified semi-detached and attached housing structures, including town houses and row houses; in addition, commercial uses are permitted for ground floor corner properties. High-density residential zones specified apartment building structures; sale of convenience commodities or services are also permitted.
Patient smoking status data.
Point-level smoking data are not available from public datasets. Therefore, smoking status data came from the EHR utilized by the Christiana Care Health System, which is headquartered in New Castle County, Delaware. The Christiana Care Health System operates two acute care hospitals in the county that together account for 1,227 inpatient beds. These two hospitals provide nearly 90% of non-veteran adult acute care in New Castle County (45,278 hospital discharges/51,262 total discharges) (Delaware Health Statistics Center, 2018). This study drew on data for the 20,310 adult New Castle County residents who were admitted to an inpatient unit between July 1, 2018 and June 30, 2019. Patients were classified into current (daily or non-daily), former, or never smoker categories based on a standardized nurse-administered interview conducted at admission and documented in the EHR. For patients with multiple admissions, the last known smoking status was utilized. In order to focus on implications for smoking cessation among current smokers and the risk of relapse among former smokers, only the subset of patients with a history of smoking (N=10,117) were included in this study, comprised of current (N=3,749) and former (N=6,368) smokers. Patient addresses were manually cleaned and geocoded using ArcGIS 10.6, yielding a match rate of 98% (10,117/10,350). Of the 233 unmatched patients, 208 had no address information and 25 had addresses that were not locatable. The analysis sample was reduced to 9,747 patients (3,595 current smokers and 6,152 current smokers) after removal of those who lived outside of Wilmington, Newark, Middletown, and non-municipal New Castle County. We consider this to be a conservative estimate of the numbers of current and former smokers in the areas examined.
Analytic Plan
Descriptive statistics were used to characterize the spatial distribution of tobacco retailer counts (i.e., the number of tobacco retailers) by municipality for retailer subtype, the zoning type in which they were located, and by location on or near major roadways (defined as within 30 m of a state, interstate, or US route). Fisher’s exact tests and post-hoc pairwise comparisons with Bonferroni-adjusted p-values were used to examine significant differences in retailer counts between municipalities. These data were then visualized using choropleth maps that depict zoning types and point-level tobacco retailer locations.
Ratios of observed to expected tobacco retailer counts by zoning type and municipality were calculated to determine if the distribution of retailer counts within zoning types significantly differed from that of the county at large. Expected counts of tobacco retailers within municipality zoning types were calculated based on the proportion of total county retailers located in each zoning type.
Current and former smokers were aggregated to the municipality and zoning type in which their homes were located, and their spatial distributions were summarized using descriptive statistics and maps. The distribution of Wilmington smokers was visualized using spatial intensity, a spatial statistical tool used to characterize spatial variation in the concentration of point-level events (e.g., smokers’ home locations). This method estimates the expected number of smokers per unit area at any given point location across the study region, which is visualized as a spatially continuous “heat map” (P. Diggle, 1985; P. J. Diggle, 2003). The spatial intensity map was then overlaid with zoning types and tobacco retailers to depict how these spatially co-vary with smokers.
The youth population in Wilmington residential zones was estimated to determine what percentage of the city’s total youth population may experience higher tobacco retail exposure based on the zoning type in which they live. Youth population counts were assigned to zones containing residential populations (low-, medium-, and high-density residential, and commercial/office zones) proportional to their area overlap with census block groups that contained youth population counts obtained from the US Census Bureau’s American Community Survey (U.S. Census Bureau, 2021).
RESULTS
Area-level Socioeconomic Characteristics
Table 1 presents descriptive statistics for the socioeconomic characteristics by municipality. Relative to other areas, Wilmington had the highest rates of residents 1) living below the poverty line (26.0%), 2) who did not have a high school diploma (12.3%), and 3) experienced unemployment (8.4%). The distributions of household income mirrored this pattern.
Table 1.
Socioeconomic characteristics by municipality, New Castle County, DE
| Non-municipal New Castle Countya | Wilmington | Newark | Middletown | |
|---|---|---|---|---|
| Living below poverty level, n (%)b | 32480 (8.3) | 17675 (26.0) | 6244 (23.6) | 1345 (6.3) |
| No high school diploma, n (%)c | 22338 (8.0) | 5964 (12.3) | 592 (3.6) | 780 (5.4) |
| Unemployed, n (%)d | 17992 (5.6) | 4708 (8.4) | 1335 (4.4) | 1169 (7.0) |
| Household income, n (%) | ||||
| Under $25,000 | 17647 (12.1) | 9074 (31.5) | 2760 (25.7) | 663 (8.6) |
| $25,000–50,000 | 25486 (17.5) | 6539 (22.7) | 2029 (18.9) | 1226 (15.9) |
| $50,000–75,000 | 24094 (16.5) | 4523 (15.7) | 1621 (15.1) | 1388 (18.0) |
| $75,000–100,000 | 22585 (15.5) | 2938 (10.2) | 1364 (12.7) | 1233 (16.0) |
| $100,000–150,000 | 27590 (18.9) | 3082 (10.7) | 1396 (13.0) | 1480 (19.2) |
| $150,000 or more | 28657 (19.6) | 2621 (9.1) | 1557 (14.5) | 1704 (22.1) |
Non-municipal New Castle County excludes Wilmington, Newark, Middletown, Bellefonte, Elsmere, Newport, New Castle, Delaware City, Odessa, Townsend, Clayton, and Smyrna
Poverty status defined for the civilian non-institutionalized population
Educational attainment defined for the population age 25 and older
Employment status defined for the civilian population age 16 and older
Tobacco Retailer Counts by Zoning Type and Municipality
As summarized in Table 2, there were 620 tobacco retailers in New Castle County (excluding those areas not included in the analysis). Wilmington accounted for 169 retailers or approximately 27% of the county total; for comparison, Wilmington accounts for approximately 15% of the county population (U.S. Census Bureau, 2021). The largest share of retailers was located in commercial/office zoning type for all municipal and non-municipal areas in New Castle County. However, this proportion was significantly lower in Wilmington (59.2%) relative to the other municipal and non-municipal areas, where the proportions were all over 90% (p<0.001, fisher’s exact test, post-hoc comparison p-values <0.05). Conversely, Wilmington had about a tenfold greater proportion of retailers located in residential zones (40.8%) relative to the other municipal and non-municipal areas (3.1–4.9%). When examined by residential zone subtype, the largest share of tobacco retailers in Wilmington were located in medium- (34.3%) and high-density (5.9%) residential zones. The proportions of retailers in medium- and high-density residential zones in other municipal and non-municipal areas ranged from 0 to 2.4%.
Table 2.
Tobacco retailers by zone, retailer type, and municipality, New Castle County, DE
| Non-municipal New Castle County tobacco retailersa
(N=385) |
Wilmington tobacco retailers (N=169) |
Newark tobacco retailers (N=41) |
Middletown tobacco retailers (N=25) |
Total tobacco retailers (N=620) |
|
|---|---|---|---|---|---|
| Tobacco retailers by zone, n (%) | |||||
| Low-density residential | 9 (2.3) | 1 (0.6) | 1 (2.4) | 1 (4.0) | 12 (1.9) |
| Medium-density residential | 3 (0.8) | 58 (34.3) | -- | -- | 61 (1.8) |
| High-density residential | -- | 10 (5.9) | 1 (2.4) | -- | 11 (1.8) |
| Mobile homes | -- | -- | -- | -- | -- |
| Commercial/office | 366 (95.1) | 100 (59.2) | 38 (92.7) | 23 (92.0) | 527 (85.0) |
| Manufacturing/industrial | 4 (1.0) | -- | -- | 1 (4.0) | 5 (0.8) |
| Open space/natural area/agriculture | 3 (0.8) | -- | 1 (2.4) | -- | 4 (0.6) |
| Tobacco retailers by type, n (%) | |||||
| Convenience store (gas) | 79 (20.5) | 11 (6.5) | 4 (9.8) | 5 (20.0) | 99 (16.0) |
| Convenience store (non-gas) | 70 (18.2) | 84 (49.7) | 6 (14.6) | 2 (8.0) | 162 (26.1) |
| Drug store/pharmacy | 50 (13.0) | 6 (3.6) | 4 (9.8) | 3 (12.0) | 63 (10.2) |
| Grocery store/supermarket | 26 (6.8) | 2 (1.2) | 3 (7.3) | 3 (12.0) | 34 (5.5) |
| Liquor store | 81 (21.0) | 37 (21.9) | 9 (22.0) | 7 (28.0) | 134 (21.6) |
| Other | 27 (7.0) | 22 (13.0) | 4 (9.8) | 3 (12.0) | 56 (9.0) |
| Tobacco shop | 52 (13.5) | 7 (4.1) | 11 (26.8) | 2 (8.0) | 72 (11.6) |
| Located on major roads, n (%)b | 271 (70.4) | 98 (58.0) | 28 (68.3) | 21 (84.0) | 418 (67.4) |
| Located in residential zones, n (%)c | 12 (3.1) | 69 (40.8) | 2 (4.9) | 1 (4.0) | 84 (13.5) |
Non-municipal New Castle County excludes Wilmington, Newark, Middletown, Bellefonte, Elsmere, Newport, New Castle, Delaware City, Odessa, Townsend, Clayton, and Smyrna
Defined as within 30 meters of a state, interstate, or U.S. route
Residential zones include low-, medium-, and high-density residential zones
Figures 1 and 2 help to visualize these descriptive statistics. Outside Wilmington, these maps depict how nearly all tobacco retailers were located in commercially zoned areas. In Wilmington, by contrast, a large number of tobacco retailers were embedded within medium-density, and to a lesser extent high-density, residential zones. In addition, even where tobacco retailers were concentrated in Wilmington commercial districts (e.g., along major roadways), these areas were in relatively close proximity to residential zones. In the other municipal and non-municipal areas, there was typically more of a buffer area between tobacco retailers located in commercial districts and residential areas.
Figure 1.
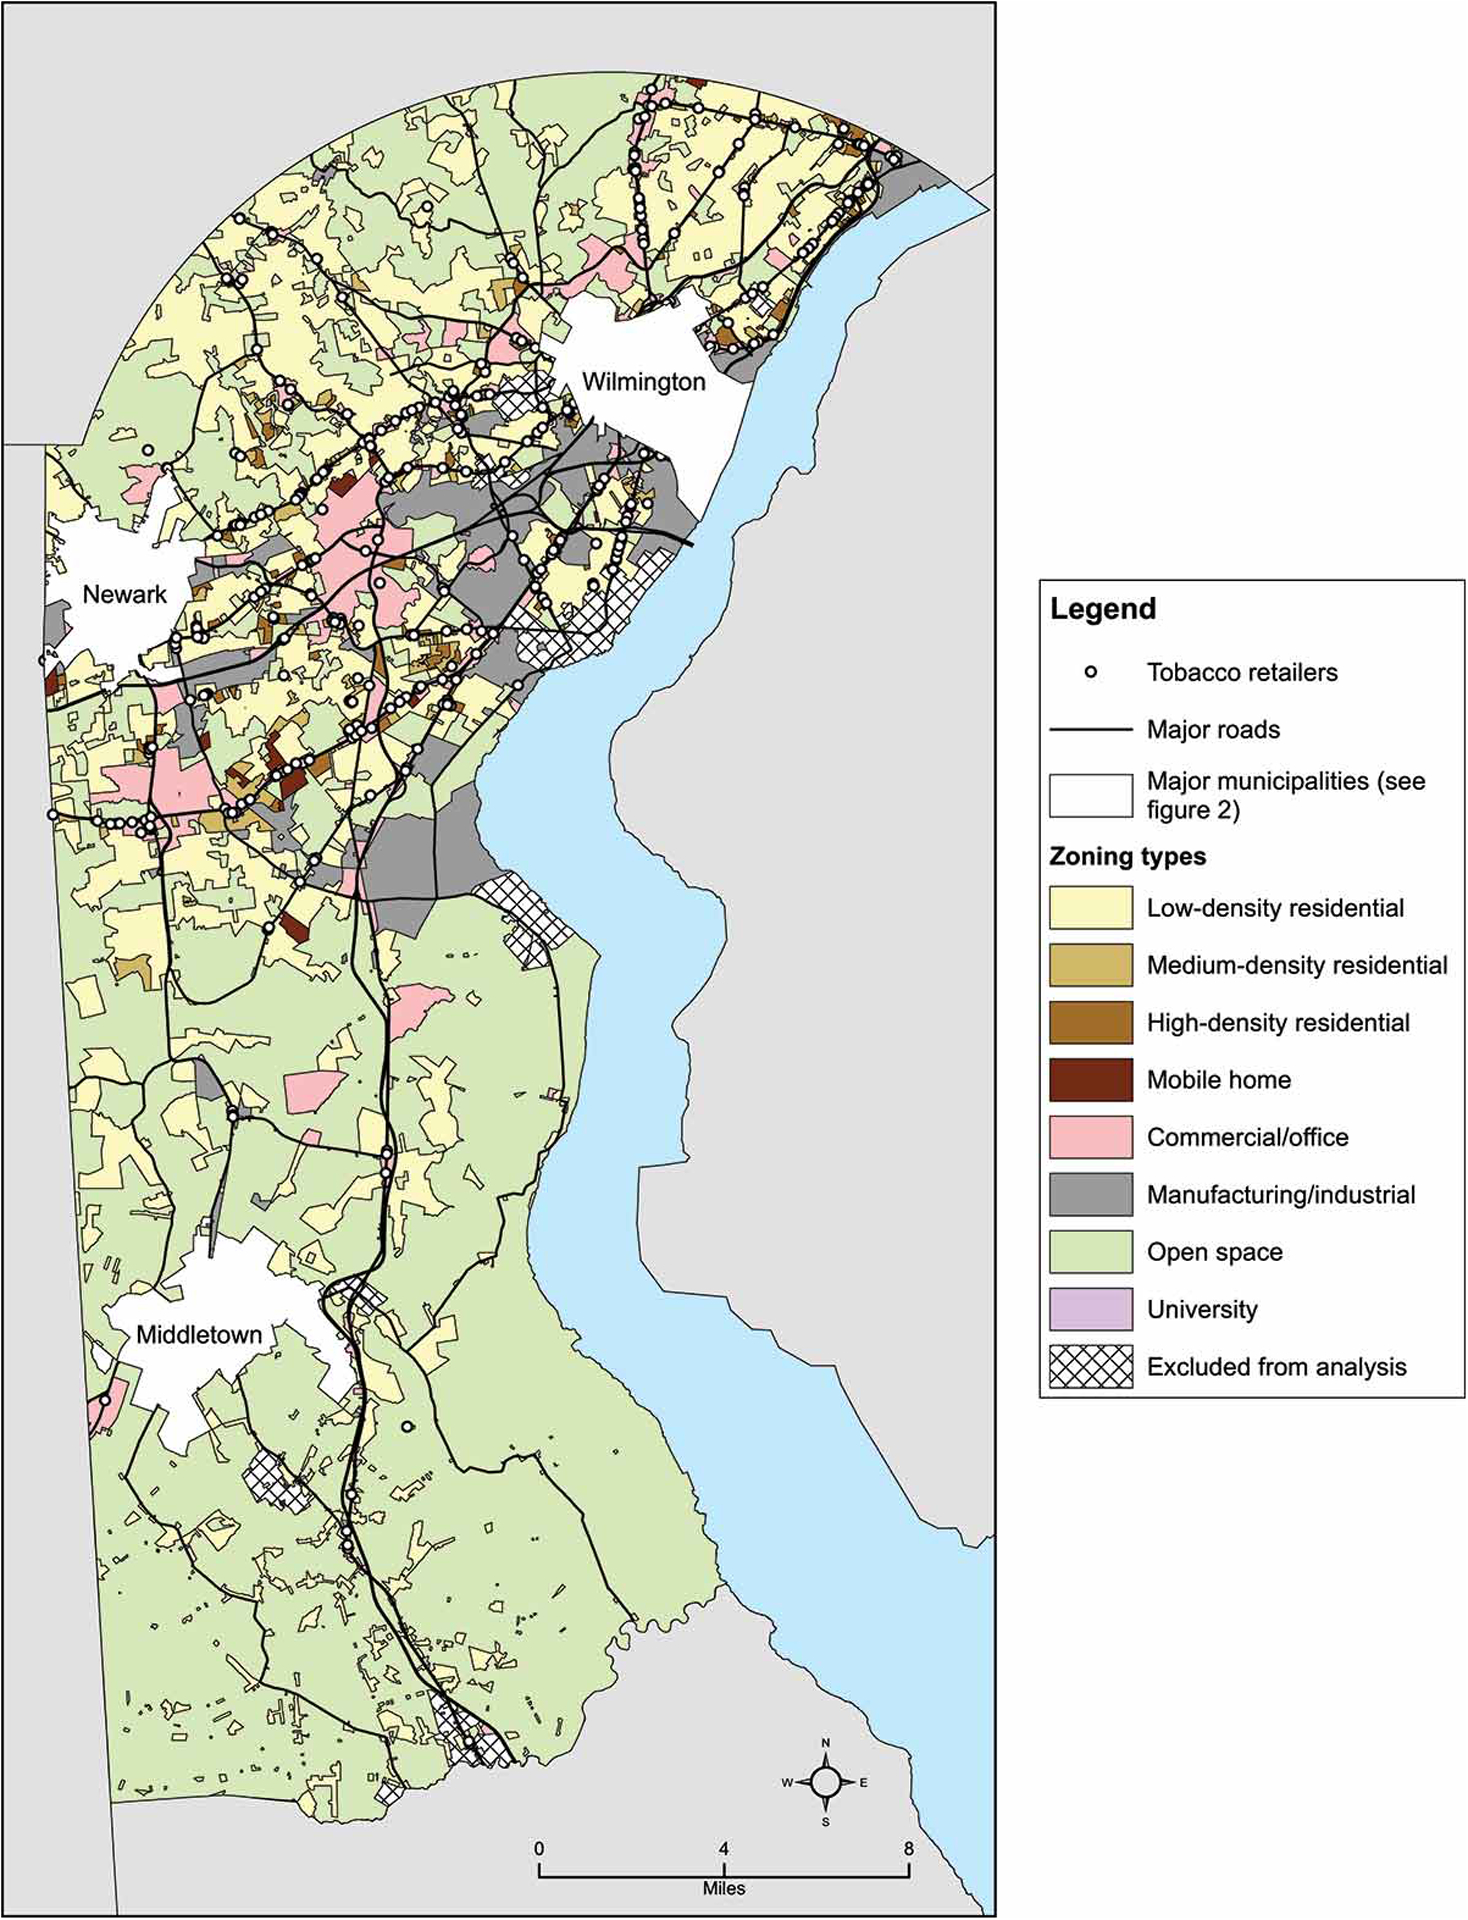
Tobacco retailers and zoning types in non-municipal New Castle County, DE. Tobacco retailers are concentrated along major roads and in commercial/office zones across the county.
Figure 2.
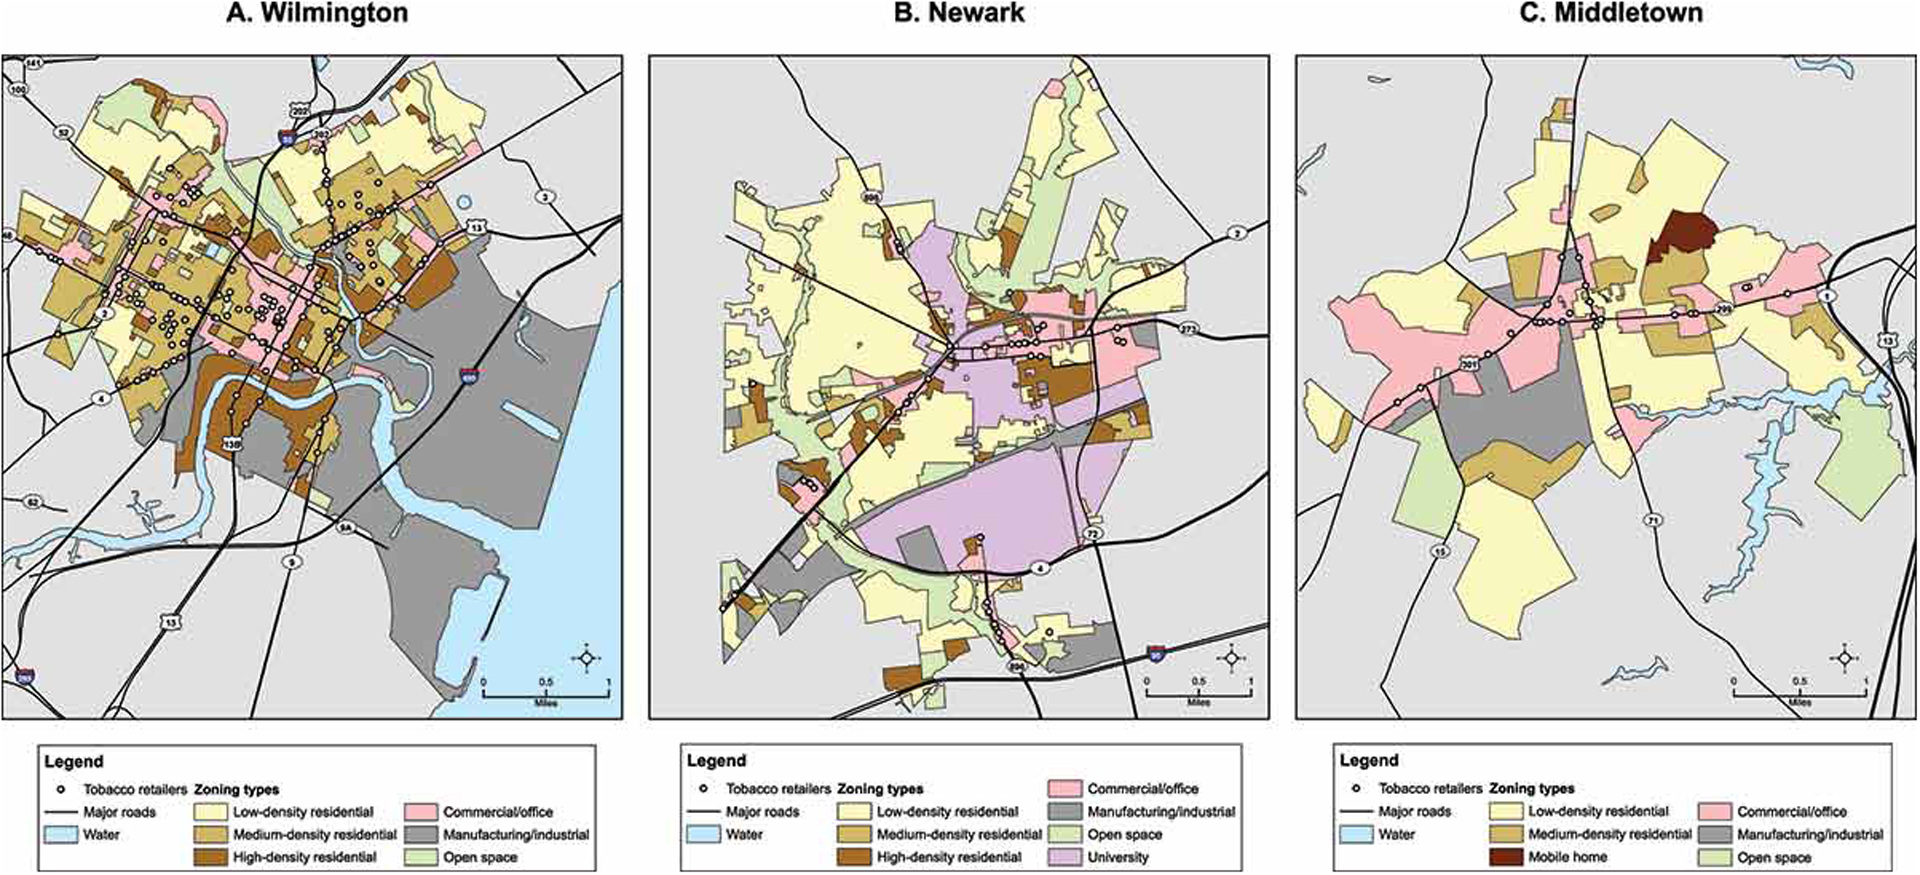
Tobacco retailers and zoning types by municipality in New Castle County, DE. Wilmington (A) has a larger share of land zoned for medium- and high-density residential use, and tobacco retailers located within these zones, compared to Newark (B) and Middletown (C).
Tobacco Retailer Subtype by Municipality
When examining retailer subtype by municipality (see Table 2), nearly 50% of Wilmington’s retailers were convenience stores (non-gas), which was between two and six times higher than those observed for other municipal and non-municipal areas in New Castle County. Wilmington had a lower proportion of convenience store (gas), drug store/pharmacy, grocery store/supermarket, and tobacco shop retailers than other municipal and non-municipal areas, collectively reflecting 15.4% of all Wilmington tobacco retailers compared to more than 50% for other municipal and non-municipal areas in the county. The proportion of total retailers represented by liquor stores were comparable across geographic areas. Finally, despite having at least as many major roadways as the other municipal areas, Wilmington had the lowest proportion of tobacco retailers on major roadways (58%) compared to Newark, Middletown, and the non-municipal areas (68.3–84%; see also Figures 1 and 2).
Ratio of Observed to Expected Tobacco Retailers by Municipality Zones
Wilmington and the other municipal and non-municipal areas in New Castle County differed in the proportion of their total tobacco retailers located in each zone type (see Table 2). This may indicate important differences in permitted uses and physical infrastructure between zoning types that contribute to differential tobacco retail exposure. To determine if the distribution of retailers within zones differs from what is seen countywide, we calculated the ratio of observed to expected tobacco retailers by zoning type within municipalities. These adjusted results are summarized in Table 3 and are consistent with the findings reported above that show the disparity in citywide tobacco retailer counts cannot be explained by differences in commercial zoning. More specifically, for both medium- and high-density residential zones, Wilmington had more than three times (3.4) the rate of expected retailers; the ratios for other municipal and non-municipal areas were all well below one. Table 3 also includes a measure of population density for each geographic area. The greater density of people per square mile living in Wilmington are therefore potentially exposed to these higher observed numbers of tobacco retailers.
Table 3.
Ratio of observed to expected tobacco retailers by zone and municipality, New Castle County, DE
| Non-municipal New Castle Countya | Wilmington | Newark | Middletown | |
|---|---|---|---|---|
| Observed/expected tobacco retailers by zone, ratio (95% CI) | ||||
| Low-density residential | 1.3 (0.5, 2.1) | 0.3 (−0.4, 1.0) | 1.0 (−1.0, 3.0) | -- |
| Medium-density residential | 0.1 (0.0, 0.2) | 3.4 (2.5, 4.3) | 0.0 (0.0, 0.0) | 0.0 (0.0, 0.0) |
| High-density residential | 0.0 (0.0, 0.0) | 3.3 (1.2, 5.4) | 1.0 (−1.0, 3.0) | -- |
| Commercial/office | 1.1 (1.0, 1.2) | 0.7 (0.6, 0.8) | 1.1 (0.8, 1.4) | 1.1 (0.7, 1.5) |
| Manufacturing/industrial | 1.3 (0.0, 2.6) | 0.0 (0.0, 0.0) | -- | -- |
| Open space/natural area/agriculture | 1.5 (−0.2, 3.2) | 0.0 (0.0, 0.0) | -- | -- |
| Population density, people per sq mi | 1018.7 | 5960.0 | 3548.0 | 1769.8 |
Non-municipal New Castle County excludes Wilmington, Newark, Middletown, Bellefonte, Elsmere, Newport, New Castle, Delaware City, Odessa, Townsend, Clayton, and Smyrna
One may expect that different distributions of tobacco retailers by zone are explained by differences in the proportion of total land designated to each zone type, at least for zones which are designated primarily for retail uses. Supplementary Table 1 shows how Wilmington and the other municipal and non-municipal areas in New Castle County differ in proportions of land designated to zone types. Wilmington had a higher proportion of land zoned for commercial/office use relative to non-municipal New Castle County and Newark (9.4% vs. 6.4% and 8.2%, respectively), and because this zone type includes the majority of tobacco retailers countywide, we might expect Wilmington to have a larger share of retailers there. However, Wilmington had a smaller share of retailers located in this zone than expected (O/E: 0.7 vs. O/E: 1.1 for all other municipal and non-municipal areas). Conversely, while Middletown had the largest share of commercially zoned land (20.4%), it contained the expected share of tobacco retailers (O/E: 1.1, 95% CI: 0.7, 1.5) based on the countywide proportion of retailers in this zone type.
Current and Formers Smokers and Youth by Zoning Type and Municipality
Table 4 presents data on the demographic and residential characteristics of current and former smokers by municipality and zoning category. Wilmington accounted for 908 or approximately 25% of the 3,595 current smokers in non-municipal New Castle County and the three major municipalities. Wilmington current smokers were comparable in terms of age, sex, and ethnicity relative to current smokers in other areas. However, Wilmington current smokers were predominantly Black and covered by Medicaid health insurance; current smokers in other areas were predominantly White and equally likely to be covered by Medicaid, commercial, or Medicare insurance. Within Wilmington, the largest share of current smokers resided in areas zoned primarily for medium- (61.0%) and high-density (19.2%) residential uses (see Table 4). Much lower proportions of current smokers were observed for low-density residential (6.3%) and other zoning types. Figure 3 visualizes these results by depicting the spatial intensity of current smokers and the locations of tobacco retailers as they relate spatially to the medium- and high-density residential zones. For the other municipal and non-municipal areas in New Castle County, the largest share of current smokers resided in areas zoned for low-density residential use, ranging from 44.3% to 64.1%, with relatively smaller proportions observed for medium- (8.9%–38.1%) and high-density (0.0%–20.0%) residential zones.
Table 4.
Demographic and residential characteristics of current and former smokers by municipality, New Castle County, DE
| Non-municipal New Castle Countya smokers (N=7404) |
Wilmington smokers (N=1699) |
Newark smokers (N=327) |
Middletown smokers (N=317) |
|||||
|---|---|---|---|---|---|---|---|---|
| Current (N=2495) |
Former (N=4909) |
Current (N=908) |
Former (N=791) |
Current (N=95) |
Former (N=232) |
Current (N=97) |
Former (N=220) |
|
| Age, median | 55.0 | 71.0 | 54.0 | 66.0 | 58.0 | 75.0 | 54.0 | 70.0 |
| Male, n (%) | 1338 (53.6) | 2508 (51.1) | 497 (54.7) | 360 (45.5) | 49 (51.6) | 101 (43.5) | 45 (46.4) | 106 (48.2) |
| Race, n (%) | ||||||||
| White | 1923 (77.1) | 4062 (82.7) | 232 (25.6) | 250 (31.6) | 80 (84.2) | 205 (88.4) | 62 (63.9) | 151 (68.6) |
| Black | 479 (19.2) | 695 (14.2) | 623 (68.6) | 505 (63.8) | 13 (13.7) | 22 (9.5) | 32 (33.0) | 56 (25.5) |
| Other race | 93 (3.7) | 152 (3.1) | 53 (5.8) | 36 (4.6) | 2 (2.1) | 5 (2.2) | 3 (3.1) | 13 (5.9) |
| Hispanic/Latino, n (%) | 102 (4.1) | 134 (2.7) | 54 (5.9) | 40 (5.1) | 1 (1.1) | 8 (3.4) | 5 (5.2) | 12 (5.5) |
| Payer, n (%) | ||||||||
| Commercial | 720 (28.9) | 1082 (22.0) | 119 (13.1) | 109 (13.8) | 22 (23.2) | 42 (18.1) | 33 (34.0) | 51 (23.2) |
| Medicaid | 876 (35.1) | 356 (7.3) | 462 (50.9) | 175 (22.1) | 37 (38.9) | 15 (6.5) | 32 (33.0) | 16 (7.3) |
| Medicare | 873 (35.0) | 3457 (70.4) | 319 (35.1) | 501 (63.3) | 36 (37.9) | 175 (75.4) | 30 (30.9) | 152 (69.1) |
| Self-pay | 26 (1.0) | 14 (0.3) | 8 (0.9) | 6 (0.8) | 0 (0) | 0 (0) | 2 (2.1) | 1 (0.5) |
| Resides in zone, n (%) | ||||||||
| Low-density residential | 1599 (64.1) | 3512 (71.5) | 57 (6.3) | 109 (13.8) | 51 (53.7) | 149 (64.2) | 43 (44.3) | 135 (61.4) |
| Medium-density residential | 221 (8.9) | 300 (6.1) | 554 (61.0) | 422 (53.4) | 11 (11.6) | 11 (4.7) | 37 (38.1) | 66 (30.0) |
| High-density residential | 335 (13.4) | 408 (8.3) | 174 (19.2) | 199 (25.2) | 19 (20.0) | 51 (22.0) | -- | -- |
| Mobile homes | 133 (5.3) | 174 (3.5) | -- | -- | -- | -- | 13 (13.4) | 15 (6.8) |
| Commercial/office | 92 (3.7) | 80 (1.6) | 112 (12.3) | 51 (6.4) | 13 (13.7) | 17 (7.3) | 4 (4.1) | 4 (1.8) |
| Manufacturing/industrial | 12 (0.5) | 11 (0.2) | 9 (1.0) | 7 (0.9) | -- | -- | -- | -- |
| Open space/natural area/agriculture | 103 (4.1) | 424 (8.6) | 2 (0.2) | 3 (0.4) | -- | 4 (1.7) | -- | -- |
| University | -- | -- | -- | -- | 1 (1.1) | -- | -- | -- |
Non-municipal New Castle County excludes Wilmington, Newark, Middletown, Bellefonte, Elsmere, Newport, New Castle, Delaware City, Odessa, Townsend, Clayton, and Smyrna
Figure 3.
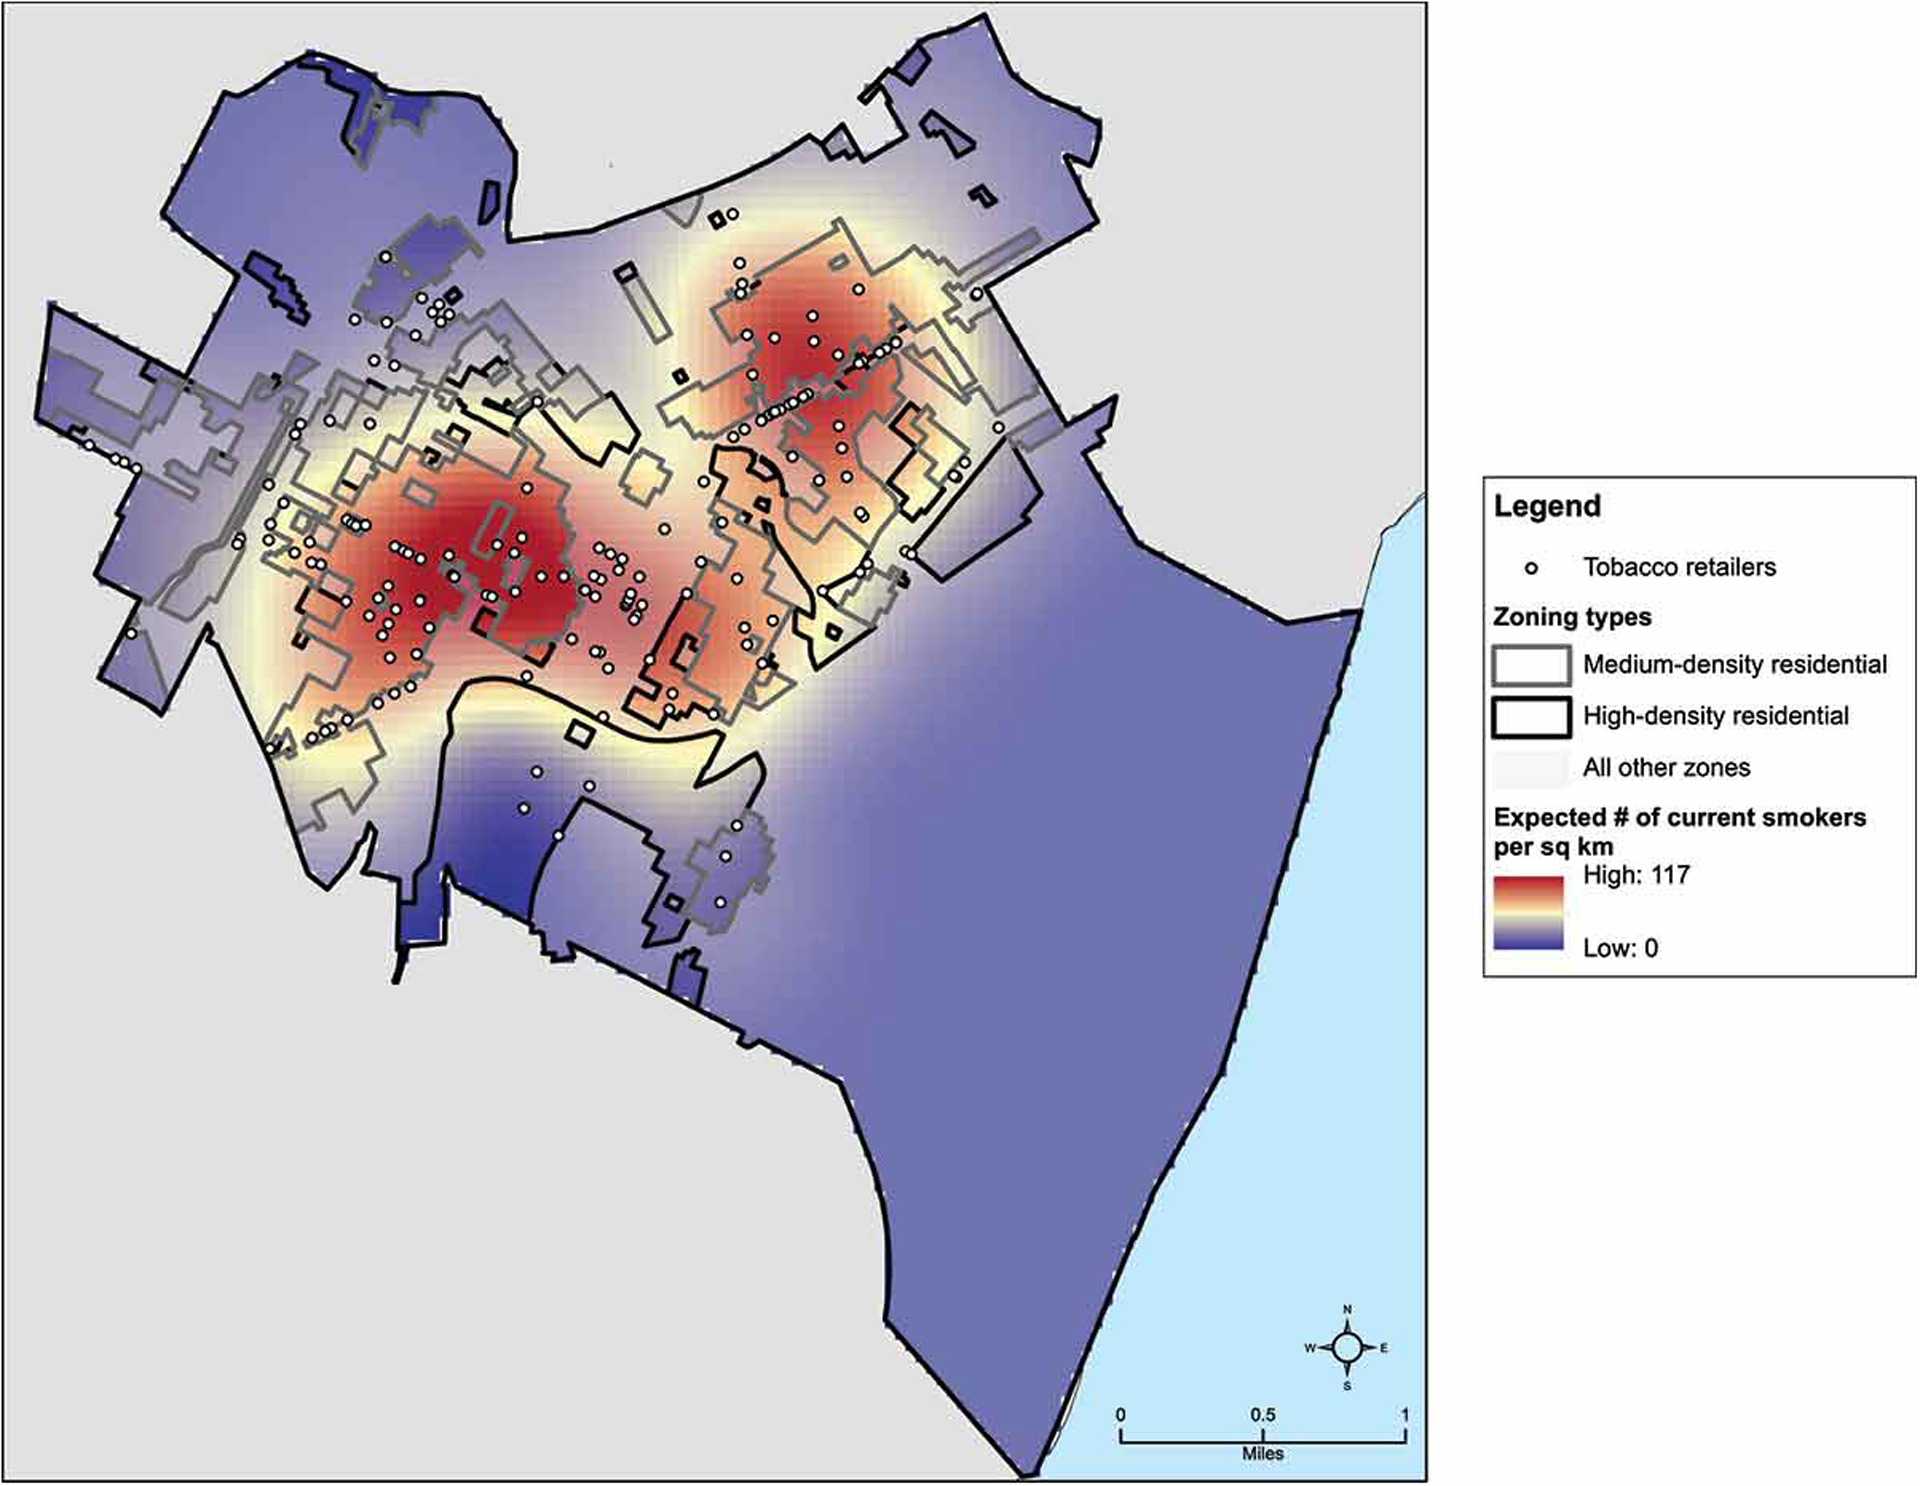
Spatial distribution of tobacco retailers, current smokers, and medium- and high-density residential zones in Wilmington, DE. Current smokers are co-located with tobacco retailers in medium-residential zones in the central and north-central parts of the city.
As summarized in Table 4, Wilmington former smokers were younger and more likely to be Black than former smokers in other areas. With regard to residence by zoning type, a pattern similar to what was observed for current smokers emerged for former smokers across all areas. In Wilmington, the largest proportion of former smokers were observed in medium- (53.4%) and high-density (25.2%) residential zones, next followed by low-density residential zones (13.8%). In other municipal and non-municipal areas, the largest share of former smokers resided in low-density residential zones (61.4%–71.5%), with smaller proportions observed for medium- (4.7%–30.0%) and high-density (0.0%–22.0%) residential zones.
Finally, with regard to the risk that exposure to tobacco retailers entails for initiating smoking among youth, we conservatively estimated that at least 60% of all Wilmington minors lived in medium- or high-density residential zones.
DISCUSSION
This study represents the first empirical assessment of the potential to reduce adverse exposures to tobacco retailers with a residentially-focused, zoning-based policy approach. Evaluations of other policy approaches to tobacco retailer reduction that did not explicitly focus on residential zones, such as citywide density caps or tobacco-free pharmacy laws, have largely produced inequitable results (Giovenco et al., 2019; Vyas et al., 2020). Our assessment focused on the use case of Wilmington, Delaware and the surrounding New Castle County. We found that Wilmington accounted for approximately 15% of the county population but more than 27% of the county’s tobacco retailers. Three additional sets of findings help to further characterize the disparity in tobacco retailer exposure. First, more than 40% of Wilmington tobacco retailers were located in residential zones, about ten times the proportion that was observed for other more affluent and predominantly White parts of the county. Second, differences were observed in the proportions of retailer subtype by municipality, with a much larger share of non-gas convenience stores found in Wilmington relative to the surrounding county, which has implications for exposure to tobacco products. Third, large majorities of Wilmington current smokers and youth reside in the very residential areas with the greatest tobacco retailer exposure, which could contribute to lower rates of smoking cessation among current smokers and higher rates of smoking initiation among minors. Taken together, these findings provide strong support for focusing tobacco retailer reduction policies on residential areas within disadvantaged communities.
It might be expected that urban areas like Wilmington, which have relatively large commercial districts, would also have more tobacco retailers than suburban and rural municipalities with less land zoned for commercial activity. However, differences in commercial zoning did not explain the disparity in overall population-adjusted tobacco retailer counts. That is, commercially zoned areas accounted for about 60% of tobacco retailers in Wilmington but more than 90% of retailers in all other municipalities. Conversely, more than 40% of tobacco retailers in Wilmington were located in residential zoned areas, about a tenfold greater proportion than observed for other areas. More specifically, the largest share of residential tobacco retailers in Wilmington was located in medium- and high-density residential zones, where observed counts of retailers were more than three times what would be expected. In other municipalities, by contrast, the observed counts of tobacco retailers were a tenth or less of what would be expected for medium- and high-density residential zones. These results demonstrate that that the disparity in population-adjusted tobacco retailer counts observed for Wilmington, relative to the more affluent and predominantly White surrounding areas, can be attributed to a significantly greater exposure to tobacco retailers in residential zones. Thus, while a citywide density reduction approach like the one employed in San Francisco (Vyas et al., 2020) may do more to reduce tobacco retailer counts in commercial zones, which constitute less than 10% of Wilmington land area and where tobacco retailers were more tightly concentrated, it would have much less of an impact on residentially zoned areas that are more distributed throughout the city.
Tobacco retailer subtypes also differed significantly by municipality. Approximately half of Wilmington’s tobacco retailers were non-gas convenience stores, a much larger proportion than observed for other geographic areas. Wilmington had a lower proportion of tobacco retailers that were categorized as convenience stores (gas), pharmacies, grocery stores/supermarkets, and tobacco shops. Wilmington also had the lowest proportion of tobacco retailers on major roadways compared to other geographic areas. Thus, convenience stores that were largely embedded within residential neighborhoods accounted for much of the geographic disparity in exposure to tobacco retailers. Consistent with prior research that examined the impact of a tobacco-free pharmacy law in New York City (Giovenco et al., 2019), our results clearly demonstrate that a similar approach would do very little to reduce tobacco retailer counts in Wilmington as pharmacy-based tobacco retailers accounted for only 3.6% of all retailers in the city.
Like tobacco retailer counts, Wilmington had a disproportionate share of current smokers relative to other geographic areas in New Castle County. Approximately 80% of these current smokers lived in medium- and high-density residential zones. In other municipal and non-municipal areas, where smoking rates were considerably lower, a plurality or majority of smokers lived in low-density residential zones. A similar pattern was observed for former smokers. These findings highlight the added challenges that current smokers in Wilmington can face when attempting to discontinue tobacco use and the potentially greater risk of relapse faced by former smokers. In addition, given that at least 60% of Wilmington youth reside in medium- and high-density residential zones, the greater exposure to tobacco retailers may contribute to higher rates of smoking initiation among minors.
In summary, a zoning-based approach that targets residential areas may improve upon prior tobacco retailer reduction approaches by offering the potential to reduce both the overall retailer counts and exposure to retailers that are located in close proximity to smokers’ homes. Importantly, two independent studies observed that smokers living within 500 m (vs. > 500 m) of a tobacco retailer were about half as likely to achieve abstinence over time (Cantrell et al., 2014; Pulakka et al., 2016). Likewise, our prior research found that New Castle County smokers lived an average of 418 m from their nearest tobacco retailer compared to 595 m for former and never smokers (Siegel, Brooks, & Curriero, 2020), straddling the 500 m cutoff. This would suggest that establishing a type of residential tobacco retailer buffer, comparable to drug-free school zones or establishing a density caps, would lead to higher rates of smoking cessation for populations of smokers who have historically lower quit rates (Nollen et al., 2019).
From a practical standpoint, however, the use of tobacco retailer reduction policies in residentially zoned areas poses unique challenges. For instance, residentially zoned areas do not necessarily form well-defined spatial boundaries the way city districts or other administrative units do. In addition, residential areas may directly border commercial areas where regulating tobacco retailers may be less feasible. That said, it should be noted that the relatively more advantaged municipalities included in our analysis have effectively banned tobacco retailers from residential areas without an explicit tobacco retailer reduction policy. This may reflect a form of exclusionary zoning, or the deliberate use of regulations to restrict land uses perceived to be harmful to the community at large and its residents (Imbroscio, 2021). Exclusionary zoning is commonly practiced in affluent communities but its application in historically disadvantaged communities is frequently preempted by state governments or other authorities (Imbroscio, 2021). Thus, further investigation is needed not only to devise an effective policy approach but to inform its translation to real-world communities.
Strengths and limitations
A novel strength of this study was the use of point-level tobacco retailer and retailer subtype data joined with zoning shapefiles, standardized across municipalities. This approach helps to demonstrate how local policy influences the built environment. In addition, linking spatially representative smoker data from a local health system EHR further validated these findings. The chief limitation of this study was that we only examined a single city and the surrounding county, which may have unique spatial characteristics that do not generalize to other regions. Replication across other geographic areas will be necessary to assess the external validity of these findings. In addition, our smoker data come from a single health system EHR, which may not be representative of the larger population of New Castle County smokers. However, our prior research provided at least partial support for the spatial representativeness of these data, particularly within Wilmington (Siegel et al., 2020). Finally, we did not consider residents’ potential exposure to tobacco retailers outside of their residential areas. For example, commuting between geographic areas for school or work would have implications for tobacco retailer exposure, particularly when travelling via major roadways.
Implications for policymakers
It should be acknowledged that passing and implementing a new zoning-based tobacco retailer reduction policy would likely face significant challenges. The tobacco industry, in particular, has consistently demonstrated the wherewithal to successfully lobby state governments to preempt or weaken local tobacco control policies (Apollonio & Glantz, 2020). However, it should also be noted that when states and local governments commit to action, with the support of organized and informed community groups, there are multiple examples of newly passed tobacco control measures in recent years (Apollonio & Glantz, 2020).
Convenience store owners would also likely object to any new restrictions imposed on tobacco sales over concerns of lost tobacco industry subsidies and the revenue from both tobacco products and the “foot traffic” these products drive to their locations (Hitchman, Calder, Rooke, & McNeill, 2016). However, early engagement with store owners can overcome these objections. For example, in San Francisco a coalition of community advocates and local officials received support from local store owners to reduce tobacco retailer density after identifying local programs that would help generate new sources of revenue to make up for lost tobacco sales (Bright Research Group, 2016). By directing resources to replace the shelf space dedicated to tobacco products with healthy and affordable food, this coalition was able to address multiple health priorities in tandem (Wooten et al., 2013). To date, Wilmington has piloted corner store initiatives around healthy food options but has yet to address tobacco specifically (Langraf & Kee, 2015). Focusing on both improving tobacco control and access to healthy foods within a more walkable city like Wilmington, where corner stores are embedded within residential neighborhoods, could produce synergistic health benefits. Policymakers may also consider tapping into existing substantial tobacco control funding sources, such as the tobacco master settlement agreement or excise taxes, to support store owners by offsetting any lost revenue, thereby accelerating a reduction in tobacco retailers. In Delaware alone, these funds exceed $150 million annually (Campaign for Tobacco-Free Kids, 2018).
Implications for researchers
Our results support further investigation into developing and ultimately implementing a residentially-focused, zoning-based approach to tobacco retailer reduction policy. As noted above, this study should be replicated in other geographic areas. In addition, computational modeling and simulation-based studies can help predict the outcomes of a variety of policy approaches, which could inform policy design and help foster public support (Hammond et al., 2020). Finally, a formal evaluation of any new policy would help to establish whether policy objectives were met.
Conclusion
The tobacco industry has adapted to marketing bans, excise taxes, anti-smoking campaigns, and smoking cessation interventions by subsidizing tobacco retailers, largely in low SES, segregated communities. Absent new place-based innovations in tobacco control, smoking will continue to be a leading cause of premature mortality and health disparities. Early attempts at implementing citywide policies designed to reduce tobacco retailers have produced mixed results. The results of this study suggest that adopting a residentially-focused, zoning-based approach offers the potential to more equitably reduce tobacco retailers and help close tobacco-related health disparities.
Supplementary Material
Funding
This work was supported by the National Institute of General Medical Sciences [P20 GM103446].
Footnotes
Disclosure statement
No potential conflict of interest was reported by the author(s).
REFERENCES
- Ackerman A, Etow A, Bartel S, & Ribisl KM (2017). Reducing the density and number of tobacco retailers: Policy solutions and legal issues. Nicotine and Tobacco Research, 19(2), 133–140. 10.1093/ntr/ntw124 [DOI] [PMC free article] [PubMed] [Google Scholar]
- Apollonio DE, & Glantz S (2020). Tobacco manufacturer lobbying to undercut minimum price laws: An analysis of internal industry documents. Tobacco Control, 29(e1), E10–E17. 10.1136/tobaccocontrol-2019-055354 [DOI] [PMC free article] [PubMed] [Google Scholar]
- Bright Research Group. (2016). Reducing Tobacco Retail Density in San Francisco: A Case Study. Retrieved from http://sanfranciscotobaccofreeproject.org/case-studies/reducing-tobacco-retail-density-in-san-francisco/
- Callard CD, & Collishaw NE (2013). Supply-side options for an endgame for the tobacco industry. Tobacco Control, 22(SUPPL. 1), 13–16. 10.1136/tobaccocontrol-2012-050863 [DOI] [PMC free article] [PubMed] [Google Scholar]
- Campaign for Tobacco-Free Kids. (2018). Broken Promises to Our Children: A State-by-State Look at the 1998 Tobacco Settlement 20 Years Later.
- Cantrell J, Anesetti-rothermel A, Pearson JL, Xiao H, Vallone D, & Kirchner TR (2014). The impact of the tobacco retail outlet environment on adult cessation and differences by neighborhood poverty. Addiction, 110(1), 152–161. 10.1111/add.12718 [DOI] [PMC free article] [PubMed] [Google Scholar]
- Caspi CE, Lenk K, Pelletier JE, Barnes TL, Harnack L, Erickson DJ, & Laska MN (2017). Food and beverage purchases in corner stores, gas-marts, pharmacies and dollar stores. Public Health Nutrition, 20(14), 2587–2597. 10.1017/S1368980016002524 [DOI] [PMC free article] [PubMed] [Google Scholar]
- Chaiton MO, Mecredy G, & Cohen J (2018). Tobacco retail availability and risk of relapse among smokers who make a quit attempt: A population-based cohort study. Tobacco Control, 27(2), 163–169. 10.1136/tobaccocontrol-2016-053490 [DOI] [PubMed] [Google Scholar]
- Clemens T, Dibben C, Pearce J, & Shortt NK (2020). Neighbourhood tobacco supply and individual maternal smoking during pregnancy: A fixed-effects longitudinal analysis using routine data. Tobacco Control, 29(1), 7–14. 10.1136/tobaccocontrol-2018-054422 [DOI] [PMC free article] [PubMed] [Google Scholar]
- Delaware Division of Revenue. (2019). Delaware business licenses. Retrieved April 17, 2019, from https://revenue.delaware.gov/business-license-search/
- Delaware Health Statistics Center. (2018). Hospital Discharge Data. Retrieved May 6, 2020, from https://www.dhss.delaware.gov/dhss/dph/hp/hosp_dis_data.html
- Diggle P (1985). A Kernel Method for Smoothing Point Process Data. Applied Statistics, 34(2), 138. 10.2307/2347366 [DOI] [Google Scholar]
- Diggle PJ (2003). Statistical Analysis of Spatial Point Patterns (Second Edi). New York: Oxford University Press. [Google Scholar]
- Division of GIS Services. (2020). (2020, August 31). New Castle County GIS Services. Retrieved from https://apps-nccde.hub.arcgis.com/
- Drope J, Liber AC, Cahn Z, Stoklosa M, Kennedy R, Douglas CE, … Drope J (2018). Who’s still smoking? Disparities in adult cigarette smoking prevalence in the United States. CA: A Cancer Journal for Clinicians, 68(2), 106–115. 10.3322/caac.21444 [DOI] [PubMed] [Google Scholar]
- Federal Trade Commission. (2016). Federal Trade Commission Cigarette Report for 2014. Washington, DC. Retrieved from https://www.ftc.gov/system/files/documents/reports/federal-trade-commission-cigarette-report-2014-federal-trade-commission-smokeless-tobacco-report/ftc_cigarette_report_2014.pdf [Google Scholar]
- Giovenco DP, Spillane TE, Mauro CM, & Hernández D (2019). Evaluating the impact and equity of a tobacco-free pharmacy law on retailer density in New York City neighbourhoods. Tobacco Control, 28(5), 548–554. 10.1136/tobaccocontrol-2018-054463 [DOI] [PMC free article] [PubMed] [Google Scholar]
- Glasser AM, & Roberts ME (2020). Retailer density reduction approaches to tobacco control: A review. Health & Place, (April), 102342. 10.1016/j.healthplace.2020.102342 [DOI] [PMC free article] [PubMed] [Google Scholar]
- Hammond RA, Combs TB, Mack-Crane A, Kasman M, Sorg A, Snider D, & Luke DA (2020). Development of a computational modeling laboratory for examining tobacco control policies: Tobacco Town. Health and Place, 61(December 2019), 102256. 10.1016/j.healthplace.2019.102256 [DOI] [PMC free article] [PubMed] [Google Scholar]
- Hitchman SC, Calder R, Rooke C, & McNeill A (2016). Small Retailers’ Tobacco Sales and Profit Margins in Two Disadvantaged Areas of England. AIMS Public Health, 3(1), 110–115. 10.3934/publichealth.2016.1.110 [DOI] [PMC free article] [PubMed] [Google Scholar]
- Imbroscio D (2021). Rethinking Exclusionary Zoning or: How I Stopped Worrying and Learned to Love It. Urban Affairs Review, 57(1), 214–251. 10.1177/1078087419879762 [DOI] [Google Scholar]
- Jeon J, Holford TR, Levy DT, Feuer EJ, Cao P, Tam J, … Meza R (2018). Smoking and Lung Cancer Mortality in the United States From 2015 to 2065. Annals of Internal Medicine, 169(10), 684. 10.7326/m18-1250 [DOI] [PMC free article] [PubMed] [Google Scholar]
- Jha P, Ramasundarahettige C, Landsman V, Rostron B, Thun M, Anderson RN, … Peto R (2013). 21st-Century Hazards of Smoking and Benefits of Cessation in the United States. New England Journal of Medicine, 368(4), 341–350. 10.1056/nejmsa1211128 [DOI] [PubMed] [Google Scholar]
- Kirchner TR, Cantrell J, Anesetti-Rothermel A, Ganz O, Vallone DM, & Abrams DB (2013). Geospatial exposure to point-of-sale tobacco: Real-time craving and smoking-cessation outcomes. American Journal of Preventive Medicine, 45(4), 379–385. 10.1016/j.amepre.2013.05.016 [DOI] [PMC free article] [PubMed] [Google Scholar]
- Kotz D, & West R (2009). Explaining the social gradient in smoking cessation: It’s not in the trying, but in the succeeding. Tobacco Control, 18(1), 43–46. 10.1136/tc.2008.025981 [DOI] [PubMed] [Google Scholar]
- Langraf R, & Kee E (2015). Bringing healthy foods to our neighborhoods. Delaware Online. [Google Scholar]
- Lariscy JT, Hummer RA, & Rogers RG (2018). Cigarette Smoking and All-Cause and Cause-Specific Adult Mortality in the United States. Demography, 55(5), 1855–1885. 10.1007/s13524-018-0707-2 [DOI] [PMC free article] [PubMed] [Google Scholar]
- Lawman HG, Henry KA, Scheeres A, Hillengas A, Coffman R, & Strasser AA (2020). Tobacco retail licensing and density 3 years after license regulations in Philadelphia, Pennsylvania (2012–2019). American Journal of Public Health, 110(4), 547–553. 10.2105/AJPH.2019.305512 [DOI] [PMC free article] [PubMed] [Google Scholar]
- Levinson AH (2017). Where the U.S. tobacco epidemic still rages: Most remaining smokers have lower socioeconomic status. Journal of Health Care for the Poor and Underserved, 28(1), 100–107. 10.1353/hpu.2017.0012 [DOI] [PubMed] [Google Scholar]
- Marsh L, Vaneckova P, Robertson L, Johnson TO, Doscher C, Raskind IG, … Henriksen L (2020). Association between density and proximity of tobacco retail outlets with smoking: A systematic review of youth studies. Health & Place, (July 2019), 102275. 10.1016/j.healthplace.2019.102275 [DOI] [PMC free article] [PubMed] [Google Scholar]
- Middletown - Delaware. (2021). Zoning code. Retrieved from https://middletown.delaware.gov/media/ZoningCode2019(1).pd
- New Castle County - Delaware. (2021). New Castle County, Delaware code of ordinances: Chapter 40 – unified development code.
- Newark - Delaware. (2021). Newark, Delaware code of ordinances: Chapter 32 – zoning.
- Nollen NL, Mayo MS, Sanderson Cox L, Benowitz NL, Tyndale RF, Ellerbeck EF, … Ahluwalia JS (2019). Factors That Explain Differences in Abstinence Between Black and White Smokers: A Prospective Intervention Study. JNCI: Journal of the National Cancer Institute, 111, 1–10. 10.1093/jnci/djz001 [DOI] [PMC free article] [PubMed] [Google Scholar]
- NYU Langone Health Department of Population Health. (2020). City Types for Improving Health and Equity: Understanding America’s Small and Midsize Cities.
- Pulakka A, Halonen JI, Kawachi I, Pentti J, Stenholm S, Jokela M, … Kivimäki M (2016). Association Between Distance From Home to Tobacco Outlet and Smoking Cessation and Relapse. JAMA Internal Medicine, 176(10), 1512. 10.1001/jamainternmed.2016.4535 [DOI] [PubMed] [Google Scholar]
- Risi S, & Proctor RN (2019). Big tobacco focuses on the facts to hide the truth: An algorithmic exploration of courtroom tropes and taboos. Tobacco Control, 41–49. 10.1136/tobaccocontrol-2019-054953 [DOI] [PMC free article] [PubMed] [Google Scholar]
- Robertson L, McGee R, Marsh L, & Hoek J (2015). A systematic review on the impact of point-of-sale tobacco promotion on smoking. Nicotine and Tobacco Research, 17(1), 2–17. 10.1093/ntr/ntu168 [DOI] [PMC free article] [PubMed] [Google Scholar]
- Rodriguez D, Carlos HA, Adachi-Mejia AM, Berke EM, & Sargent JD (2013). Predictors of tobacco outlet density nationwide: a geographic analysis. Tobacco Control, 22(5), 349–355. 10.1136/tobaccocontrol-2011-050120 [DOI] [PMC free article] [PubMed] [Google Scholar]
- Schneider JE, Reid RJ, Peterson NA, Lowe JB, & Hughey J (2005). Tobacco outlet density and demographics at the tract level of analysis in Iowa: Implications for environmentally based prevention initiatives. Prevention Science, 6(4), 319–325. 10.1007/s11121-005-0016-z [DOI] [PubMed] [Google Scholar]
- Siegel SD, Brooks M, & Curriero FC (2020). Operationalizing the Population Health Framework: Clinical Characteristics, Social Context, and the Built Environment. Population Health Management, 00(00), pop.2020.0170. 10.1089/pop.2020.0170 [DOI] [PMC free article] [PubMed] [Google Scholar]
- Siegel SD, Brooks MM, Gbadebo BM, & Laughery JT (2019). Using Geospatial Analyses of Linked Electronic Health Records and Tobacco Outlet Data to Address the Social Determinants of Smoking. Preventing Chronic Disease, 16(11), 190186. 10.5888/pcd16.190186 [DOI] [PMC free article] [PubMed] [Google Scholar]
- The US Burden of Disease Collaborators. (2018). The State of US Health, 1990–2016: Burden of Disease, Injuries, and Risk Factors Among US States. JAMA, 319(14), 1444–1472. 10.1001/jama.2018.0158 [DOI] [PMC free article] [PubMed] [Google Scholar]
- Twyman L, Bonevski B, Paul C, & Bryant J (2014). Perceived barriers to smoking cessation in selected vulnerable groups: A systematic review of the qualitative and quantitative literature. BMJ Open, 4(12), 1–15. 10.1136/bmjopen-2014-006414 [DOI] [PMC free article] [PubMed] [Google Scholar]
- U.S. Census Bureau. (2021). American Community Survey 2019 5-year estimates.
- U.S. Department of Health and Human Services. (2014). The Health Consequences of Smoking—50 Years of Progress: A Report of the Surgeon General. U S Department of Health and Human Services,Centers for Disease Control and Prevention National Center for Chronic Disease Prevention and Health Promotion Health, Office on Smoking and Health, 1–36. https://doi.org/NBK179276 [Google Scholar]
- United States Public Health Service. (1964). Smoking and health: report of the Advisory Committee to the Surgeon General of the Public Health Service. Washington, DC. [Google Scholar]
- Vyas P, Sturrock H, & Ling PM (2020). Examining the role of a retail density ordinance in reducing concentration of tobacco retailers. Spatial and Spatio-Temporal Epidemiology, 32, 100307. 10.1016/j.sste.2019.100307 [DOI] [PMC free article] [PubMed] [Google Scholar]
- West JH, Blumberg EJ, Kelley NJ, Hill L, Sipan CL, Schmitz KE, … Hovell MF (2010). Does proximity to retailers influence alcohol and tobacco use among Latino adolescents? Journal of Immigrant and Minority Health, 12(5), 626–633. 10.1007/s10903-009-9303-2 [DOI] [PMC free article] [PubMed] [Google Scholar]
- Wilmington - Delaware. (2021). Wilmington, Delaware code of ordinances: Chapter 48 – zoning.
- Wooten H, McLaughlin I, Chen L, Fry C, Mongeon C, & Graf S (2013). Zoning and Licensing to Regulate the Retail Environment and Achieve Public Health Goals. Duke Forum for Law & Social Change, 5(1), 65. [Google Scholar]
- Yerger VB, Przewoznik J, & Malone RE (2007). Racialized geography, corporate activity, and health disparities: Tobacco industry targeting of inner cities. Journal of Health Care for the Poor and Underserved, 18(4 SUPPL.), 10–38. 10.1353/hpu.2007.0120 [DOI] [PubMed] [Google Scholar]
Associated Data
This section collects any data citations, data availability statements, or supplementary materials included in this article.