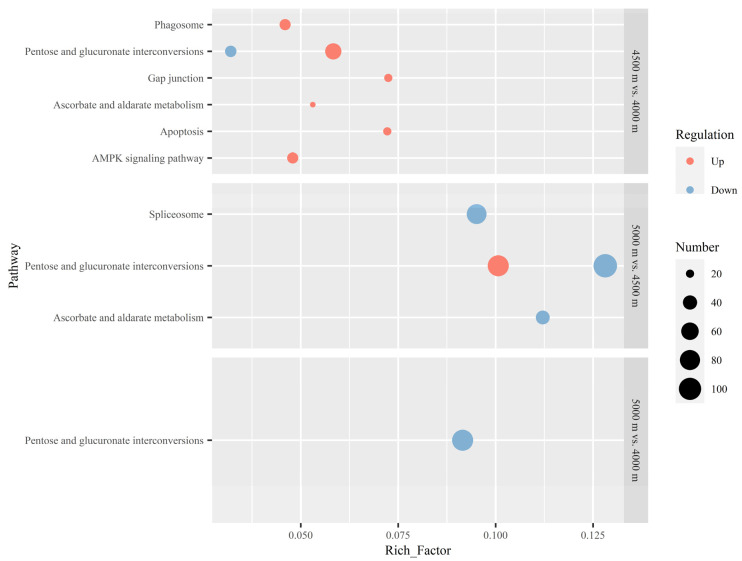
Figure 3.
Pathways enriched by differentially expressed genes (DEGs) of Bombus waltoni in comparisons between different altitudes. All pathways with an adjusted p-value lower than 0.05 are shown for each comparison. No significant up-regulated DEGs were detected in the 5000 m vs. 4000 m comparison; therefore, it is not included in the figure. “Number” denotes the number of DEGs enriched in the pathway. The pathways with red points are enriched by up-regulated DEGs, while those with blue points are enriched by down-regulated DEGs.

