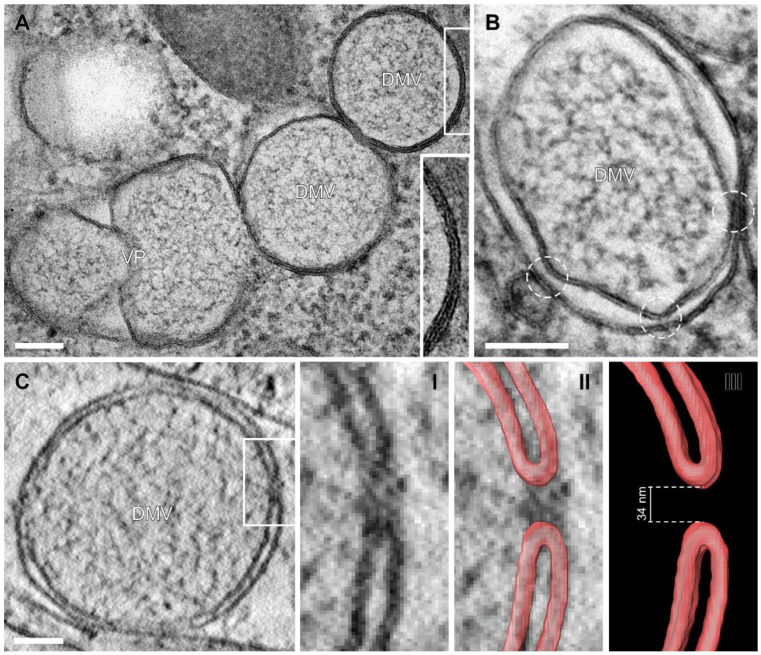
Figure 2.
SARS-CoV-2 induced DMVs with inner and outer DMV membranes forming a pore structure. (A) TEM images of DMVs and VPs showing tight membrane apposition between inner and outer DMV membrane. An overview of this cell can be found in Figure S1. (B) Constrictions of the space between inner and outer DMV membrane (circles), indicating the presence of the molecular pore complex. (C) Scanning transmission electron microscopy (STEM) virtual tomography sections of a molecular pore connecting the DMV interior with the cytoplasm. The pore is shown in higher magnification (I), together with membrane profiles labelled in red (II) or as standalone membrane labels (III). Scale bars, 100 nm.

