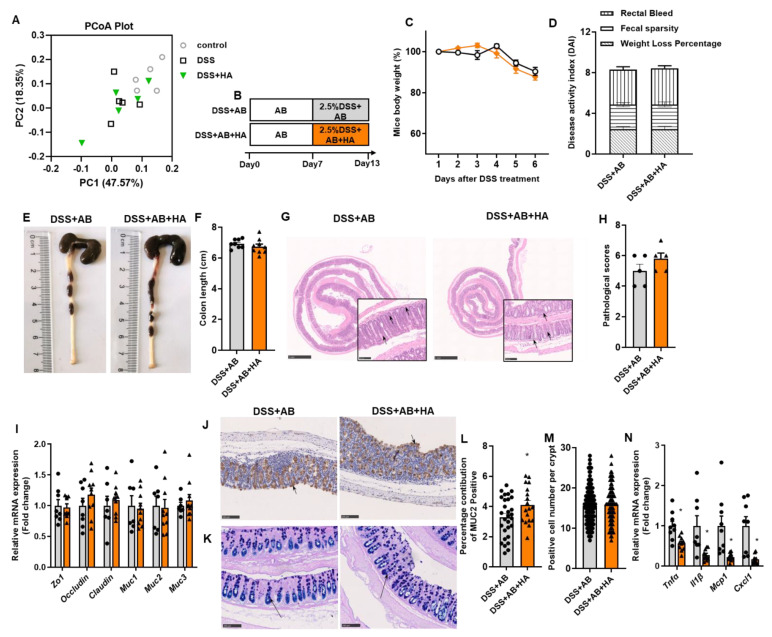
Figure 3.
Antibiotics treatment blunts the effects of HA. (A) The β-diversity analysis of GM by principal component analysis (PCA) plot of Control, DSS, and DSS + HA (n = 4–5). (B) Experimental design of antibiotics (AB) treatment. (C) Percentage change in body weight after DSS treatment. (D) Disease activity index (DAI) on day 7. (E,F) Representative image and length of the colon. (G,H) Representative image of H&E staining of colon and pathological score. The small panels (20×) were enlarged from the large panels (2.5×). (I) Relative mRNA expression of tight junction genes and mucin genes in the colon. (J,L) Immunohistochemical analysis of MUC2 in the colon (20×). (K,M) PAS-AB staining of the colon (20×). (N) Relative mRNA expression of inflammatory factors in the colon. Data are expressed as mean ± SE, n = 8–10, * p < 0.05.

