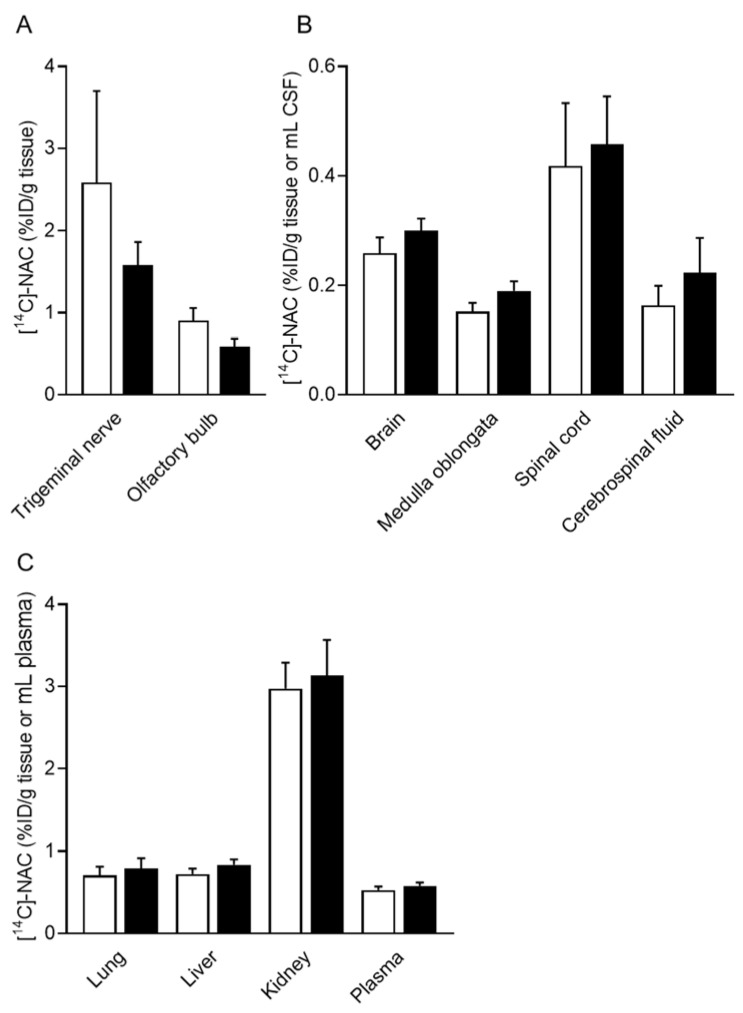
Figure 3.
Tissue distribution of [14C]-NAC after a single intranasal administration to ddY mice. Each tissue, CSF, or plasma sample was collected 60 min after the intranasal administration of [14C]-NAC or [14C]-NAC/PEG-PCL-Tat. (A–C) The opened and closed columns represent [14C]-NAC and [14C]-NAC/PEG-PCL-Tat, respectively. Each column presents the mean ± SE (n = 10 or 11). Significance was assessed using a t-test.

