

Abstract
Background
Chronic periodontitis is highly prevalent among older adults. The study aimed to compare periodontal disease among Australian older adults in two generations. We hypothesized that the prevalence and severity of periodontitis would decrease from the previous generation to the recent generation.
Methods
Data were obtained from the South Australian Dental Longitudinal Study (SADLS) in 1991 to 1992 (SADLS I) and 2013 to 2014 (SADLS II); population‐based longitudinal surveys of Australian older adults aged ≥60 years. American Academy of Periodontology, the US Centers for Disease Control and Prevention (AAP/CDC), and the 2018 European Federation of Periodontology (EFP/AAP) classification case definitions were used to define and calculate prevalence of chronic periodontitis. Multivariable log‐Poisson regression models were used to identify risk indicators for severe periodontitis after adjusting for other covariates.
Results
There were a total of 801 and 355 participants that underwent a periodontal exam in SADLS I and II, respectively. The prevalence of severe periodontitis was higher in the recent generation (88% and 56%) than the previous generation (75% and 46.7%) under the CDC/AAP and EFP/AAP case definitions, respectively. The mean number of missing teeth was lower in the recent generation (6) than the previous generation (13). The prevalence ratio of severe periodontitis was around two times higher in the younger age group, men, those not born in Australia, and current smokers across both generations.
Conclusions
Our findings indicated that the recent generation of older adults has higher prevalence and severity of chronic periodontitis than the previous generation. Our findings indicated that aging, being male, born overseas, low household income, no dental insurance, and being a current smoker are significant risk factors associated with severe periodontitis among older Australians.
Keywords: clinical attachment level, gingival recession, periodontitis, probing depth, tooth loss
1. INTRODUCTION
Periodontal diseases are common non‐communicable diseases in which ≥1 of the periodontal tissues are affected. 1 Periodontal diseases include non‐destructive (gingivitis) and destructive (periodontitis) types of periodontal disease. 2 Chronic periodontitis is a common and major sub‐disease of periodontal disease which is characterized by GR and/or pocket formation due to the destruction of periodontal tissues and sometimes alveolar bone. Chronic periodontitis is highly prevalent in the adult population. More than 7% of the world's population has severe chronic periodontitis. 3 In Australia, the National Survey of Adult Oral Health 2004 to 2006 4 showed that 20.5% and 2017 to 2018 5 showed that 30.1% of Australian adults had moderate or severe periodontal disease, respectively. Chronic periodontitis is highly prevalent in the older Australian population, affecting 60.8% in 2004 to 2006, 4 and 69.3% in 2017 to 2018. 5
Tooth loss is the ultimate end point of some oral diseases. Periodontal disease is one of the major causes of tooth loss. It is estimated that 30% to 35% of all tooth extractions have been attributed to periodontitis. 3 Tooth loss reduces the ability of chewing, causes masticatory dysfunction, and decreases the intake of nutrients which impact on the immune system, resulting in certain systemic diseases, and even death. 6 Tooth loss may also affect self‐esteem and cause embarrassment. 7 Oral health‐related quality of life, such as physical, psychological, and social relationships, is significantly affected by tooth loss in older adults. 8 , 9
It is well‐documented that periodontal disease is a complex disease with multiple potential contributing factors. These include genetic 10 and epigenetic influences, 11 medication use 12 and/or environmental factors, 13 which together promote periodontal disease initiation and progression. Low socioeconomic status, poor oral hygiene, and oral health related behaviors, psychological stress, and/or depression, increased age, ethnicity, diet/obesity, and systemic health comorbidities are risk factors that contribute to the prevalence of periodontal diseases. 14 , 15 Large epidemiological studies have shown a relationship between periodontal disease and some systemic conditions. These include diabetes mellitus, 16 cardiovascular disease, osteoporosis, respiratory disease, obesity, cancer, and renal disease. 17 , 18
Comparative analysis across generations is useful to better identify groups of greater vulnerability to periodontal disease. The aim of the current study was to compare the periodontal disease among Australian older adults in two generations. We hypothesized that the prevalence and severity of periodontitis would decrease from the previous generation to the recent generation.
2. MATERIALS AND METHODS
2.1. Study design and sample selection
Data were obtained from the South Australian Dental Longitudinal Study (SADLS) in 1991 to 1992 (SADLS I) 19 , 20 and 2013 to 2014 (SADLS II). In these two population‐based longitudinal surveys, a stratified random sample of non‐institutionalized people aged ≥60 years, residing in two South Australian cities, namely the state capital city of Adelaide and the regional city of Mount Gambier, were selected from the South Australian State Electoral Database in 1991 and 2013, respectively. The database is a compulsory register for Australian citizens aged ≥18 years living in non‐institutionalized abodes, and includes name, age, and residential address. The two surveys’ participants represented the generation of older Australians born before 1931 and 1953 which hereafter will be named as previous and recent generations, respectively. 21
2.2. Ethics approval
Both SADLS I and II were reviewed and approved by the University of Human Research Ethics Committee. Participants received information sheets and provided written informed consent.
2.3. Data collection
Participants who agreed to participate were involved in a face‐to‐face interview that included a series of questions about oral and general health conditions and health–related behaviors such as smoking status, use of dental services, social economic status, and social demographic characteristics. Information about dental clinical status was collected during standardized oral epidemiological examinations conducted by registered, trained, and calibrated oral health (including four and three dentists in SADLS I and II, respectively), and were based on the National Institute of Dental Research (NIDR) protocol. 22 The same procedure was applied in both SADLS I and SADLS II, and a participating dental examiner in SADLS I was retained as the gold examiner in SADLS II for the oral examinations.
For the periodontal assessment, gingival recession (GR), and probing depth (PD) measurements were taken at three sites of each tooth present (including third molars); mesio‐buccal, mid‐buccal, and disto‐lingual. Measurements were rounded to the nearest whole millimeter at the time of recording, and clinical attachment level (CAL) as the sum of GR and PD was computed during data analysis. Inter‐examiner reliability was assessed through replicate examinations of 28 and 29 Australian older adults, and intra‐class correlation coefficients (ICC) for the periodontal measurements were 0.46 and 0.73 for mean PD, 0.92 and 0.90 for mean GR, and 0.84 and 0.75 for mean CAL in SADLS I20 and SADLS II, respectively, indicating good to excellent reliability, except ICC for PD from SADLS I.
The response rates of those participating in interviews were 73.3% and 62.3% respectively, and in oral examinations were 75.5% and 74.5% in SADLS I20 and II, respectively.
2.4. Variables
Based on previous studies 4 , 5 , 20 , 23 variables were selected and classified:
Sociodemographic characteristics included age, sex, country of birth, residential location, marital status, education level, and income. Age was 5‐year grouped into 60 to 64, 65 to 69, 70 to 74, 75 to 79, 80 to 84, and ≥85 years. Sex was classified as men or women. Education was categorized as secondary school, trade to diploma degree or tertiary, while household income was classified as low (< AU$ 20,000), medium (AU$ 20,000 to 50,000), and high (> AU$ 50,000).
Oral health‐related behaviors included dentate status, tobacco smoking status, alcohol drinking, and dental insurance conditions. Tobacco smoking status was categorized as current smoker, former smoker, or never smoked. Alcohol drinking was dichotomized into yes and no.
Dental visiting behaviors included frequency of teeth brushing, last dental visit, and usual reason for dental visit. Last dental visit was categorized as ≤12 months or >12 months. Usual reason for dental visit was dichotomized into check‐up or problem.
General health included self‐reported histories of 10 systemic diseases: asthma, arthritis, cancer, or malignancy, cataracts, chronic obstructive pulmonary disease (combining chronic bronchitis and/or emphysema (COPD), diabetes, hypertension, or high blood pressure, heart condition, or heart attack, stroke, or a small stroke (transient ischemic attack), or/and osteoporosis or hip fracture, and was dichotomized into “Yes” or “No”.
Number of tooth loss was calculated. Periodontitis was assessed based on two periodontal case definitions to describe prevalence of periodontitis in the two health surveys:
The American Association of Periodontology and the US Centers for Disease Control and Prevention (AAP/CDC) case definition: 24 A) Moderate periodontitis is the presence of either two sites between adjacent teeth where 4 mm ≤ CAL ≤ 6 mm or at least two such sites have PD ≥5 mm; B) Severe periodontitis is at least two sites between adjacent teeth with CAL ≥6 mm and there is at least one site PD ≥5 mm.
The 2018 European Federation of Periodontology/American Academy of Periodontology (EFP/AAP) classification: 25 A) Periodontitis severity Stage I is the presence of each tooth where 1 mm ≤ CAL ≤2 mm; B) Periodontitis severity Stage II is the presence of each tooth where 3 mm ≤ CAL ≤ 4 mm; C) Periodontitis severity Stage III and IV is the presence of each tooth where CAL ≥5 mm or there is at least one site PD ≥6 mm.
The percentage and mean number of sites with PD of ≥4 mm and CAL of ≥3 mm was additionally calculated to estimate the extent and severity of periodontal disease.
2.5. Statistical analysis
Basic descriptive analyses were conducted to ascertain frequencies and/or severity (means) of the self‐reported and clinical variables listed above with 95% confidence intervals (95% CI) estimated using a SAS‐callable SUDAAN procedure. Further, multivariable log‐Poisson regression models with robust standard error estimation were generated. Unadjusted and adjusted prevalence ratios (PRs) and 95% CI were calculated for prevalence of severity periodontitis (severe and Stage III/IV periodontitis under AAP/CDC and EFP/AAP case definitions, respectively). Statistically significant differences were denoted by non‐over‐lapping 95% CIs, and P values ≤0.05. Data files were managed, and summary variables were computed using SAS software version 9.4 (SAS 9.4, SAS Institute Inc., Cary, NC).
3. RESULTS
In the 1991 to 1992 SADLS I survey, 1,650 participants were interviewed. Of those, 1,205 had their own teeth, 910 had clinical dental examinations, and 801 had periodontal exam. In the 2013 to 2014 SADLS II survey, 810 participants were interviewed. Of those, 650 had their own teeth, 484 had clinical dental examinations, and 355 had periodontal exam.
Table 1 presents the sample characteristics of Australian older adults. The proportion of age groups were similar in SADLS I and II, with more than half in the younger group (60 to 69 years), around one‐third in middle age group (70 to 79 years) and one‐tenth in oldest group (≥80 years). The proportion of men was higher (60%) than women in SADLS I but was an equal 50% distribution in SADLS II. Around one‐third were single across both surveys, and approximately one‐third were also born in a country other than Australia. The proportion with the highest educational attainment decreased by 41% from SADLS I to SADLS II. The proportion of participants reporting they had never smoker increased 27%, and current smoker decreased 55%; and alcohol consumption increased 11% across surveys. The proportion with dental visiting <12 months increased 18% over the 22 years survey period.
TABLE 1.
Baseline sociodemographic and oral health‐related behaviors of Australian adults aged ≥60 years in 1991 to 1992 and 2013 to 2014
| SADLS I (n = 801) | SADLS II (n = 355) | |||||
|---|---|---|---|---|---|---|
| n | % (95% CI) | * P value | n | % (95% CI) | * P value | |
| Sample demographic characteristics | ||||||
| Age groups, years | <0.0001 | <0.0001 | ||||
| 60 to 64 | 206 | 25.7 (22.7–28.8) | 106 | 28.3 (23.7–32.8) | ||
| 65 to 69 | 211 | 26.3 (23.3–29.4) | 119 | 31.7 (27.0–36.5) | ||
| 70 to 74 | 133 | 16.6 (14.0–19.2) | 66 | 17.6 (13.7–21.5) | ||
| 75 to 79 | 148 | 18.5 (15.8–21.2) | 46 | 12.3 (8.9–15.6) | ||
| 80 to 84 | 74 | 9.2 (7.2–11.2) | 31 | 8.3 (5.5–11.1) | ||
| ≥85 | 29 | 3.6 (2.3–4.9) | 7 | 1.9 (0.5–3.2) | ||
| Sex | <0.0001 | 0.9571 | ||||
| Female | 322 | 40.2 (36.8–43.6) | 187 | 49.6 (44.5–54.7) | ||
| Male | 479 | 59.8 (56.4–63.2) | 197 | 50.4 (45.3–55.5) | ||
| Married status | <0.0001 | <0.0001 | ||||
| Married/De‐facto | 582 | 72.8 (69.7–75.8) | 283 | 75.1 (70.7–79.5) | ||
| Single | 218 | 27.3 (24.2–30.3) | 94 | 24.9 (20.5–29.3) | ||
| Born in Australia | <0.0001 | <0.0001 | ||||
| Yes | 546 | 68.3 (65.0–71.5) | 251 | 68.4 (63.6–73.2) | ||
| No | 254 | 31.8 (28.5–35.0) | 116 | 31.6 (26.8–36.4) | ||
| Education level | <0.0001 | <0.0001 | ||||
| Tertiary | 274 | 34.3 (31.0–37.5) | 75 | 19.9 (15.8–23.9) | ||
| Trade/diploma degree | 152 | 19.0 (16.3–21.7) | 126 | 33.4 (28.6–38.2) | ||
| Secondary | 374 | 46.8 (43.3–50.2) | 176 | 46.7 (41.6–51.7) | ||
| Household income | 0.0006 | 0.0040 | ||||
| High | 292 | 38.8 (35.3–42.3) | 126 | 39.4 (34.0–44.8) | ||
| Medium | 255 | 33.9 (30.5–37.3) | 87 | 27.2 (22.3–32.1) | ||
| Low | 206 | 27.4 (24.2–30.5) | 107 | 33.4 (28.2–38.6) | ||
| Oral health and related behaviors | ||||||
| Dental insured | <0.0001 | <0.0001 | ||||
| Had | 331 | 41.7 (38.3–45.1) | 130 | 34.1 (29.3–38.9) | ||
| No | 463 | 58.3 (54.9–61.7) | 251 | 65.9 (61.1–70.7) | ||
| Smoking status | <0.0001 | <0.0001 | ||||
| Never smoked | 360 | 45.3 (41.9–48.8) | 213 | 57.4 (52.4–62.5) | ||
| Former smoker | 344 | 43.3 (39.9–46.8) | 140 | 37.7 (32.8–42.7) | ||
| Current smoker | 90 | 11.3 (9.1–13.5) | 18 | 4.9 (2.6–7.0) | ||
| Alcohol drinking | <0.0001 | <0.0001 | ||||
| No | 203 | 25.3 (22.4–28.4) | 64 | 17.0 (13.2–20.8) | ||
| Yes | 597 | 74.6 (71.6–77.6) | 312 | 83.0 (79.2–86.8) | ||
| Oral hygiene (toothbrushing) | <0.0001 | <0.0001 | ||||
| At least twice/day | 493 | 61.5 (58.2–64.9) | 264 | 69.1 (64.5–73.8) | ||
| Less than twice/day | 308 | 38.5 (35.1–41.8) | 118 | 30.9 (26.2–35.5) | ||
| Last dental visit | <0.0001 | <0.0001 | ||||
| Less than 12 months | 484 | 60.7 (57.3–64.1) | 272 | 71.6 (67.0–76.1) | ||
| More than 12 months | 313 | 39.3 (35.9–42.7) | 108 | 28.4 (23.9–33.0) | ||
| Reasons for dental visit | <0.0001 | 0.7049 | ||||
| Check | 331 | 41.6 (38.2–45.1) | 182 | 48.8 (43.7–53.9) | ||
| Problem | 464 | 58.4 (54.9–61.8) | 191 | 51.2 (46.1–56.3) | ||
P value: Chi‐square test, and P values <0.05 were statistically significant.
Figure 1 depicts the prevalence and 95% CI of chronic diseases among older Australian adults across the 22‐year study period. The proportion of participants having at least one chronic disease increased from 81% to 88%, although there was no statistically significant difference. While the prevalence of most chronic diseases increased across time, such as asthma (from 8% to 15%), diabetes (from 6% to 16%), hypertension (from 35% to 52%), osteoporosis or hip fracture (from 4% to 12%), and stroke (from 7% to 15%), the proportion with heart disease decreased from nearly 20% to 10%, and COPD from 12% to 8% across surveys.
FIGURE 1.
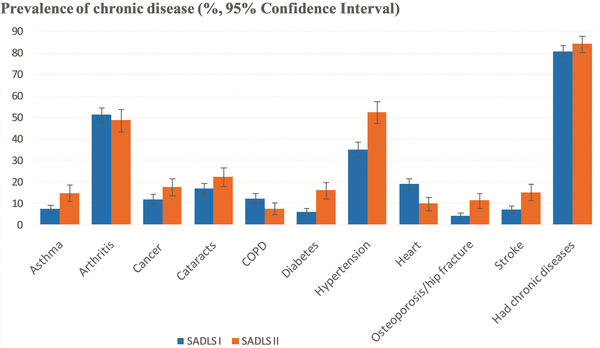
Prevalence and 95% confidence interval of chronic diseases across two generations
Table 2 shows the mean number of teeth lost and prevalence and mean of periodontitis. Mean tooth loss decreased from 13 to 6 over the 22 years survey period. The prevalence of periodontitis increased 17% under the AAP/CDC case definition; as well as Stage III/IV periodontitis (22%) under EFP/AAP definition across surveys. Meanwhile, the proportion of PD ≥6 mm and CAL ≥5 mm increased 58%, and 21%, respectively from SADLS I to SADLS II. The severity of PD ≥4 mm and CAL ≥3 mm increased also. However, there was no statistically significant differences for the extent of PD ≥4 mm and CAL ≥3 mm.
TABLE 2.
Prevalence and mean of periodontitis of Australian adults aged ≥60 years in 1991 to 1992 and 2013 to 2014
| SADLS I | SADLS II | |||||
|---|---|---|---|---|---|---|
| Baseline (1991 to 1992) | Baseline (2013 to 2014) | |||||
| n | % (95% CI) | * P value | n | % (95% CI) | * P value | |
| Total | 801 | 100 (–) | 355 | 100 (–) | ||
| Degree of periodontitis | ||||||
| AAP‐CDC case | <0.0001 | |||||
| No/Mild | 201 | 25.1 (22.1–28.1) | 43 | 12.1 (8.7–15.5) | <0.0001 | |
| Moderate | 486 | 60.7 (57.3–64.1) | 246 | 69.3 (64.6–74.1) | ||
| Severe | 114 | 14.2 (11.8–16.7) | 66 | 18.6 (14.5–22.7) | ||
| <0.0001 | <0.0001 | |||||
| No | 201 | 25.1 (22.1–28.1) | 43 | 12.1 (8.7–15.5) | ||
| Yes (Moderate + Severe) | 600 | 74.9 (71.9–77.9) | 312 | 87.9 (84.5–91.3) | ||
| EFP/AAP case | <0.0001 | <0.0001 | ||||
| Stage I | 38 | 4.7 (3.3–6.2) | 11 | 3.1 (1.3–4.9) | ||
| Stage II | 397 | 49.6 (46.1–53.0) | 147 | 41.4 (36.3–46.6) | ||
| Stage III‐IV | 366 | 45.7 (42.2–49.2) | 197 | 55.5 (50.3–46.6) | ||
| <0.0001 | <0.0001 | |||||
| No | 38 | 4.7 (3.3–6.2) | 11 | 3.1 (1.3–4.9) | ||
| Yes (Stage II‐IV) | 763 | 95.3 (93.8–96.7) | 344 | 96.1 (95.1–98.7) | ||
| PD cases | ||||||
| ≥ 4 mm | 471 | 58.8 (55.4–62.2) | <0.0001 | 256 | 66.7 (61.9–71.4) | <0.0001 |
| ≥ 5 mm | 198 | 24.7 (21.7–27.7) | <0.0001 | 117 | 30.5 (25.8–35.1) | <0.0001 |
| ≥ 6 mm | 93 | 11.6 (9.4–13.8) | <0.0001 | 71 | 18.5 (14.6–22.4) | <0.0001 |
| CAL cases | ||||||
| ≥3 mm | 793 | 99.0 (98.3–99.7) | <0.0001 | 382 | 99.5 (98.8–100.0) | <0.0001 |
| ≥4 mm | 738 | 92.1 (90.3–94.0) | <0.0001 | 377 | 98.2 (96.8–99.5) | <0.0001 |
| ≥ 5 mm | 574 | 71.7 (68.5–74.8) | <0.0001 | 332 | 86.5 (83.0–89.9) | <0.0001 |
| N | Mean (95% CI) | N | Mean (95% CI) | |
|---|---|---|---|---|
| No. of tooth loss | 801 | 12.9 (12.4–13.3) | 384 | 5.9 (5.4–6.5) |
| Extent | ||||
| % of site with PD ≥4 mm | 801 | 6.2 (5.5–6.9) | 384 | 5.8 (4.9–6.7) |
| % of site with PD ≥5 mm | 801 | 1.6 (1.2–1.9) | 384 | 1.4 (1.0–1.7) |
| % of site with PD ≥6 mm | 801 | 0.6 (0.4–0.8) | 384 | 0.7 (0.4–1.0) |
| % of site with CAL ≥3 mm | 801 | 46.8 (44.9–48.8) | 384 | 42.8 (40.5–45.1) |
| % of site with CAL ≥4 mm | 801 | 27.1 (25.3–28.9) | 384 | 26.2 (24.2–28.3) |
| % of site with CAL ≥5 mm | 801 | 14.1 (12.7–15.5) | 384 | 12.3 (10.8–13.7) |
| Severity | ||||
| No. of sites with PD ≥4 mm | 801 | 2.6 (2.3–2.9) | 384 | 3.8 (3.3–4.4) |
| No. of sites with PD ≥5 mm | 801 | 0.6 (0.5–0.7) | 384 | 0.9 (0.7–1.1) |
| No. of sites with PD ≥6 mm | 801 | 0.2 (0.2–0.3) | 384 | 0.5 (0.3–0.6) |
| No. of sites with CAL ≥3 mm | 801 | 18.4 (17.5–19.2) | 384 | 27.1 (25.6–28.6) |
| No. of sites with CAL ≥4 mm | 801 | 9.9 (9.2–10.5) | 384 | 16.3 (15.0–17.5) |
| No. of sites with CAL ≥5 mm | 801 | 4.8 (4.3–5.3) | 384 | 7.3 (6.4–8.1) |
Note:
P value: Chi‐square test, and P values <0.05 were statistically significant.
Table 3 presents bivariate (unadjusted) analysis of prevalence of severe periodontitis in SADLS I and II surveys under the AAP/CDC and EFP/AAP case definitions. A similar trend was observed under the two case definitions: 1) in both surveys, a higher prevalence of severe periodontitis was observed among men and those born overseas; (2) in SADLS I, a higher prevalence of severe periodontitis was observed among those with low household income, current and former smokers, and having diabetes. Under the EFP/AAP case definition, the higher prevalence was the older age groups (≥70 years) and had dental insurance in both surveys; and a paradoxical result for alcohol consumption in SADLS I and II. Under the AAP/CDC case definition, a higher prevalence of severe periodontitis was observed among those with poor oral hygiene (toothbrushing <2/day) in both surveys, and well as among those with low education and dental problem visiting in the SADLS I.
TABLE 3.
Unadjusted analysis of the prevalence ratios (PRs) of severe periodontitis under two case definitions
| SADLS I | SADLS II | |||
|---|---|---|---|---|
| AAP/CDC | EFP/AAP | AAP/CDC | EFP/AAP | |
| PR (95% CI) | PR (95% CI) | PR (95% CI) | PR (95% CI) | |
| Age groups, years | ||||
| 60 to 64 | ref | ref | ref | ref |
| 65 to 69 | 1.85 (1.10–3.12) | 1.14 (0.89–1.46) | 0.72 (0.38–1.37) | 1.21 (0.90–1.61) |
| 70 to 74 | 1.96 (1.12–3.12) | 1.51 (1.18–1.92) | 1.58 (0.87–2.84) | 1.61 (1.21–2.14) |
| 75 to 79 | 1.54 (0.86–2.76) | 1.45 (1.14–1.85) | 1.54 (0.80–2.96) | 1.53 (1.11–2.10) |
| 80 to 84 | 1.32 (0.62–2.78) | 1.68 (1.29–2.18) | 0.93 (0.38–2.31) | 1.72 (1.26–2.36) |
| ≥ 85 | 1.87 (0.76–4.62) | 1.65 (1.16–2.36) | 0.94 (0.15–5.87) | 1.17 (0.51–2.70) |
| Sex | ||||
| Female | ref | ref | ref | |
| Male | 1.80 (1.22–2.65) | 1.47 (1.25–1.76) | 2.19 (1.35–3.55) | 1.27 (1.04–1.54) |
| Married status | ||||
| Married/De‐facto | ref | ref | ref | ref |
| Single | 1.18 (0.82–1.71) | 1.11 (0.94–1.30) | 1.00 (0.60–1.66) | 1.14 (0.93–1.40) |
| Born in Australia | ||||
| Yes | ref | Ref | ref | ref |
| No | 2.47 (1.77–3.46) | 1.43 (1.24–1.66) | 2.04 (1.31–3.19) | 1.21 (1.00–1.47) |
| Education level | ||||
| Tertiary | ref | ref | ref | ref |
| Trade/diploma degree | 1.02 (0.58–1.79) | 1.08 (0.86–1.35) | 1.76 (0.88–3.53) | 0.93 (0.72–1.20) |
| Secondary | 1.64 (1.10–2.44) | 1.18 (0.99–1.40) | 1.45 (0.72–2.89) | 0.94 (0.74–1.20) |
| Household income | ||||
| High | ref | ref | ref | ref |
| Medium | 0.99 (0.64–1.54) | 1.20 (1.00–1.45) | 1.09 (0.60–1.98) | 1.18 (0.90–1.53) |
| Low | 1.53 (1.02–1.54) | 1.21 (1.00–1.48) | 0.77 (0.61–1.98) | 1.19 (0.93–1.52) |
| Dental insured | ||||
| Had | ref | ref | ref | ref |
| No | 1.18 (0.83–1.68) | 1.31 (1.11–1.53) | 1.45 (0.97–2.31) | 1.33 (1.10–1.59) |
| Smoking status | ||||
| Never smoked | ref | ref | ref | ref |
| Former smoker | 1.90 (1.28–2.83) | 1.38 (1.16–1.63) | 1.11 (0.70–1.78) | 1.17 (0.97–1.42) |
| Current smoker | 2.55 (1.55–4.18) | 1.71 (1.39–2.11) | 1.53 (0.63–3.74) | 1.15 (0.74–1.77) |
| Alcohol drinking | ||||
| No | ref | ref | ref | ref |
| Yes | 1.51 (0.96–2.35) | 1.36 (1.12–1.67) | 0.69 (0.41–1.17) | 0.76 (0.62–0.93) |
| Oral hygiene (toothbrushing) | ||||
| At least twice/day | ref | ref | ref | ref |
| Less than twice/day | 1.60 (1.14–2.25) | 1.10 (0.94–1.28) | 1.69 (1.10–2.61) | 1.18 (0.98–1.43) |
| Last dental visit | ||||
| Less than 12 months | ref | ref | ref | ref |
| More than 12 months | 1.21 (0.86–1.67) | 1.10 (0.94–1.28) | 1.36 (0.87–2.13) | 1.17 (0.96–1.41) |
| Reasons for dental visit | ||||
| Check | ref | ref | ref | ref |
| Problem | 1.51 (1.04–2.18) | 1.14 (0.98–1.34) | 0.98 (0.63–1.52) | 1.05 (0.87–1.27) |
| Diabetes | ||||
| No | ref | ref | ref | ref |
| Yes | 2.15 (1.33–3.47) | 1.42 (1.13–1.78) | 0.71 (0.34–1.47) | 1.08 (0.84–1.40) |
| Chronic diseases (at least one) | ||||
| No | ref | ref | ref | ref |
| Had | 0.81 (0.54–1.21) | 1.05 (0.86–1.28) | 1.13 (0.59–2.15) | 1.02 (0.79–1.32) |
Bold values = statistically significant.
Multivariable analysis of prevalence of severe periodontitis are presented in Table 4 and Table 5). In the SADLS I survey (Table 4), after adjusting for all covariates, older adults (≥65 years), those born in oversea, and current smokers had higher prevalence of severe periodontitis than the younger adult (60 to 64 years), born in Australia and never smoker under two case definitions. Participants who had diabetes had higher prevalence of severe periodontitis than those have not had under the AAP/CDC case definition. In the SADLS II survey (Table 5), after adjusting for all covariates, participants who were born overseas had a higher prevalence of severe periodontitis than their counterparts under both case definitions. There was also a higher prevalence in men under the AAP/CDC case definition; and older age group (≥70 years) and current smoker under EFP/AAP case definition.
TABLE 4.
Multivariable models of the prevalence ratio (PRs) of severe periodontitis under two case definitions in SADLS I survey
| AAP/CDC case definition | EFP/AAP case definition | ||||||
|---|---|---|---|---|---|---|---|
| Model 1 | Model 2 | Model 3 | Model 1 | Model 2 | Model 3 | ||
| PRs (95% CI) | PRs (95% CI) | PRs (95% CI) | PRs (95% CI) | PRs (95% CI) | PRs (95% CI) | ||
| Age groups, years | 60 to 64 | ref | ref | ref | ref | ref | ref |
| 65 to 69 | 1.71 (1.02–2.88) | 1.83 (1.11–3.05) | 1.59 (1.00–2.33) | 1.10 (0.86–1.42) | 1.02 (0.89–1.18) | 1.15 (0.93–1.41) | |
| 70 to 74 | 1.80 (1.04–3.13) | 2.01 (1.17–3.45) | 1.68 (1.06–2.68) | 1.46 (1.14–1.86) | 1.20 (1.03–1.39) | 1.18 (1.02–1.38) | |
| 75 to 79 | 1.58 (0.87–2.84) | 1.84 (1.03–3.30) | 1.58 (0.97–2.56) | 1.40 (1.09–1.81) | 1.18 (1.01–1.37) | 1.14 (1.00–1.30) | |
| 80 to 84 | 1.24 (0.58–2.70) | 1.56 (0.76–3.20) | 1.38 (0.75–2.54) | 1.66 (1.26–2.19) | 1.23 (1.04–1.46) | 1.15 (1.00–1.31) | |
| ≥85 | 1.39 (0.51–3.77) | 1.93 (0.83–4.50) | 1.62 (0.75–3.48) | 1.40 (0.98–2.00) | 1.19 (0.94–1.51) | 1.02 (0.90–1.16) | |
| Sex | Female | ref | ref | ref | ref | ref | ref |
| Male | 1.60 (1.08–2.37) | 1.32 (0.86–2.01) | 1.11 (0.77–1.60) | 1.45 (1.22–1.74) | 1.09 (0.98–1.22) | 1.07 (0.97–1.18) | |
| Married status | Married/De‐facto | – | – | – | ref | ref | ref |
| Single | – | – | – | 1.19 (0.98–1.45) | 1.07 (0.96–1.19) | 1.07 (0.96–1.19) | |
| Born in Australia | Yes | ref | ref | ref | ref | ref | ref |
| No | 2.38 (1.68–3.37) | 2.38 (1.69–3.35) | 1.81 (1.34–2.43) | 1.41 (1.20–1.63) | 1.16 (1.05–1.28) | 1.13 (1.04–1.23) | |
| Education level | Tertiary | ref | ref | ref | ref | ref | ref |
| Trade/diploma degree | 1.13 (0.64–1.99) | 1.18 (0.67–2.08) | 1.07 (0.67–1.70) | 1.07 (0.86–1.33) | 1.05 (0.92–1.20) | 1.04 (0.93–1.17) | |
| Secondary | 1.45 (0.97–2.19) | 1.46 (0.97–2.19) | 1.29 (0.91–1.83) | 1.10 (0.92–1.31) | 1.03 (0.92–1.16) | 1.03 (0.93–1.14) | |
| Household income | High | ref | – | – | ref | ref | ref |
| Medium | 0.83 (0.54–1.29) | – | – | 1.18 (0.99–1.42) | 1.05 (0.93–1.18) | 1.03 (0.94–1.15) | |
| Low | 1.32 (0.88–1.99) | – | – | 1.16 (0.96–1.41) | 1.04 (0.92–1.19) | 1.03 (0.92–1.16) | |
| Dental insured | Had | ref | ref | ref | ref | ||
| No | 0.82 (0.58–1.19) | 0.84 (0.61–1.16) | 1.04 (0.93–1.17) | 1.03 (0.94–1.14) | |||
| Smoking status | Never smoked | ref | ref | ref | ref | ||
| Former smoker | 0.83 (0.58–1.19) | 1.29 (0.90–1.84) | 1.06 (0.95–1.18) | 1.04 (0.95–1.15) | |||
| Current smoker | 2.44 (1.59–4.01) | 2.05 (13.1–3.20) | 1.24 (1.06–1.44) | 1.19 (1.03–1.37) | |||
| Alcohol drinking | No | ref | ref | ref | ref | ||
| Yes | 1.10 (0.71–1.69) | 1.05 (0.72–1.53) | 1.06 (0.95–1.19) | 1.05 (0.95–1.16) | |||
| Oral hygiene (toothbrushing) | At least twice/day | – | ref | ref | ref | ||
| Less than twice/day | – | 1.16 (0.85–1.58) | 1.00 (0.90–1.10) | 1.00 (0.91–1.09) | |||
| Last dental visit | Less than 12 months | ref | ref | ref | ref | ||
| More than 12 months | 0.89 (0.61–1.31) | 0.87 (0.61–1.23) | 0.99 (0.88–1.12) | 0.99 (0.90–1.10) | |||
| Reasons for dental visit | Check | ref | ref | ref | ref | ||
| Problem | 1.47 (0.96–2.24) | 1.31 (0.90–1.89) | 1.01 (0.90–1.14) | 1.01 (0.91–1.12) | |||
| Diabetes | No | ref | ref | ||||
| Yes | 1.72 (1.07–2.79) | 1.05 (0.90–1.23) | |||||
| Chronic diseases (at least one) | No | ref | ref | ||||
| Had | 0.84 (0.59–1.20) | 1.03 (0.92–1.14) | |||||
Model 1: adjusting for sociodemographics; Model 2: model 1 plus adjusting for dental health related behaviors; Model 3: Model 2 plus adjusting for general health.
Bold values = statistically significant.
TABLE 5.
Multivariable models of the prevalence ratio (PRs) of severe periodontitis under two case definitions in SADLS II survey
| AAP/CDC case definition | EFP/AAP case definition | ||||||
|---|---|---|---|---|---|---|---|
| Model 1 | Model 2 | Model 3 | Model 1 | Model 2 | Model 3 | ||
| PRs (95% CI) | PRs (95% CI) | PRs (95% CI) | PRs (95% CI) | PRs (95% CI) | PRs (95% CI) | ||
| Age groups, years | 60 to 64 | ref | ref | ref | ref | ref | ref |
| 65 to 69 | 0.77 (0.40–1.48) | 0.78 (0.38–1.55) | 0.88 (0.49–1.61) | 1.22 (0.90–1.65) | 1.08 (0.88–1.32) | 1.02 (0.90–1.15) | |
| 70 to 74 | 1.60 (0.89–2.89) | 1.73 (0.95–3.17) | 1.58 (0.89–2.78) | 1.58 (1.14–2.19) | 1.25 (0.98–1.61) | 1.14 (1.00–1.31) | |
| 75 to 79 | 1.26 (0.64–2.48) | 1.19 (0.59–2.39) | 1.19 (0.62–2.30) | 1.12 (0.74–1.70) | 1.13 (0.84–1.52) | 1.13 (0.99–1.29) | |
| 80 to 84 | 0.68 (0.25–1.84) | 0.47 (0.15–1.46) | 0.68 (0.26–1.79) | 1.64 (1.14–2.34) | 1.28 (0.95–1.52) | 1.17 (1.00–1.36) | |
| ≥85 | 1.19 (0.18 –7.78) | 0.90 (0.14–5.94) | 0.88 (0.16–4.75) | 0.98 (0.41–2.32) | 0.91 (0.53–1.57) | 1.12 (0.91–1.38) | |
| Sex | Female | ref | ref | ref | ref | ref | ref |
| Male | 2.02 (1.22–3.34) | 2.36 (1.35–4.14) | 1.99 (1.22–3.26) | 1.34 (1.07–1.68) | 1.15 (0.97–1.36) | 1.08 (0.98–1.20) | |
| Married status | Married/De‐facto | ref | ref | ref | ref | ref | ref |
| Single | 1.13 (0.69–1.85) | 1.34 (0.76–2.36) | 1.24 (0.71–2.15) | 1.12 (0.84–1.48) | 1.09 (0.89–1.32) | 1.07 (0.96–1.19) | |
| Born in Australia | Yes | ref | ref | ref | ref | ref | ref |
| No | 1.82 (1.15–2.88) | 1.92 (1.17–3.18) | 1.73 (1.11–2.70) | 1.21 (0.97–1.53) | 1.06 (0.89–1.26) | 1.13 (1.04–1.24) | |
| Education level | Tertiary | ref | ref | ref | ref | ref | ref |
| Trade/diploma degree | 1.32 (0.66–2.64) | 1.34 (0.76–2.36) | 1.31 (0.69–2.48) | 0.87 (0.65–1.18) | 0.90 (0.72–1.13) | 1.04 (0.93–1.17) | |
| Secondary | 1.49 (0.75–2.98) | 1.45 (0.69–3.07) | 1.34 (0.70–2.54) | 0.93 (0.70–1.25) | 0.92 (0.73–1.13) | 1.03 (0.93–1.14) | |
| Household income | High | – | – | – | ref | ref | ref |
| Medium | – | – | – | 1.28 (0.96–1.69) | 1.05 (0.83–1.26) | 1.04 (0.93–1.15) | |
| Low | – | – | – | 1.15 (0.87–1.53) | 1.02 (0.83–1.26) | 1.00 (0.88–1.14) | |
| Dental insured | Had | – | – | ref | ref | ||
| No | – | – | 1.12 (0.91–1.39) | 1.03 (0.94–1.14) | |||
| Smoking status | Never smoked | ref | ref | ref | ref | ||
| Former smoker | 0.72 (0.43–1.22) | 0.82 (0.51–1.30) | 1.12 (0.93–1.34) | 1.05 (0.95–1.15) | |||
| Current smoker | 0.66 (0.17–2.50) | 0.53 (0.12–2.29) | 1.10 (0.69–1.74) | 1.19 (1.03–1.36) | |||
| Alcohol drinking | No | – | – | ref | ref | ||
| Yes | – | – | 0.83 (0.65–1.06) | 1.04 (0.94–1.16) | |||
| Oral hygiene (toothbrushing) | At least twice/day | – | – | ref | ref | ||
| Less than twice/day | – | – | 1.11 (0.93–1.32) | 1.00 (0.91–1.09) | |||
| Last dental visit | Less than 12 months | ref | ref | ref | ref | ||
| More than 12 months | 1.19 (0.65–2.17) | 1.36 (0.77–2.40) | 1.03 (0.81–1.32) | 0.99 (0.90–1.10) | |||
| Reasons for dental visit | Check | ref | ref | ref | ref | ||
| Problem | 0.73 (0.41–1.30) | 0.80 (0.47–1.37) | 0.91 (0.75–1.14) | 1.01 (0.91–1.12) | |||
| Diabetes | No | ref | ref | ||||
| Yes | 0.76 (0.41–1.43) | 1.05 (0.91–1.22) | |||||
| Chronic diseases (at least one) | No | ref | ref | ||||
| Had | 1.37 (0.73–2.54) | 1.03 (0.93–1.14) | |||||
Model 1: adjusting for sociodemographics; Model 2: model 1 plus adjusting for dental health related behaviors; Model 3: Model 2 plus adjusting for general health.
Bold values = statistically significant.
4. DISCUSSION
On the whole, our findings did not support our hypothesis. The prevalence and severity of periodontitis increased over the 22‐year study period. Our findings indicated that the higher prevalence of severe periodontitis was among older age groups (≥65 years), men, those born overseas, and current smokers under AAP/CDC and/or EFP/AAP case definitions. The high prevalence of severe periodontitis might be associated with low education and/or household income, no dental insurance, alcohol consumption, poor oral hygiene, dental problem visiting, and having diabetes.
The prevalence and severity of periodontitis in older Australians across both surveys is of concern (increasing around 10%), regardless of the chosen case definition. The prevalence of periodontitis was higher among Australian older adults, compared with older people (≥65 years) in the United States and Turkey 26 , 27 at the same time (between 2012 and 2013) under the two case definitions, except the prevalence of severe periodontitis was higher in older Turkish under the EFP/AAP case definition. 27 The most likely reason is the higher number of teeth retained, which is consistent with “more teeth, more dental diseases” theory 28 in cross‐sectional data analysis. In addition, some confounder effects might affect the prevalence of periodontitis among the recent generation, such as a higher proportion of participants in lower education level and income, and without dental insurance.
Other possible reason could be the proportion of periodontitis‐associated chronic diseases increased across the two surveys, except heart and COPD. Our findings corroborate evidence that indicates that diabetes is a significant risk factor associated with severe periodontitis among older Australian adults, suggesting a bidirectional relationship between periodontitis and diabetes. 16 , 29 However, due to the smaller sample size in SADLS II, with no detailed information on diabetes mellitus or glycemic control, 30 the results might not be accurate. In addition, there was a lack of detail on the effect of periodontal treatment on the ten self‐reported chronic diseases. For example, there was no information on other factors or diseases associated with the chronic diseases, such as having both endothelial dysfunction and hypertension, 31 alpha‐1 antitrypsin deficiency (AATD) and COPD, 32 and no details on type of stroke. 33 This means, these results may not be as accurate, and had more detailed information been sought.
It is undeniable that current smoking was the most significant risk factor association with severe periodontitis. 1 In addition, the worse periodontal condition of men was observed in both surveys, which is consistent with previous studies. 26 , 34
The mean number of teeth lost in older Australian adults showed a relatively large decrease (from 13 to 6) between 1991 and 2013. A previous study has showed that periodontal disease was the cause of about 40% of tooth loss, and patients under regular periodontal maintenance lost fewer teeth. 35 Therefore, in the present study, increasing the proportion of regular dental visiting could be an important factor in reducing tooth loss, together with tobacco smoking cessation.
4.1. Strengths and limitations
The strengths of the study include: 1) the first time in Australia that periodontitis has been assessed across two different generations aged ≥60 years; 2) comparative analysis across generations with large sample sizes in SADLS I increased the study power in terms of the precision; 3) uniform criteria for periodontitis were established under AAP/CDC and EFP/AAP case definitions, which increased reliability of our findings. Limitations of the present study included the lack of information/details on tooth loss due to severe periodontitis, using unweighted data for analysis and a smaller sample size in SADLS II, results in biased reporting. However, the biases would be reduced due to random sample collection and higher response rate of participating in the interview (around 65%) and oral examination (about 75%). In addition, periodontal examination was measured at three sites of each tooth present to save time and cost, rather than six sites, 36 which might lead to an underestimation of periodontitis due to periodontitis being a site‐specific disease.
In the future, longitudinal analysis will be conducted to measure the incidence and progression of chronic periodontitis and association with tooth loss, which provide evidence to emphasis, at a policy level, the importance of preventive and treatment strategies for older adults both in Australia and elsewhere.
5. CONCLUSIONS
Our findings indicated that the recent generation (SADLS II) of older adults has higher prevalence and severity of chronic periodontitis than the previous generation (SADLS I). Our findings indicated that aging, being male, born overseas, low household income, no dental insurance, and being a current smoker are significant risk factors associated with severe periodontitis among older Australians.
ACKNOWLEDGMENTS
SADLS I baseline study was supported by the National Health and Medical Research Council (NHMRC: Australia) Grant No. #910557, and by the US National Institute of Dental Research Grant (NIDR: No. R01 DE09588). SADLS II baseline study was supported by the NHMRC (Australia) Grant No. #1011589. We also thank and acknowledge all study participants, and the staff who collected data. The authors report no conflicts of interest related to this study.
Ju X, Harford J, Luzzi L, Jamieson LM. Prevalence, extent, and severity of periodontitis among Australian older adults: Comparison of two generations. J Periodontol. 2022;93:1387–1400. 10.1002/JPER.21-0458
DATA AVAILABILITY STATEMENT
Data cannot be shared publicly because of privacy issues of the participants. Data are available from the University of Adelaide Data Access (contact via Australian Research Centre for Population Oral Health: arcpoh@adelaide.edu.au) for researchers who meet the criteria for access to confidential data.
REFERENCES
- 1. Chikte U, Pontes CC, Karangwa I, et al. Periodontal disease status among adults from South Africa‐prevalence and effect of smoking. Int J Environ Res Public Health. 2019;16: 3662. [DOI] [PMC free article] [PubMed] [Google Scholar]
- 2. Armitage GC. Classifying periodontal diseases–a long‐standing dilemma. Periodontol 2000. 2002;30:9‐23. [DOI] [PubMed] [Google Scholar]
- 3. Kassebaum NJ, Smith AGC, Bernabé E, et al. Global, regional, and national prevalence, incidence, and disability‐adjusted life years for oral conditions for 195 countries, 1990‐2015: a systematic analysis for the global burden of diseases, injuries, and risk factors. J Dent Res. 2017;96:380‐387. [DOI] [PMC free article] [PubMed] [Google Scholar]
- 4. Slade G, Spencer A, Roberts‐Thomson K. Australia's dental generations: the national survey of adult oral health 2004‐06. 2007;Vol. AIHW cat. no. DEN 165. Canberra: Australian Institute of Health and Welfare, 2007. Available at: https://www.aihw.gov.au/getmedia/6a66dc9c‐a17b‐4a45‐904a‐7748660133d6/adgnsaoh04‐06.pdf.aspx?inline=true
- 5. Ha DH, Spencer AJ, Ju X, Do LG. Periodontal diseases in the Australian adult population. Aust Dent J. 2020; 65 Suppl 1:S52‐S58. [DOI] [PubMed] [Google Scholar]
- 6. Romandini M, Baima G, Antonoglou G, Bueno J, Figuero E, Sanz M. Periodontitis, edentulism, and risk of mortality: a systematic review with meta‐analyses. J Dent Res. 2021;100:37‐49. [DOI] [PubMed] [Google Scholar]
- 7. Kaur P, Singh S, Mathur A, et al. Impact of dental disorders and its influence on self esteem levels among adolescents. J Clin Diagn Res. 2017;11:Zc05‐Zc8. [DOI] [PMC free article] [PubMed] [Google Scholar]
- 8. Schierz O, Baba K, Fueki K. Functional oral health‐related quality of life impact: a systematic review in populations with tooth loss. J Oral Rehabil. 2021;48:256‐270. [DOI] [PubMed] [Google Scholar]
- 9. Slade GD, Akinkugbe AA, Sanders AE. Projections of U.S. edentulism prevalence following 5 decades of decline. J Dent Res. 2014;93:959‐965. [DOI] [PMC free article] [PubMed] [Google Scholar]
- 10. Bunte K, Kuhn C, Walther C, et al. Clinical significance of ragA, ragB, and PG0982 genes in Porphyromonas gingivalis isolates from periodontitis patients. Eur J Oral Sci. 2021;129:e12776. [DOI] [PubMed] [Google Scholar]
- 11. Sun J, Liu Y, Qu Q, et al. Effect of histone acetylation on osteogenic differentiation of periodontal ligament stem cells derived from periodontitis tissue. West China Journal of Stomatology. 2019;37:102‐105. [Article in Chinese] [DOI] [PMC free article] [PubMed] [Google Scholar]
- 12. Wang IC, Askar H, Ghassib I, Wang CW, Wang HL. Association between periodontitis and systemic medication intake: a case‐control study. J Periodontol. 2020; 91:1245‐1255. [DOI] [PubMed] [Google Scholar]
- 13. Han DH, Kim MS. Are occupational and environmental noises associated with periodontitis? Evidence from a Korean representative cross‐sectional study. BMC Public Health. 2021;21:616. [DOI] [PMC free article] [PubMed] [Google Scholar]
- 14. Ravidà A, Galli M, Saleh MHA, et al. Maintenance visit regularity has a different impact on periodontitis‐related tooth loss depending on patient staging and grading . J Clin Periodontol. 2021 Jun 1. 48:1008‐1018. [DOI] [PubMed] [Google Scholar]
- 15. Costa PD, Canaan JCR, Midori CP, et al. Influence of micronutrient intake, sociodemographic, and behavioral factors on periodontal status of adults assisted by a public health care system in Brazil: a cross‐sectional multivariate analysis. Nutrients. 2021;13: 973. [DOI] [PMC free article] [PubMed] [Google Scholar]
- 16. Lindner M, Arefnia B, Ivastinovic D, Sourij H, Lindner E, Wimmer G. Association of periodontitis and diabetic macular edema in various stages of diabetic retinopathy. Clin Oral Investig. 2021. [DOI] [PMC free article] [PubMed] [Google Scholar]
- 17. Chambrone L, Foz AM, Guglielmetti MR, et al. Periodontitis and chronic kidney disease: a systematic review of the association of diseases and the effect of periodontal treatment on estimated glomerular filtration rate. J Clin Periodontol. 2013;40:443‐456. [DOI] [PubMed] [Google Scholar]
- 18. Bourgeois D, Inquimbert C, Ottolenghi L, Carrouel F. Periodontal pathogens as risk factors of cardiovascular diseases, diabetes, rheumatoid arthritis, cancer, and chronic obstructive pulmonary disease‐is there cause for consideration? Microorganisms. 2019;7: 424. [DOI] [PMC free article] [PubMed] [Google Scholar]
- 19. Slade GD. Social impact of oral disease among older adults. [Thesis]. The University of Adelaide; 1993. Available at: https://hdl.handle.net/2440/21409 [Google Scholar]
- 20. Slade GD, Spencer AJ. Periodontal attachment loss among adults aged 60+ in South Australia. Community Dent Oral Epidemiol. 1995;23:237‐242. [DOI] [PubMed] [Google Scholar]
- 21. Hariyani N, Spencer AJ, Luzzi L, et al. The prevalence and severity of root surface caries across Australian generation. CDOE. 2019; 47: 398‐406 [DOI] [PubMed] [Google Scholar]
- 22. Miller AJ, Brunelle JA., CARLOS JP., BROWN LJ, Lob H. Oral Health Of United States Adults. The National Survey Of Oral Health In Us Employed Adults And Settlors. 1985‐86. Bethesda; National Institute of Dental Research, 1987. NIH Publication No.87‐2868. [Google Scholar]
- 23. Ju X. Periodontal disease, tooth loss and daily life in older adults in South Australia: a longitudinal study. [Thesis]. The University of Adelaide; 2016. Available at: https://digital.library.adelaide.edu.au/dspace/bitstream/2440/100195/1/01front.pdf [Google Scholar]
- 24. Page RC, Eke PI. Case definitions for use in population‐based surveillance of periodontitis. J Periodontol. 2007; 78 Suppl 7:1387‐1399. [DOI] [PubMed] [Google Scholar]
- 25. Tonetti MS, Greenwell H, Kornman KS. Staging and grading of periodontitis: framework and proposal of a new classification and case definition. J Clin Periodontol. 2018;45 Suppl 20:S149‐S161. [DOI] [PubMed] [Google Scholar]
- 26. Eke PI, Dye BA, Wei L, et al. Update on prevalence of periodontitis in adults in the United States: NHANES 2009 to 2012. J Periodontol. 2015;86:611‐622. [DOI] [PMC free article] [PubMed] [Google Scholar]
- 27. Germen M, Baser U, Lacin CC, Fıratlı E, İşsever H, Yalcin F. Periodontitis prevalence, severity, and risk factors: a comparison of the AAP/CDC Case Definition and the EFP/AAP Classification. Int J Environ Res Public Health. 2021;18: 3459. [DOI] [PMC free article] [PubMed] [Google Scholar]
- 28. Joshi A, Douglass C, Feldman H, Mitchell P, Jette A. Consequences of success: do more teeth translate into more disease and utilization? J Pub Health Dent. 1996; 56:190‐197. [DOI] [PubMed] [Google Scholar]
- 29. Stanko P, Izakovicova Holla L. Bidirectional association between diabetes mellitus and inflammatory periodontal disease. a review. Biomed Pap Med Fac Univ Palacky Olomouc Czech Repub. 2014;158:35‐38. [DOI] [PubMed] [Google Scholar]
- 30. Wu C, Yuan Y, Liu H. et al. Epidemiologic relationship between periodontitis and type 2 diabetes mellitus. BMC Oral Health. 2020; 20: 204.31. [DOI] [PMC free article] [PubMed] [Google Scholar]
- 31. Leong X, Ng C, Badiah B, Das S. Association between hypertension and periodontitis: possible mechanisms. Hindawi. 2014; 768237. [DOI] [PMC free article] [PubMed] [Google Scholar]
- 32. Sapey E, Yonel Z, Edgar R, et al. The clinical and inflammatory relationships between periodontitis and chronic obstructive pulmonary disease. J Clin Periodontol. 2020; 47:1040‐1052. [DOI] [PubMed] [Google Scholar]
- 33. Fagundes NCF, Ponte APC, Almeida SC, et al. Periodontitis as a risk factor for stroke: a systematic review and meta‐analysis. Vascular Health and Risk Management. 2019; 15: 519‐532 [DOI] [PMC free article] [PubMed] [Google Scholar]
- 34. Shiau HJ, Reynolds MA. Sex differences in destructive periodontal disease: a systematic review. J Periodontol. 2010;81:1379‐1389. [DOI] [PubMed] [Google Scholar]
- 35. Stadler AF, Mendez M, Oppermann RV, Gomes SC. Tooth loss in patients under periodontal maintenance in a private practice: a retrospective study. Braz Dent J. 2017;28:440‐446. [DOI] [PubMed] [Google Scholar]
- 36. Eke PI, Dye BA, Wei L, et al. Update on prevalence of periodontitis in adults in the United States: NHANES 2009 to 2012. J periodontol. 2015; 86:611‐622. [DOI] [PMC free article] [PubMed] [Google Scholar]
Associated Data
This section collects any data citations, data availability statements, or supplementary materials included in this article.
Data Availability Statement
Data cannot be shared publicly because of privacy issues of the participants. Data are available from the University of Adelaide Data Access (contact via Australian Research Centre for Population Oral Health: arcpoh@adelaide.edu.au) for researchers who meet the criteria for access to confidential data.