

Abstract
Objective
Monitoring microcirculation and visualizing microvasculature are critical for providing diagnosis to medical professionals and guiding clinical interventions. Ultrasound provides a medium for monitoring and visualization; however, there are challenges due to the complex microscale geometry of the vasculature and difficulties associated with quantifying perfusion. Here, we studied established and state‐of‐the‐art ultrasonic modalities (using six probes) to compare their detection of slow flow in small microvasculature.
Methods
Five ultrasonic modalities were studied: grayscale, color Doppler, power Doppler, superb microvascular imaging (SMI), and microflow imaging (MFI), using six linear probes across two ultrasound scanners. Image readability was blindly scored by radiologists and quantified for evaluation. Vasculature visualization was investigated both in vitro (resolution and flow characterization) and in vivo (fingertip microvasculature detection).
Results
Superb Microvascular Imaging (SMI) and Micro Flow Imaging (MFI) modalities provided superior images when compared with conventional ultrasound imaging modalities both in vitro and in vivo. The choice of probe played a significant difference in detectability. The slowest flow detected (in the lab) was 0.1885 ml/s and small microvasculature of the fingertip were visualized.
Conclusions
Our data demonstrated that SMI and MFI used with vascular probes operating at higher frequencies provided resolutions acceptable for microvasculature visualization, paving the path for future development of ultrasound devices for microcirculation monitoring.
Keywords: doppler, imaging, MFI, microcirculation, micro‐flow detection, micro‐flow imaging, microvasculature, SMI, ultrasound, vasculature monitoring
Abbreviations
- B‐mode
Brightness Mode/Grayscale ultrasound imaging
- CDI
Color Doppler imaging
- CNC
Computer numerical control
- CT
Computed tomography
- LSC
Laser speckle contrast imaging
- MFI
Microflow imaging
- MR
Magnetic resonance imaging
- NIRS
Near‐infrared spectroscopy
- NDT
Non‐Destructive testing
- OCT
Optical coherence tomography
- PAT
Photoacoustic tomography
- PDI
Power Doppler imaging
- PDMS
Polydimethylsiloxane
- PET
Positron emission tomography
- SDI
Spectral Doppler imaging
- SMI
Superb microvascular imaging
1. INTRODUCTION
Imaging microvasculature and measuring microcirculation velocity are important elements of monitoring health status in patients being treated for a variety of disorders, such as hypertension, systemic sclerosis, wound repair, spinal cord injury, and stroke. 1 , 2 , 3 , 4 , 5 , 6 , 7 , 8 Microcirculation can be visualized using either invasive or noninvasive approaches. 9 , 10 , 11 Invasive or semi‐invasive techniques such as intravital microscopy, radionuclide injections, thermodilution, and iontophoresis have been used to study microcirculation. 12 , 13 , 14 , 15 However, issues including patient discomfort, long procedure times, and low accuracy have limited these approaches in standard practices. 9 , 11 Therefore, noninvasive approaches have become more prominent in the study of microcirculation. Such approaches include micro‐CT, MRI, PET, LSCI, OCT, PAT, and thermography. 9 , 10 , 11 Certain limitations are associated with these approaches as well, including cost, portability, penetration depth, and the use of ionizing radiation. 9 , 10 , 11 Therefore, ultrasound has become a preferred method for noninvasive, portable, non‐radiating monitoring method of microvasculature in the clinic. Imaging microvasculature as well as monitoring microcirculation and microflow is essential in a number of clinical applications and medical scenarios. These applications can have implications with regards to but not limited to traumatic brain injury, aneurysm, acute spinal cord injury, peripheral tissue perfusion for critical care patients, organ transplantation, and chronic wound healing, whereby the microflow can be a surrogate of tissue health and healing following injury. 7 , 8 , 16 , 17 , 18 , 19 , 20
The first diagnostic use of ultrasound was in 1942, when Karl Dussik utilized it to image the brain. 21 , 22 Ultrasound has advanced significantly since the first use of grayscale, B‐mode, and anatomical images to noninvasively image tissue and now comprises a number of imaging modalities that can both visualize anatomical structures and monitor physiological values. For example, CDI and SDI modes can be used to identify the velocity as well as direction of blood flow in microcirculation. 13 , 23 Furthermore, other modalities, such as PDI, SMI, and MFI, have been developed that possess improved sensitivity for detecting microcirculation. 13 , 24 , 25 PDI has five times the sensitivity of CDI and is angle‐independent, which helps eliminate the potential for detecting artifacts and false negatives for blood flow. 13 SMI is a proprietary imaging technique from Canon that uses a novel algorithm to distinguish microvascular flow from motion artifacts and other noise artifacts, allowing the user to easily visualize the microvasculature. While the exact details of this proprietary algorithm are not fully described in the literature, SMI is known as a Doppler ultrasound modality capable of producing enhanced image quality through noise reduction and motion artifact elimination. This commercial software aims to visualize low‐velocity blood flow and achieves high‐quality images equipped with superior resolution. 24 Similar to Canon's SMI modality, MFI is a proprietary imaging technique from Philips, allowing the user to detect ultra‐fine, low‐energy flow patterns in vasculature with a diameter of <1 mm and with flow velocities <2 cm/s. MFI separates slow flow signals from tissue motion artifacts without the use of contrast agents. 25 Despite advances in imaging techniques for ultrasound, minimal work has been done to make ultrasound usable for portable transducers facilitating continuous monitoring of microvasculature. Recently, there is a trend toward portability of ultrasound transducers. 26 , 27 , 28 To the best of our knowledge, these devices do not yet possess the ability to monitor perfusion and microcirculation, which is important for the adoptability in future applications. 29
Wearable (or implantable) conformal devices, named in the literature as “flexible electronic” devices, have recently been growing in popularity due to their ability to monitor vital‐signs and biomarkers continuously. 30 , 31 , 32 , 33 Previous reports on wearable (or implantable) devices for monitoring blood flow have predominantly described thermal, 30 NIRS, 32 and capacitive‐based sensors. 31 , 33 Ultrasound wearable (or implantable) sensors have also recently been developed for various biomedical applications. 34 , 35 , 36 , 37 Although some of these devices show great promise in adapting ultrasound technology into a small, conformal device for continuous blood flow monitoring, 34 , 35 , 36 the currently reported spatial resolution of these devices as well as other design considerations (e.g. power, imaging modality, signal processing, transducer design, energy loss) may require further understanding for continuous monitoring of microvasculature and microcirculation.
1.1. Objective
Here, we used commercially available ultrasound transducers and diagnostic modalities to investigate the imaging parameters and settings required for monitoring microcirculation. These parameters can inform the design inputs and specifications of future conformal, wearable (or implantable) ultrasonic devices. In this study, we investigated the capabilities of six linear ultrasound probes on two state‐of‐the‐art clinical ultrasound systems for imaging microvasculature as well as quantifying blood flow.
1.2. Study breakdown
This study was done in two settings: (1) an in vitro study, with both a general‐purpose phantom and a cardiac Doppler flow phantom and (2) an in vivo study, on fingertip microvasculature.
1.3. In vitro study
A general‐purpose phantom was used to study the smallest detectable feature (at various depths) available through a commercially available phantom. Similarly, a cardiac Doppler flow phantom was used to study the slowest detectable flow rate, given the limitations of the flow pump as well as the capabilities of the utilized transducers and imaging modalities.
1.4. In vivo study
Figure 1 shows the microvasculature present in the fingertip that was imaged during the in vivo study. In addition to our interest in the relationship between the probe parameters and the obtained microvasculature images, various ultrasound imaging modalities (i.e., B‐mode, CDI, PDI, SMI, and MFI) were also investigated for their use in terms of monitoring microvasculature and detecting microflow.
FIGURE 1.

Schematic of the blood vessels and the complex network of microvasculature in a human finger. (Printed with permission. © 2021 JHU Neurosurgery‐ Ian Suk. All rights reserved.)
As mentioned previously, determining suitable parameters for imaging microcirculation can pave the path for future wearable (or implantable) conformal ultrasound transducers designed for continuous monitoring of microcirculation in patients with vascular disorders.
2. MATERIALS AND METHODS
2.1. Description of utilized ultrasound scanners, probes, modalities, and phantoms
2.1.1. Ultrasound scanners
Experiments were conducted using two ultrasound scanners: Philips EPIQ 7 (Philips Healthcare) and Canon Aplio i800 (Canon Medical Systems).
2.1.2. Ultrasound modalities
Five ultrasound imaging modalities were investigated in this study: B‐mode, CDI, PDI, SMI, and MFI. B‐mode or grayscale is a two‐dimensional ultrasound imaging method where B refers to the brightness. Doppler modalities (Color Doppler and Power Doppler) utilize Doppler effect and frequency shift in visualization and measurement of blood flow. SMI and MFI are advanced modalities that have been developed for detection and visualization of slow flow by enhancing weak signals from smaller vessels and elimination of artifact signals. A description of these ultrasound imaging modalities can be found in Table 1. Imaging was performed using the imaging modes available on each system, and as a result not all of the modalities were available on every scanner or probe (e.g., SMI is a proprietary Canon imaging technique, and MFI is a proprietary Philips imaging technique).
TABLE 1.
Summary of ultrasound imaging modalities utilized in this study
| Ultrasound imaging mode | Applications and specifications |
|---|---|
| Grayscale imaging (B‐mode) | B (brightness) mode, the use of grayscale imaging in ultrasound renders a 2D image. 21 |
| Color Doppler imaging (CDI) | CDI is a development of pulsed wave Doppler, wherein the frequency shift is mapped onto the 2D image, with flow toward and away from the transducer plotted as different colors. 20 |
| Power Doppler imaging (PDI) | PDI uses the amplitude of Doppler signal to detect moving matter. Power Doppler is independent of velocity and direction of flow. 21 |
| Superb microvascular imaging (SMI) | SMI is a novel imaging technique that is specifically developed for visualization of low‐velocity and small‐diameter blood vessels. 22 |
| Microflow imaging (MFI) | MFI, a newly developed ultrasound imaging technique that intends to visualize micro vessels and slow blood flow signals without using contrast agents. 22 |
2.1.3. Ultrasound probes
For both in vitro and in vivo studies, each experiment was conducted using the following probes on the Philips EPIQ 7 scanner: L12‐3, L12‐5, and eL18‐5; and these probes on the Canon Aplio i800 system: 11L3, i18LX5, and i22LH8. The goal was to use several linear probes with varying frequencies to better understand what frequency range (and probe design) may be suitable to visualize microcirculation and to detect microflow. A tabulated breakdown of the ultrasound probes used in the study can be found in Table 2.
TABLE 2.
A summary of the ultrasound scanners, probes, and modalities utilized in this study
| Ultrasound scanners | Probe ID | Frequency range bandwidth available on the probe (MHz) | Utilized modalities and operational frequency (MHz) | ||||
|---|---|---|---|---|---|---|---|
| B‐mode | CDI | PDI | SMI | MFI | |||
| Philips EPIQ 7 | L12‐3 | 3.0–12.0 | 7 | 4 | 6 | N/A | N/A |
| L12‐5 | 5.0–12.0 | 7 | 6 | 7 | N/A | N/A | |
| eL18‐4 | 2.0–22.0 38 | 10 | 10 | 10 | N/A | 9.1 | |
| Canon Aplio i800 | 11L3 | 3.0–8.0 39 | 4 | 4 | 3 | 4 | N/A |
| i18LX5 | 4.0–18.0 | 10 | 6 | 7 | 8 | N/A | |
| i22LH8 | 8.8–22.0 | 22 | 12 | 14 | 12 | N/A | |
Note: Also tabulated columns 3–8 are utilized frequency ranges for these probes and modalities. Microimaging modalities (SMI/MFI) are not available (N/A) on some of the ultrasound modes.
Each imaging modality may utilize only a portion of the spectral components available on the probe's frequency range (bandwidth). This is specifically the case as one compares the Doppler modalities, such as CDI and PDI, to B‐mode. To that point, the frequencies at which the probes operated during imaging in each modality are also summarized in Table 2.
2.1.4. Ultrasound phantoms
The ultrasound equipment and phantoms utilized in this study are shown in Figure 2. In the in vitro study, a general‐purpose phantom (Model: 054GS, CIRS) was used for resolution and depth studies (i.e., investigating the smallest target on the phantom that can be experimentally visualized by the six commercial probes listed in Table 2).
FIGURE 2.

Experimental setup and equipment utilized on this study: (A) a general purpose phantom was used for in vitro resolution studies, i.e., the smallest detectable feature (at various depths) available to us through a commercially available phantom; (B) similarly, a cardiac flow pump (left) and Doppler phantom (right) were also utilized in the in vitro study to the slowest detectable flow rate, given the limitations of the flow pump as well as the capabilities of the utilized transducers and imaging modalities; and finally, and (C) the experimental set up for in vivo study, showcasing the participant's hand, the ultrasound probe holder, and a sample scanner
In addition, use of a cardiac Doppler flow phantom (Model: 523A, CIRS) and a Doppler flow pump (Model: 769, CIRS) enabled investigation of the slowest flow rate available on the pump, that is detectable using the specified ultrasonic probes and imaging modalities.
In the in vivo study, a probe holder was used to stabilize the ultrasound probe and reduce error caused by motion artifacts. A certified sonographer operated the probes and as typical to the clinical world, qualitatively (based on experience) optimized gain, and color scales during the imaging process.
2.2. In vitro studies
2.2.1. What is the smallest lesion on the phantom that can be visualized?
To determine the axial and lateral resolutions, as well as the imaging depth achievable with the ultrasound probes outlined in Table 2, a general‐purpose ultrasound phantom was utilized (Figure 2A). These ultrasound probes were manually held over the ultrasound phantom by a sonographer and were acoustically coupled to the phantom through ultrasound gel (AquasonicGel, Clinton Twp, Michigan).
The phantom was imaged in both the near and far field, to determine the axial and lateral resolution, as well as the depth (vertical distance). Figure 3A–C aims to illustrate the regions and parameters discussed here.
FIGURE 3.
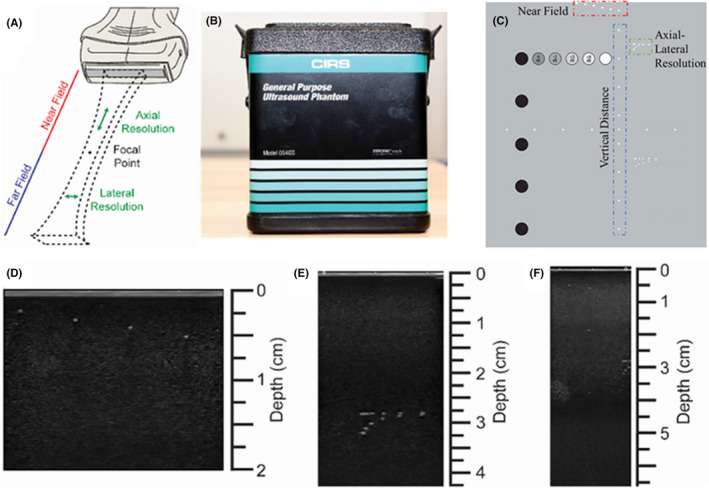
Characterization of ultrasound probe resolutions and imaging depth. (A) Illustration of the ultrasound beam in the near and far field; (B) front view of the general‐purpose ultrasound phantom; (C) rear view of (and the guide map for) the general‐purpose phantom for the resolution study. The imaging targets are marked, and color coded for better understanding. The color‐coding of red, blue, and green are meant to associate these parameters to those illustrated in (A). Representative image acquired from (D) near field, (E) axial and lateral resolution assessment, and (F) penetration depth
For the vertical distance image, the maximum possible imaging depth for each probe was studied. Images of all three regions (Figure 3D–F) were collected with each probe, and the axial and lateral resolution of the probes, as well as the imaging depth was then determined.
2.2.2. What is the slowest flow rate (on the pump) that is detectable in this study?
To demonstrate the accuracy of the ultrasound probes for measuring slow fluid flow, a Doppler flow pump (Model: 769, CIRS) and a cardiac Doppler flow phantom (Model: 523A, CIRS) were used (Figure 4B). For this experiment, Doppler fluid (Model: 769DF, CIRS) was circulated through the phantom. This fluid flow contains customized scatterers that aim to acoustically mimic red blood cells and, as a result, commercially claims to simulate the acoustic characteristics of blood. The Doppler flow pump was programmed to generate a pulsatile flow pattern. The flow pump was set to generate a flow rate of 0.2 ml/sec (12 ml/min) through a radius of 2 mm, thus mimicking comparable microvasculature sizes and flow rates to those in the literature. For example, Klarhofer M et al 40 discusses vessel diameters ranging from 800 μm to 1.8 mm and flow rates of 3.0–26 ml/min in arteries and 1.2–4.8 ml/min in veins. Ultrasound gel was used to acoustically couple the ultrasound probes to the cardiac Doppler flow phantom. Using the ultrasound probes discussed in Section 2.1.1, the flow rate through the cardiac Doppler flow phantom was measured with all the imaging modalities described in Section 2.1. The flow rate measured by the ultrasound probes operating in each of the modalities described in Section 2.1 was then compared to the known input flow rate of 0.2 ml/s generated by the Doppler flow pump.
FIGURE 4.

Fluid flow characterization, using cardiac Doppler phantom. (A) Representative images resulting from each ultrasound probe (rows) under different ultrasound modalities (columns) in a slow flow rate of 0.2 ml/s. (B) Doppler flow pump (Model: 769, CIRS) and the cardiac Doppler flow phantom (Model: 523A, CIRS). The pump was set to generate 0.2 ml/s flow in pulsatile mode. This was the slowest this pump could operate in the above‐mentioned setting
2.3. In vivo microcirculation studies
2.3.1. Experimental protocol
The human finger has been used as an in vivo model for high resolution and three‐dimensional photoacoustic imaging. 41 The fingertip was utilized here as the in vivo model to acquire images of complex microvasculature and slow blood circulation (anatomically distal from heart) to compare imaging modalities.
The present study was approved by the Johns Hopkins Medicine Institutional Review Board (IRB00292131). Ultrasound images of the nondominant middle fingertip were obtained. Participants rested their arms flat and supine. Ultrasound gel was placed on the pad of the finger to couple the ultrasound probe to the patient. A commercially available probe holder (Doppler String Phantom, CIRS), similar to Mahapatra et al., 29 was used to stabilize the ultrasound probe, facilitate reproducibility, and reduce error caused by motion artifacts. Gain and color scales were qualitatively optimized by the sonographer as normally practiced in the clinic. Following the setup depicted in Figure 2C, each probe described earlier was utilized to acquire B‐mode images of the patient. This process was repeated for all imaging modalities described in Section 2.1. To account for physiological variability across patients, a total of four patients underwent imaging with three repetitions in each condition. Welch's t‐test statistical analyses were performed among groups, and p‐values were calculated (p ≤ .05*, p ≤ .01**, p ≤ .001***, p ≤ .001****).
2.3.2. Assessment of the in vivo images by radiologists
Following de‐identification of the images, three radiology readers (one adult radiologist, one pediatric radiologist, and one sonographer) ranked the quality of the images on a scale from 1 to 10, with 1 being “unreadable” and 10 being “the clearest”.
The readers were asked to assess all images in two separate categories: 1. detectability of microvasculature and visualization of vessels and 2. detectability of blood flow. Specifically, grayscale images were assessed for the quality of the vessel wall visualization, while color Doppler images were assessed based on the fluid flow detection. Similarly, MFI and SMI images were assessed based on microvasculature visualization and microflow detection. The readers were blinded to each image's experimental group. Finally, these blinded survey readers were also asked to identify any case in which they perceived the image modality as showing flow noise or artifact where not truly present.
Statistical distribution of the data, such as maximum, minimum, median, first quartile, and third quartile, was analyzed by MATLAB (Mathworks). The outcomes were plotted as Violin plots using the R software package (University of Auckland). 42
3. RESULTS
3.1. In vitro study: characterization of ultrasound probe capabilities in detecting small dimensions
To better understand the capabilities of the above‐specified ultrasound probes, a series of in vitro characterization experiments were performed. Specifically, the probes were used to image a general‐purpose ultrasound phantom (see Figure 3A–C) as well as a cardiac Doppler flow phantom (see Figure 4B). The general‐purpose ultrasound phantom was used to determine the axial and lateral resolutions as well as the imaging depth for these probes. The quantitative results from this study are summarized in Table 3.
TABLE 3.
Imaging characterization (near field length, axial and lateral resolutions, and imaging depth
| Ultrasound system | Probe ID | Center frequency (MHz) | Axial resolution (μm) | Lateral resolution (mm) | Near field (mm) | Imaging depth (mm) | |
|---|---|---|---|---|---|---|---|
| Theoretical | Experimental | ||||||
| Philips | L12‐3 | 7.5 | 200 | 500 | 1 | 6 | 140 |
| L12‐5 | 8.5 | 176 | 250 | 1 | 6 | 80 | |
| eL18‐4 | 11 | 136 | 250 | 1 | 6 | 120 | |
| Canon | 11L3 | 7 | 214 | 500 | 2 | 6 | 100 |
| i18LX5 | 11.5 | 130 | 500 | 2 | 6 | 80 | |
| i22LH8 | 15 | 100 | 250 | 1 | 4 | 60 | |
Table 3 demonstrates the theoretical axial resolutions (calculated from the amount associated with the speed of sound, c (m/s), divided by frequency, f (Hz): λ = c/f. The table also lists the experimental values obtained when imaging the smallest lesion available to us on the general‐purpose phantom. As a result, while a lesion of 250 μm was observed in the axial resolution experimentally, the same transducer can theoretically visualize a 100 μm lesion.
Table 3 also displays the ability of these probes for visualizing structures on the scale of 250 μm, which is in the physiologically relevant range. 40 This scale appears to be closer to venous vessels in the microcirculation (<200 μm), as opposed to arterial vessels (<100 μm 43 ). Based on the frequency of the probes utilized in this study, and assuming linear acoustics, we hypothesize that an ultrasound probe with a center frequency of closer to 30 MHz may be required to visualize 50–100 μm microvasculature.
3.2. In vitro study: characterization of ultrasound probes capabilities in measuring slow flow rates
The cardiac Doppler flow phantom was used to determine the ability of the ultrasound probes in measuring slow fluid flows, which are common in microvasculature. Doppler fluid was pumped through the phantom at a controlled rate of 0.2 ml/sec, the slowest flow possible for the available pump, and the flow rate was measured using the probes described in Section 2.1.1 with imaging modalities described in Section 2.1. Figure 4A shows representative images taken by each probe operating under different ultrasound modalities. The results from this study are summarized in Table 4.
TABLE 4.
Flow rate quantification using different ultrasound modalities to image the cardiac Doppler phantom at 0.2 ml/s
| Ultrasound system | Probe ID | Ground truth flow rate from the flow pump (ml/s) | Measured flow rate (ml/s) | ||
|---|---|---|---|---|---|
| Expected value | CDI | PDI | SMI/MFI | ||
| Philips | L12‐3 | 0.2 | 0.5253 | 0.4863 | N/A* |
| L12‐5 | 0.2 | 0.4373 | 0.4486 | N/A* | |
| eL18‐4 | 0.2 | 0.4712 | 0.4486 | 0.1986 | |
| Canon | 11L3 | 0.2 | 0.5780 | 0.2136 | 0.2136 |
| i18LX5 | 0.2 | 0.5278 | 0.1885 | 0.1995 | |
| i22LH8 | 0.2 | 0.5278 | N/M** | N/M** | |
Note: The MFI and SMI modes are not available in L12‐3 and L12‐5 probes (N/A*). Due to the small surface area and the geometry of the transducer, it was difficult to measure flow on the cardiac phantom and hence the data is marked as not measurable (N/M**). For other modalities in this probe, specialty PDI, the results were considered an outlier among the detected flow rate values listed on this table.
As expected, higher frequency ultrasound probes quantified the known fluid flow rate more accurately. 44 , 45 Additionally, the power Doppler imaging mode generated more accurate results than color Doppler mode. 46
As evident from Table 4, and specifically on the Philips scanner, the flow rate detected using the MFI modality was comparable in value to the expected ground truth. Even though the PDI and CDI values on the Philips system were comparable to one another, there appeared to be a considerable error margin in these two modalities compared to the value generated by the Doppler pump.
Alternatively, on the Canon scanner, the PDI values were comparable to the SMI and to the ground truth (value of 0.2 ml/s) set by the Doppler pump (Table 4). These observations could be due to the nature of these proprietary modalities and their dependencies on Doppler signals, power, or motion artifacts. 47 , 48 , 49 For instance, the SMI modality is reported to be developed based on sensitive Doppler technology with low‐motion artifacts, which can facilitate detection of low‐velocity blood flow signals with high‐resolution frame rates. 50
The small surface geometry and limitations in the imaging depth of the higher frequency Canon probe (i22LH8) prevented the ability to study SMI and PDI on the cardiac Doppler phantom. For other modalities in this probe, particularly PDI, the results considered an outlier among the detected flow rate values. Furthermore, while the MFI mode was used on the eL18‐4 probe, it was not available on the L12‐3 and L12‐5 probes. Therefore, future investigations can aim to investigate the accuracy of the MFI and SMI modes on an in vitro setting more thoroughly. Despite this limitation, all the probes and imaging modalities were used in vivo to visualize the microvasculature in the fingertip.
3.3. In vivo study: characterization of ultrasound images of fingertip microvasculature
This section shows the results of the in vivo study obtained from the non‐dominant middle fingertip of four volunteers. For each of the two ultrasound scanners, six linear probes, and each imaging modality, four images were acquired by a certified sonographer (6 linear ultrasound probes, four imaging modalities –SMI/FMI were not available in two of the probes‐ and four images were taken for each making 88 images in total per volunteer and 352 in total). For all of the four participants in this study, the imaging protocol (number of probes, imaging modalities, and repetition of imaging) was the same. As depicted in Figure 2C and described in Section 2.3, the subject's arm was extended and rested on the table and the ultrasound probe was held on the middle finger with a commercial probe holder. 29 Figure 5 shows representative images obtained from each ultrasound probe in the above‐specified modalities. It should be noted the built‐in color maps from one scanner to another, resulting in a potential source of confusion (e.g. note the addition of the yellow color for PDI in the Canon scanner, when compared to Philips). 51 , 52
FIGURE 5.

In vivo ultrasound imaging of nondominant middle fingertip: Representative images obtained from each ultrasound probe (rows) using the listed ultrasound modalities (columns). White arrows (associated with the 3rd row/3rd column and 4th row/4th column) show regions identified as noise or artifacts by radiologists. SMI/MFI modalities are not available in L12‐3 and L12‐5 probes
Figures 6, 7, 8, 9 show the results of the quantitative scoring assessment, conducted by radiologists, for vasculature visualization and flow detection using the above specified linear probes and ultrasound modalities.
FIGURE 6.

The scored (perceived) clarity of microvasculature visualization in vivo using different probes and ultrasound modalities. These plots aim to illustrate the values of the scores for the perceived clarity of microvasculature visualization for various probes under (A) B‐mode modality, (B) power Doppler modality, (C) color Doppler modality, and (D) microvascular modalities. As mentioned previously, MFI is only available in eL18‐4 and SMI is only available in probes of the Canon ultrasound system. A Welch's t‐test statistical analysis was performed among the studied groups and p‐values were calculated (p ≤ .05*, p ≤ .01**, p ≤ .001***, p ≤ .001****). The significance is shown relative to the superior ultrasonic probes
FIGURE 7.

The scored (perceived) clarity of microflow detection, in vivo, for different probes, given a certain ultrasound modality. This plot illustrates the values of the scores given by radiologists for the perceived ease of microflow detection for various probes, under the (A) grayscale B‐mode modality, (B) power Doppler modality, (C) color Doppler modality, and (D) microvascular modalities. As mentioned previously, MFI is only available in eL18‐4 and SMI is only available in probes of the Canon ultrasound system. A Welch's t‐test statistical analysis was performed among different studied groups and p‐values were calculated (p ≤ .05*, p ≤ .01**, p ≤ .001***, p ≤ .001****). The significance is only shown for the superior ultrasonic probes
FIGURE 8.
The scored (perceived) clarity of microvasculature visualization in vivo for different probes given a certain ultrasound modality. These plots illustrate the values of the scores for the perceived clarity of microvasculature visualization for various modalities under probe (A) L12‐3, (B) 11L3, (C) L12‐5, (D) i18LX5, (E) eL18‐4, and (F) i22LH8. As mentioned previously, MFI is only available in eL18‐4 and SMI is only available in probes of the Canon ultrasound system. A Welch's t‐test statistical analysis was performed among groups, and p‐values were calculated (p ≤ .05*, p ≤ .01**, p ≤ .001***, p ≤ .001****). The significance is only shown for the superior ultrasonic probes
FIGURE 9.

The scored (perceived) clarity of microflow detection, in vivo, for different probes given a certain ultrasound modality. These plots illustrate the values of the scores given by radiologists for the perceived clarity of microvasculature visualization for various modalities under probe (A) L12‐3, (B) 11L3, (C) L12‐5, (D) i18LX5, (E) eL18‐4, and (F) i22LH8. As mentioned previously, MFI is only available in eL18‐4 and SMI is only available in probes of the Canon ultrasound system. A Welch's t‐test statistical analysis was performed among different studied groups and p‐values were calculated (p ≤ .05*, p ≤ .01**, p ≤ .001***, p ≤ .001****). The significance is only shown for the superior ultrasonic probes
3.3.1. Identification of appropriate probes in microvascular visualization, given a defined modality
Figure 6 takes a deeper look into each imaging modality (B‐mode, CDI, PDI, and SMI/MFI) separately and summarizes how the radiologists scored the clarity of microvasculature visualization in vivo for each probe The plots show the clarity of visualization (10 being the best) by each probe for a fixed modality.
Across all imaging modalities, the i22LH8 probe of the Canon system with a frequency range of 8–22 MHz scored the highest (the clearest visualization) of the linear probes investigated in this study. Figure 6D provides findings related to the modalities specific to microcirculation. A comparison between the radiologists' readability scores of SMI/MFI modalities, across a variety of probes, reveals enhanced readability in images acquired by i22LH8 (on average 79%), when compared to images acquired by the 11L3 probe (on average 40%). Similarly, images acquired by the i18LX5 probe and eL18‐4, respectively, received scores of 53% and 59%, on average. While an increased number of radiologists can improve the results, this finding provides context with respect to how the most commonly used vascular probes function within microcirculation modalities.
It is worthwhile noting that L12‐3 is a linear probe advertised by Philips as being designed specifically for vasculature imaging. Our results indicated that this probe earned the second highest maximum score by radiologists in the B‐mode modality.
Since the L12‐3 did not possess the compatibility with microvascular imaging modalities (SMI or MFI), the eL18‐4 by Philips and i22LH8 by Canon proved to provide superior detectability of vasculature in the microvascular (SMI//MFI) modes.
3.3.2. Identification of appropriate probes in microflow detection, given a defined modality
One of the goals of this study was to detect slow circulation and determine which probe (and frequency) could reasonably monitor microcirculation. To address this aim, the radiologists were asked to score all images for flow detection and blood circulation. The graphs in Figure 7 represent quantified values, scored by radiologists, when comparing various probes for each of the ultrasound modalities capable of microflow detection in vivo.
As shown in Figure 7A, and as expected, flow detection is not applicable in B‐mode. While the i22LH8 (Hockey Stick) probe from Canon scored the highest median rank by radiologists for flow detection, it is important to note the elongated statistical distribution associated with the data points for other probes in the violin plots in Figure 7. This large variability in scores suggests that other probes can also provide comparable high scores in the detectability of microflow; though as expected, ultrasound imaging clarity seems to be subjective.
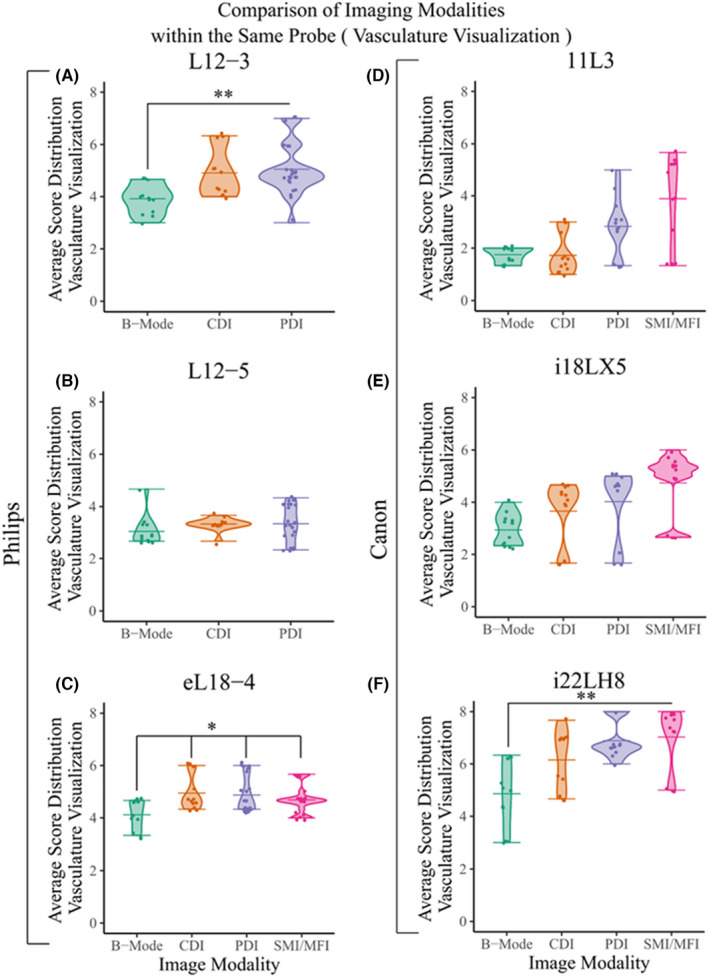
3.3.3. Performance of a single probe in various modalities in terms of microvasculature visualization and microflow detection
In this section, we investigated the obtained data to analyze the performance of a single probe for visualizing microvasculature, and detection microflow in distinctive ultrasound modalities (B‐mode, CDI, PDI and SMI/MFI).
Microvasculature visualization
Figure 8 shows the performance associated with each one of the six probes in this study based on scored values obtained from the radiologists for microvasculature visualization.
Figure 8A shows the L12‐3 vascular probe (by Philips) in various modalities, excluding the microvascular modalities that were not available. The data suggests that this probe was ranked higher in Doppler modes for microvasculature detection.
Based on the plots shown on Figure 8A–F it appears that the probes equipped with microvascular modalities (i.e., SMI/MFI) scored higher for their abilities to visualize the microvasculature of interest. These probes include Canon's i18LX5, Philips' eL18‐4, and Canon's i22LH8, respectively. The comparison of different imaging modalities in these probes is shown in the i22LH8 probe, where there is a statistically significant difference of average scoring of SMI in vascular visualization compared to PDI, CDI and B‐mode. Similarly, in eL18‐4 the average scores of microvessel visualization using MFI and Doppler modalities are significantly superior to grayscale mode (Figure 8C). SMI achieved higher scores using probe i18LX5 in vasculature visualization compared to other imaging modalities, however there was no significant difference among them (Figure 8E).
Microflow detection
Figure 9 shows the performance associated with each of the six probes based on scored values obtained from the radiologists for microflow detection.
Similar to the microvasculature visualization section discussed above, Figure 9 illustrates that probes equipped with SMI/MFI techniques scored higher by radiologists in terms of their capabilities for enhanced microflow detection.
Based on the plots shown in Figure 9C–F, it appears that the probes equipped with microvascular modalities (i.e., SMI/MFI) scored higher for their abilities to detect the microflow of interest. These probes are Canon's i18LX5, Philips' eL18‐4, and Canon's i22LH8, respectively.
Frequency aside, the i22LH8 (Hockey Stick) probe shown in Figure 9F was scored, by the radiologists, as the most suitable both in SMI and Doppler modalities, in terms of its ability for microflow detection. The average value of flow detection in SMI modality is higher compared to other Doppler modalities in this study (Figure 8A–F). However, there is no significant difference between the average scoring value of SMI/MFI to the Doppler modes. No flow information was applicable in grayscale.
4. DISCUSSION
4.1. Summary of findings and assumptions
This study investigated the imaging capabilities of six linear ultrasonic probes across two clinical ultrasound systems to determine the optimal settings for visualizing and monitoring microcirculation. In addition to investigating different probe designs, five ultrasound modalities (B‐mode, CDI, PDI, SMI, and MFI) were also studied both in vitro, using ultrasound phantoms, and in vivo, using fingertip microvasculature. Below is a summary of findings:
4.1.1. Probe design
As expected, the geometry and frequency of a probe have plausible influence on performance. Overall, the i22LH8 probe provided the best image quality for microcirculation detection among the six probes in this study. We expect that the high frequency of this probe played a role in this outcome, as well as the fact that the probe is a vascular probe. Even within the same probe, as one may notice in Figure 5 and Table 2, some of the images/modalities utilizing higher frequencies did not necessarily provide better images. This could be due to the fact that those frequencies were not necessarily using the optimal/center frequencies of the probes.
4.1.2. Imaging modalities
As expected, it was found that the newly introduced SMI and MFI imaging modalities on the Canon and Philips systems, respectively, provided superior microvasculature images when compared with conventional ultrasound imaging modalities. Undoubtedly, each ultrasonic modality has its own advantages and limitations; and in a qualitative field, such as radiology, no one study can claim absolute superiority in applicability of one modality over another for a certain use. This said, in our specific study with the goal of visualization of microvasculature or detection and monitoring of microcirculation, the state‐of‐the‐art modalities, such as SMI and MFI, provided images with higher acceptability among radiologists. Given the context, the proprietary aspect of these modalities may limit the advances of this field.
4.1.3. Angular dependency of the Doppler measurements
The study demonstrated that accurate quantification of microcirculation can be challenging due to the unknown angle between the transducer and microvasculature. This challenge was addressed, during the in vitro studies, by utilizing a Doppler phantom that incorporated a fixed angle as part of its structure.
4.2. Shortcomings and future directions
4.2.1. In vitro phantoms
Currently, there is no phantom that captures the small scale and three‐dimensional curvature of microvasculature with materials that mimic the acoustic characteristics (e.g., speed of sound and attenuation) of soft tissue. Future work could use bifurcation models with microfluidic channels to represent realistic anatomy more accurately, although this approach would present a two‐fold challenge: (i) capturing the three‐dimensional curvature of such vasculature will be difficult, as most microfluidic devices are structured in a two‐dimensional (planar) manner and (ii) most microfluidic devices are built out of PDMS (polydimethylsiloxane) or other materials that are not acoustically friendly. 53 , 54 Although ideally the general‐purpose phantom would have had smaller lesions to more closely mimic finger microvasculature, the study was considered satisfactory for the purposes of the in vitro study as a first step toward the in vivo study. Accessibility of in vitro phantoms with the proper dimensions, three‐dimensional curvatures, and acoustic properties may be a challenge requiring in depth knowledge of the acoustofluidics field.
4.2.2. In vitro flow measurements
Our results demonstrated detection of flow rates down to 0.2 ml/s (equal to 12 ml/min). Klarhöfer M et al. reports blood flow rates of 3.0–26 ml/min in arteries and 1.2–4.8 ml/min in veins for circulation in the human finger. 50 As a result, the rate we investigated in our in vitro study—0.2 ml/s (equal to 12 ml/min)—is within the range for arteries, however it might not be in the appropriate range for veins. 40 Future studies may need to utilize a more accurate flow pump to investigate venous flow rates.
4.2.3. In vivo study
The in vivo experiments could be expanded upon by increasing the sample size for both the number of subjects as well as the number of radiologists reviewing the ultrasound data. Additionally, the middle finger circulation can change when held horizontally or vertically (facing up or down). Future studies can investigate this effect, as well as patient‐dependency of such effects.
4.2.4. Ultrasound probes
To revisit our assumptions, it is important to note that this study primarily focused on ultrasound frequency as one of the main variables associated with the image quality required for microcirculation. However, ultrasound probe design is more elaborate than solely the variation of frequency. For example, this study only used linear probes (mainly for consistency purposes). Due to the typically curved geometries present in the human body, future studies could investigate the microvasculature imaging capabilities of convex or concave ultrasound probes. Additional design parameters of the probes (e.g., number of elements, element spacing, the crystal structure) can also influence the image quality and hence need to be understood further.
4.3. Long‐term implications of the study
This study aimed to pave the path for identification of the ultrasound parameters required for high resolution visualization of microvasculature. The results presented herein may, in the long‐term, help facilitate the use of wearable or implantable ultrasound transducers for continuous monitoring of microcirculation.
5. PERSPECTIVES
Monitoring microcirculation and visualizing microvasculature are critical for providing diagnoses to medical professionals to guide clinical interventions. As such, this information can help mitigate complications and injury progression. In this paper, we studied microvasculature imaging capabilities of six linear ultrasonic probes and five ultrasound modalities across two clinical ultrasound systems to determine the optimal imaging parameters. These results could pave the path for the design of ultrasound transducers for monitoring of microcirculation to help patients across a broad spectrum of needs—from burn victims to stroke patients.
CONFLICT OF INTEREST
The authors declare no conflict of interest.
ACKNOWLEDGMENTS
The authors declare that there is no conflict of interest. This work was supported by funding from Defense Advanced Research Projects Agency, DARPA, Award Contract #: N660012024075. In addition, AM acknowledges funding support from Johns Hopkins Institute for Clinical and Translational Research's Clinical Research Scholars Program (KL2), administered by the National Center for Advancing Translational Sciences, National Institute of Health.
Aghabaglou F, Ainechi A, Abramson H, et al. Ultrasound monitoring of microcirculation: An original study from the laboratory bench to the clinic. Microcirculation. 2022;29:e12770. doi: 10.1111/micc.12770
Fariba Aghabaglou and Ana Ainechi contributed equally in the capacity of co‐first authors.
Betty M. Tyler and Amir Manbachi contributed equally in the capacity of co‐senior authors.
Funding information
This research was made possible by collaborative efforts among faculty, clinicians, students, sonographers, and scientists at the Johns Hopkins School of Medicine Departments of Neurosurgery, Radiology, Biomedical Engineering, and Electrical Engineering. We acknowledge funding support from Defense Advanced Research Projects Agency, DARPA, Award Contract #: N660012024075. In addition, AM acknowledges funding from Johns Hopkins Institute for Clinical and Translational Research (ICTR)'s Clinical Research Scholars Program (KL2), administered by the National Center for Advancing Translational Sciences (NCATS), National Institute of Health (NIH KL2 TR003099). All the in vivo and human participation in this study is approved by Johns Hopkins Medicine Institutional Review Board (IRB00292131)
Contributor Information
Betty M. Tyler, Email: btyler@jhmi.edu.
Amir Manbachi, Email: amir.manbachi@jhu.edu.
DATA AVAILABILITY STATEMENT
The datasets generated and analysed during the current study are available from the corresponding authors on reasonable request.
REFERENCES
- 1. Pérez‐Bárcena J, Goedhart P, Ibáñez J, et al. Direct observation of human microcirculation during decompressive craniectomy after stroke*. Crit Care Med. 2011;39(5):1126‐1129. doi: 10.1097/CCM.0b013e31820ead5e [DOI] [PubMed] [Google Scholar]
- 2. Hwang BY, Mampre D, Ahmed AK, et al. Ultrasound in traumatic spinal cord injury: a wide‐open field. Neurosurgery. 2021;89:372‐382. doi: 10.1093/neuros/nyab177 [DOI] [PMC free article] [PubMed] [Google Scholar]
- 3. Ichioka S, Watanabe H, Sekiya N, Shibata M, Nakatsuka T. A technique to visualize wound bed microcirculation and the acute effect of negative pressure. Wound Repair Regen. 2008;16(3):460‐465. doi: 10.1111/j.1524-475X.2008.00390.x [DOI] [PubMed] [Google Scholar]
- 4. Mugii N, Hasegawa M, Hamaguchi Y, et al. Reduced red blood cell velocity in nail‐fold capillaries as a sensitive and specific indicator of microcirculation injury in systemic sclerosis. Rheumatology. 2009;48(6):696‐703. doi: 10.1093/rheumatology/kep066 [DOI] [PubMed] [Google Scholar]
- 5. Ming‐Yie J, Hsin H, Tse‐Lin H, Yuh‐Ying Lin W, Wei‐Kung W. The importance of pulsatile microcirculation in relation to hypertension. IEEE Eng Med Biol Mag. 2000;19(3):106‐111. doi: 10.1109/51.844389 [DOI] [PubMed] [Google Scholar]
- 6. Manbachi A, Kambhampati S, Ainechi A, et al. Intraoperative Ultrasound to Monitor Spinal Cord Blood Flow after Spinal Cord Injury. Vol 11317. SPIE Medical Imaging. SPIE; 2020. [Google Scholar]
- 7. Samandari M, Aghabaglou F, Nuutila K, et al. Miniaturized needle Array‐mediated drug delivery accelerates wound healing. Adv Healthc Mater. 2021;10(8):2001800. doi: 10.1002/adhm.202001800 [DOI] [PubMed] [Google Scholar]
- 8. Derakhshandeh H, Kashaf SS, Aghabaglou F, Ghanavati IO, Tamayol A. Smart bandages: the future of wound care. Trends Biotechnol. 2018;36(12):1259‐1274. doi: 10.1016/j.tibtech.2018.07.007 [DOI] [PMC free article] [PubMed] [Google Scholar]
- 9. Daly SM, Leahy MJ. 'Go with the flow': a review of methods and advancements in blood flow imaging. J Biophotonics. 2013;6(3):217‐255. doi: 10.1002/jbio.201200071 [DOI] [PubMed] [Google Scholar]
- 10. Allen J, Howell K. Microvascular imaging: techniques and opportunities for clinical physiological measurements. Physiol Meas. 2014;35(7):R91‐R141. doi: 10.1088/0967-3334/35/7/r91 [DOI] [PubMed] [Google Scholar]
- 11. Lal C, Leahy MJ. An updated review of methods and advancements in microvascular blood flow imaging. Microcirculation. 2016;23(5):345‐363. doi: 10.1111/micc.12284 [DOI] [PubMed] [Google Scholar]
- 12. Turner J, Belch JJF, Khan F. Current concepts in assessment of microvascular endothelial function using laser doppler imaging and iontophoresis. Trends Cardiovasc Med. 2008;18(4):109‐116. doi: 10.1016/j.tcm.2008.02.001 [DOI] [PubMed] [Google Scholar]
- 13. De Bruyne B, Pijls NH, Smith L, Wievegg M, Heyndrickx GR. Coronary thermodilution to assess flow reserve: experimental validation. Circulation. 2001;104(17):2003‐2006. doi: 10.1161/hc4201.099223 [DOI] [PubMed] [Google Scholar]
- 14. Furkalo NK, Tsygankov AT, Radzivil VV. Clearance of radioactive xenon in evaluating microcirculation in patients with ischaemic heart disease. Cor Vasa. 1985;27(1):60‐67. [PubMed] [Google Scholar]
- 15. Tabuchi A, Mertens M, Kuppe H, Pries AR, Kuebler WM. Intravital microscopy of the murine pulmonary microcirculation. J Appl Physiol. 2008;104(2):338‐346. doi: 10.1152/japplphysiol.00348.2007 [DOI] [PubMed] [Google Scholar]
- 16. Manbachi A. Handbook for clinical ultrasound: Beginner's guide to Fundamental Physics & Medical Ultrasound Applications. Audible; 2021. [Google Scholar]
- 17. Yu J, Lavery L, Kim K. Super‐resolution ultrasound imaging method for microvasculature in vivo with a high temporal accuracy. Sci Rep. 2018;8(1):13918. doi: 10.1038/s41598-018-32235-2 [DOI] [PMC free article] [PubMed] [Google Scholar]
- 18. Huang C, Zhang W, Gong P, et al. Super‐resolution ultrasound localization microscopy based on a high frame‐rate clinical ultrasound scanner: an in‐human feasibility study. Phys Med Biol. 2021;66(8):8NT01. doi: 10.1088/1361-6560/abef45 [DOI] [PMC free article] [PubMed] [Google Scholar]
- 19. Tsehay Y, Weber‐Levine C, Kim T, et al. Advances in monitoring for acute spinal cord injury: a narrative review of current literature. Spine J. 2022:1‐16. doi: 10.1016/j.spinee.2022.03.012 [DOI] [PubMed] [Google Scholar]
- 20. Marcos A, Olzinski AT, Ham JM, Fisher RA, Posner MP. The interrelationship between portal and arterial blood flow after adult to adult living donor liver transplantation. Transplantation. 2000;70(12):1697‐1703. [DOI] [PubMed] [Google Scholar]
- 21. Manbachi A, Cobbold RSC. Development and application of piezoelectric materials for ultrasound generation and detection. Ultrasound. 2011;19(4):187‐196. doi: 10.1258/ult.2011.011027 [DOI] [Google Scholar]
- 22. Atlas of Ultrasound‐Guided Procedures in Interventional Pain Management. 1st ed. Springer‐Verlag New York; 2011. [Google Scholar]
- 23. Routh HF. Doppler ultrasound. IEEE Eng Med Biol Mag. 1996;15(6):31‐40. doi: 10.1109/51.544510 [DOI] [Google Scholar]
- 24. Zamani M, Skagen K, Scott H, Lindberg B, Russell D, Skjelland M. Carotid plaque neovascularization detected with superb microvascular imaging ultrasound without using contrast media. Stroke. 2019;50(11):3121‐3127. doi: 10.1161/STROKEAHA.119.025496 [DOI] [PubMed] [Google Scholar]
- 25. Jaguś D, Skrzypek E, Migda B, Woźniak W, Mlosek RK. Usefulness of doppler sonography in aesthetic medicine. J Ultrason. 2021;20(83):e268‐e272. doi: 10.15557/JoU.2020.0047 [DOI] [PMC free article] [PubMed] [Google Scholar]
- 26. Baribeau Y, Sharkey A, Chaudhary O, et al. Handheld point‐of‐care ultrasound probes: the new generation of POCUS. J Cardiothorac Vasc Anesth. 2020;34(11):3139‐3145. doi: 10.1053/j.jvca.2020.07.004 [DOI] [PMC free article] [PubMed] [Google Scholar]
- 27. Moussaoui G, Zakaria AS, Negrean C, et al. Accuracy of Clarius, handheld wireless point‐of‐care ultrasound, in evaluating prostate morphology and volume compared to radical prostatectomy specimen weight: is there a difference between transabdominal vs transrectal approach? J Endourol. 2021;35:1300‐1306. doi: 10.1089/end.2020.0874 [DOI] [PubMed] [Google Scholar]
- 28. Huang CC, Lee PY, Chen PY, Liu TY. Design and implementation of a smartphone‐based portable ultrasound pulsed‐wave doppler device for blood flow measurement. IEEE Trans Ultrason Ferroelectr Freq Control. 2012;59(1):182‐188. doi: 10.1109/tuffc.2012.2171 [DOI] [PubMed] [Google Scholar]
- 29. Mahapatra S, Kaovasia TP, Ainechi S, et al. Design of an Ultrasound Probe Holder to minimize motion artifact during sonography. American Society of Mechanical Engineers; 2021. [DOI] [PMC free article] [PubMed] [Google Scholar]
- 30. Webb RC, Ma Y, Krishnan S, et al. Epidermal devices for noninvasive, precise, and continuous mapping of macrovascular and microvascular blood flow. Sci Adv. 2015;1(9):e1500701. doi: 10.1126/sciadv.1500701 [DOI] [PMC free article] [PubMed] [Google Scholar]
- 31. Boutry CM, Nguyen A, Lawal QO, Chortos A, Rondeau‐Gagné S, Bao Z. A sensitive and biodegradable pressure sensor array for cardiovascular monitoring. Adv Materials. 2015;27(43):6954‐6961. doi: 10.1002/adma.201502535 [DOI] [PubMed] [Google Scholar]
- 32. Rwei AY, Lu W, Wu C, et al. A wireless, skin‐interfaced biosensor for cerebral hemodynamic monitoring in pediatric care. Proc Natl Acad Sci. 2020;117(50):31674‐31684. doi: 10.1073/pnas.2019786117 [DOI] [PMC free article] [PubMed] [Google Scholar]
- 33. Boutry CM, Beker L, Kaizawa Y, et al. Biodegradable and flexible arterial‐pulse sensor for the wireless monitoring of blood flow. Nat Biomed Eng. 2019;3(1):47‐57. doi: 10.1038/s41551-018-0336-5 [DOI] [PubMed] [Google Scholar]
- 34. Hu H, Zhu X, Wang C, et al. Stretchable ultrasonic transducer arrays for three‐dimensional imaging on complex surfaces. Sci Adv. 2018;4(3):eaar3979. doi: 10.1126/sciadv.aar3979 [DOI] [PMC free article] [PubMed] [Google Scholar]
- 35. Wang C, Li X, Hu H, et al. Monitoring of the central blood pressure waveform via a conformal ultrasonic device. Nat Biomed Eng. 2018;2(9):687‐695. doi: 10.1038/s41551-018-0287-x [DOI] [PMC free article] [PubMed] [Google Scholar]
- 36. Sempionatto JR, Lin M, Yin L, et al. An epidermal patch for the simultaneous monitoring of haemodynamic and metabolic biomarkers. Nat Biomed Eng. 2021;5:737‐748. doi: 10.1038/s41551-021-00685-1 [DOI] [PubMed] [Google Scholar]
- 37. Curry EJ, Le TT, Das R, et al. Biodegradable nanofiber‐based piezoelectric transducer. Proc Natl Acad Sci. 2020;117(1):214‐220. doi: 10.1073/pnas.1910343117 [DOI] [PMC free article] [PubMed] [Google Scholar]
- 38. Philips . eL18‐4. Updated 2021. https://www.usa.philips.com/healthcare/product/HC453561780782/el18‐4. Accessed 24 August, 2021.
- 39. Canon medical systems . Aplio series radiology and shared service transducers. Transducers for Ultrasound Systems; 2018. [Google Scholar]
- 40. Klarhöfer M, Csapo B, Balassy C, Szeles JC, Moser E. High‐resolution blood flow velocity measurements in the human finger. Magn Reson Med. 2001;45(4):716‐719. doi: 10.1002/mrm.1096 [DOI] [PubMed] [Google Scholar]
- 41. Xi L, Jiang H. High resolution three‐dimensional photoacoustic imaging of human finger joints in vivo. Appl Phys Lett. 2015;107(6):63701. doi: 10.1063/1.4926859 [DOI] [Google Scholar]
- 42. Ihaka R, Gentleman RR. A language for data analysis and graphics. J Comput Graph Stat. 1996;5(3):299‐314. doi: 10.1080/10618600.1996.10474713 [DOI] [Google Scholar]
- 43. Wiedeman MP. Dimensions of blood vessels from distributing artery to collecting vein. Circ Res. 1963;12(4):375‐378. doi: 10.1161/01.res.12.4.375 [DOI] [PubMed] [Google Scholar]
- 44. Christopher DA, Burns PN, Starkoski BG, Foster FS. A high‐frequency pulsed‐wave doppler ultrasound system for the detection and imaging of blood flow in the microcirculation. Ultrasound Med Biol. 1997;23(7):997‐1015. doi: 10.1016/S0301-5629(97)00076-8 [DOI] [PubMed] [Google Scholar]
- 45. Yang VXD, Needles A, Vray D, et al. High frequency ultrasound speckle flow imaging ‐ comparison with doppler optical coherence tomography (DOCT). Vol 1. IEEE; 2004:453‐456. [Google Scholar]
- 46. Orlandi D, Gitto S, Perugin Bernardi S, et al. Advanced power doppler technique increases synovial vascularity detection in patients with rheumatoid arthritis. Ultrasound Med Biol. 2017;43(9):1880‐1887. doi: 10.1016/j.ultrasmedbio.2017.05.004 [DOI] [PubMed] [Google Scholar]
- 47. Zhou Y, Wang C. Superb microvascular imaging for detecting neovascularization of carotid plaque compared with contrast‐enhanced ultrasound: a protocol for systematic review and meta analysis. Medicine. 2020;99(35):e21907. doi: 10.1097/md.0000000000021907 [DOI] [PMC free article] [PubMed] [Google Scholar]
- 48. Dubinsky TJ, Revels J, Wang S, et al. Comparison of superb microvascular imaging with color flow and power doppler imaging of small hepatocellular carcinomas. J Ultrasound Med. 2018;37(12):2915‐2924. doi: 10.1002/jum.14654 [DOI] [PubMed] [Google Scholar]
- 49. Lim AKP, Satchithananda K, Dick EA, Abraham S, Cosgrove DO. Microflow imaging: new doppler technology to detect low‐grade inflammation in patients with arthritis. Eur Radiol. 2018;28(3):1046‐1053. doi: 10.1007/s00330-017-5016-4 [DOI] [PMC free article] [PubMed] [Google Scholar]
- 50. Yokota K, Tsuzuki Wada T, Akiyama Y, Mimura T. Detection of power doppler ultrasound signals in rheumatic diseases using superb microvascular imaging (SMI): comparison with conventional power doppler ultrasound. American College of Rheumatology Professionals; 2015. [DOI] [PubMed] [Google Scholar]
- 51. Szabo TL. Chapter 11 ‐ Doppler Modes. In: Szabo TL, ed. Diagnostic Ultrasound Imaging: inside out. 2nd ed. Academic Press; 2014:431‐500. [Google Scholar]
- 52. Shih JC, Palacios Palacios Jaraquemada JM, Su YN, et al. Role of three‐dimensional power Doppler in the antenatal diagnosis of placenta accreta: comparison with gray‐scale and color Doppler techniques. Ultrasound Obstet Gynecol. 2009;33(2):193‐203. doi: 10.1002/uog.6284 [DOI] [PubMed] [Google Scholar]
- 53. Cafarelli A, Verbeni A, Poliziani A, Dario P, Menciassi A, Ricotti L. Tuning acoustic and mechanical properties of materials for ultrasound phantoms and smart substrates for cell cultures. Acta Biomater. 2017;49:368‐378. doi: 10.1016/j.actbio.2016.11.049 [DOI] [PubMed] [Google Scholar]
- 54. Baek J, Kang B, Rhyou C, Lee H. Effect of the sound speed mismatch between fluid and channel on the particle alignment in a standing surface acoustic wave device. Sens Actuators B. 2021;346:130442. doi: 10.1016/j.snb.2021.130442 [DOI] [Google Scholar]
Associated Data
This section collects any data citations, data availability statements, or supplementary materials included in this article.
Data Availability Statement
The datasets generated and analysed during the current study are available from the corresponding authors on reasonable request.