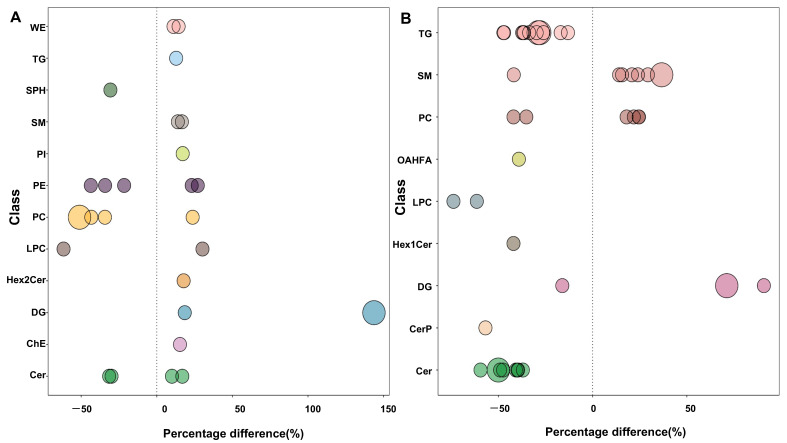
Figure 8.
Bubble plots of classification of significantly altered lipid molecules in the DR vs. control groups (A), and PDR vs. NPDR subgroups (B). The bubble size indicates the significance of the differences (small size: 0.01 < p < 0.05; large size: p < 0.01). WE, wax exters; TG, triglyceride; SPH, sphingosine; SM, sphingomyelin; PI, phosphatidylinositol; PE, phosphatidylethanolamine; PC, phosphatidylcholine; LPC, lysophosphatidylcholine; Hex2Cer, hexosyl ceramide; DG, diglyceride; ChE, cholesterol ester; Cer, ceramides; OAHFA, (O-acyl)-1-hydroxy fatty acid; CerP, ceramides phosphate.

