

Abstract
Social Security scams have become one of the most common forms of government imposter fraud. These scams cost innocent people in the USA millions of dollars each year and undercut the ability of the Social Security Administration to contact and interact with citizens about their benefits. This raises questions as to how individuals might improve their ability to discriminate between scams and real appeals from the Social Security Administration. The present study applies the techniques of inoculation theory to a nationally representative sample of over 4,000 US adults in a series of experiments. Participants are randomly assigned to one of four training programs: from general tips about scams to a targeted experiential learning program. There is strong evidence that the inoculation process successfully and significantly increases fraud detection without decreasing trust in real communications. It provides protection against both SSA and non-SSA scams, such as Amazon imposter scams. The impact, however, is specific to the mode of communication (email versus letter or SMS) and decays over time; training programs should be targeted accordingly.
Keywords: Scam identification, Behavioral science, Digital fraud, Inoculation theory, Randomized control trial
Introduction
In 2020, the Social Security Administration (SSA) received complaints from more than 700,000 people reporting that they were targeted by an SSA imposter scam (Skiba, 2021). Such imposter scams are known to have cost innocent people in the USA millions of dollars each year (Fletcher, 2019). This fraud occurs despite widespread information: Warnings are frequently provided on local and national news (e.g., KLEW, 2020) and by organizations from the American Association of Retired Persons to the Consumer Protection Bureau (AARP, 2019; Scheithe, 2020). Guidance on recognizing and countering these scams is also available for individuals through the Social Security Information website and elsewhere.1 Yet, the scams, and the losses, continue.
In an imposter scam, the scammer impersonates another person or organization to gain trust, with the ultimate goal of extracting personal information or money. These imposter scams can occur in person, over the phone, or via digital means such as email or text. Digital imposter scams often start with phishing attacks: in which a technical trick is used to aid the deception—such as a spoofed email address, image, or entire website—“luring” people into trusting the scammer. Conceptually, one can think of “imposter scam” as referring to the psychological means of gaining the victim’s trust (posing as a trusted individual or company), and “phishing” as referring to the technical means of accomplishing it (employing a fake email address that looks like it came from the trusted company).2 Recent years have seen significant growth in the area of digital imposter scams, in which the scammer uses digital means to impersonate a trusted organization or person. This process starts with a fraudulent email (phishing) or SMS (sometimes also referred to as smishing). The victim then either directly provides targeted information such as a social security number or interacts further with the scammers via email, web, or phone before being asked to provide personal information or money. A phishing attack in which the scammer impersonates a trusted third party could also be used to install malware on the victim’s computer such as ransomware, which locks the person’s computer until a ransom is paid. Figure 1 shows how the process works.
Fig. 1.

The anatomy of a digital imposter scam, showing how phishing/smishing/etc. is used to gain trust and extract money or information from targets
In practice, Social Security Administration imposter scams appear to focus on the direct extraction of information or money, rather than on installing ransomware (Waggoner, 2020). Figure 2 provides an example of an actual email scammers have used to initiate the process. Research into scams falls into three major categories: research documenting its prevalence and permutations, research on who is susceptible to fraud, and research on how to counter it. The following sections address each in turn.
Fig. 2.
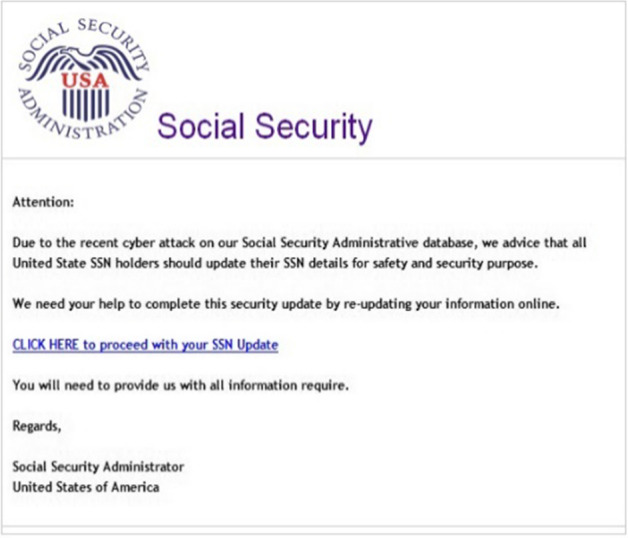
Example of an email used by SSA imposter scammers
Background
Prevalence of Imposter Scams, and Digital Imposter Scams
The most detailed and extensive dataset on fraud in the USA comes from the Federal Trade Commission’s Sentinel Network. The Sentinel Network gathers reports of fraud data directly from the public and from third party sources such as the Better Business Bureau and state law enforcement agencies (FTC, 2021). They provide both public access to summary statistics and private access to selected researchers. In their 2020 data, identity theft is identified as the most common type of report. Imposter scams (digital or otherwise), however, are the most common form of fraud and second only to identity theft in total reports. Furthermore, imposter scams account for nearly 36% of all dollars reported lost to fraud in 2020 (FTC, 2021). Digital contact by scammers (whether for an impostor scam or otherwise) is more common than phone calls and results in greater aggregate losses: from fraudulent websites, to emails, to social media and text messages (FTC, 2021). Similarly, data from the FBI show that phishing attacks (often overlapping with imposter scams, as described above) were the most common type of cybercrime in 2020 (FBI, 2021).
When one examines Social Security scams in particular, robo-calls impersonating the SSA have been prevalent since 2018. In these calls, a recorded voice claims to be from the SSA and threatens the callee with a range of penalties if they do not respond (Leach, 2018).3 These calls do not appear to be very effective though, as only a tiny fraction of people who report them actually fall for them (Better Business Bureau, 2022). Scammers in this space have branched out into email as well (Waggoner, 2020) . These calls and emails are only the latest form of a much older phenomenon. Impostor fraud comes in waves—the “popularity” of different types of impostors changes over time; currently, SSA and business impostor scams are common; previously, it was IRS scams (Fletcher, 2019).
The FTC’s data on the prevalence of these scams suffer from two primary limitations, however. The first is that the ability to gather data from other sources is incomplete. The AARP, for example, using data from the Social Security Administration’s Office of the Inspector General, states that there were 718,342 reports of Social Security imposter scams in 2020 (Skiba, 2021). For the same period, the FTC shows only 498,278 reports across all types of imposter scams (FTC 2021). The second limitation is more fundamental and affects both the FTC and all other fraud-report collectors: underreporting. These numbers are likely to be a vast understatement (FINRA 2013). Prior research on online fraud has shown that only a fraction of targets and victims report it to authorities, and one can reasonably assume the same for SSA scams. Surveying individuals provides a more direct means of estimating these attempts than relying on self-reports. In a survey of adults in the USA, for example, the personal finance app and website SimpleWise estimated that 46% of all US adults had experienced a Social Security scam attempt just in the final three months of 2020 (SimpleWise 2021).
Susceptibility to Imposter Scams
Research specifically on the psychology and dynamics of Social Security scams is limited, but there is a larger literature on online fraud (e.g., Chen et al., 2017), general financial fraud (e.g., Burnes et al., 2017), and broader mass market consumer fraud (Anderson, 2016, 2019) that one can draw from. This broader fraud literature can help us understand fraud and who is susceptible to it.
Old age is commonly believed to be a factor (Whitty, 2019), but research in this space is mixed as significant contrary evidence exists—showing that younger people are more likely victims than the elderly (Anderson, 2016, 2019; Muscat et al., 2002; Titus et al., 1995). There may be personality characteristics that predispose an individual to falling prey to fraud—such as comfort with financial risk (Anderson, 2016; Van Wyk & Benson, 1997) and high impulsivity or temporal myopia (Holtfreter et al., 2008; Whitty, 2019). Anderson (2016) conducted a detailed analysis of fraud susceptibility in the realm of print advertising, noting that many characteristics were correlated with greater susceptibility to fraud, including lower consumer literacy, overconfidence, lower numeracy, and willingness to take risks. Commercial “phishing IQ tests” exist as well, but they do not appear to meaningfully identify susceptibility (Anandpara et al., 2007).
As with prevalence research, there is a major challenge with work on susceptibility: There is significant and unknown information missing in the data. Many individuals simply do not know they were defrauded, and others know they were, but do not report it. Victim-blaming makes it even more difficult to accurately assess the problem. To accurately assess susceptibility, one should effectively divide the number of “successful” frauds perpetrated on a particular group by the number of attempts at fraud against them. In the existing data, however, three factors comingle: (1) frequency by which groups are targeted, (2) responsiveness of each group, and (3) reporting rate of each group. For example, older people in the USA are more likely to report attempted fraud (which may or may not mean they are more often targeted) and are less likely to report losing money than younger people (FTC, 2021)—which may lead to some of the contradictory results researchers have found on the role of age and fraud susceptibility.
The ideal approach is to study susceptibility is not observational (using existing reports), but experimental. For example, to study fraud susceptibility, ideally one would mimic it and study who responds. The approach taken in this research measures who is susceptible within a national sample of US residents. The measurement is based on actual behavior in a fraud experiment instead of relying on self-reports.
Theoretical Background: an Inoculation Approach
The present study applies inoculation theory (McGuire, 1961, 1964; for more recent summaries, see Compton, 2013; Banas & Rains, 2010) to the more recent challenges posed by digital imposter scams. Inoculation theory posits that exposing people to a weakened version of a dangerous appeal can help them learn to identify and resist such appeals over time. Inoculation theory offers two variations on a traditional training program. First, it guides the content of the training: focusing on the actual content and experience of the scam, instead of more abstract information about it. Second, it guides the experience of the training: by suggesting an experience that is as close as possible to a real scam (without the actual loss of money). This also distinguishes it from a traditional, information and skills-focused training program.
The concept has a long history of application to types of persuasion and, more generally, to threats in the future. As explained by Compton et al. in their 2016 review: “By exposing individuals to a persuasive message that contains weakened arguments… individuals would develop resistance against stronger, future persuasive attacks.” The approach, also known as pre-bunking, has successfully been used to combat fake news (Roozenbeek & van der Linden, 2019) and against recruitment by extremists (Saleh et al., 2021; Wendel, 2020). These two specific papers provide inspiration for the present work wherein we ask a simple question: By giving people practical experience in resisting a weakened version of impostor scams, can one help prepare them to resist the full version later?
Policy Considerations
Whereas it is obviously a bad thing to have consumers lose money due to market fraud, the presence and prevalence of imposter scams have broader adverse impacts on the marketplace, including potential erosion of trust in critical communications from legitimate sources. Looking at institutions like the Social Security Administration (among other arms of the federal government), a critical aspect of their being able to carry out their role is reliant on consumer trust. An unfortunate reality is that public trust in the federal government has been in decline since the 1960s (American National Election Studies 2016), and this has strong implications on a number of levels. Reduced trust can have implications in the realm of support for government spending (Chanley et al., 2000), as well as willingness to engage in online communications with these entities (Bélanger & Carter, 2008). Ultimately, it is a concern that these scams might undermine the authority of the federal government and its ability to carry out its’ core responsibilities like administering policy and enforcing laws (Goel, 2021). These scams additionally create inefficiencies, as the existence of these scams necessarily redirects resources toward public education and trainings geared toward reducing their adverse impacts that could otherwise be going toward essential services. The present study provides insight into the possible benefits of an interactive training model as compared to existing consumer information and support materials.
Data and Methodology
This study tests the effectiveness of inoculating people against social security scams. It is structured as a series of randomized control trials in which participants are trained and subsequently tested for their ability to correctly identify real and fraudulent communications. The core research design is as follows (and is illustrated in Fig. 3):
Participants are directed to a website in which they complete a series of questions that cover demographic information, a measure of generalized trust, and prior experience with scams.
- Each participant is randomly assigned to either:
- Interact with potential scammers via simulated email exchanges and learn how they operate (i.e., “pre-bunking”)
- Receive written instructions on what to look for, covering the same topics and techniques as the previous arm without the interactive experience
- Receive existing materials used by the SSA to inform and warn people against scams
- Receive an innocuous control condition (reading material about Internet addiction)
After a delay period, participants were tested on their ability to correctly distinguish fake appeals from real communications from the SSA and third parties such as the Red Cross and Amazon.com. Twelve communications in total were tested: eight emails, two letters, and two text messages.
Fig. 3.

Experimental design
The interactive training or inoculation arm consists of six mocked up communications. In each case, participants are shown the communication first and asked to judge whether it is real or fake. Then, they are told the true status of the communication and provided with a set of tips overlayed and contextualized within the communication, showing them what to look for. Figure 4 shows that experience with the tips they would see after they have made their selection.
Fig. 4.

An illustration of the interactive training, showing users what to look for in a communication
Three of the messages are fake: designed to deceive the individual with spoofed email addresses and URLs, appeals for money, and so forth. Three of the messages are real: drawn directly from the SSA’s actual communications. The first five communications are emails and the last one is a (real) letter from the SSA. Individuals can interact with the emails as they would in a real environment. They can hover over links and images to see where they lead. They can open or close the email headers to learn more about the routing of the message. They can also click on links in the email; however, the traffic is intercepted, and a notice is provided informing them of the same. The details of each communication can be found in Appendix 1.
The non-interactive arms of the study have a much simpler design. In each those arms, participants are presented with static information. The control arm presents reading material of similar length about Internet addiction. The next arm shows the written tips provided at the start of the interactive experience, without any interaction. The third arm replicates existing materials that the Social Security Administration emails to individuals to warn them about scams. The initial demographic survey and training materials were programmed in Qualtrics, augmented with JavaScript, HTML, and CSS formatting to better resemble a real, interactive email environment.
The fraud detection test was implemented in two ways: (1) a Qualtrics platform, which is visually identical to the interactive training module, but does not provide users with the “correct answer” to each message, and (2) a real email platform (Rainloop) and a phishing security tool (GoPhish), which looks visually dissimilar to the training module, but has the same functionality. The two platforms serve an important research purpose: they help us understand whether the visual design of the training matters and whether the lessons generalize to other mail applications.4 Since Rainloop is likely unfamiliar to many researchers, it warrants a brief exploration into how it works and the participant experience. Rainloop is an open-source email client and a competitor to Gmail’s web interface. It looks and behaves much like Gmail or any other modern web-based email program. In our study, participants using Rainloop were first provided with instructions on how to operate it and asked to flag any message they believed were fraudulent as “spam.” Real messages were to be left as is. Most importantly, all actions were anonymously logged to a database for analysis by researchers.
Behind the scenes, Rainloop is powered by a fully functional phishing security environment called GoPhish. Specifically, the researchers established an email server (in Amazon’s cloud) and automatically generated an email account for each person participating in the study. While the participant was completing the study’s training module, Qualtrics sent an API call to our software, triggering GoPhish to automatically generate the eight emails for the participant and send them to the email account created for them. More information on the technical architecture can be found in Appendix 2.
The content of the test was the same for both the Rainloop-based and Qualtrics-based testing platforms. In each case, participants first interacted with eight email messages: three of them real, and five fake. Four of the messages were purportedly from the Social Security Administration, one from a disability benefits attorney, two from Amazon, and one from the Red Cross. The non-Social Security messages were included as an additional test of the generalizability of the training. A key question in the field is whether fraud detection training provides specific assistance against that fraud campaign or can benefit individuals more broadly against other types of fraud.
After the email interactions, for both the Qualtrics and Rainloop-based testing platforms, participants were directed to an additional Qualtrics-based interactive module with four additional communications: two letters (one fake, one real) and two text messages (one fake, one real). These non-email messages also allow us to assess how well the training generalized to other types of potentially fraudulent communication.
Core Research Question and Extensions
The study, as originally proposed, had a single hypothesis: participants who are exposed to a weakened version of an actual email scam will be more likely in a subsequent test to correctly distinguish scam from non-scam emails relative to a control group. This hypothesis was to be tested in a randomized control trial with three experimental arms, in which the sample size for the study was 2000 participants, with an outcome variable as the percent of correct answers, and a minimum detectible effect of 9% (power = 0.9; alpha = 0.05; two-sample test of proportions; assumed baseline for control of 50% correct).
However, in the initial trials of the intervention, it became rapidly clear that the effect was far more than that minimum detectible effect. It also became clear that the platform developed to test that hypothesis could be used more broadly, at no additional cost. Thus, in the early months of the study, additional research questions were added. It is vital for the credibility of the research community that researchers separate prior hypotheses from ex post and contemporaneous areas of interest. In the result below, the measurement of the inoculation’s effectiveness on the number of correctly identified messages is a correctly specified experimental analysis. All other analyses should be considered exploratory in nature. In total, this study addresses the following research questions:
-
11:
Does an inoculation using weakened scams increase the likelihood that individuals will correctly identify subsequent scams?
-
21:
Does the impact of the training, if any, generalize across communication mediums (email to SMS or email to letter)?
-
31:
Does the impact of the training, if any, generalize across who is being impersonated?
-
41:
How quickly does the effectiveness, if any, of the training dissipate over time?
-
51:
Does the impact of the training, if any, generalize across user interfaces—or is it specific to the look and feel of the training scenario?
-
61:
What personal characteristics predict fraud susceptibility?
Data Collection
Participants were sourced from a commercial provider of online survey participants, Prolific. Prolific is a high-quality alternative to the commonly used Mechanical Turk service and allows for the creation of nationally representative samples. Panel participants were paid to participate and compensated based on the study’s duration; the median compensation was $9/h. More information about the Prolific service and how it generates a nationally representative sample of US residents can be found in Appendix 3. Multiple experiments were conducted across separate random samples, for a total sample size of 4164 participants5; the size and characteristics of each random sample are noted in the “Data Analyses and Results” section below. For completeness, detailed information about all samples drawn from the population is discussed in Appendix 3.
For each sample, participant interactions with the training and testing were tracked and stored in an anonymous database: a Qualtrics backend for the relevant portions and a DynamoDB backend for the Rainloop interactions. Python code is provided on the project’s GitHub site that processes the various data sources, combines them into a single data file, and runs the analyses.
Data Analyses and Results
The study provided rich opportunities for understanding not only the experiment’s stated goal—helping individuals detect fraud—but also how various factors such as the delay period, medium of communication, and testing platform affected participant outcomes.
Research Question 1: Does an Inoculation Using Weakened Scams Increase the Likelihood that Individuals Will Correctly Identify Subsequent Scams?
The analysis starts with a nationally representative sample of 1065 residents of the USA, in which the training and test were both conducted in Qualtrics. All delay periods are included, and their answers on all twelve communications are considered. Seven hundred twelve out of the 1,065 participants completed both rounds of the study and passed the attention checks. In this phase of the experiment, the interactive training shows a statistically significant increase over the control in the number of correct answers offered by participants (p < 0.001). None of the other arms show statistically significant results relative to the control. The average treatment effect of the interactive training is 0.82 additional questions (out of 12) answered correctly on the study, resulting in 8.1 correct answers in the control and 8.9 correct answers with the training, as shown in Table 1.
Table 1.
Results for research question 1. N = 712, Qualtrics-based test and training. Values shown in the format: average (standard deviation)
| Outcome | Control | Written tips | Existing communication | Interactive training |
|---|---|---|---|---|
| Number correctly labeled | 8.11 (1.82) | 8.10 (1.63) | 7.92 (1.68) | 8.93 (1.68)*** |
| Number of fake messages labeled real | 2.24 (1.49) | 2.14 (1.39) | 2.41 (1.49) | 1.81 (1.32)** |
| Number of real messages labeled fake | 1.65 (1.18) | 1.76 (1.09) | 1.68 (1.18) | 1.26 (1.02)** |
***p < 0.001; **p < 0.01; *p < 0.05. Two-sided t-test on the number of communications correctly identified, relative to the control condition. The initial experimental design (number of correctly labeled communications) shared a common control and did not require a family-wise type 1 error correction; however, out of an abundance of caution and since the additional exploratory research questions have been added, the authors also applied a Holm (Bonferroni) adjustment to the p values and found that the results are still significant (alpha of 5%).
It is not only important that individuals can correctly identify fraud, it is also essential that individuals can identify and trust real communications. Here again, the results are encouraging. The average treatment effect of 0.82 correct answers comes from both learning to better identify fakes and to better identify real messages. Specifically, the interactive training increases the correctly identified fakes by 0.43 relative to the control (p < 0.01); no other arms are statistically significant. In addition, the interactive training increases the correctly identified real messages by 0.39 relative to the control (p < 0.01); no other arms are statistically significant. The resulting values are also provided in Table 1.
In two further checks for robustness, the results hold as well. First, the interactive training shows a statistically significant improvement relative to the two other, non-control arms. Second, the interactive training is significant when the same analysis is conducted as a multivariate OLS regression with additional control variables (employment status, generalized trust, prior experience with fraud, level of education, marital status, age, gender, time delay between first and second rounds) as a check against incomplete randomization.
Whereas the statistical significance of the results is straightforward to interpret, the practical significance is more difficult. The magnitude of the training’s effect is largely determined by the mix of real and fake messages and how difficult they are to identify correctly. The message mix used in the study is not representative of a real-world scenario; instead, the mix was intentionally chosen to create a diversity of messages and levels of difficulty. One can see this by looking at the accuracy rate for each message, given in Table 2.
Table 2.
Impact of interactive training, by message. N = 712, Qualtrics-based test and training
| Message | % correct: control | % correct: interactive training | Difference (percentage points) | % change | Significance |
|---|---|---|---|---|---|
| Your Urgent Support Is Needed | 42% | 63% | 21% | 50.0% | p: 0.000; *** |
| Need a replacement Social Security Card? | 64% | 85% | 21% | 32.8% | p: 0.000; *** |
| Important Information About Your Online Account | 79% | 91% | 12% | 15.2% | p: 0.003; ** |
| The Social Security Administration is contacting a few people | 47% | 59% | 12% | 25.5% | p: 0.028; * |
| Payment declined: Update your information so we can ship your order | 61% | 70% | 9% | 14.8% | p: 0.058 |
| Opt Out of Receiving Mailed Notices | 43% | 49% | 6% | 14.0% | p: 0.307 |
| Annual Reminder to Review Your Social Security Statement | 68% | 74% | 6% | 8.8% | p: 0.192 |
| Disability Alert | 94% | 97% | 3% | 3.2% | p: 0.235 |
| Delivery Update | 93% | 94% | 1% | 1.1% | p: 0.678 |
| Notice of Intent to Levy Social Security Benefits | 82% | 81% | − 1% | − 1.2% | p: 0.741 |
| The Application Process Is Open For Disability Benefits | 86% | 85% | − 1% | − 1.2% | p: 0.884 |
| Convalescent Plasma is needed | 52% | 46% | − 6% | − 11.5% | p: 0.292 |
| Average | 68% | 75% | 7% | 10.2% |
***p < 0.001; **p < 0.01; *p < 0.05. Two-sided test of proportions (z test) on the number of communications correctly identified, relative to the control condition.
There is a wide variation in both the baseline rates of correct answers in the control condition (from 42 to 92%). This represents the level of difficulty of the message. There is also a wide variation in the impact of the training, from 21 percentage points (statistically significant) to a − 6 percentage point decrease (not statistically significant, and likely noise). An analysis of the average impact alone does not capture that variation adequately. Again, this variation is intentional and useful for the study since it allows us to better understand the types of messages for which the training is effective; we analyze those questions in subsequent sections of the report. In terms of practical significance, we can say that the training, when it has a statistically significant impact, boosts correct responses from 12 to 21 percentage points (a 15 to 50% difference). Across this particular mix of messages, there is a statistically significant impact of 7 percentage points or a 10% increase in correct answers.
Research Question 2: Does the Impact of the Training, if Any, Generalize Across Communication Mediums (Email to SMS, or Email to Letter)?
The interactive training focused on email communications, with five emails. It also included one SSA letter to broaden the participants’ awareness. The testing process included eight emails (primary training), two letters (partial training), and two SMSes (no training). Table 3 shows the experimental results by medium of communication. The primary effect of the interactive training is on the emails: with a boost of 0.74 messages correctly identified (p < 0.001). For letters, there is suggestive evidence (p = 0.1) that perhaps would be statistically meaningful if more letters had been included in the training and test processes. For SMSes, there was no effect.
Table 3.
Results for research question 2. N = 712, Qualtrics-based test and training. Values shown in the format: average (standard deviation)
| Outcome | Control | Written tips | Existing communication | Interactive training |
|---|---|---|---|---|
| Number emails correctly labeled | 5.36 (1.51) | 5.46 (1.49) | 5.20 (1.47) | 6.10 (1.40)*** |
| Number SMSes correct | 1.46 (0.53) | 1.40 (0.52) | 1.41 (0.55) | 1.43 (0.52) |
| Number letters correct | 1.29 (0.59) | 1.24 (0.58) | 1.31 (0.55) | 1.40 (0.61) |
***p < 0.001; **p < 0.01; *p < 0.05. Two-sided t-test, relative to the control condition. With Holm (Bonferroni) adjustment, the results are still significant (alpha of 5%).
Thus, it appears that the training works for the communication medium people are trained on, but not others. That should not be surprising, given some of the most important techniques participants learned to identify scams are specific to the email: hovering over URLs and looking at email’s headers, for example. These techniques are irrelevant for letters and not supported by most SMS applications. In case of incomplete randomization, the research team also ran the analysis as a regression with additional controls for gender, age (quadratic), log income, years of education, employment status, prior loss of money to fraud, and generalized trust score. The average treatment effect of the experiment is slightly larger than presented above (0.75 additional messages correct), and similarly, it is statistically significant.
Research Question 3: Does the Impact of the Training, if Any, Generalize Across Who Is Being Impersonated?
The training process included only messages from (or appearing to come from) the Social Security Administration. The test included messages both from the Social Security Administration and from other parties, including the Red Cross and Amazon. Amazon impostor scams have increased in frequency dramatically in 2021, with 100 to 150 million calls per month observed in February, March, and April of 2021 (YouMail, 2021). We can see in Table 4 that the impact of the training does generalize to non-SSA-related messages.
Table 4.
Results for research question 3. N = 712, Qualtrics-based test and training. Values shown in the format: average (standard deviation)
| Outcome | Control | Written tips | Existing communication | Interactive training |
|---|---|---|---|---|
| Number correctly labeled: SSA | 3.99 (1.09) | 4.04 (1.04) | 3.82 (1.14) | 4.44 (1.09)*** |
| Number correctly labeled: non-SSA | 4.12 (1.25) | 4.06 (1.17) | 4.10 (1.07) | 4.49 (1.02)** |
| Number emails correctly labeled: SSA | 1.76 (0.83) | 1.83 (0.91) | 1.60 (0.93) | 2.08 (0.82)*** |
| Number emails correctly labeled: non-SSA | 3.61 (1.12) | 3.64 (1.05) | 3.60 (1.01) | 4.03 (0.95)*** |
***p < 0.001; **p < 0.01; *p < 0.05. Two-sided t-test, relative to the control condition. With Holm (Bonferroni) adjustment, the results are still significant (alpha of 5%).
Research Question 4: Does the Impact of the Training, if Any, Generalize Across User Interfaces?
The results discussed thus far used Qualtrics for both the training and testing process. The next study uses Qualtrics for the training, but the Rainloop platform (discussed above) for the test. This study entails a 1,500-person nationally representative survey, with participants randomly assigned into two groups6: a two-week delay period and a four-week delay period. Here, the results are drawn from the first wave, a two-week delay with 533 people who completed both the test and training parts of the study and passed the attention checks.
This study differs from the prior work in two important ways. First, in using Rainloop, we can analyze the generalizability of the training to a very different visual design and user interface: one intentionally designed to mimic a standard email reader. Second, in Rainloop’s preview pane, the senders are identified by their names only and not by their email domain. This is the standard practice in email readers such as Gmail but was not the case in either the training or Qualtrics-based test. In testing Rainloop, the authors discovered that it was trivially easy for participants to spot the fakes when the email domain was displayed in the preview pane.,7,8 Thus, the team switched to a more realistic, name-only display of the sender.
The results in Rainloop are quite similar as for the previous Qualtrics study and are provided in Table 5. The practically and statistically significant impact of interactive training remains with a different user interface. This suggests that the lessons are not specific to the training environment and provide broader protection. As before, we find that the impact occurs especially with emails: participants learn how to identify fraudulent and real emails correctly, but not SMSes or letters. The Rainloop platform also allows us to track individual actions in detail. For example, in the interactive training, participants opened and reviewed twice as many email headers as in the control group (2.36 versus 1.12; p < 0.001). One of the key lessons taught during the interactive training is to review the email headers.
Table 5.
Results for research question 4. Qualtrics-based test and Rainloop-based training. Values shown in the format: average (standard deviation)
| Outcome | Control | Written tips | Existing communication | Interactive training |
|---|---|---|---|---|
| Number of communications correctly labeled | 7.38 (1.90) | 7.48 (1.90) | 7.49 (1.85) | 8.09 (2.01)** |
| Number of fake communications labeled real | 3.06 (1.73) | 2.85 (1.71) | 2.86 (1.69) | 2.50 (1.81)** |
| Number of real communications labeled fake | 1.45 (1.14) | 1.41 (1.03) | 1.44 (1.05) | 1.27 (1.02) |
| Number emails correctly labeled | 4.68 (1.48) | 4.91 (1.65) | 4.88 (1.43) | 5.41 (1.79)*** |
| Number SMSes labeled | 1.50 (0.59) | 1.42 (0.64) | 1.34 (0.68)* | 1.40 (0.57) |
| Number letters labeled | 1.20 (0.69) | 1.16 (0.68) | 1.28 (0.75) | 1.27 (0.63) |
***p < 0.001; **p < 0.01; *p < 0.05. Two-sided t-test, relative to the control condition.
Research Question 5: How Quickly Does the Effectiveness, if Any, of the Training Dissipate Over Time?
Within the Qualtrics-based study, the authors included two different delay periods between the test and control. Participants were recruited for the training process and then were randomly invited to participate in the testing process either three days from the start of the training recruitment or 10 days after. However, the nature of online recruitment makes this process imprecise—since once a study is posted for participants, participants can read that notice and decide to complete the study whenever they like. The actual, realized delay period between the training and the test ranged between 1.3 and 12.8 days.9
This participant choice complicates our analysis on the test delay because it introduces a confounder into an otherwise clean experiment: there is likely an unseen omitted variable (personal characteristics) that both cause the person to select a certain delay period and respond differentially to the training. Only at the aggregate level (across all delay periods) does the randomization process holds and one can trust the results given above. Given those caveats, one can estimate the effect of the training test delay by grouping people into two waves: those who were (randomly selected to be) invited to participate in the test three days after the start of the training and those who were invited to participate 10 days after.
In this initial analysis, the effect of interactive training diminishes with time. In the first group, with a median actual delay period of 3.5 days between the training and the test, the training increased the number of correct answers by 1.1 (p < 0.001). In the second group, with a median realized delay period of 11.5 days, the training increased the number of correct answers by 0.56 (p = 0.02). Both are practically and statistically significant, and no other arms showed a statistically significant effect, but the effect wanes by the second period.
Another way of analyzing the effect of time is to look at the interaction effect between the experimental arm and the wave, along with additional control for the time delay between the treatment and test. The OLS regression uses the following form:
The results show that none of the coefficients are statistically significant, except for the previously discussed effect of the training itself (here: β3 = 0.99; p < 0.001). There are hints of a negative effect on the wave (the more time elapsed between the invitations, correct answers decrease) and a positive effect on days between training and test (the longer people took to respond to the invitation, the more correct answers). Both are not statistically significant, however.
In a second test of the effect of time delays, we extended the Rainloop test mentioned above to include an additional 692 (randomly selected) participants who were invited to take the test module 4 weeks after their training. Only 434 completed the training module and passed the attention check, which serves as a warning sign that the results may be skewed toward participants who are frequent users of Prolific and still active on the site 4 weeks later. That said, the results are in line with the earlier time delay test and show an additional decrease in the effect. Specifically, the results for the interactive training show an average improvement over all other arms, but the results are no longer statistically significant. Further work is certainly needed, but the results thus far indicate what one would expect: the impact of the training appears to decay over time.
Research Question 6: What Personal Characteristics Predict Fraud Susceptibility?
Within a respondent’s incorrect answers, we can separate two effects: the effects of fraud susceptibility (labeling a fake message as real) and undue distrust (labeling real messages as fake). As noted previously, a challenge in the existing literature on fraud susceptibility is that it is observational: it relies on the self-selected responses of individuals who were (selectively) targeted by fraudsters, (selectively) tricked by the fraud attempt, (selectively) who knew they were targeted by fraud, and (selectively) reported the fraud attempt. Only the second stage—being tricked by the fraud—is truly fraud susceptibility; the others are practically important but distinct elements of the fraud ecosystem.
This study allows us to look at the problem from a very different angle; a nationally representative sample shows who is tricked by the fraud attempt and removes the other confounding factors. To do so, we run a series of analyses on the number of fraudulent messages that participants labeled as real. To be clear, this is an exploratory analysis and not a theoretically driven, pre-registered test of hypotheses. The existing literature indicated that age and generalized trust might be factors, but we (the authors of this report) did not have a sufficient basis to pre-register a set of hypotheses. Thus, this analysis can point us to additional research but should not be taken as definitive. Now that the caveats have been properly covered, Table 6 provides the results.
Table 6.
Exploratory regression of personal characteristics on fraud susceptibility. N = 712, Qualtrics-based test and training. Values shown in the format: average (standard deviation)
| Variable | Coefficient | Standard error | P >|t| |
|---|---|---|---|
| Intercept | 5.31 | 0.75 | 0.000 |
| Received tips | − 0.05 | 0.15 | 0.764 |
| Received existing communication | 0.15 | 0.16 | 0.327 |
| Received interactive training | − 0.41 | 0.15 | 0.008 |
| Employment status = retired | 0.08 | 0.18 | 0.655 |
| Employment status = unemployed | 0.10 | 0.13 | 0.455 |
| Lost money to fraud | − 0.16 | 0.35 | 0.655 |
| Days from training to test | − 0.01 | 0.02 | 0.683 |
| Generalized trust score | − 0.06 | 0.04 | 0.146 |
| Log(income) | 0.08 | 0.08 | 0.267 |
| Years of education | − 0.06 | 0.03 | 0.024 |
| Married (married = 1; not = 0) | 0.10 | 0.13 | 0.441 |
| Age | − 0.10 | 0.03 | 0.000 |
| Age^2 | 0.00 | 0.00 | 0.001 |
| Gender (female = 1; male = 0) | 0.01 | 0.11 | 0.899 |
| Time used to complete the test (quantile) | − 0.05 | 0.04 | 0.273 |
Here, we find that fraud susceptibility decreases with age, but with a curve: the peak of the curve (the least likely age to fall prey to fraud) is 53 years old, with a decrease of − 2.7 fraudulent messages thought to be real, all else being equal. Before and after that age, the effect shrinks. People at 20 and age 89 are equally likely, all else constant, to fall prey to fraud. In addition, the effect of the interactive training remains, as expected. The only other new statistically significant finding we see is that susceptibility to fraud decreases with the person’s years of education. Someone who has completed a 4-year college is expected to fall prey to 1.01 fewer fraudulent messages, all else being equal.
Next, we can consider the phenomenon of undue distrust, or the tendency to label real messages as fraudulent. For this, we run the same regression but change the dependent variable to the number of real messages thought to be fraudulent. The results can be found in Table 7. Here, we find that the 3-question generalized trust score is important: the higher one scores on generalized trust, the less likely they are to show undue, inaccurate distrust, all else being equal. Similarly, we find that women, all else being equal, are less likely to show undue distrust; men are more distrusting on this exercise. The higher the person’s income, all else being equal, the less undue distrust. Finally, people who are married show greater distrust. These results are fascinating and provide fodder for future analyses; remember, however, that this is an exploratory analysis, so we should be careful before drawing broad conclusions about society.
Table 7.
Exploratory regression of personal characteristics on undue distrust. N = 712, Qualtrics-based test and training. Values shown in the format: average (standard deviation)
| Variable | Coefficient | Standard error | P >|t| |
|---|---|---|---|
| Intercept | 2.21 | 0.58 | 0.000 |
| Received tips | 0.09 | 0.12 | 0.446 |
| Received existing communication | 0.02 | 0.12 | 0.859 |
| Received interactive training | − 0.38 | 0.12 | 0.002 |
| Employment status = retired | − 0.06 | 0.14 | 0.692 |
| Employment status = unemployed | − 0.16 | 0.10 | 0.123 |
| Lost money to fraud | − 0.13 | 0.28 | 0.637 |
| Days from training to test | − 0.01 | 0.01 | 0.317 |
| Generalized trust score | − 0.08 | 0.03 | 0.021 |
| Log(income) | − 0.12 | 0.06 | 0.045 |
| Years of education | − 0.02 | 0.02 | 0.452 |
| Married (married = 1; not = 0) | 0.34 | 0.10 | 0.001 |
| Age | 0.01 | 0.02 | 0.529 |
| Age^2 | 0.00 | 0.00 | 0.829 |
| Gender (female = 1; male = 0) | − 0.16 | 0.09 | 0.062 |
| Time used to complete the test (quantile) | − 0.04 | 0.03 | 0.219 |
Limitations
In dealing with experimental studies of this type, the potential for possible selection effects exists and could bias the findings. Since respondents self-select into the study, and perhaps more importantly, self-select into the later treatments testing for time delay effects, there could be some bias inherent in those that choose to join and then stay engaged with the study. We do attempt to assess this possible bias in the construction of a predictive model of drop-out which allows us to see not only who dropped out, but whether those that do drop out differ significantly from the remaining sample in terms of characteristics and percentage of correct responses in the training phase. Our model found women and people with higher education levels were less likely to drop out (all else equal). These variables are not predictive of the number of correct answers participants had on the test, suggesting that any bias in the experimental results would be quite limited. However, additional analysis of treatment interaction effects shows a small interaction between years of education and the interactive training arm, in effect suggesting that more the interactive training is more effective among more highly educated people. This suggests that there may be a bias in the final results that overestimates the impact of the training on the general population.
An additional limitation that must be acknowledged is that the training and subsequent tests all take place in an experimental environment and thus may not be predictive of how consumers operate in the real world. This is an area that the research team is exploring further in future studies.
Summary and Conclusions
Fraud schemes and imposters that impersonate the Social Security Administration are a serious problem affecting millions of people in the USA. This study uses a set of randomized control trials to test the effectiveness of new and existing approaches to train people to spot fraud. An informational message currently used by the Social Security Administration to warn people about fraud shows no effect, nor does a set of written instructions on how to spot fraud. The training that does show promise is an interactive training, in which individuals directly experience fraudulent communications and are inoculated against them. The interactive training provides a statistically significant improvement in the participant’s ability to correctly identify communications as fraudulent or not. The average effect based on the particular mix of messages used in the study is 7 percentage points (a 10% increase). In comparison, the effect for individual messages ranges from non-significant to 21 percentage points (up to a 50% increase from the control case).
The effect comes from teaching to people to detect fraudulent messages and teaching them to trust real messages. The training focuses on practical techniques to use with emails, and its impact is specific to that medium. There is no statistically significant effect for SMS or letters, which is not surprising since the techniques taught to identify fraudulent emails (looking at email headers and links) are not relevant for those mediums. The effect of the training generalizes to other user interfaces. A different email platform and user interface were used in one of the tests, with similar results. The effect of the training also can generalize to non-SSA messages; participants were able to correctly label fraudulent and real messages from the Amazon and Red Cross, for example. The duration of the training is limited though—decreasing after two weeks and losing statistical significance after four weeks.
In an exploratory analysis, the authors find that fraud susceptibility decreases with age but with a curve: the peak of the curve (the least likely age to fall prey to fraud) is 53 years old. Susceptibility to fraud also decreases with the person’s years of education. Another exploratory analysis looks at who is subject to undue distrust, or when people tend to label real messages as fraudulent. Women, people with higher income, and those with higher scores on a generalized trust measure are all less prone to undue, inaccurate distrust.
Policy Considerations
From a policy standpoint, the present study offers some promising results. This study suggests that simple, online training programs can be designed to help reduce imposter scams. These interventions do not necessarily have to be expensive to be effective. For example, the training process used in this study took participants a median of 4.6 min to complete and was developed at a very low cost using a few hours of a professional designer’s time. The primary cost to deploy this intervention at scale would be the cost of marketing it to individuals. If this training were added to existing interactions with the public, such as when people register on SocialSecurity.gov, the marketing cost would be minimal. At the present time, the SSA offers materials to help people guard against fraud. Our study suggests a superior method of shielding Americans from imposter scams. Whereas this is not costless, the interventions can be developed at a relatively low cost and are not too invasive or time consuming for the learner.
Our study additionally provides insight into a unique challenge raised by imposter scams in that consumers can effectively make two types of errors which carry unique practical and policy implications. Specifically, participants can make errors of fraud susceptibility (labeling a fake message as real) or undue distrust (labeling a true message as fake). The immediate effect of fraud susceptibility for the individual is obvious: the individual may lose money to fraudsters. The immediate effect of undue distrust is quite different: the individual may not trust real communications from the SSA or other agencies, leading to miscommunication, missing out on government services, and potentially financial penalties for failure to respond.
This study raises many questions that still need to be explored in terms of optimal design and structuring interventions for multiple mediums through which fraudsters might seek to contact consumers. This research can be accomplished using this, or a similar, experimental research platform to provide rigorous results that have been difficult to obtain in the past using victim-reported fraud data.10 Given further work in this space, it is reasonable to consider that public-facing materials and training modules could be developed to improve citizens’ engagements with organizations like the SSA.
Appendix 1
Supplementary detail on the experiment design.
The following information can be found online at https://github.com/sawendel/ssascams:
A guide to the data, for analysis by other researchers
An overview of the research platform used in the study, which is open source and available for other researchers to use.
Table 8 provides an overview of each message from the experiment; the full contents of each message can be found on the GitHub site under “html\v2akureytemplate\[test|training].”
Table 8.
Communications used in the experiment
| Medium | Real or fake? | Subject line | From name | From address | Reply-to |
|---|---|---|---|---|---|
| Real | Important Information About Your Online Account | NO-REPLY@ssa.gov | NO-REPLY@ssa.gov | NO-REPLY@ssa.gov | |
| Fake | Payment declined: Update your information so we can ship your order | Amazon.com | payments-update@gmail.com | payments-update@gmail.com | |
| Real | Delivery Update | Amazon.com | no-reply@amazon.com | order-update@amazon.com | |
| Fake | Your Urgent Support Is Needed | Red Cross Covid Campaign | covidcampaign@redcross.biz | covidcampaign@redcross.biz | |
| Fake | The Application Process Is Open For Disability Benefits | Application Assistance Program | applicationassistance@disabilitybenefits.com | disabilityhelp@gmail.com | |
| Fake | Opt Out of Receiving Mailed Notices | NO-REPLY@ssa.security | notices@ssa.security | notices@ssa.security | |
| Real | Need a replacement Social Security Card? | NO-REPLY@ssa.gov | NO-REPLY@ssa.gov | NO-REPLY@ssa.gov | |
| Fake | Annual Reminder to Review Your Social Security Statement | NO-REPLY@social.security.org | NO-REPLY@social.security.org | NO-REPLY@social.security.org | |
| Letter | Real | The Social Security Administration is contacting a few people… | Social Security Administration; Office of Quality Review | NA | NA |
| SMS | Fake | Disability Alert | 949–409-0220 | NA | NA |
| Letter | Fake | Notice of Intent to Levy Social Security Benefits | Benefits Suspensions Unit, Arlington County | NA | NA |
| SMS | Real | RED CROSS: Convalescent Plasma is needed | 909–99 | NA | NA |
Appendix 2
About the technical platform.
Overview of the Environment
The participant interactions occur in two phases: training and test. The backend for the training process is depicted in Fig. 5.
Fig. 5.

Backend flow for training process
The testing process is straightforward. First, the user goes to the Qualtrics survey for the test. In the survey, the user activates a new window which shows the Rainloop interface, with their username and password automatically filled in. Within Rainloop, all actions are logged to the DynamoDB. After the person has finished interacting with the emails in Rainloop, they close that window and complete the survey in Qualtrics.
Notes About Rainloop
For this project, the research team modified the source code of Rainloop to create a safe testing environment where participants could interact with it as they would with any other email program, but all external communication and consequences were removed. Participants could open and close the messages, view headers, click reply, delete messages, or label them as spam. However, these actions were each limited in their effect; for example, they could compose a message, but not actually send the email outside of the environment.11 Links were disabled so that the user could click on them but could not actually be directed to external websites.
Notes About GoPhish
The emails were designed and implemented in GoPhish,12 an open-source phishing security tool used by companies to test the susceptibility of their employees to phishing attacks. GoPhish provides an administrative interface for researchers and security professionals to setup realistic phishing campaigns, target sets of users, and track the results of those campaigns. In this case, the researchers modified GoPhish’s code to work seamlessly with the Qualtrics training module and Rainloop testing module. An external design and engineering firm, Akurey, customized the tools and provided graphic design for the scam emails.
Appendix 3
About Prolific and the Prolific samples.
This study uses Prolific to collect its sample of US residents. Prolific is a more recent and upcoming competitor to the commonly used Mechanical Turk service. It was founded in 2014 by Ph.D. students at Oxford and is based in the UK. They cater to the academic market, with a particular focus on supporting “ethical and trustworthy research.”13 Overall, the authors of this study have found that the panel services Prolific provides are of significantly higher quality and reliability than Amazon’s Mechanical Turk service.
A number of studies have been published that analyze the characteristics of these panel providers, including the demographics and behavior of their respondents. For example, Coppock and McClellan (2019) analyze the service from Lucid, another panel provider in the field, and find remarkable congruence with US demographics and with psychological responses from published social science research. A recent analysis of Mechanical Turk, Qualtrics Panels, Dynata, and Prolific found that “only Prolific provided high data quality on all measures” and “MTurk showed alarmingly low data quality even with data quality filters” (Peer et al. 2022). It should be noted that some of the authors on the paperwork at Prolific, however, as this sort of conflict could have influenced the results.
What Prolific and similar providers offer is a nationally representative, quota-based sample at a reasonable price.14 In a quota-based sample, potential participants are selected from a broader (non-representative) pool of people until specific quotas are met by age, gender, and other demographics so that the resulting sample matches those characteristics of the target population. Quota-based samples are common practice in market research but are known to be second-best compared with the gold standard in the field, probability-based samples. A series of studies have compared the properties of the two sampling methods and found that quota-based sample techniques have improved markedly over the decades but still can fail to replicate the characteristics of the US population (e.g., MacInnis et al. 2018). In this case, it was the only cost-effective option; care must be taken in interpreting the findings for the US population, especially any results that do not appear to be robust.
Across multiple iterations of the study, convenience samples were used in early iterations and the nationally representative, quota-balanced samples in later iterations. In total, the studies included 4,164 participants.
Funding
The research reported herein was performed pursuant to a grant from the U.S. Social Security Administration (SSA) funded as part of the Retirement and Disability Consortium.
Data Availability
The datasets generated during and/or analyzed during the current study are available in the GitHub repository https://github.com/sawendel/ssascams/ under “data.”
Declarations
Conflict of Interest
The authors declare no competing interests.
Disclaimer
The opinions and conclusions expressed are solely those of the author(s) and do not represent the opinions or policy of SSA or any agency of the Federal Government. Neither the United States Government nor any agency thereof, nor any of their employees, makes any warranty, express or implied, or assumes any legal liability or responsibility for the accuracy, completeness, or usefulness of the contents of this report. Reference herein to any specific commercial product, process or service by trade name, trademark, manufacturer, or otherwise does not necessarily constitute or imply endorsement, recommendation, or favoring by the United States Government or any agency thereof.
Footnotes
See https://www.ssa.gov/ and https://www.ssa.gov/fraud/ for more information on combating fraud as well as the benefits of fraud reporting.
These are our definitions based on common usage in the field. There are no simple consensus definitions, in part, because the terms are prevalent in different communities: phishing is used in cyber security, imposter scam is used in consumer protection and anti-fraud law enforcement. There is significant overlap between the concepts, but not complete: there are in-person imposter scams in which no digital deception (phishing) is used and theoretically a phishing attack does not have to impersonate a trusted party, though they usually do.
Links to a sample recording of one of these calls can be found on at https://www.consumer.ftc.gov/blog/2018/12/what-social-security-scam-sounds.
They also offer options for researchers who may want to use the freely provided code from the project’s GitHub site: https://github.com/sawendel/ssascams. The Qualtrics platform is a lightweight and familiar environment to conduct additional research on these topics. The Rainloop environment requires more setup and technical sophistication, but provides a more customizable, real email experience.
As noted above, the study expanded from an initial target of one experiment with 2000 participants to include multiple experiments with 4164 participants. Each subsequent sample excluded prior participants. This includes an unsuccessful attempt to use another panel provider, Dynata, whose data had to be discarded because of the low quality of the responses, as explained in Footnote 8.
The researchers started a 2000-respondent sample with Dynata using the Rainloop platform before realizing that Dynata had significant data quality issues. Dynata is a global market research company originally founded in 1999 and previously known as Research Now Survey Sampling International (SSI). It is a long-standing provider of market research tools and survey participants, including for academic studies. Whereas the prior Prolific study had a 68% second-round completion rate (68% of people who started the first study completed through the end of the second study with apparently valid data), the study with Dynata had a 15% second-round completion rate. The main reason, however, is that only 24% of those who started the second round provided valid data: most of them simply did not open the test emails, as instructed. For the few who remained, their data appears to be highly noisy. We had to discard the data from Dynata altogether.
Specifically, when the domains for each message are displayed altogether, it is clear that some are from a.gov domain while others are not. The Qualtrics-based test displayed messages on separate pages, making it more difficult to notice such inconsistencies. Again, in a live email environment, the domains would not be displayed together; hence, the design change made it more realistic.
The team ran a non-representative sample of 438 participants from Prolific (sample “5P,” as described in Appendix 1) through the original Rainloop design with sender domains with one key finding: both the interactive training and the non-interactive written tips had a statistically significant effect on currently identifying emails (with no effect on Letters or SMSs). There was no statistically significant difference between the interactive training and written tips.
Even though the test was first posted 3 days after the training, a small number of people took the training late, and then took the test shortly afterward.
To empower other researchers, all elements of the study are now open source: the two platforms developed to power the research, in Qualtrics and in Rainloop, the data resulting from the use of these platforms, and the code used to analyze the resulting data. Each of these is all freely available to the research community at the author’s GitHub site, with accompanying documentation, at https://github.com/sawendel/ssascams. The authors look forward to an active conversation with other members of the research community so that we might together better tackle this significant threat to people’s well-being and the proper functioning and success of government bodies such as the Social Security Administration.
The text of their messages was not logged for privacy reasons. Only the fact that they clicked “reply” was logged, using their otherwise anonymous user id (the ID provided by Prolific or Dynata).
Available at https://getgophish.com/.
We verified current prices for probability samples and found that a standard and well-respected online probability-based provider cost 10 times that of Prolific for an equivalent-sized panel.
Publisher's Note
Springer Nature remains neutral with regard to jurisdictional claims in published maps and institutional affiliations.
References
- American Association of Retired Persons. (2019). Social Security scams. AARP. http://www.aarp.org/money/scams-fraud/info-2019/social-security.html. Accessed 18 April 2020.
- American National Election Studies. (2016). Trust in government index 1958-2016. ANES 2016 Time Series Study. https://electionstudies.org/resources/anes-guide/top-tables/?id=116.
- Anandpara, V., Dingman, A., Jakobsson, M., Liu, D., & Roinestad, H. (2007). Phishing IQ tests measure fear, not ability. In S. Dietrich & R. Dhamija (Eds.), Financial Cryptography and Data Security (pp. 362–366). Lecture Notes in Computer Science. Springer.
- Anderson, K. B. (2016). Mass-market consumer fraud: Who is most susceptible to becoming a victim? (Federal Trade Commission Bureau of Economics Working Paper No. 332). https://www.ftc.gov/system/files/documents/reports/mass-market-consumer-fraud-who-most-susceptible-becoming-victim/working_paper_332.pdf. Accessed 19 December 2022.
- Anderson, K. B. (2019). Mass-market consumer fraud in the United States: A 2017 update. Staff report of the Bureau of Economics Federal Trade Commission. https://www.ftc.gov/system/files/documents/reports/mass-market-consumer-fraud-united-states-2017-update/p105502massmarketconsumerfraud2017report.pdf. Accessed 19 December 2022.
- Banas JA, Rains SA. A meta-analysis of research on inoculation theory. Communication Monographs. 2010;77(3):281–311. doi: 10.1080/03637751003758193. [DOI] [Google Scholar]
- Bélanger F, Carter L. Trust and risk in e-government adoption. The Journal of Strategic Information Systems. 2008;17(2):165–176. doi: 10.1016/j.jsis.2007.12.002. [DOI] [Google Scholar]
- Burnes D, Henderson CR, Sheppard C, Zhao R, Pillemer K, Lachs MS. Prevalence of financial fraud and scams among older adults in the United States: A systematic review and \meta-analysis. American Journal of Public Health. 2017;107(8):e13–21. doi: 10.2105/AJPH.2017.303821. [DOI] [PMC free article] [PubMed] [Google Scholar]
- Better Business Bureau. (2022). BBB report: Government imposter scams continue to be costly, new BBB research shows. https://www.bbb.org/article/news-releases/27079-bbb-report-government-impostor-scams-continue-to-be-costly-new-bbb-research-shows. Accessed 15 December 2022.
- Chanley VA, Rudolph TJ, Rahn WM. The origins and consequences of public trust in government: A time series analysis. Public Opinion Quarterly. 2000;64(3):239–256. doi: 10.1086/317987. [DOI] [PubMed] [Google Scholar]
- Chen H, Beaudoin CE, Hong T. Securing online privacy: An empirical test on internet scam victimization, online privacy concerns, and privacy protection behaviors. Computers in Human Behavior. 2017;70:291–302. doi: 10.1016/j.chb.2017.01.003. [DOI] [Google Scholar]
- Compton, J. (2013). Inoculation theory. In J. Price Dillard & L. Shen (Eds.), The SAGE handbook of persuasion: Developments in theory and practice (pp. 220–237). Sage Publications.
- Coppock, A., & McClellan, O. A. (2019). Validating the demographic, political, psychological, and experimental results obtained from a new source of online survey respondents. Research & Politics,6(1). 10.1177/2053168018822174.
- Federal Bureau of Investigation: Internet Crime Compliant Center. (2021). Internet crime report 2020. https://www.ic3.gov/Media/PDF/AnnualReport/2020_IC3Report.pdf. Accessed 16 September 2021.
- Federal Trade Commission. (2021). Consumer Sentinel Network data book 2020. https://www.ftc.gov/reports/consumer-sentinel-network-data-book-2020. Accessed 16 September 2021.
- FINRA Investor Education Foundation. (2013). Financial fraud and fraud susceptibility in the United States. Research Report from a 2012 National Survey. Applied Research and Consulting New York, NY. https://www.saveandinvest.org/sites/saveandinvest/files/Financial-Fraud-And-Fraud-Susceptibility-In-The-United-States.pdf. Accessed 16 September 2021.
- Fletcher, E. (2019). Growing wave of social security imposters overtakes IRS scam. Federal Trade Commission. https://www.ftc.gov/news-events/blogs/data-spotlight/2019/04/growing-wave-social-security-imposters-overtakes-irs-scam (last updated 12 April 2019).
- Goel RK. Masquerading the government: Drivers of government impersonation fraud. Public Finance Review. 2021;49(4):548–572. doi: 10.1177/10911421211029305. [DOI] [Google Scholar]
- Holtfreter K, Reisig MD, Pratt TC. Low self-control, routine activities, and fraud victimization. Criminology. 2008;46(1):189–220. doi: 10.1111/j.1745-9125.2008.00101.x. [DOI] [Google Scholar]
- KLEW. (2020). Scam alert: Phishing email appears to come from social security administration. https://klewtv.com/news/local/scam-alert-phishing-email-appears-to-come-from-social-security-administration (last updated 6 May 2020).
- Leach, J. (2018). Fake calls about your SSN. Consumer information. https://www.consumer.ftc.gov/blog/2018/12/fake-calls-about-your-ssn (last updated 12 December 2018).
- MacInnis, B., Krosnick, J. A., Ho, A. S., & Cho, M. (2018). The accuracy of measurements with probability and non-probability survey samples: Replication and extension. Public Opinion Quarterly, 82(4), 707–744. 10.1093/poq/nfy038
- McGuire WJ. The Effectiveness of supportive and refutational defenses in immunizing and restoring beliefs against persuasion. Sociometry. 1961;24(2):184–197. doi: 10.2307/2786067. [DOI] [Google Scholar]
- McGuire, W. J, Haaland, C. C., & Kaelber, W. O. (1964). Inducing resistance to persuasion: Some contemporary approaches. Advances in Experimental Social Psychology, 1,191–229.
- Muscat, G., James, M., & Graycar, A. (2002). Older people and consumer fraud. 220. Trends & issues in crime and criminal justice. Australian Institute of Criminology. http://www.aic.gov.au/publications/tandi/ti220.pdf. Accessed 19 December 2022.
- Peer Eyal, Rothschild David, Gordon Andrew, Evernden Zak, Damer Ekaterina. Data quality of platforms and panels for online behavioral research. Behavior Research Methods. 2022;54(4):1643–1662. doi: 10.3758/s13428-021-01694-3. [DOI] [PMC free article] [PubMed] [Google Scholar]
- Roozenbeek J, Van der Linden S. Fake news game confers psychological resistance against online misinformation. Palgrave Communications. 2019;5(1):1–10. doi: 10.1057/s41599-019-0279-9. [DOI] [Google Scholar]
- Saleh, N. F., Roozenbeek, J., Makki, F. A., Mcclanahan, W. P., & Van der Linden, S. (2021). Active inoculation boosts attitudinal resistance against extremist persuasion techniques: A novel approach towards the prevention of violent extremism. Behavioural Public Policy, 1–24. 10.1017/bpp.2020.60
- Scheithe, E. (2020). Five ways to recognize a social security scam. Consumer Financial Protection Bureau. https://www.consumerfinance.gov/about-us/blog/five-ways-to-recognize-social-security-scam/ (last updated 18 February 2020).
- SimplyWise. (2021). SimplyWise retirement confidence index. SimplyWise (blog). https://www.simplywise.com/blog/retirement-confidence-index/ (last updated 18 January 2021).
- Skiba, K. (2021). Social security impostor complaints break record in 2020. AARP. https://www.aarp.org/money/scams-fraud/info-2021/record-high-social-security-impostor-complaints.html (last updated 4 March 2021).
- Titus RM, Heinzelmann F, Boyle JM. Victimization of persons by fraud. Crime & Delinquency. 1995;41(1):54–72. doi: 10.1177/0011128795041001004. [DOI] [Google Scholar]
- Van Wyk J, Benson ML. Fraud victimization: Risky business or just bad luck? American Journal of Criminal Justice. 1997;21(2):163–179. doi: 10.1007/BF02887448. [DOI] [Google Scholar]
- Waggoner, J. (2020). Social security scammers turn to email. AARP. https://www.aarp.org/money/scams-fraud/info-2020/social-security-email.html (last updated 9 January 2020).
- Wendel S. Designing for behavior change: Applying psychology and behavioral economics. 2. O’Reilly Media; 2020. [Google Scholar]
- Whitty MT. Predicting susceptibility to cyber-fraud victimhood. Journal of Financial Crime. 2019;26(1):277–292. doi: 10.1108/JFC-10-2017-0095. [DOI] [Google Scholar]
- YouMail. (2021). Amazon imposter robocalls reaching 150 million per month. https://www.prnewswire.com/news-releases/amazon-imposter-robocalls-reaching-150-million-per-month-301290910.html (last updated 13 May 2021).
Associated Data
This section collects any data citations, data availability statements, or supplementary materials included in this article.
Data Availability Statement
The datasets generated during and/or analyzed during the current study are available in the GitHub repository https://github.com/sawendel/ssascams/ under “data.”