

Abstract
EAI045 is a tyrosine kinase inhibitor (TKI) that targets the mutant epidermal growth factor receptor (EGFR). It was developed to control resistance to available EGFR TKIs. In this study, a major metabolite of EAI045, (5‐fluoro‐2‐hydroxyphenyl)(1‐oxo‐1,3‐dihydro‐2H‐isoindol‐2‐yl)acetic acid (PIA), was discovered as a hydrolysis product of the parent drug. A validated assay for both analytes in mouse plasma and tissue homogenates from brain, kidney, liver, lung, spleen, and small intestine with content was set up using LC–MS/MS. Samples were prepared by protein precipitation with acetonitrile and with PLX4720 as internal standard. Separation was performed on a bridged ethylene hybrid C18 column by gradient elution with 0.1% v/v formic acid and methanol. Using positive electrospray, detection was performed in selected reaction monitoring mode. A linear calibration range of 2–2,000 ng/ml was used and validated for both analytes. Precision values ranged between 2.0 and 7.5% for EAI045 and between 2.2 and 12.1% for the metabolite, and accuracy values were between 91.1 and 107.6% for EAI045 and between 87.6 and 100.6% for the metabolite. Both analytes were sufficiently stable under the relevant analytical conditions. Finally, the assay was applied to analyze mouse plasma and tissue levels in a pharmacokinetic study in FVB/NRj wild‐type female mice treated with oral EAI045.
Keywords: EAI045, EGFR‐TKI, LC–MS/MS, metabolite, mouse matrices
Abbreviations
- BEH
Bridged Ethyl Hybrid
- EGFR
epidermal growth factor receptor
- EMA
European Medicines Agency
- FVB
Friend virus B‐type
- PIA
(5‐fluoro‐2‐hydroxyphenyl)(1‐oxo‐1,3‐dihydro‐2H‐isoindol‐2‐yl)acetic acid (abbreviated as PIA for [phenyl‐(iso)indol‐acetic acid]
- QTRAP
quadrupole linear ion trap
- SIWC
small intestine with contents
- TKI
tyrosine kinase inhibitor
- US FDA
US Food and Drug Administration
1. INTRODUCTION
Epidermal growth factor receptor (EGFR) inhibition has become a standard therapy for nonsmall cell lung cancer (H. Patel et al., 2018). Mutations involving EGFR lead to overexpression of the receptor and this in turn causes uncontrolled cell proliferation (Dong et al., 2021). With the discovery of EGFR tyrosine kinase inhibitors (TKIs), superior survival benefits have been seen for nonsmall cell lung cancer patients and significant efforts are being made to develop new EGFR TKIs (Du et al., 2021). Currently available and used in clinical practice are first‐, second‐ and third‐generation EGFR TKIs such as gefitinib, erlotinib, afatinib and osimertinib (Dong et al., 2021; H. M. Patel et al., 2021). However, a leading problem remains acquired resistance in cancer cells, which results in progression of the disease. The most reported mechanism of resistance to third‐generation inhibitors targeting the EGFR T790M mutation involves the C797S mutation. EAI045 is the first fourth‐generation inhibitor that overcomes the T790M‐ and C797S‐mediated resistance mechanisms through allosteric binding to EGFR (Jia et al., 2016). EAI045 (Figure 1a) was found to be the most selective inhibitor for mutant EGFR over wild‐type EGFR. Although in vitro and in vivo studies have not demonstrated the efficacy of EAI045 as a single agent, a marked reduction in tumor growth was observed in a mouse model of L858R/T790M/C797S mutant‐driven lung cancer in combination with cetuximab (Jia et al., 2016). So far, validated methods have been published to support preclinical trials with EAI045 in rat (Lv et al., 2018; Zhang et al., 2020) only. The first method described for the UPLC–MS/MS analysis of EAI045 (2–2,000 ng/ml) in rat plasma and tissues uses pre‐treatment by protein precipitation with acetonitrile (Lv et al., 2018). The second paper presented a chiral HPLC method developed for the determination of EAI045 enantiomers in rat plasma (2–600 μg/ml), in which samples were treated by centrifugation followed by evaporation (Zhang et al., 2020). Further, as far we know, to date no metabolism studies and no metabolites have been reported for EAI045.
FIGURE 1.

Chemical structures and product spectra of the protonated ions of (a) EAI045, m/z 384.1 at 15 V, (b) PIA [phenyl‐(iso)indol‐acetic acid], m/z 302.1 at 26 V and (c) PLX4720, m/z 414.1 at 31 V with the expected fragments used for quantification.
This study was designed to develop and to validate a quantitative bioanalytical LC–MS/MS method for EAI045 in mouse plasma and six tissue homogenates (brain, kidney, liver, lung, spleen and small intestine with contents, SIWC). A major metabolite of EAI045 was discovered during development of the method, (5‐fluoro‐2‐hydroxyphenyl)(1‐oxo‐1,3‐dihydro‐2H‐isoindol‐2‐yl)acetic acid, abbreviated PIA for (phenyl‐[iso]indol‐acetic acid) (Figure 1b). Therefore, an single assay for both the drug and its main metabolite has been developed and validated. A 96‐well plate format was used to improve sample throughput. Finally, the assay was applied in a pilot pharmacokinetic and drug distribution study in wild‐type mice.
2. MATERIAL AND METHODS
2.1. Chemicals and reagents
EAI045 (>99.4%, molecular weight 383.40 g/mol) and PIA (>95%, molecular weight 301.27 g/mol) originated from Carbosynth (Compton, Berkshire, UK). PLX4720 (>99%, molecular weight 413.83 g/mol) was obtained from Selleck Chemicals (Houston, TX, USA). Water (ULC–MS grade), methanol (HPLC grade) and acetonitrile (HPLC‐S grade) were obtained from Biosolve (Valkenswaard, The Netherlands). Formic acid of analytical grade was supplied by Merck (Darmstadt, Germany). Water, purified by reversed osmosis was available at the research institute and used for all other purposes. Both pooled blank human lithium–heparin plasma and pooled female mouse lithium–heparin plasma were provided by Sera Laboratories (Haywards Heath, UK). Blank mouse tissue homogenates were prepared by mixing the whole organ with ice‐cold 2% (w/v) bovine serum albumin in Milli‐Q water followed by homogenization using the FastPrep‐24™ 5G instrument (M.P. Biomedicals, Santa Ana, CA, USA) for 1 min. Different appropriate volumes were used for different organs (1 ml for brain, spleen and lung; 2 ml for kidney; and 3 ml for liver and SIWC). All matrices for analysis were stored at −30°C.
2.2. Analytical instruments
The LC–MS/MS instrument consisted of a binary ultra‐high‐performance liquid chromatography (UHPLC) system, with two LC‐30 AD pumps, a SIL30‐ACmp autosampler, a CTO‐20 AC column oven and a DGU‐20A5R degasser, all from Shimadzu. A triple quadrupole mass spectrometer, AB SCIEX quadrupole linear ion trap (QTRAP®5500, Ontario, Canada), was coupled to the LC system with a Turbo V™ TurboIonSpray® source and was equipped with an inlet valve. The LC system and mass spectrometer were controlled and data were collected using Analyst® software version 1.6.2 (Sciex, Ontario, Canada). Quantitative data processing was done using the MultiQuant™ software version 3.0.1 (Sciex, Ontario, Canada).
2.3. LC–MS/MS conditions
Sample volumes of 4 μl were injected onto a Waters Acquity UPLC® Bridged Ethyl Hybrid (BEH) C18 column (2.1 × 30 mm, 1.7 μm particle size, Waters, Milford, MA, USA), using 0.1% (v/v) formic acid in water (A) and methanol (B), with a run time of 2.2 min and a total flow rate of 0.6 ml/min. The temperature of the column oven was set at 40°C and the autoinjector rack at 4°C. Gradient elution started at 40% methanol and increased linearly to 70% in 1.5 min, followed by flushing with 100% methanol for 0.3 min and re‐equilibration at 40% until the end of the run. A Sciex QTRAP®5500 triple quadrupole mass spectrometer was used for detection. The optimized electrospray parameters were: 4000 V ion spray voltage; 15 psi curtain gas; “medium” collision gas; 60 psi ion source gas 1; 75 psi ion source gas 2; and 700°C temperature. Selected reaction monitoring in positive ion mode with unit resolution for both quadrupoles was performed at m/z 384.1 > 101.0, 85 V declustering potential and 15 V collision energy for EAI045, at m/z 302.1 > 134.0, 50 V declustering potential and 26 V collision energy for PIA, and at m/z 414.1 > 307.0, 96 V declustering potential and 31 V collision energy for PLX4720 (internal standard, IS). The dwell time was 50 ms, and the entrance potential was 10 V.
2.4. Stock and working solutions
EAI045 and PIA stock solutions of 0.5 mg/ml were prepared by weighing 300–500 μg of EAI045 or PIA and dissolving in methanol. Separate combined working solutions prepared by a 10‐fold dilution with methanol (50,000 ng/ml for both compounds) were used for calibration and quality control (QC) samples. For PLX4720, a stock solution of 0.5 mg/ml was prepared with methanol, then serially diluted to 200 ng/ml in acetonitrile to be used as the precipitation solvent.
2.5. Calibration and quality control samples
The highest calibration standard for both analytes at 2,000 ng/ml was prepared by diluting one combined working solution with blank pooled mouse plasma; small portions were stored in polypropylene tubes at −30°C until further use. Additional calibration standards at 1000, 200, 100, 20, 10, 4 and 2 ng/ml were prepared daily by serial dilution of the highest standard with blank mouse plasma. High, medium, low and LLOQ QC samples in mouse plasma at 1,500, 100, 6 and 2 ng/ml were prepared from the second combined working solution and also stored at −30°C in small portions until further use. Quality control samples in brain, kidney, liver, lung, spleen and SIWC homogenates were prepared at medium level (100 ng/ml) only by diluting the QC‐high plasma sample.
2.6. Sample preparation
Ten‐microliter plasma or tissue homogenate samples were pipetted into conical 200‐μl polypropylene 96‐well plates and protein precipitation was performed by adding 20 μl of the protein precipitant containing the IS (200 ng/ml PLX4720 in acetonitrile). Wells were sealed with a silicone mat and the plate was vortex mixed for approximately 10 s. Next, the plate was placed in the centrifuge at 2643 g for 5 min at 20°C. After centrifugation, 15 μl of supernatant was transferred to a 1 ml round bottom 96‐well plate and diluted with 200 μl of 25% (v/v) methanol in water. Finally, samples were vortex‐mixed gently and then placed in the autosampler for analysis.
2.7. Bioanalytical method validation
The European Medicines Agency (EMA) and US Food and Drug Administration (FDA) guidelines (European Medicines Agency, 2011; FDA & CDER, 2018) were used for bioanalytical validation procedures with full validation for plasma and partial validation for six tissue homogenates (brain, kidney, liver, lung, spleen and SIWC) for both target analytes.
2.7.1. Calibration
All calibration samples (seven levels) were processed daily in duplicate, including blank (no analyte) and double blank (no analyte and no internal standard) samples. The calibration curve was defined using weighted least squares linear regression with 1/x 2 (where x is the concentration) as the weighting factor, where peak area ratios (EAI045/IS and PIA/IS) were used as a function of concentration.
2.7.2. Precision and accuracy
To assess the accuracy and precision for both analytes, six replicates of QC samples, in three separate analytical runs, giving n = 18 in total were analyzed at high, medium, low and LLOQ levels (1,500, 100, 6 and 2 ng/ml) for plasma samples and at medium level (100 ng/ml) for six different pooled tissue homogenate matrices.
2.7.3. Selectivity
The selectivity of the assay was assessed by analyzing six different mouse plasma samples and four of each tissue homogenate (n = 24). Each sample was analyzed twice, once as a double blank (no analyte and no IS) and once as a LLOQ‐spiked sample (2 ng/ml EAI045 and 2 ng/ml PIA, with IS).
2.7.4. Recovery and matrix effect
Extraction recovery and matrix effects in mouse plasma of EAI045 and metabolite were determined at high, medium and low QC levels (n = 4 per level). The experiment was performed with processed plasma QC samples as described in Section 2.5 and with reference methanolic QC samples prepared at half of the original QC levels. For determination of the extraction recovery, processed plasma QC samples (A) were compared with post‐extraction spiked methanolic QC samples (B). For determination of the matrix effect, post‐extraction QC samples were compared with (matrix‐free) similarly diluted methanolic QC samples (C).
The relative matrix effects at high and low QC‐levels were evaluated for the same six individual plasma samples and 24 tissue homogenates as used for the selectivity experiment. Methanolic QC samples containing IS and blank extract were compared with diluted methanolic QC samples without extract at identical concentrations.
2.7.5. Stability
The stability of analytes in mouse plasma was determined by subjecting 10 μl portions (n = 4) of QC high and low samples in 200 μl well plates for an additional period under the following conditions: (a) 5 and 24 h at room temperature (short term stability); (b) freeze–thaw cycles (n = 3) that consisted of thawing 1 h at room temperature and freezing at −30°C for 1 day (freeze thaw stability); and (c) 1.5 months at −30°C (long‐term stability). Stability in six tissue homogenate matrices was determined for one condition (5 h at room temperature) at the medium QC level (n = 4). To test the stability post‐processing (autosampler stability), extracts of QC samples [n = 2 for each plasma QC (high, medium and low); n = 6 for each tissue homogenate QC] were stored at 4°C and reanalyzed 5 days later with fresh calibration samples. Potential hydrolytic degradation of EAI045 was tested via a short‐term stability experiment (5 h room temperature) in plasma, liver and SIWC samples at the highest EAI045 QC level without PIA present. Finally, methanolic single analyte stock solutions were reanalyzed after 1.5 months of storage at −30°C to investigate the stock stability of EAI045 and PIA.
2.7.6. Incurred samples reanalysis
The reproducibility of the method was finally assessed by reanalyzing study samples of the Friend virus B‐type (FVB)/NRj mouse strain (n = 5) within 1 week for each of the seven matrices (n = 35) that were stored at −30°C.
2.7.7. Mouse pharmacokinetics
Five female wild‐type mice of FVB/NRj genetic background (Janvier Labs, Le Genest‐Saint‐Isle, France) aged between 10 and 15 weeks were orally administered a single dose of EAI045 of 20 mg/kg, based on a previous in vivo mouse study (Jia et al., 2016). The drug was dissolved in dimethyl sulfoxide at a concentration of 4 mg/ml and diluted with polysorbate 80–ethanol (1:1, v/v), and then 5% (w/v) glucose in water to yield a concentration of 2 mg/ml. The mice were housed in a temperature‐controlled environment with a 12 h light/12 h dark cycle at the animal facility of the Netherlands Cancer Institute (Amsterdam, The Netherlands), fed a standard diet and acidified water ad libitum and treated according to protocols of the national and European regulations for animal experiments. This pilot mouse study was part of the nationally approved DEC/CCD project AVD301002016595. In brief, mice were fasted 3 h before EAI045 was administered by oral gavage into the stomach using a blunt‐ended needle. Capillary blood collection (50 μl samples) occurred at 5 min, 15 min, 30 min, 1 h and 2 h from the tail vein in heparinized microvettes. After 4 h, mice were anesthetized with isoflurane and final blood samples were collected by cardiac puncture. Plasma was acquired by centrifugation of blood samples immediately after collection at 9,000 g for 6 min at 4°C. The six organs (brain, kidneys, liver, lung, spleen and SIWC) were quickly removed, weighed and homogenized on ice in appropriate volumes of 2% (w/v) bovine serum albumin after sacrificing the mice by cervical dislocation. All samples were stored at −30°C until further analysis. Dilution (1:5 (v/v)) with human lithium heparin plasma before analysis was applied to liver samples. Human plasma was used instead of mouse plasma because of limited availability of mouse material.
Noncompartmental pharmacokinetic parameters are reported as means ± standard deviation (SD). From the highest levels and correlative time points, the following parameters were calculated: the maximum plasma concentration (C max) and the time to reach C max (T max) using the software GraphPad Prism 7 (GraphPad Software, La Jolla, CA, USA). The area under the plasma concentration‐time curve (AUC0–t ) was calculated using the trapezoidal rule with MS Excel (with add‐in program PKSolver). Apparent oral clearance (CL/F) was calculated as theh dose divided by AUC0–t .
3. RESULTS AND DISCUSSION
3.1. Method development
A pilot metabolism study with LC–UV using human liver microsomes was conducted to find potential metabolites of EAI045 via cytochrome P450 (phase I) enzymatic reactions (Brandon et al., 2005). In vitro incubation yielded one potential metabolite. For LC–UV the same chromatographic conditions were used as reported in Section 2.3 using a photo diode array detector. Chromatographic data were analyzed at 273 nm. LC–MS/MS experiments led to identification of the hydrolysis product PIA of EAI045 formed by breaking of the amide bond. The clinical significance of this metabolite is unknown yet but simultaneous determination in preclinical studies may improve understanding of the pharmacokinetic routes of the drug, especially because several matrices contained significant amounts of PIA. Method validation for both compounds was started after obtaining the PIA reference, also being an intermediate of EAI045 synthesis (Hao et al., 2019), from the commercial supplier.
Protein precipitation in a 96‐well format was used as a tool for a high‐throughput analytical method. The use of acetonitrile herein as a precipitant agent had been frequently applied previously for kinase inhibitors and was therefore adopted in this method (Rood et al., 2016). To accommodate the low amount of organic modifier in the eluent, the extract was diluted with 25% (v/v) methanol in water. A stable isotopically labeled analogue of EAI045 was not commercially available, therefore 12 kinase inhibitors were screened for similar retention compared with EAI045. Because of their similar retention times, ponatinib, dabrafenib and PLX4720 were further investigated. PLX4720 showed an almost identical retention to EAI045 and better precisions in a pilot experiment and was therefore chosen as most suitable IS for EAI045; later it was also used for PIA.
Adequate chromatographic retention was achieved on the Acquity UPLC® BEH C18 column with a short run time of 2.2 min. Sufficient MS responses and good peak shape, resolution and signal‐to‐noise ratios were observed for methanol and formic acid in the eluent, therefore they were a better choice compared with acetonitrile and ammonium formate or ammonium hydroxide. Mass spectrometric conditions, electrospray and selected reaction monitoring in positive ion mode were optimized for protonated ions (MH+) at m/z 384.1 for EAI045, 302.1 for PIA and 414.1 for PLX4720 by direct infusion experiments and ramping individual ionization parameters. Individual analyte solutions of 100 ng/ml in 50% (v/v) methanol and 50% (v/v) water containing 0.1% formic acid were used. Product masses at m/z 101.0, 134.0 and 307.0 were used for quantification of EAI045, PIA and PLX4720, respectively. The selection of product masses was based on the linearity of the calibration curve (high R 2). To facilitate quantification of EAI045 and PIA levels in all sample types the concentration range of 2–2,000 ng/ml was used. The product spectra of EAI045, PIA and IS are shown in Figure 1.
3.2. Method validation
The calibration range of 2–2,000 ng/ml for EAI045 was based on pharmacokinetic data from a previously published study (Lv et al., 2018). The assay was validated using international guidelines with full validation for mouse plasma and partial validation for six tissue homogenates (European Medicines Agency, 2011; FDA & CDER, 2018). Representative chromatograms of extracted mouse plasma are shown in Figure 2. This figure shows the sensitivity of the assay. Limit of detection (LOD) values based on a signal‐to‐noise ratio of 3 were 0.1 and 0.7 ng/ml for EAI045 and PIA, respectively. Carryover of the method was 7% of LLOQ for EAI045 and ≤15% (could not be distinguished from noise) of LLOQ for PIA in a blank sample after injection of the highest calibration sample at 2,000 ng/ml. These values are within the 20% requirement by the FDA and EMA guidelines (European Medicines Agency, 2011; FDA & CDER, 2018).
FIGURE 2.

Representative chromatograms of double blank pooled plasma samples and lower limit of quantitation spiked plasma samples showing (a) EAI045, (b) PIA and (c) PLX4720. Signals were given an artificial offset.
3.2.1. Calibration
The calibration curves exhibited good linearity over the range 2–2,000 ng/ml for both EAI045 and its metabolite PIA. Linear regression parameters [mean (±SD), n = 5] using weighted (1/x 2) least squares regression were: y = 0.0031 (±0.0002) · x − 0.0000 (± 0.0009) and R 2 = 0.9956 (± 0.0014) for EAI045 and y = 0.00090 (±0.00006) · x − 0.0001 (± 0.0004) and R 2 = 0.9934 (± 0.0026) for PIA, where y is the peak area ratio of analyte to IS, x the analyte concentration in ng/ml and R 2 the coefficient of determination. Average deviations (n = 5) of nominal concentrations (n = 8) were all <6.0% and support the applicability of this method.
3.2.2. Accuracy and precision
In order to test the assay performance, intra‐ and inter‐day precisions and accuracies were determined by the evaluation of four QC levels for plasma (Table 1) and one QC level for the six tissue homogenates (Table 2) on three different days (n = 18). All data on accuracy and precision were within the required limit of 15% variation (and 20% for the LLOQ) of regulatory guidelines (European Medicines Agency, 2011; FDA & CDER, 2018).
TABLE 1.
Assay performance data of EAI045 and PIA [phenyl‐(iso)indol‐acetic acid] in mouse plasma
| Level (ng/ml) | Intra‐day precision (%) | Inter‐day precision (%) | Accuracy (%) | |
|---|---|---|---|---|
| EAI045 | 1,500 | 3.8 | 5.5 | 100.5 |
| 100 | 2.0 | 4.1 | 97.7 | |
| 6 | 3.3 | 7.0 | 92.3 | |
| 2 | 4.4 | 4.9 | 91.1 | |
| PIA | 1,500 | 3.8 | 3.9 | 100.6 |
| 100 | 2.2 | 2.9 | 97.4 | |
| 6 | 5.1 | 6.0 | 93.1 | |
| 2 | 8.6 | 11.0 | 90.9 |
TABLE 2.
Assay performance data and short term stability, expressed as recovery (5 h at ambient temperature), for 100 ng/ml EAI045 and 100 ng/ml PIA in tissue homogenates
| Tissue | Intra‐day precision (%) | Inter‐day precision (%) | Accuracy (%) | Recovery (%) | |
|---|---|---|---|---|---|
| EAI045 | Brain | 4.1 | 4.3 | 104.0 | 95.5 ± 2.1 |
| Kidney | 4.6 | 4.1 | 105.2 | 93.2 ± 1.8 | |
| Liver | 4.7 | 5.2 | 106.9 | 108.9 ± 4.9 | |
| Lung | 5.7 | 5.1 | 106.4 | 96.3 ± 4.6 | |
| Spleen | 4.8 | 4.6 | 106.5 | 93.0 ± 8.2 | |
| SIWC | 7.2 | 7.5 | 107.6 | 100.1 ± 2.8 | |
| PIA | Brain | 3.2 | 3.1 | 87.6 | 99.7 ± 5.1 |
| Kidney | 4.4 | 4.5 | 88.3 | 99.4 ± 2.4 | |
| Liver | 11.7 | 12.1 | 97.9 | 113.6 ± 10.9 | |
| Lung | 9.0 | 8.6 | 94.0 | 107.3 ± 2.0 | |
| Spleen | 7.9 | 7.7 | 93.6 | 107.2 ± 7.6 | |
| SIWC | 6.8 | 7.0 | 89.7 | 104.2 ± 3.4 |
3.2.3. Selectivity
No co‐eluting peaks larger than 10% of the LLOQ response and greater than 0.1% of the normal IS response were observed for EAI045 in individual plasma samples. For PIA, only one out of six plasma samples exceeded ±20% of the nominal value (+25.5%). There were no co‐eluting peaks in blank tissue samples greater than 0.2% of the IS response for both EAI045 and PIA. Blank tissue responses exceeded 20% of the LLOQ response for only one out of four samples for EAI045 in kidney (20.7%) and one out of four for PIA in SIWC (23.8%). Concentrations in LLOQ spiked mouse plasma (n = 6) were 2.21 (± 0.11) ng/ml for EAI045 and 2.24 (± 0.13) ng/ml for PIA, and 2.08 (± 0.24) ng/ml and 1.98 (± 0.24) ng/ml in tissue homogenates (n = 24) for EAI045 and PIA respectively. These results demonstrate sufficient selectivity at the LLOQ level of 2 ng/ml with this assay for both compounds with only limited numbers of exceptions (one out of 30 for EAI045 and two out of 30 for PIA).
3.2.4. Recovery and matrix effect
Extraction recoveries (101–114%) as well as matrix effects (93–102%) tested at three QC levels in mouse plasma did not reflect any loss of EAI045. For PIA, no extraction effect at medium and high levels (108–112%), a low extraction effect at the lowest level (83%) and no matrix effect (93–97%) were observed. As shown in Table 3, all data except that for PIA (83%) showed less than 15% deviation.
TABLE 3.
Extraction recovery and matrix effect for EAI045 and PIA in mouse plasma expressed as average ± SD
| Level (ng/ml) | Recovery (%) | Matrix effect (%) | ||
|---|---|---|---|---|
| EAI045 | PIA | EAI045 | PIA | |
| 1,500 | 107.5 ± 6.4 | 107.7 ± 6.8 | 94.8 ± 2.4 | 93.1 ± 1.9 |
| 100 | 113.7 ± 3.4 | 111.8 ± 5.5 | 92.8 ± 3.4 | 94.9 ± 3.5 |
| 6 | 100.6 ± 2.7 | 83.0 ± 10.4 | 101.7 ± 6.9 | 96.5 ± 16.5 |
Assessment of the overall relative matrix effect in all matrices showed no significant matrix effects at high and low QC levels for EAI045 (99.7 ± 1.9% and 99.7 ± 3.7%, respectively) and at high and low QC levels for PIA (99.0 ± 2.6% and 91.5 ± 6.5%, respectively; Table 4). The average effects for individual matrices were all within 85–115% according to the current guidelines (European Medicines Agency, 2011; FDA & CDER, 2018).
TABLE 4.
Relative matrix effect (%) of EAI045 and PIA in mouse plasma (n = 6) and tissue homogenates (n = 4) expressed as average ± SD
| EAI045 | PIA | |||
|---|---|---|---|---|
| Matrix | QC high | QC low | QC high | QC low |
| Plasma | 103.3 ± 3.0 | 104.2 ± 6.4 | 103.6 ± 2.1 | 103.9 ± 13.3 |
| Brain | 100.2 ± 1.2 | 98.5 ± 2.2 | 102.7 ± 7.3 | 85.5 ± 5.8 |
| Kidney | 99.4 ± 1.6 | 101.4 ± 5.4 | 100.4 ± 1.3 | 85.5 ± 5.8 |
| Liver | 98.2 ± 1.9 | 99.8 ± 1.6 | 97.1 ± 2.8 | 89.7 ± 1.7 |
| Lung | 98.0 ± 1.5 | 98.0 ± 3.8 | 96.7 ± 1.6 | 100.6 ± 7.7 |
| Spleen | 98.6 ± 0.9 | 97.2 ± 4.9 | 97.1 ± 0.1 | 88.9 ± 6.4 |
| SIWC | 99.9 ± 3.0 | 98.5 ± 1.8 | 95.4 ± 2.8 | 86.4 ± 5.0 |
3.2.5. Stability
Data for stability studies in tissue homogenates and plasma are reported in Tables 2 and 5, respectively. No noticeable loss was observed for EAI045 with recoveries between 89.5 and 108.9%, nor for PIA with recoveries between 90.8 and 113.6%. The stability of processed extracts after 5 days of storage at 4°C only showed minimal loss of EAI045 in plasma and spleen QCs with deviations of −15.5 and −15.3%, respectively. All other EAI045 and PIA levels did not exceed the 15% deviation. Further, only minor hydrolytic degradation was observed for the experiment with EAI045 in plasma, liver and SIWC QC samples after 5 h of storage at room temperature since resulting PIA concentrations were in the range of 0.4–0.9% compared with EAI045 at t = 0. The pilot study (Section 3.2.7) showed metabolite levels higher than 10% compared with EAI045 for all matrices except SIWC, where a ratio of ca. 5% could be observed. Therefore, any hydrolytic enzyme facilitating PIA formation in vivo was found not to produce relevant amounts of metabolite in plasma and the three tissue homogenates at ambient temperature in vitro. Finally, methanolic stock solutions were fairly stable after 1.5 months of storage at −30°C with recoveries found of 93.4% for EAI045 and 98.3% for PIA. Taken together, essential stability was proved for both analytes.
TABLE 5.
Recovery for EAI045 and PIA in plasma (recovery (%) ± SD; n = 4) after exposure to different storage conditions. Details of freeze–thaw cycles are described in Section 2.7.5
| EAI045 | PIA | |
|---|---|---|
| Short‐term stability/5 h at room temperature | ||
| QC high | 101.5 ± 2.3 | 101.8 ± 4.1 |
| QC low | 97.8 ± 2.7 | 93.3 ± 1.8 |
| Short‐term stability/24 h at room temperature | ||
| QC high | 96.0 ± 4.3 | 100.5 ± 6.2 |
| QC low | 89.5 ± 4.7 | 101.1 ± 8.3 |
| Freeze–thaw stability | ||
| QC high | 100.2 ± 1.1 | 99.9 ± 1.5 |
| QC low | 107.3 ± 3.3 | 101.8 ± 9.1 |
| Long‐term stability | ||
| QC high | 93.3 ± 3.1 | 90.8 ± 2.4 |
| QC low | 100.7 ± 2.9 | 110.2 ± 9.6 |
QC, Quality control.
3.2.6. Incurred samples reanalysis
Incurred samples reanalysis (n = 35) resulted in 28 detectable levels for EAI045 and 27 for PIA, as shown in Figure 3. Reanalysis with EAI045 resulted in exceedance of ±20% deviation for two plasma samples (131 and −24%), two liver samples (−27 and 36%), one spleen sample (−30%) and one SIWC sample (65%). For PIA, two plasma samples (123 and −24%), one brain sample (26%), one liver sample (106%) and one spleen sample (138%) exceeded the ±20% deviation. These results could not be explained. The quality of the bioanalytical method was assured anyway because more than 67% of the samples met the 20% deviation requirement (European Medicines Agency, 2011; FDA & CDER, 2018), for both EAI045 (22/28 = 79%) and PIA (20/27 = 74%).
FIGURE 3.

Bland–Altman plots for reanalysis data from seven mouse matrix samples from (a) EAI045 (n = 28) and (b) PIA (n = 27).
3.2.7. Mouse pharmacokinetic study
After successful validation, the new assay was applied for a pilot study; EAI045 and PIA concentrations were analyzed at 4 h after a single oral dose of 20 mg/kg EAI045 to wild‐type mice. Chromatograms of plasma and kidney samples from a single mouse are shown in Figure 4. The profile of the EAI045 concentration–time curve in wild‐type FVB/NRj mice is illustrated in Figure 5. The results show that EAI045 was absorbed very rapidly, with an apparent T max around 5 min. The pharmacokinetic parameters were also calculated for plasma exposure of EAI045 over 4 h (AUC0–4h = 534 ± 273 h·ng/ml), maximal concentration (C max 719 ± 512 ng/ml), plasma half‐life (t 1/2 = 1.36 ± 0.61 h) and apparent oral clearance (CL/F = 38 ± 19 l·h−1·kg−1). However, inter‐individual variation was high, as we often observe shortly after oral drug administration. Unfortunately, the elimination rates could not be obtained owing to there being insufficient data in the elimination period. As shown in the pharmacokinetic curves, a linear elimination phase was not observed. As a consequence, AUC0–∞ could not be calculated. The CL/F could be calculated based on the AUC0–t (as an alternative to the AUC0–∞) owing to the low levels at the latest time point. The CL/F was relatively high, probably owing to the low bioavailability (Jia et al., 2016). Tissue levels decreased in the order SIWC > liver > kidney > lung > spleen > brain (Figure 6a). The EAI045 concentration in the brain was much lower than that in other tissues measured, most likely owing to the presence of the blood–brain barrier.
FIGURE 4.

Chromatograms of (a) EAI045 in plasma (37.0 ng/ml, black trace) and kidney (14.9 ng/ml, red trace) and (b) PIA in plasma (133 ng/ml, black trace) and kidney (30.8 ng/ml, red trace). Signals were given an artificial offset.
FIGURE 5.
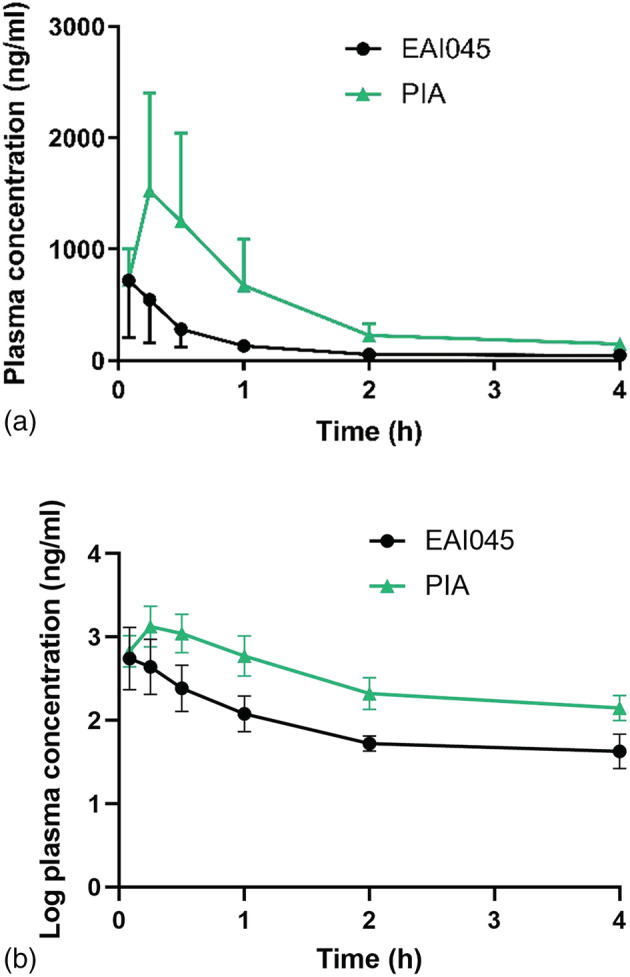
Plasma concentration–time curve (a) and log plasma concentration‐time curve (b) of EAI045 and PIA in wild‐type FVB/NRj mice (n = 5) during 4 h after oral administration of 20 mg/kg EAI045.
FIGURE 6.

Tissue concentration of (a) EAI045 and (b) PIA in wild‐type FVB/NRj mice (n = 5) in six tissues, 4 h after oral administration of 20 mg/kg EAI045.
For PIA, the obtained calculated pharmacokinetic parameters were: T max = 15–30 min, t 1/2 = 1.17 ± 0.21 h, C max = 1,524 ± 876 ng/ml and AUC over 4 h = 1,871 ± 980 h·ng/ml. Within 15 min PIA was more abundant in plasma than the parent drug in all strains, suggesting rapid conversion into this metabolite (Figure 5). This is also reflected by the PIA elimination rate not being slower than the elimination rate of EAI045. Three plasma results in this study slightly exceeded 2,000 ng/ml. Owing to this relatively small exceedance (levels < 2,700 ng/ml) of three out of 30 samples, an extended curve was not considered. The relatively low response of PIA compared with EAI045 ensured that the linearity of the detector was not exceeded. In future studies dilution of this matrix will be considered. The tissue concentration is shown in Figure 6b. Brain penetration was extremely low, with a brain concentration of only 9.8 ng/g, consistent with the negatively charged nature of PIA under physiological conditions. The absolute amount of PIA retrieved from SIWC at this time point was much smaller than that of EAI045 (~0.074 vs ~1.74% of the EAI045 dose, data not shown). Also the distribution of PIA to other tissues was generally much lower than that of the parent compound.
4. CONCLUSIONS
This new bioanalytical assay has successfully been developed and validated to facilitate sensitive quantification of EAI045 and its major metabolite PIA simultaneously. This article is, to our knowledge, the first reporting this metabolite of EAI045 and the first bioanalytical assay for this metabolite together with the parent drug. The analytical run time is shorter compared with earlier developed assays (Lv et al., 2018; Zhang et al., 2020), facilitating higher sample throughput in combination with the 96‐well format used. Moreover, this bioanalytical method includes a fast and easy sample pre‐treatment method using only 10 μl sample volumes. The new LC–MS/MS method was successfully adopted for a pharmacokinetic pilot study in mice and will be applied for future mouse studies.
DECLARATION OF COMPETING INTEREST
The authors declare that they have no known competing financial interests or personal relationships that could have appeared to influence the work reported in this paper.
FUNDING
This research did not receive any specific grant from funding agencies in the public, commercial, or not‐for‐profit sectors.
CREDIT AUTHORSHIP CONTRIBUTION STATEMENT
M. Merve Susam: Methodology, Validation, Formal analysis, Investigation, Writing—original draft, Visualization, Project administration.
Jing Wang: Formal analysis, Investigation, Writing—review & editing, Visualization.
Alfred H. Schinkel: Conceptualization, Resources, Writing—review & editing, Supervision.
Jos H. Beijnen: Conceptualization, Methodology, Resources, Writing—review & editing, Supervision.
Rolf W. Sparidans: Conceptualization, Methodology, Investigation, Resources, Writing—review & editing, Supervision, Project administration.
Susam, M. M. , Wang, J. , Schinkel, A. H. , Beijnen, J. H. , & Sparidans, R. W. (2022). Bioanalytical assay for the quantification of the tyrosine kinase inhibitor EAI045 and its major metabolite PIA in mouse plasma and tissue homogenates using liquid chromatography–tandem mass spectrometry. Biomedical Chromatography, 36(11), e5457. 10.1002/bmc.5457
DATA AVAILABILITY STATEMENT
The data that support the findings of this study are available from the corresponding author upon reasonable request.
REFERENCES
- Brandon, E. F. A. , Van Ooijen, R. D. , Sparidans, R. W. , López Lázaro, L. , Heck, A. J. R. , Beijnen, J. H. , & Schellens, J. H. M. (2005). Structure elucidation of aplidine metabolites formed in vitro by human liver microsomes using triple quadrupole mass spectrometry. Journal of Mass Spectrometry, 40(6), 821–831. 10.1002/jms.863 [DOI] [PubMed] [Google Scholar]
- Dong, R. F. , Zhu, M. L. , Liu, M. M. , Xu, Y. T. , Yuan, L. L. , Bian, J. , Xia, Y. Z. , & Kong, L. Y. (2021). EGFR mutation mediates resistance to EGFR tyrosine kinase inhibitors in NSCLC: From molecular mechanisms to clinical research. In Pharmacological research (Vol. 167). Academic Press. 10.1016/j.phrs.2021.105583 [DOI] [PubMed] [Google Scholar]
- Du, X. , Yang, B. , An, Q. , Assaraf, Y. G. , Cao, X. , & Xia, J. (2021). Acquired resistance to third‐generation EGFR‐TKIs and emerging next‐generation EGFR inhibitors. In Innovation (China). (Vol. 2, issue 2) Cell Press. 10.1016/j.xinn.2021.100103 [DOI] [PMC free article] [PubMed] [Google Scholar]
- European Medicines Agency . (2011). 2** Committee for Medicinal Products for Human Use (CHMP) Guideline on bioanalytical method validation. https://www.ema.europa.eu/contact
- FDA , & CDER . (2018). Bioanalytical Method Validation Guidance for Industry Biopharmaceutics Bioanalytical Method Validation Guidance for Industry Biopharmaceutics Contains Nonbinding Recommendations. http://www.fda.gov/Drugs/GuidanceComplianceRegulatoryInformation/Guidances/default.htmand/orhttp://www.fda.gov/AnimalVeterinary/GuidanceComplianceEnforcement/GuidanceforIndustry/default.htm
- Hao, L. , Guo, L. , Chen, X. , Mo, F. , Tian, S. , & Liu, X. (2019). Development of kilogram‐scale synthesis of EGFR inhibitor EAI045. Organic Process Research and Development, 23(3), 397–402. 10.1021/acs.oprd.8b00276 [DOI] [Google Scholar]
- Jia, Y. , Yun, C. H. , Park, E. , Ercan, D. , Manuia, M. , Juarez, J. , Xu, C. , Rhee, K. , Chen, T. , Zhang, H. , Palakurthi, S. , Jang, J. , Lelais, G. , DiDonato, M. , Bursulaya, B. , Michellys, P. Y. , Epple, R. , Marsilje, T. H. , McNeill, M. , … Eck, M. J. (2016). Overcoming EGFR(T790M) and EGFR(C797S) resistance with mutant‐selective allosteric inhibitors. Nature, 534(7605), 129–132. 10.1038/nature17960 [DOI] [PMC free article] [PubMed] [Google Scholar]
- Lv, H. , Shen, E. , Luo, L. , Xu, Y. , Pan, Y. , Wu, K. , Xing, Z. , Ye, F. , & Zhang, Y. (2018). An UPLC‐MS/MS method for the determination of EAI045 in plasma and tissues and its application to pharmacokinetic and distribution studies in rats. Pharmazie, 73(11), 630–634. 10.1691/ph.2018.8123 [DOI] [PubMed] [Google Scholar]
- Patel, H. , Pawara, R. , & Surana, S. (2018). In‐silico evidences for binding of Glucokinase activators to EGFR C797S to overcome EGFR resistance obstacle with mutant‐selective allosteric inhibition. Computational Biology and Chemistry, 74, 167–189. 10.1016/j.compbiolchem.2018.03.026 [DOI] [PubMed] [Google Scholar]
- Patel, H. M. , Ahmad, I. , Pawara, R. , Shaikh, M. , & Surana, S. (2021). In silico search of triple mutant T790M/C797S allosteric inhibitors to conquer acquired resistance problem in non‐small cell lung cancer (NSCLC): A combined approach of structure‐based virtual screening and molecular dynamics simulation. Journal of Biomolecular Structure and Dynamics, 39(4), 1491–1505. 10.1080/07391102.2020.1734092 [DOI] [PubMed] [Google Scholar]
- Rood, J. J. M. , Schellens, J. H. M. , Beijnen, J. H. , & Sparidans, R. W. (2016). Recent developments in the chromatographic bioanalysis of approved kinase inhibitor drugs in oncology. Journal of Pharmaceutical and Biomedical Analysis, 130, 244–263. 10.1016/j.jpba.2016.06.037 [DOI] [PubMed] [Google Scholar]
- Zhang, Y. , Wu, X. , Zhang, Y. , Li, W. , Liu, T. , Yang, Y. , & Wang, Y. (2020). A validated LC method for the enantiomeric separation of EAI045 on chiral stationary phase. Journal of Chromatographic Science, 58(6), 562–568. 10.1093/chromsci/bmz125 [DOI] [PubMed] [Google Scholar]
Associated Data
This section collects any data citations, data availability statements, or supplementary materials included in this article.
Data Availability Statement
The data that support the findings of this study are available from the corresponding author upon reasonable request.