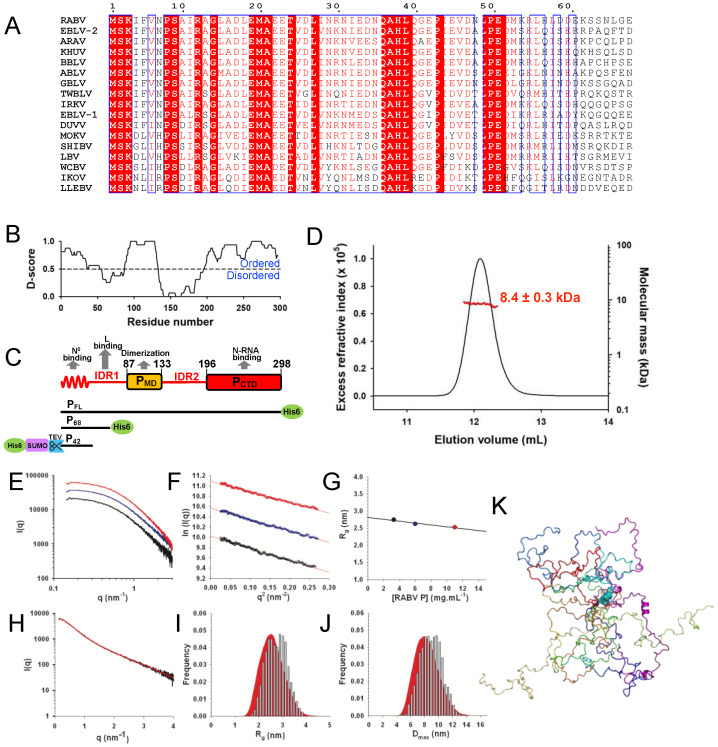
Figure 1.
The N0 chaperone module of RABV phosphoprotein. (A) Multiple sequence alignment of Lyssavirus PNTR region. Members of the Lyssavirus genus and their UniProt accession number: RABV—rabies virus CVS−11 strain P22363, EBLV−1—European bat lyssavirus 1 A4UHP9, EBLV−2—European bat lyssavirus A4UHQ4, ARAV—Aravan virus Q6X1D7, KHUV—Khujand virus Q6X1D3, BBLV—Bokeloh bat lyssavirus U3MZL8, ABLV—Australian bat lyssavirus Q9QSP3, GBLV—Gannoruwa virus A0A1J0RI70, TWBLV—Taiwan bat lyssavirus A0A3P8MNG3, IRKV—Irkut virus Q5VKP5, DUKV—Duvenhage virus O56774, MOKV—Mokola virus P0C569, SHIBV—Shimoni bat virus D4NRJ9, LBV—Lagos bat virus D4NRK4, WCBV—West Caucasian bat virus Q5VKP1, IKOV—Ikoma virus J5JWQ7, LLEBV—Lleida virus A0A1I9RG27. (B) D-score. A consensus disordered prediction (D-score) was calculated as described in [20]. The threshold to distinguish between the ordered and disordered region was arbitrarily set at 0.5. The shaded areas indicate the positions of the known folded dimerization domain (PMD) and NC-binding C-terminal domain (PCTD) (see panel (C)). (C) Schematic representation of RABV phosphoprotein modular organization and constructs. The upper part shows the structural organization of the phosphoprotein. Boxes indicate the localization of folded domains, undulated lines the localization of predicted MoRE and lines the localization of intrinsically disordered regions (IDR 1−2). The grey arrows indicate the location of the regions associated with functions in RNA synthesis. The lower part shows the three constructs of the phosphoprotein used in this study, indicating the position of the tags and cleavage sites. (D) Size exclusion chromatography and multiple-angle laser light scattering (SEC-MALLS) of RABV P68. The elution was monitored on-line using multi-angle laser light scattering and differential refractometry. The line shows the chromatograms monitored using differential refractive index measurements. The red crosses indicate the molecular mass across the elution peak calculated from static light scattering and refractive index, and the numbers indicate the weight-averaged molecular mass (kDa) with standard deviations. (E–K) SAXS experiments and modeling. SAXS profiles recorded at 3.3 mg.mL−1 (in black), 6.0 mg.mL−1 (in blue), and 11.0 mg.mL−1 (in red) are shown in direct plot (E) and Guinier plots (F). (G) Rg values obtained from the Guinier approximation. (H) Merged SAXS curve (in black). The red line shows the fit obtained by the EOM method with an ensemble of 12 conformers (see panels (J,K)). (I) Rg distribution. The shaded area shows the Rg distribution of the initial ensemble. The bars show the Rg distribution of selected ensembles. (J) Dmax distribution. The shaded area shows the Dmax distribution of the initial ensemble. The bars show the Dmax distribution of selected ensembles. (K) Representative ensemble of 12 conformers selected by GAJOE. Each conformer is shown in a different color.

