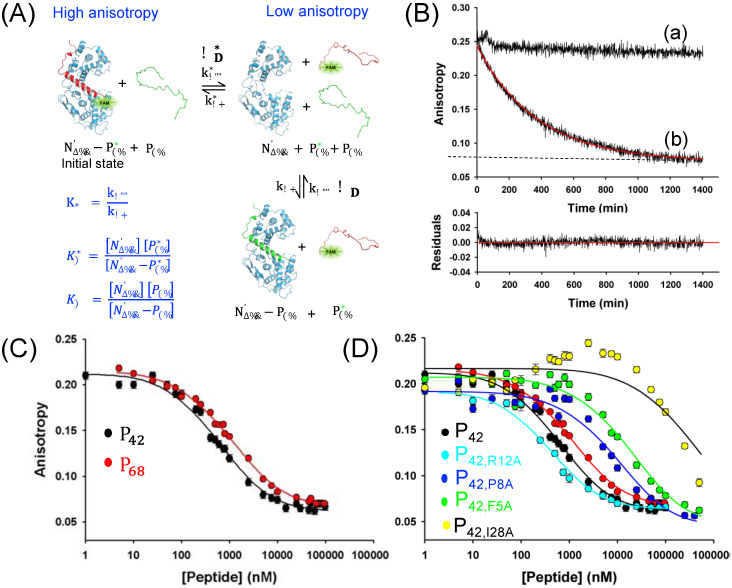
Figure 4.
Competitive binding assay using fluorescence anisotropy. (A) Schematic representation of the competition assay and the mathematical models. (B) Dissociation kinetics; 200 μL of N∆230−P68 at a concentration of 100 nM in 20 mM Tris/HCl pH 7.5, 150 mM NaCl at 20 °C. The upper panel shows the anisotropy variation in the absence (a) and presence (b) of a competing unlabeled peptide. The average anisotropy of P68−FAM alone is indicated by a dotted line. The red line shows the fit obtained with DYNAFIT. The lower panel shows the plot of the residuals for the fit obtained with DYNAFIT and shown in the upper panel. (C) Equilibrium binding curves with WT peptides. The black circles are for P42 and the red circles for P68. The lines show the fits obtained with DYNAFIT and the parameters shown in Table 2. (D) Equilibrium binding curves with mutants. The black circles are for P42 and are shown as reference. The light blue, dark blue, green, and yellow circles are for the mutant R12A, P8A, F5A, and I28A, respectively, and the lines show the fits obtained with DYNAFIT and the parameters shown in Table 2.

