

Abstract
Rationale
The last decade has seen a dramatic increase in the application of serial sampling of human dentine in archaeology. Rapid development in the field has provided many improvements in the methodology, in terms of both time resolution as well as the ability to integrate more isotope systems in the analysis. This study provides a comparison of two common sampling approaches, allowing researchers to select the most suitable approach for addressing specific research questions.
Methods
Two common approaches for sequential sampling of human dentine (micro‐punches and micro‐slices) are compared in terms of viability and efficacy. Using archaeological deciduous second molars and permanent first molars, this study demonstrates how the two approaches capture aspects of the weaning process in different ways. In addition, different aspects related to the extraction protocols, such as the thickness of the central slide and the solubilisation step, are also evaluated.
Results
While both approaches show similar intra‐tooth isotopic patterns, the micro‐punches approach is preferable for research that requires a very fine temporal resolution, while the micro‐slices approach is best for research where δ 34S values are needed, or when the samples are poorly preserved. In addition, the solubilisation step has a large effect on collagen yield, and, to a lesser extent, on isotopic compositions. Therefore, it is important to ensure that only samples that have undergone the same pre‐treatment protocol are directly compared.
Conclusions
We present the pros and cons of the two micro‐sampling approaches and offer possible mitigation strategies to address some of the most important issues related to each approach.
1. INTRODUCTION
Stable isotope analysis is a well‐established method used in archaeology to reconstruct past subsistence behaviours. Recent developments in both sampling techniques and instrumentation have allowed detailed life‐history approaches on incrementally grown tissues, particularly on tooth primary dentine, to obtain fine‐resolution sequential isotope data through micro‐samples. Traditionally, the most commonly analysed isotope systems in primary dentine have been carbon (δ 13C) and nitrogen (δ 15N). Variations in δ 13C and δ 15N values have been used to answer questions such as weaning (in both humans and non‐human mammals), 1 , 2 , 3 mobility and trading, 4 animal husbandry practices, 5 and early physiological stress. 6 New studies have recently demonstrated the potential of including the analysis of sulfur (δ 34S) values in serial approaches to help elucidate childhood mobility patterns and/or feeding practices. 7 , 8 However, the balance between obtaining the optimum temporal resolution and the amount of material to measure carbon, nitrogen, and sulfur isotope systems remains a challenge.
First proposed by Fuller et al, 9 dentine serial sampling has come a long way. In the early days, teeth were divided into broad ‘anatomical regions’: crown, cervix, and root. Only one sample was obtained from each region, rendering a total of three to four samples per tooth. Because of a better understanding of primary dentine growth patterns, together with improvements in instrumentation for stable isotope analysis, it is now possible to take smaller sample sizes (ca 0.3 mg for synchronous C and N isotope analysis, and ca 1.2 mg for synchronous C, N, and S isotope analysis) and a higher number of time‐series measurements (up to 17) from a single adult human tooth. 10 There are now two major approaches for taking serial samples in human dentine: thin horizontal or oblique slices (micro‐slices) cut with a scalpel 6 , 11 , 12 and small cylindrical transects (micro‐punches) using a biopsy punch. 10 , 13 A recent study also proposed the use of a MicroMill‐assisted approach, where up to 65 incremental samples were obtained from a single human tooth. 14 Due to the lack of access to a MicroMill, this approach is not tested here. For the sake of completion, a third approach involving analysing non‐demineralised (untreated) dentine powder is described but not tested.
The purpose of this study is to describe and discuss the pros and cons of these major approaches to serial sampling in primary dentine – i.e. micro‐slices versus micro‐punches – particularly when there is an interest in integrating sulfur isotope analysis. In mammalian bone and dentine collagen, only one amino acid – methionine – contains sulfur, so comparing to the more ubiquitous carbon (ca 42.1 wt%) and nitrogen (ca 15.4 wt%), the amount of sulfur is much lower (ca 0.28 wt%). 15 As a result, sulfur isotope analysis typically requires a much larger amount of material. Integrating sulfur isotope analysis in the serial micro‐sampling of dentine will therefore mean compromising temporal resolution for data from an additional isotope system. In additional to the differences in sampling techniques and sample size requirements, minor variations in the sampling process pertaining to the solubilisation step, which may have a negative impact on small sample sizes, are also tested. The discussions in this study will help researchers to better design and select the sampling strategies that are best suited for their particular archaeological contexts and questions.
2. SAMPLING APPROACHES
2.1. The micro‐slices approach
As an improved variation on the original ‘anatomical regions’ approach, the micro‐slices approach takes horizontal slices of dentine perpendicular to the growth axis. There are several minor alternatives within this methodology, where some studies use the whole tooth, 16 , 17 and some cut the tooth longitudinally into two or more portions and take slices from only part of a tooth. 3 , 11 , 18 , 19 , 20 There are certain benefits and drawbacks to both sub‐approaches. The first difference is the amount of sample acquired. Obviously, a 1 mm micro‐slice from the whole tooth would produce more analytical material than that from half a tooth. However, as serial sampling is a destructive methodology, sampling from half (or part of) a tooth would allow the other half/part to be analysed with other methods (e.g. thin section for microscopy, etc.), or preserved for future studies. Secondly, another important consideration is the number of growth layers traversed in the sampling process. Human primary dentine deposition pattern follows an inward and rootward direction, analogous to truncated cones that progressively increase in convexity towards the apex. 21 Therefore, when sampled transversely, the larger the sample area (i.e. whole tooth versus half tooth) involved, the greater the number of growth layers traversed. Lastly, the direction of dentine growth shifts from mostly crown‐to‐apex in the crown, to almost completely lateral–medial in the roots (Figure 1). This means that micro‐slices cut transversely in the roots will likely contain many growth layers. While technically a tooth that measures 20 mm (after demineralisation) from cusps to apex could produce 20 × 1 mm transverse micro‐slices, the time resolution represented by the last 10 slices would overlap significantly, blurring time resolution and isotope signals, as illustrated in the study of Czermak et al. 20 To somehow solve this issue, there are improved methods using high‐resolution transmission microscopy images as a reference for changing the directions of slicing from horizontal in the crown to about 45° at the root following dentine long‐period increments (i.e. the Andresen lines), therefore minimising cutting across different growth layers. 11 , 20 While the latter approach is able to produce anatomically correct time‐sensitive micro‐slices, it ideally requires the preparation and microscopical examination of a thin section for each sampled tooth, which is extremely time‐consuming and may not be feasible in some research projects.
FIGURE 1.

(A) The demineralised ‘central slide’ of a first molar (T3 – 199) and (B) a schematic drawing of the tooth showing the general direction of dental growth, the three anatomical regions, and their respective estimated growth periods. The growth layers and age estimations are adapted from Czermak et al 22 [Color figure can be viewed at wileyonlinelibrary.com]
2.2. The micro‐punches approach
This method has been described in detail in Fernández‐Crespo et al 10 , 13 and Czermak et al. 22 With this approach, each tooth is cut into three portions longitudinally. Only the central slide is required for micro‐sampling, while the outer parts can be preserved for further analyses. Currently, most published studies using this approach propose a 2 mm thickness for the sampling slides. 10 , 13 , 22 However, this thickness may need to be adjusted depending on multiple factors. For example, in smaller specimens, such as deciduous teeth, a thicker slide, or even up to half a tooth, may be required to obtain sufficient analytical material. 23 Preservation also plays an important role. 24 Generally speaking, samples taken from a thinner slide are more likely coming from discrete growth layers, therefore providing a more precise temporal resolution of the isotopic record. However, samples obtained from a thinner slide will also have a smaller weight. Currently, most mass spectrometers require at least 0.3 mg of collagen to produce reliable isotopic (δ 13C and δ 15N) measurements. Micro‐punches that yield less than 0.3 mg of collagen will therefore have to be combined with preceding/subsequent sample(s), or abandoned altogether, whichever is deemed appropriate according to the location of the micro‐sample(s). This would essentially decrease the temporal resolution. Therefore, instrumental sensitivity, the state of preservation, the size of the tooth, and the time resolution required to answer the research question(s) are all factors that need to be considered when deciding the thickness of the central slide.
After preparing the sampling central slide, it is demineralised following conventional collagen extraction protocols (i.e. dissolution with HCl, possibly combined with a NaOH bath). A biopsy punch is then used to obtain small cylinders of dentine of fixed diameter (depending on the size of the pen, usually between 0.75 and 1.2 mm) from crown to apex (Figure 2C). The small sample size obtained with this approach means that fewer growth lines would be traversed, even in the roots. Thus, micro‐punches tend to provide time series of isotope data with much finer time resolutions than micro‐slices. This approach also has the benefit of not requiring the prior removal of secondary and tertiary dentine or cementum before sampling, as is required for the micro‐slices approach. Secondary and tertiary dentine form at a later date, and therefore can alter the isotope signal for the age assigned. In addition, this approach only takes samples from one half of a central slide (from the cusp of the crown to the apex of the medial root generally, which is longer on average in mandibular molars). The remaining half of the demineralised slide can be kept in a freezer (or lyophilised for long‐term storage) for future studies. Note that the aforementioned MicroMill‐assisted approach 14 follows the same principle as this method, with several minor adjustments, such as sampling after the tooth section is lyophilised (instead of before). With the help of a MicroMill it is possible to get very small samples (0.35 mm diameter × 1 mm depth) from precise locations, gaining extremely fine temporal resolution that it is hard to achieve by manual sampling. Readers interested in that method should refer to the original publication 14 for more details.
FIGURE 2.

Pictures of T6 (BLR19 – M1) at various stages of preparation for serial sampling. (A) Before demineralisation, the tooth is cut into three parts along the longitudinal axis: (i) the buccal slide; (ii) the lingual slide; (iii) the central (sampling) slide. (B) The demineralised middle slide. (C) The thickness of the middle slide shown next to a biopsy pen [Color figure can be viewed at wileyonlinelibrary.com]
2.3. Untreated dentine powder
Both approaches mentioned above demineralise the dentine subsamples, either before or after the micro‐samples are taken, thereby only analysing the organic part of the dentine (i.e. collagen). A third approach describes a rapid method where the dentine is not demineralised but directly measured. This method is described in more detail in the study of Guiry et al. 4 With this method, the tooth is cut in halves longitudinally, and a series of dentine powder samples are collected along the growth axis. The main advantages of this approach are that (a) depending on the preservation of the tooth and the requirements of the mass spectrometer used, as little as 1 mg of dentine powder is needed 25 , 26 and (b) results can be obtained very quickly. However, as the mineral portion of the dentine is not removed, the biggest disadvantage with this approach is that only N isotopes can be analysed. As there is carbon in both the organic and inorganic phases, the δ 13C values measured in untreated dentine would therefore be a mixture from both phases, and cannot be interpreted easily, nor be directly comparable with C isotope measurements from collagen. Meanwhile, the amount of nitrogen in the inorganic phase of dentine is negligible. Therefore, this method is only applicable to studies where the variations in δ 15N values are known to be large and prognostic to the specific research in question, e.g. weaning. Note that while this approach has been primarily applied on animals with larger teeth, 4 , 25 , 26 , 27 one recent study has demonstrated that it can be applied on human material. 28 (This approach is only described here and is not tested in this study.)
2.4. Minor variations concerning collagen solubilisation
An important difference between the micro‐slices and micro‐punches methods, other than the sampling technique, is whether the dentine sample is solubilised. The solubilisation step, or gelatinisation, or the denaturalisation of collagen, mainly serves two purposes: (a) to remove the insoluble fraction, usually via filtration, and (b) to homogenise the sample.
Regarding the first purpose, after demineralisation, there could still be some inorganic residues adhered to and/or entangled in the collagen sample. This is usually a bigger problem with bone rather than dentine, as bone, especially cancellous bone, is more porous and can trap more exogenous substrates. By solubilising collagen, these exogenous substrates, often insoluble, can be separated either using a filter (e.g. Ezee‐FilterTM or ultrafilter) or simply by centrifuging the dissolved collagen prior to the freezing step, and then discarding any visible precipitates (Figure 3).
FIGURE 3.

Unfiltered dentine collagen from the roots of T8 (BLR23 ‐ M1). The sample was solubilised and spun down using a mini‐centrifuge before the lyophilisation step. Note the precipitates collected at the bottom of the lyophilised collagen [Color figure can be viewed at wileyonlinelibrary.com]
The second purpose is particularly relevant for larger samples (i.e. micro‐slices), and for making duplicate measurements. Firstly, collagen that has been directly lyophilised is very hard and can be difficult to cut to precise weight. By contrast, pre‐solubilised collagen is much easier to subsample. Yet more importantly, for incrementally grown tissues such as dentine, simply cutting a micro‐slice into two halves does not necessarily guarantee that the two halves would represent the exact same growth periods and, therefore, have the exact same isotopic compositions. Although published studies have shown relatively small variations in isotopic measurements (within analytical error) between micro‐punch duplicates, 13 , 29 in order to better monitor measurement precision, duplicates should ideally be performed on homogenised samples.
In theory, the solubilisation step should have minimal effect on the isotopic compositions of collagen. Beaumont et al conducted a preliminary test and concluded that solubilised and unsolubilised dentine samples are indeed directly comparable. 30 However, a different study published in the same year reported that the solubilisation and filtration steps can cause differences in the isotopic compositions of (unhomogenised) bone collagen of up to 1.8‰ in δ 13C values and 1.7‰ in δ 15N values. 31 To better understand the implications of this procedure, two further experiments are designed here to test the effect of solubilisation in dentine collagen. Note that this study does not evaluate the demineralisation protocol (i.e. using different molarity of HCl, or EDTA), as it has been discussed elsewhere. 32
3. MATERIALS AND METHODS
In order to minimise variations introduced by different archaeological, taphonomic, and physiological factors, systematic comparisons of the two methods are conducted on the same tooth. Samples are selected on the basis of having corresponding anthropological and archaeological background information available for reference, and with the expectation that data generated may be used for future archaeological interpretation. A total of 17 human teeth and four bones are used in this study. All teeth are reasonably well preserved, with relatively unworn crowns and without visible tooth decay. Thirteen teeth come from the Early Modern site (15th to 17th century CE) of Saint‐Laurent cemetery, Grenoble. 33 , 34 , 35 , 36 Four teeth come from the middle Neolithic (c. 4700–4300 BCE) site of Balloy ‘Les Réaudins’ (BLR) in the Paris Basin region. 37 , 38 Table 1 summarises the sample information of eight teeth (T1–T8), where comparisons of the two serial sampling approaches are conducted. An additional nine teeth (T9–T17) are included for various testing of the solubilisation process. These are loose teeth from the Saint‐Laurent collection, where no individual information can be retrieved. Four faunal bones are also added to test the solubilisation process. These bones come from various contexts: one sheep/goat from BLR, two wild boars from the middle Neolithic site of Vignely ‘La Porte aux Bergers’, and a modern cattle from the Larzac Plateau, France, which is also used as the in‐house collagen standard at LAMPEA, Aix‐Marseille Université.
TABLE 1.
Summary information of all samples used in this study
| Laboratory code | Site | Sample name | Chronology | Period | Sex | Age | Element a | Central slide thickness (mm) |
|---|---|---|---|---|---|---|---|---|
| T1 | Saint‐Laurent | 499 | 15th century | Early Modern | Male | Adult | LLM1 | 2.5 |
| T2 | 1144 | Female | Adult | LLM1 | 2.2 | |||
| T3 | 199 | 17th century | Male | Adult | LRM1 | 2.7 | ||
| T4 | 225 | Female | Adult | LRM1 | 2.0 | |||
| T5 | Balloy ‘les Réaudins’ | BLR19 | c. 4700–4300 BCE | Middle Neolithic | Male | Non‐adult | URdm2 | 2.7 |
| T6 | ULM1 | 2.7 | ||||||
| T7 | BLR23 | Indeterminate | Non‐adult | LRdm2 | 2.7 | |||
| T8 | LRM1 | 2.7 |
LLM1 refers to lower left first molar; LRM1 refers to lower right first molar; URdm2 refers to upper right second deciduous molar; ULM1 refers to upper left first molar; LRdm2 refers to lower right second deciduous molar.
All samples were prepared at the Preparation Laboratory of UMR 7269 LAMPEA, Aix‐en‐Provence (France).
3.1. Micro‐slices versus micro‐punches
Only T1–T8 are used in this experiment. As one of the objectives of this study is to compare the sensitivity of the two sampling techniques (i.e. micro‐slices and micro‐punches) in capturing time‐series life events, the samples selected needed to show clear isotopic variations over time (i.e. weaning process). Therefore, first molars (M1) for all individuals and an additional deciduous second molar (dm2) for two individuals (BLR19 and BLR23), are selected for this test specifically. First molars usually record the first 10 years of life, while deciduous second molars usually record the first 3 years of life. 39 Thus, these teeth allow observations of the breastfeeding/weaning process and its resulting isotopic variations in the individuals analysed.
The teeth were first embedded in a high‐strength gypsum moulding material. Two types of materials were tested: Herculite II and Cantillana (Model Gyps). Both showed adequate tensile strength required for cutting the teeth. However, trace element analysis using an ATTOM ES HR‐ICP‐MS revealed that Cantillana contains a significant amount of strontium, whereas the amount of strontium in Herculite II is negligible. Note that it is very unlikely that strontium in plaster could interfere with the strontium in enamel. However, if strontium isotope analysis is planned, researchers may consider using Herculite II – or any other non‐strontium‐containing plaster – and mixing with deionised water to ensure integrity of the samples. Then, the teeth were sliced lengthwise (buccal–lingual/palatal) into three parts with a Buehler IsoMet® 1000 precision section saw: a buccal 1/3 slide, a central slide, and a lingual/palatal 1/3 slide (Figure 2A). The central slide was cut to intended thickness using the adjustable blade mover on the machine. Note that due to the vibrations of the cutting discs, the resulting central slices were about 5–20% thinner than the intended thickness. The central slides of the Early Modern teeth (T1–T4) were cut into different thicknesses (2.0 to 2.7 mm) to test how a difference in thickness may affect sample yields. Sample yields may restrict the total number of micro‐samples that can be analysed, regardless of the total number of micro‐samples obtained during sampling. The Neolithic teeth (T5–T8) are less well preserved; therefore a 2.7 mm thick central slide was cut to ensure sufficient analytical material could be procured.
The central slides were first demineralised in 0.5 M HCl at 4°C, with acid change every 2–3 days, until all the enamel was dissolved and the dentine was soft. The slides were then placed in 0.1 M NaOH for 30 min at room temperature, followed by 15 min in 0.5 M HCl at room temperature, as described in Czermak et al. 22 The samples were rinsed with at least three washes of deionised water between each chemical treatment. Before sampling, secondary and tertiary dentine was removed with a scalpel.
For each central slide, micro‐punches were taken on one side using a biopsy pen (Uni‐Core™ 1.2 mm), while the rest of the section was sliced up horizontally with a scalpel into micro‐slices of roughly 1 mm in thickness (Figure 4). For the micro‐slices, the roots were not sliced but instead the whole section was taken as the sample. As mentioned above and illustrated in Figure 1, the primary dentine deposition pattern in the roots is more complex than and different from that in the crowns. Therefore, in this study, the whole root is homogenised without being subsectioned. Note that despite not being practiced in this study, the roots can be subsectioned into multiple subsamples and still produce meaningful data from different growth periods. 11 , 20
FIGURE 4.

Sampling of T3. (A) Schematic of the sampling site. P refers to micro‐punches; S refers to micro‐slices. A total of 21 micro‐punches and 11 micro‐slices are obtained from this tooth. (B) The tooth after micro‐punches were taken [Color figure can be viewed at wileyonlinelibrary.com]
Micro‐punches were not solubilised and were lyophilised directly. Micro‐slices were first solubilised in pH 3 water (10−3 M HCl) at 75°C for 48 h, then spun down at 6000 rpm for 1 min using a mini‐centrifuge (Stuart SCF1 Spinner), and lyophilised.
3.2. Solubilisation test 1: collagen yield
Three teeth (T9–11) from Saint‐Laurent, Grenoble, were used in this test. A middle slide from each tooth was obtained following the procedure described above. As the primary goal of this test was to evaluate how sample size may affect collagen yield during the solubilisation process, instead of following the growth lines, the dentine was simply cut into subsamples of various sizes. These subsamples were first directly lyophilised and weighed. Then the same lyophilised samples were solubilised in pH 3 water (10−3 M HCl) at 75°C for 48 h, then lyophilised and weighed again. The post‐solubilised weight of each micro‐slice was compared with that of the pre‐solubilised weight to calculate collagen lost during the solubilisation step. None of the dentine samples from this test were analysed for their isotopic compositions.
3.3. Solubilisation test 2: isotope compositions
Six human teeth (T12–T17) and four animal bones (B1–B4) of various preservation levels were used in this test. For the teeth, only the roots were taken. For the bone samples, a piece of cortical bone weighing 0.5–1 g was obtained from each sample. The surfaces of all samples (both and teeth) were first mechanically cleaned with a burr, then homogenised using a Fritsch Mini‐Mill Pulverisette 23. The homogenised bone/tooth powder was first demineralised following the same protocol as described above. When the samples had fully demineralised, about 1/3 of each sample was transferred using a plastic transfer pipette and lyophilised. The rest of the samples were solubilised in pH 3 water (10−3 M HCl) at 75°C for 48 h, spun down, and lyophilised.
3.4. Analytical methods and instrumentation
Micro‐punch samples (0.27–0.84 mg) were sent to Iso‐Analytical Limited (UK) for C and N isotope analysis. Micro‐slice samples (1.20–1.62 mg) were sent to the Archaeology Isotope Laboratory, Simon Fraser University (Canada) for C, N, and S isotope analysis. For micro‐slices that were too small to be analysed for C, N, and S, the samples were sent to Iso‐Analytical instead for C and N isotope analysis. A number of samples had to be merged when a single sample yielded less than the acceptable analytical weight (i.e. 0.3 mg for micro‐punches and 1.2 mg for micro‐slices). Only samples from the same anatomical regions (i.e. crown, cervix, or root) were combined. To ensure inter‐laboratory comparability of results, measurements were further monitored using the following in‐house laboratory standards: MMSH_REF – cattle bone collagen (δ 13C = −20.96 ± 0.07‰, δ 15N = +4.17 ± 0.08‰, and δ 34S = +1.90 ± 0.33‰); and SFU_SRM‐1 – sea lion (δ 13C = −13.63 ± 0.19‰, δ 15N = +17.45 ± 0.13‰, and δ 34S = +15.64 ± 0.44‰). These in‐house standards were analysed within all analytical sessions to ensure that measurements produced at both laboratories are directly comparable.
Detailed information of analytical instruments and calibration standards used are provided in Supplement S1.
The quality of the collagen is assessed using the following criteria: %collagen between 0.5% and 22% by weight, %C between 15.3% and 47%, %N between 5.5% and 17.3%, %S between 13% and 35%, atomic C/N ratio between 2.9 and 3.6, atomic C/S ratio between 300 and 900, and atomic N/S ratio between 100 and 300. 15 , 40 , 41 , 42 , 43 , 44 However, note that the work of Czermak et al on fluorescence screening of collagen preservation in (unsolubilised) tooth dentine 24 suggests that samples with atomic C/N ratios higher than 3.3 may indicate some degree of collagen decay or degradation. Therefore, cautions are given to interpretating unsolubilised dentine samples (micro‐punches) with C/N ratios between 3.3 and 3.6.
3.5. Statistical methods and data visualisation
All statistical tests are performed using R version 3.6.0 (R Core Team 2019) with RStudio (RStudio Team 2018). Data are visualised using the package ‘ggplot2’ (Wickham 2016) and ‘ggpubr’ (Kassambara 2020). The R script used to generate the plots of this paper is provided in Supplement S2. Due to the small sample size (n < 15) of our samples, the non‐parametric Kruskal–Wallis and Wilcoxon tests are used. Relationships between variables are evaluated using a Pearson correlation test. A 0.05 probability (p ≤ 0.05) is considered significant.
4. RESULTS
4.1. Inter‐laboratory comparability
Table 2 presents a comparison of the three in‐house standards measured at both laboratories. Of the 80 samples analysed at SFU, 55 were analysed in August–September 2021 (Batch 1) and 35 were analysed in February 2022 (Batch 2). While Wilcoxon tests show that the overall measurements from the two laboratories are generally comparable (δ 13C: p casein = 0.97; p MMSH_REF = 0.12; p SRM1 < 0.001; δ 15N: p casein = 0.35; p MMSH_REF = 0.16; p SRM1 = 0.91), the δ 13C values of the check standards from SFU Batch 1 are consistently higher than those from Batch 2 (Table 2; Figure 5). It is noteworthy that most of the sequential dentine samples come from Batch 1, for which the standards had δ 13C values higher than their accepted values by 0.11‰ to 0.27‰ (Table 2; Figure 5). As the main objective of this study is not to interpret the serial dentine data, but instead to compare and evaluate the two serial sampling approaches, these minor differences in measurements may serve to highlight potential issues associated with measuring samples in different laboratories/instruments, as well as comparing measurements of samples that have undergone different pre‐treatment methods (i.e. solubilised or not). The implications of the differences in isotope measurements from the two laboratories are discussed in more detail in the next section. A summary of all the standards analysed is provided in Supplement S1. The detailed results from all runs (standards and samples) are provided in Supplement S3.
TABLE 2.
Comparison of the measurements of in‐house standards between the two laboratories: IsoA refers to samples analysed at Iso‐Analytical; SFU refers to samples analysed at SFU
| Standard | Laboratory | Batch | n | δ 13C | Std | δ 15N | Std | δ 34S | Std |
|---|---|---|---|---|---|---|---|---|---|
| Casein | IsoA | 6 | −27.20 | 0.06 | +5.91 | 0.05 | |||
| SFU | 1 | 8 | −27.10 | 0.14 | +5.97 | 0.07 | +7.65 | 0.23 | |
| 2 | 9 | −27.35 | 0.17 | +5.92 | 0.10 | +7.84 | 0.15 | ||
| SRM_1 | IsoA | 6 | −13.90 | 0.04 | +17.37 | 0.11 | |||
| SFU | 1 | 12 | −13.52 | 0.17 | +17.32 | 0.21 | +15.38 | 0.37 | |
| 2 | 4 | −13.79 | 0.05 | +17.46 | 0.01 | +15.86 | 0.30 | ||
| MMSH_REF | IsoA | 6 | −21.00 | 0.02 | +4.26 | 0.06 | |||
| SFU | 1 | 12 | −20.69 | 0.14 | +4.20 | 0.14 | +2.51 | 0.28 | |
| 2 | 9 | −21.11 | 0.26 | +4.15 | 0.07 | +2.35 | 0.15 |
FIGURE 5.

Comparisons of the δ13C values of the three standards measured at the two laboratories and different analytical sessions. Shaded red areas are the expected values of each respective standard. Post hoc pairwise comparisons are performed using the Wilcoxon test, with the p values of each test shown above the respective pairing [Color figure can be viewed at wileyonlinelibrary.com]
4.2. Micro‐slices versus micro‐punches
A total of 125 micro‐punches and 64 micro‐slices were procured from eight teeth (T1–T8). Note that not all of the samples obtained were analysed, as a number of them yielded collagen below the acceptable threshold for analysis (0.3 mg for C and N analysis and 1.2 mg for C, N, and S analysis); therefore, the number of samples obtained may not be the same as the number of samples measured for each tooth. In addition, the integrity of the dentine collagen matrix can differ strongly within a single tooth. Dentine in the crown tends to be better preserved than the roots, as it is protected by the enamel from the burial environment. Therefore, even though all micro‐punch samples should have the same diameter, the collagen yield can still vary greatly between different anatomical regions. For example, collagen yield from micro‐punches can range from 0.336 (T8_P1) to 0.808 mg (T8_P7) in a single tooth (T8).
As mentioned in Table 1, the Early Modern teeth were cut into four different thicknesses. The thickness of the central slides has little effect on the percentage of sampled micro‐slices that could be analysed.* In addition, at least one micro‐slice from each tooth could be measured in duplicate. However, a slight trend can be observed in the total measurable samples with the micro‐punches approach. As shown in Table 3, the thinnest central slide (T4) produces the highest percentage of micro‐punches with insufficient collagen, while the opposite is observed with the thickest central slide (T3). Total measured micro‐punches refer to the number of micro‐punches being analysed, after combining those with insufficient collagen yield. No correlation test has been conducted on these data, as the sample size is too small. Neither deciduous teeth (T5 and T7) are included in this comparison, as both teeth are missing one or part of a root.
TABLE 3.
Thickness of central slides and total of analysable samples. Note that the total analysed micro‐punches refer to micro‐punches that are >0.3 mg as well as micro‐punches that are <0.3 mg but merged with the next sample
| Tooth | Thickness (mm) | Total micro‐punches obtained | Micro‐punches with <0.3 mg collagen | Micro‐punches with <0.3 mg collagen (%) | Total analysed micro‐punches | Analysed micro‐slices (%) | Total obtained and analysed micro‐slices |
|---|---|---|---|---|---|---|---|
| T1 | 2.5 | 17 | 6 | 35.3 | 14 | 82.4 | 6 |
| T2 | 2.2 | 20 | 8 | 40.0 | 15 | 75.0 | 7 |
| T3 | 2.7 | 21 | 5 | 23.8 | 17 | 81.0 | 11 |
| T4 | 2.0 | 19 | 16 | 84.2 | 11 | 57.9 | 10 |
| T6 | 2.7 | 13 | 0 | 0.0 | 13 | 100.0 | 10 |
| T8 | 2.7 | 12 | 4 | 33.3 | 9 | 75.0 | 6 |
For the samples analysed for serial sampling (samples from T1–T8), all but two analysed samples yielded atomic C/N ratios between 3.1 and 3.3 (Figure 6). Two samples (T1_P16 + 17 and T8_P10 + P11) have atomic C/N ratios of 3.4. As the isotopic measurements from these two samples fit well with the rest of the measurements from the same teeth, they are included in the following analysis. No trend is observed between the weight and the atomic C/N ratios of the samples. However, the smallest samples (0.274–0.314 mg) have the widest spread of C/N ratios.
FIGURE 6.

Weight of samples plotted against their measured atomic C/N ratios. Open circles represent unsolubilised dentine samples; filled circles represent solubilised dentine samples. (A) Samples sent to Iso‐Analytical for CN analysis. (B) Samples sent to SFU for CNS analysis. Blue dash‐dotted lines indicate the theoretical ideal threshold of atomic C/N ratio for quality control at 3.3. Red line in (A) indicates the recommended analytical weight threshold for isotope analysis at 0.3 mg [Color figure can be viewed at wileyonlinelibrary.com]
The analytical results from the micro‐punches versus micro‐slices tests are plotted in Figure 7 (Early Modern teeth: T1–T4) and Figure 8 (Neolithic teeth: T5–T8). A summary of measurements and elemental compositions of the serial samples are provided in Supplement S4.1.
FIGURE 7.

Stable isotope compositions of all four Early Modern teeth (T1–T4). The subsections, indicated by ①, ②, and ③, refer to the three anatomical sections: crown, cervix, and roots, respectively. (A) Stable carbon isotope compositions of micro‐samples plotted against sampling locations, (B) Stable nitrogen isotope compositions of micro‐samples plotted against sampling locations. (C) Stable sulfur isotope compositions of micro‐samples plotted against sampling locations. (D) Images of each tooth post‐demineralisation and prior to sampling [Color figure can be viewed at wileyonlinelibrary.com]
FIGURE 8.

Stable isotope compositions of the four Neolithic teeth (T5–T8). T5 and T6 come from the same individual (BLR19), whereas T7 and T8 come from another individual (BLR23). T5 and T7 are both deciduous second molars (dm2), whereas T6 and T8 are permanent first molars (M1) [Color figure can be viewed at wileyonlinelibrary.com]
As the key objective of this test is to compare the two sampling approaches and not to determine the weaning age, the measurements are plotted against their respective positions within the three anatomical regions, instead of plotting the measurements against estimated age (typical in most archaeological studies). While both plotting schematics are similar, plotting the measurements according to their relative positions within each anatomical region places more emphasis on the sampling location, instead of on age alignment. This also circumvents a debate that concerns the proper age alignment of sequential dentine samples, where several studies have shown that using a ‘fixed’ scale for all individuals (e.g. males and females, healthy and malnourished, archaeological and modern) could be problematic. 45 , 46
The four Early Modern teeth (T1–T4) show varying degrees of intra‐individual variations in isotopic compositions over time. As shown in Figure 7, all individuals have δ 13C and δ 15N values (δ 13C: −19.5 ± 0.5‰; δ 15N: +9.2 ± 0.9‰; 56 micro‐punches and 34 micro‐slices combined) consistent with data reported from the subadults at the site (δ 13C: −19.8 ± 0.4‰; δ 15N: +8.9 ± 1.1‰; n = 51). 36 No S data from the site have been previously published. Based on these four individuals, the δ 34S values are highly variable on an inter‐individual level (means: –4.3‰ (T3) to +8.7‰ (T1); Figure 7C), but with little intra‐individual variability (standard deviations: 0.18‰ (T2) to 0.67‰ (T4); Figure 7C). There is little work done on understanding the S isotope baseline in Early Modern Grenoble; however, as it is not the focus on this study, there will be no further comment on this aspect.
In terms of the measurements from micro‐punches and micro‐slices approaches, both δ 13C and δ 15N values from the two approaches share very similar trends. The micro‐punches approach provides a higher temporal resolution than the micro‐slices, especially towards the root (Figures 7A and 7B). In general, the micro‐slices match well with the micro‐punches but show less variability in δ 13C and δ 15N values. A number of micro‐slice samples have δ 13C values that are slightly higher (ca 0.1–0.3‰) than their comparable micro‐punch samples, which is consistent with the inter‐laboratory differences noted in the check standard measurements (Table 2). It is noteworthy that three micro‐slice samples sent to Iso‐Analytical (too small to be analysed for CNS) also have δ 13C values that closely align with those of the micro‐punches, but again are not a precise match to those of the micro‐punches (Figure 7A). This suggests that inter‐laboratory differences have a larger effect on isotope compositions than different pre‐treatment methods in collagen (i.e. solubilised or not). For the δ 15N values, no isotopic offset can be observed between the two approaches (and two laboratories).
Both Neolithic individuals show ranges of δ 13C, δ 15N, and δ 34S values (δ 13C: −20.7 ± 0.5‰; δ 15N: +12.1 ± 1.5‰; δ 34S: +6.7 ± 1.3‰; 40 micro‐punches and 23 micro‐slices combined) consistent with data reported from the subadults at the site (δ 13C: −21.1 ± 0.5‰; δ 15N: +12.5 ± 1.6‰; δ 34S: +6.2 ± 2.2‰; n = 24). 38 Compared to the Early Modern individuals, these Neolithic individuals show larger intra‐individual variability across all three isotope systems. This is probably due to a weaning process that involves food items with very different isotopic compositions. According to Figure 8, the two individuals (BLR19 and BLR23) have δ 13C, δ 15N, and δ 34S values ranging from −21.7 to −19.3‰, +9.8 to +15.7‰, and +4.1 to +8.6‰, respectively. As expected, the micro‐punches samples provide finer details over the temporal intervals, whereas samples from the micro‐slices provide smoothed‐over averages. In all cases, the data from micro‐punches generally correspond well with those from the micro‐slices, showing similar overall trends.
4.3. Solubilisation test 1: collagen yield
The results are listed in Supplement S4.2 and illustrated in Figure 9. A total of 22 micro‐slices were obtained from three teeth (T9–T11), weighing between 1.3 and 14.6 mg (pre‐solubilisation weight). After solubilisation, all samples lost between 0.5 and 2.3 mg of collagen. The collagen loss of each sample, as expressed in mg (red) and % (black), is plotted in Figure 9. It is shown that while larger samples tend to lose a greater mass, smaller samples lost a greater percentage of sample, with one sample losing up to 55.9% of the collagen after the solubilisation step.
FIGURE 9.

Collagen lost in % (black) and in mg (red) after the solubilisation step. Trend lines shown are logarithmic; shaded areas are the confidence level intervals, set at 0.95 [Color figure can be viewed at wileyonlinelibrary.com]
4.4. Solubilisation test 2: isotope compositions
Curiously, all samples had lower %C and %N than expected, including samples that are known to be very well preserved (detailed elemental concentration is provided in Supplement S3). It is possible that the homogenising process was too aggressive, as noted in several studies that found finely powdered samples tended to produce lower collagen yields than ‘chunk’ samples. 47 , 48 Note that B1 is also the in‐house standard (MMSH_REF) prepared in Aix‐en‐Provence, and B2–B4 had previously been analysed. 38 As the purpose of this experimentation is not to determine the absolute isotopic measurements of these samples, the published data are not presented here as a comparison. However, they are provided in Supplement S4.3 for reference.
The solubilisation step is shown to have some effects on the isotopic compositions in both bone and dentine collagen (Figure 10). In the following, the largest values for measurement accuracy from the two laboratories are used to represent analytical error (details in Supplement S1). As shown in Figure 10A, the solubilisation step appears to cause an increase in the δ 13C values in approximately 70% (12/17) of the paired samples, with 35% (6/17) of the shifts being larger than that of our analytical error (±0.23‰). For δ 15N values, the solubilisation step appears to have opposite effects on bone and dentine collagen, respectively. The process has caused a decrease in δ 15N values for all bone samples, and an increase in δ 15N values for all dentine samples (Figure 10B), with 41% (7/17) of these shifts being larger than our analytical error (±0.13%). Further examination into the effect of solubilisation shows that there is a weak but significant correlation (R = −0.64, p = 0.0059) between changes in δ 13C values (Δ13C) and atomic C/N ratios (ΔC/N_ratio), where an improved atomic C/N ratio is associated with an increase in δ 13C values. No correlation is observed between changes in δ 15N values (Δ15N) and atomic C/N ratios (ΔC/N_ratio).
FIGURE 10.
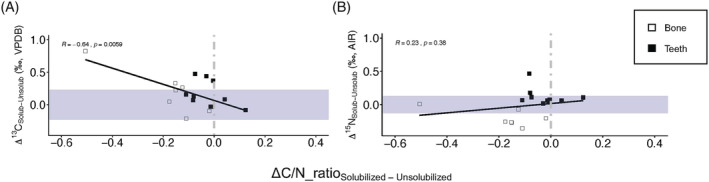
Effect of solubilisation on the isotopic measurements and elemental concentrations of bones and teeth. (A) Net changes in δ 13C values (Δ13C) of tested bone and teeth samples plotted against net changes in the atomic C/N ratios of each tested sample after solubilisation. (B). Net changes in δ 15N values (Δ15N) of tested bone and teeth samples plotted against net changes in the atomic C/N ratios of each tested sample after solubilisation. Shaded areas indicate instrumental analytical errors (±0.23‰ for δ13C and ±0.13‰ for δ15N) [Color figure can be viewed at wileyonlinelibrary.com]
5. DISCUSSION
In the following discussion, the two approaches are evaluated in terms of viability and efficacy. For viability, there are two main aspects that need to be considered: sampling techniques and instrumentation. For well‐preserved samples, the sampling techniques for both approaches are relatively straightforward and require little training. The micro‐punches approach uses a biopsy punch; therefore all samples procured would be consistently of the same diameter throughout. For micro‐slices, our approach relied on a ruler to obtain roughly 1 mm slices with a scalpel. Therefore, it is inevitable that human error/variability will be involved, which will result in small size differences among the micro‐slices. This lack of constraint in sample size, however, also means that the sampling approach can be more flexible, e.g. sample sizes can be increased in instances where there is clearly insufficient sample for a standard‐sized micro‐slice.
For poorly preserved samples and/or samples that have been over‐demineralised, it is harder to obtain micro‐punch samples. The pressure from a biopsy pen can deform poorly preserved collagen, particularly in the roots that are not protected by enamel, making it harder to obtain micro‐samples from a precise location.
Fresh, or well‐preserved, mammalian collagen contains only ca 0.28% S, 15 compared to ca 42% C and ca 15% N, and thus obtaining accurate δ 34S measurements on collagen samples requires larger sample amounts than are typically required for the more routine CN analysis. For example, conventional elemental analysers usually measure S isotopes separately from C and N isotopes and typically require between 6 and 8 mg of collagen, whereas C and N isotope analysis trequires between 0.3 and 1.0 mg of collagen. Improved technology in mass spectrometry in recent years has resulted in a drastic decrease in amount of sample required for S isotope analysis, and it is now possible to analyse C, N, and S isotopes in a single analysis with as little as 1.2 mg of collagen. 49 As of the current date, few laboratories (either commercial or research) are equipped with such instrumentation. Therefore, the access to such instrumentation may be a major impediment to this approach. If time‐series S isotope data are deemed essential to a particular research question, such as in mobility studies, and researchers are unable to access the newer instrumentation required for simultaneous CNS analysis, an alternative solution could be to use one side of the tooth for micro‐punches (CN analysis) and the other half to create larger subsections for S analysis, as demonstrated in the recent study of Rey et al. 8 Note that even with relatively well‐preserved teeth, a 1 mm micro‐slice usually only produces between 1 and 3 mg of collagen, which is still not sufficient for S isotope analysis with conventional elemental analysers. Therefore, a larger micro‐slice may be required. The downside of this approach is that it may not be possible to directly align the δ 34S values with the δ 13C and δ 15N values, as they would have come from different growth layers. The general trend, however, should still be able to provide some interesting insights to the mobility history of the individual. In addition, it is important to note that while there is obvious benefit of performing synchronous CNS analyses of a single, relatively small sample, this analysis does come with the downside of larger precision (±0.18 versus ±0.05‰ for δ 13C and ±0.11 versus ±0.05‰ for δ 15N) and accuracy values (±0.23 versus ±0.14‰ for δ 13C and ±0.13 versus ±0.12‰ for δ 15N) than typically observed for standard NC measurements (see Supplement S1 for more detail).
Since the C and N measurements produced by either approach show generally comparable trends, the measure for efficacy therefore largely depends on the specific archaeological questions and the tooth used for sampling. On the one hand, the biggest advantage of the micro‐punches approach is that it consistently yields a higher number of analysable micro‐samples from distinct growth layers than the micro‐slices approach, regardless of the thickness of the central slice (Table 3). The micro‐slices approach is particularly limited by the direction of growth in the roots and, therefore, is unable to produce as many subsamples (from distinct growth layers) as the micro‐punches approach. Overall, the micro‐punches approach clearly provides a more detailed isotopic record over the entire formation period of the tooth. More particularly, it provides interesting insights into the dietary patterns recorded in the root region that the micro‐slices approach cannot. Note that this issue can be circumvented if multiple teeth are available from the same individual, for example, the crowns and cervixes of M1, M2, and M3 should cover the entire duration of the growth period of M1. However, how to properly perform inter‐tooth age alignment is another topic of contention. 46 Another important point to note is that the micro‐slices approach produces larger micro‐samples (in terms of weight) for analysis, therefore permitting the analysis of δ 34S values and/or duplicated measurements. This approach may even be necessary for only CN analysis in very poorly preserved specimens. Another obvious consideration is analytical resources. If a research project only has funding for 100 CN measurements, for example, researchers would have to decide whether it is better to have serial isotope data from 10 individuals (10 subsamples each) or 5 individuals (20 subsamples each).
Concerning the thickness of the central slide: it impacts temporal resolution less than combining micro‐samples (punches or slices). Therefore, if in doubt, it is better to have a thicker slide to begin with, rather than having to combine micro‐samples later. Unless, of course, there are compelling reasons to conserve material or to use the other part of the tooth for other analyses. Currently, the minimal width of central slide used for serial sampling in published literature is 2.0 mm, 10 , 13 while ongoing work shows it is possible to use a central slide as thin as 1.5 mm.
Finally, regarding the solubilisation step, the results from this case study show that solubilisation can affect collagen in terms of both collagen yields and isotopic compositions. As shown in Figure 9, dentine micro‐samples lost between 16.0% and 55.9% of collagen during the solubilisation process, with the loss being more severe among smaller samples. Therefore, samples that are very small should not be solubilised. In this study, all micro‐slices were solubilised, and micro‐punches were not. Figure 10 illustrates slight but consistent shifts in the C and N isotope compositions of both bone and dentine collagen after solubilisation. Three smaller micro‐slices (<1.0 mg), one from each of T1, T2, and T4, were sent to Iso‐Analytical for C and N analysis. Figure 7A shows that the resulting δ 13C values from these three micro‐slices have relatively depleted δ 13C values comparing to other micro‐slices samples, and as with the other micro‐slices are similar to – but not an exact match with – the micro‐punches. With current data, it is not possible to determine whether this difference was due to (i) inter‐laboratory differences; (ii) different pre‐treatment methods (i.e. solubilised or not); (iii) sampled areas containing different growth layers; or (iv) a combination of the three reasons. While the effects of solubilisation on isotopic compositions are less apparent in dentine than in bone collagen (Figure 10) – presumably bone collagen contains more impurities than dentine collagen – the ‘mismatched’ δ 13C values shown in this example should serve as a cautionary note to researchers intending to directly compare micro‐slices/micro‐punches, solubilised/unsolubilised samples, or samples measured at different laboratories. As demonstrated by our results, it is always preferred that only samples that have undergone the same pre‐treatment and analytical procedures are compared directly. Nevertheless, it is not the main objective of this study to understand why the solubilisation process would cause differences in the isotope compositions of collagen. This observation is only highlighted to alert researchers of its potential implication in data interpretation. If for reasons such as poor preservation, a mixture of micro‐punches and micro‐slices samples must be compared together, researchers should retain a reasonable level of scepticism when interpreting the results, especially for any seemingly out‐of‐place fluctuations.
6. CONCLUSIONS
Serial sampling of dentine collagen is a powerful technique that can help archaeologists to answer many important anthropological and archaeological questions, especially pertaining to lifeways during childhood. In anticipation of more efficient and effective serial sampling techniques being developed in the near future, there are three key considerations for researchers who are deciding between these different approaches – including approaches not tested in this study:
What is the main archaeological question (e.g. weaning or childhood mobility), what is the age range of concern (e.g. early childhood versus middle childhood), what isotope systems are needed (e.g. C, N, and S)?
Preservation status of the tooth/teeth: are they well preserved or not? Other than visual inspections, this can be further tested using various non‐destructive methods such as near‐infrared spectroscopy, 50 fluorescence imaging, 24 and micro‐computed tomography screening and ion beam analysis. 51
Analytical resources: access to instrumentation, funding, time, etc.
Similar to most techniques, there are pros and cons associated with either approach, but with careful mitigations and/or tactful compromises, some cons may be avertible. Table 4 provides a summary of the two approaches tested in this study and suggests potential mitigation strategies to tackle some of the more important issues concerning each approach. Finally, this study has highlighted how different sampling/extraction approaches can cause shifts in isotopic compositions in the micro‐samples. Therefore, for transparency and clarity, it is extremely important for researchers to describe the protocol they used in detail.
TABLE 4.
Summary of the two serial sampling techniques for dentine collagen
| Micro‐punches | Micro‐slices | ||
|---|---|---|---|
| Ideal for: |
|
|
|
| Practical information | Equipment | Sectioning saw and biopsy pens (diameters 0.75–1.2 mm) | Sectioning saw, scalpels, and ruler |
| Sample size requirement | >0.3 mg | Can be as low as 1.2 mg, but ideally 1.4–1.6 mg | |
| No. of micro‐samples | Up to 17 CN measurements in a single tooth (T3) in this study, but can be as high as 25 in ongoing works | Up to 11 CNS measurements in a single tooth (T3) in this study | |
| Issues | Solutions | Issues | Solutions | |
|---|---|---|---|---|
| Potential pitfalls | May need to combine multiple punches in poorly preserved samples |
|
Lower resolution of isotopic profiles, particularly in the root area of a tooth |
|
| Cannot measure δ 34S values synchronously |
|
Potential issue with reproducibility – sample size not uniform |
|
|
| Cannot be solubilised |
|
Can be solubilised or not |
|
PEER REVIEW
The peer review history for this article is available at https://publons.com/publon/10.1002/rcm.9380.
Supporting information
Appendix S1. Calibration and Analytical Uncertainty for Isotopic Measurements
Data S2: R scripts
Appendix S2.1. Results of sample and standard measurments from EA‐IRMS analyses at SFU.
Appendix S2.2. Results of sample and standard measurements from EA‐IRMS analyses at SFU.
Appendix S2.3. Results of sample and standard measurements from EA‐IRMS analyses at IsoAnalytical.
Appendix S3.1. Results of all analysed samples from serial sampling of dentine.
Appendix S3.2. Lost in weight of dentine samples after solubilization.
Appendix S3.3. Results of all analysed samples for the solubilization tests.
ACKNOWLEDGEMENTS
C.C. was supported by the Agence Nationale de la Recherche (projet NEOGENRE ANR‐17‐CE27‐0023, directed by A. Thomas). T.F.‐C. was supported by the European Union’s Horizon 2020 research and innovation programme under Marie Skłodowska‐Curie grant agreement no. 790491 (H2020‐MSCA‐IF‐2017, project WEAPON). The authors thank G. Andre (MMSH), C. Snoeck (AMGC, VUB), and K. Rey (AMGC, VUB) for technical support. We also thank A. Thomas (MNHN), P. Gouge (Centre de la Bassée), and D. Mordant for providing access to the Neolithic samples, and to R. Colardelle (Musée archéologique Saint‐Laurent) for providing access to the early Modern samples.
Cheung C, Fernández‐Crespo T, Mion L, et al. Micro‐punches versus micro‐slices for serial sampling of human dentine: Striking a balance between improved temporal resolution and measuring additional isotope systems. Rapid Commun Mass Spectrom. 2022;36(21):e9380. doi: 10.1002/rcm.9380
ENDNOTE
Even though some micro‐slices may not yield sufficient collagen for CNS analysis, there is always enough for at least CN analysis (0.3 mg). The decision with micro‐slices yielding collagen <1.2 mg, therefore, is whether to merge with other micro‐slices for CNS analysis, or to measure them for CN only. Researchers can make the decision according to their research questions and analytical needs, i.e. whether S measurements are relevant, or if a higher time resolution is preferred.
DATA AVAILABILITY STATEMENT
All data associated with this study is provided in the supplements of this article.
REFERENCES
- 1. Clayton F, Sealy J, Pfeiffer S. Weaning age among foragers at Matjes river rock shelter, South Africa, from stable nitrogen and carbon isotope analyses. Am J Phys Anthropol. 2006;129(2):311‐317. doi: 10.1002/ajpa.20248 [DOI] [PubMed] [Google Scholar]
- 2. Fahy G, Richards M, Fuller B, Deschner T, Hublin J‐J, Boesch C. Stable nitrogen isotope analysis of dentine serial sections elucidates sex differences in weaning patterns of wild chimpanzees (Pan troglodytes). Am J Phys Anthropol. 2014;153(4):635‐642. doi: 10.1002/ajpa.22464 [DOI] [PubMed] [Google Scholar]
- 3. Stantis C, Buckley H, Commendador A, Dudgeon J. Expanding on incremental dentin methodology to investigate childhood and infant feeding practices on Taumako (Southeast Solomon Islands). J Archaeol Sci. 2021;126:105294. doi: 10.1016/j.jas.2020.105294 [DOI] [Google Scholar]
- 4. Guiry E, Hepburn J, Richards M. High‐resolution serial sampling for nitrogen stable isotope analysis of archaeological mammal teeth. J Archaeol Sci. 2016;69:21‐28. doi: 10.1016/j.jas.2016.03.005 [DOI] [Google Scholar]
- 5. Makarewicz C. Winter pasturing practices and variable fodder provisioning detected in nitrogen (δ15N) and carbon (δ13C) isotopes in sheep dentinal collagen. J Archaeol Sci. 2014;41:502‐510. doi: 10.1016/j.jas.2013.09.016 [DOI] [Google Scholar]
- 6. Beaumont J, Montgomery J. The great Irish famine: Identifying starvation in the tissues of victims using stable isotope analysis of bone and incremental dentine collagen. PLoS ONE. 2016;11(8):e0160065. doi: 10.1371/journal.pone.0160065 [DOI] [PMC free article] [PubMed] [Google Scholar]
- 7. Goude G, Dori I, Sparacello V, Starnini E, Varalli A. Multi‐proxy stable isotope analyses of dentine microsections reveal diachronic changes in life history adaptations, mobility, and tuberculosis‐induced wasting in prehistoric Liguria (finale Ligure, Italy, northwestern Mediterranean). Int J Paleopathol. 2020;28:99‐111. doi: 10.1016/j.ijpp.2019.12.007 [DOI] [PubMed] [Google Scholar]
- 8. Rey L, Rottier S, Santos F, Goude G. Sex and age‐related social organization in the Neolithic: A promising survey from the Paris Basin. J Archaeol Sci Rep. 2021;38:103092. doi: 10.1016/j.jasrep.2021.103092 [DOI] [Google Scholar]
- 9. Fuller B, Richards M, Mays S. Stable carbon and nitrogen isotope variations in tooth dentine serial sections from Wharram Percy. J Archaeol Sci. 2003;30(12):1673‐1684. doi: 10.1016/S0305-4403(03)00073-6 [DOI] [Google Scholar]
- 10. Fernández‐Crespo T, Czermak A, Lee‐Thorp J, Schulting R. Infant and childhood diet at the passage tomb of Alto de la Huesera (north‐central Iberia) from bone collagen and sequential dentine isotope composition. Int J Osteoarchaeol. 2018;28(5):542‐551. doi: 10.1002/oa.2659 [DOI] [Google Scholar]
- 11. Lee C, Lin K, Chen J, Czermak A. Dietary history of two human individuals at the Yingpanshan site, Sichuan Province, revealed by carbon and nitrogen isotope analysis of serial samples of dentinal collagen. Int J Osteoarchaeol. 2020;30(4):565‐574. doi: 10.1002/oa.2871 [DOI] [Google Scholar]
- 12. Eerkens J, Sullivan K, Greenwald A. Stable isotope analysis of serial samples of third molars as insight into inter‐ and intra‐individual variation in ancient diet. J Archaeol Sci Rep. 2016;5:656‐663. doi: 10.1016/j.jasrep.2015.11.003 [DOI] [Google Scholar]
- 13. Fernández‐Crespo T, Snoeck C, Ordoño J, et al. Multi‐isotope evidence for the emergence of cultural alterity in late Neolithic Europe. Sci Adv. 2020;6(4):eaay2169. doi: 10.1126/sciadv.aay2169 [DOI] [PMC free article] [PubMed] [Google Scholar]
- 14. Curtis M, Beaumont J, Elamin F, Wilson A, Koon H. Method of micro‐sampling human dentine collagen for stable isotope analysis. Rapid Commun Mass Spectrom. 2022;36(13):e9305. doi: 10.1002/rcm.9305 [DOI] [PMC free article] [PubMed] [Google Scholar]
- 15. Nehlich O, Richards M. Establishing collagen quality criteria for sulphur isotope analysis of archaeological bone collagen. Archaeol Anthropol Sci. 2009;1(1):59‐75. doi: 10.1007/s12520-009-0003-6 [DOI] [Google Scholar]
- 16. Beaumont J, Gledhill A, Lee‐Thorp J, Montgomery J. Childhood diet: A closer examination of the evidence from dental tissues using stable analysis of incremental human dentine. Archaeometry. 2013;55(2):277‐295. doi: 10.1111/j.1475-4754.2012.00682.x [DOI] [Google Scholar]
- 17. Eerkens J, Berget A, Bartelink E. Estimating weaning and early childhood diet from serial micro‐samples of dentin collagen. J Archaeol Sci. 2011;38(11):3101‐3111. doi: 10.1016/j.jas.2011.07.010 [DOI] [Google Scholar]
- 18. Eerkens J, Bartelink E, Bartel J, Johnson P. Isotopic insights into dietary life history, social status, and food sharing in American Samoa. Am Antiq. 2019;84(2):336‐352. doi: 10.1017/aaq.2018.84 [DOI] [Google Scholar]
- 19. Sandberg P, Sponheimer M, Lee‐Thorp J, Van Gerven D. Intra‐tooth stable isotope analysis of dentine: A step toward addressing selective mortality in the reconstruction of life history in the archaeological record. Am J Phys Anthropol. 2014;155(2):281‐293. doi: 10.1002/ajpa.22600 [DOI] [PubMed] [Google Scholar]
- 20. Czermak A, Schermelleh L, Lee‐Thorp J. Imaging‐assisted time‐resolved dentine sampling to track weaning histories. Int J Osteoarchaeol. 2018;28(5):535‐541. doi: 10.1002/oa.2697 [DOI] [Google Scholar]
- 21. Nanci A. Ten Cate's Oral Histology: Development, Structure, and Function. 9th ed. St Louis, MO: Elsevier Inc.; 2008. [Google Scholar]
- 22. Czermak A, Fernández‐Crespo T, Ditchfield P, Lee‐Thorp J. A guide for an anatomically sensitive dentine microsampling and age‐alignment approach for human teeth isotopic sequences. Am J Phys Anthropol. 2020;173(4):776‐783. doi: 10.1002/ajpa.24126 [DOI] [PubMed] [Google Scholar]
- 23. Burt N, Garvie‐Lok S. A new method of dentine microsampling of deciduous teeth for stable isotope ratio analysis. J Archaeol Sci. 2013;40(11):3854‐3864. doi: 10.1016/j.jas.2013.05.022 [DOI] [Google Scholar]
- 24. Czermak A, Schermelleh L, Lee‐Thorp J. Fluorescence screening of collagen preservation in tooth dentine. Palaeogeogr Palaeoclimatol Palaeoecol. 2019;532:109249. doi: 10.1016/j.palaeo.2019.109249 [DOI] [Google Scholar]
- 25. Borrell A, Velásquez Vacca A, Pinela A, et al. Stable isotopes provide insight into population structure and segregation in eastern North Atlantic sperm whales. PLoS ONE. 2013;8(12):e82398. doi: 10.1371/journal.pone.0082398 [DOI] [PMC free article] [PubMed] [Google Scholar]
- 26. Martin C, Bentaleb I, Steelandt S, Guinet C. Stable carbon and nitrogen isotope variations in canine dentine growth layers of Kerguelen southern elephant seals. Mar Ecol Prog Ser. 2011;439:295‐305. doi: 10.3354/meps09331 [DOI] [Google Scholar]
- 27. Hobson K, Sease J. Stable isotope analyses of tooth annuli reveal temporal dietary records: An example using Stellar Sea lions. Mar Mamm Sci. 1998;14(1):116‐129. doi: 10.1111/j.1748-7692.1998.tb00694.x [DOI] [Google Scholar]
- 28. Gutierrez E, Ribot I, Hélie JF. Weaning among Colonists from Montreal and Environs: What Can Nitrogen Isotope Analysis on Dentine Tell Us? Bioarchaeology International. 2021;5(3‐4):124‐142. [Google Scholar]
- 29. Fernández‐Crespo T, Ordoño J, Bogaard A, Llanos A, Schulting R. A snapshot of subsistence in iron age Iberia: The case of La Hoya Village. J Archaeol Sci Rep. 2019;28:102037. doi: 10.1016/j.jasrep.2019.102037 [DOI] [Google Scholar]
- 30. Beaumont J, Gledhill A, Montgomery J. Isotope analysis of incremental human dentine: Towards higher temporal resolution. Bull Int Assoc Paleodont. 2014;8(2):212‐223. [Google Scholar]
- 31. Sealy J, Johnson M, Richards M, Nehlich O. Comparison of two methods of extracting bone collagen for stable carbon and nitrogen isotope analysis: Comparing whole bone demineralization with gelatinization and ultrafiltration. J Archaeol Sci. 2014;47:64‐69. doi: 10.1016/j.jas.2014.04.011 [DOI] [Google Scholar]
- 32. Cersoy S, Zazzo A, Lebon M, Rofes J, Zirah S. Collagen extraction and stable isotope analysis of small vertebrate bones: A comparative approach. Radiocarbon. 2017;59(3):679‐694. doi: 10.1017/RDC.2016.82 [DOI] [Google Scholar]
- 33. Herrscher E, Bocherens H, Valentin F, Colardelle R. Comportements alimentaires au Moyen Âge à Grenoble: Application de la biogéochimie isotopique à la nécropole Saint‐Laurent (XIIIe–XVe siècles, Isère, France). C R Acad Sci III. 2001;324(5):479‐487. doi: 10.1016/S0764-4469(01)01316-6 [DOI] [PubMed] [Google Scholar]
- 34. Herrscher E. Alimentation d'une population historique. Analyse des données isotopiques de la nécropole Saint‐Laurent de Grenoble (XIIIe‐XVe siècle, France). Bull Mém Soc Anthropol Paris. 2003;15(3–4):149‐269. doi: 10.4000/bmsap.550 [DOI] [Google Scholar]
- 35. Jaouen K, Balter V, Herrscher E, Lamboux A, Telouk P, Albarède F. Fe and Cu stable isotopes in archeological human bones and their relationship to sex. Am J Phys Anthropol. 2012;148(3):334‐340. doi: 10.1002/ajpa.22053 [DOI] [PubMed] [Google Scholar]
- 36. Herrscher E. Comportements socioculturels liés à l'allaitement et au sevrage: le cas d'une population grenobloise sous l'Ancien Régime. Annales Fyssen. 2005;20:46‐66. [Google Scholar]
- 37. Mordant D. Le complexe des Réaudins à Balloy: enceinte et nécropole monumentale. In: Constantin C, Mordant D, Simonin D, eds. La culture de Cerny, nouvelle économie, nouvelle société au Néolithique, Actes du colloque international de Nemours, 1994. Vol.6. Mémoires du musée de Préhistoire d'Île‐de‐France; 1997:449‐479. [Google Scholar]
- 38. Cheung C, Herrscher E, Andre G, et al. The grandeur of death – Monuments, societies, and diets in middle Neolithic Paris Basin. J Anthropol Archaeol. 2021;63:101332. doi: 10.1016/j.jaa.2021.101332 [DOI] [Google Scholar]
- 39. AlQahtani S, Hector M, Liversidge H. Brief communication: The London atlas of human tooth development and eruption. Am J Phys Anthropol. 2010;142(3):481‐490. doi: 10.1002/ajpa.21258 [DOI] [PubMed] [Google Scholar]
- 40. Ambrose S. Preparation and characterization of bone and tooth collagen for isotopic analysis. J Archaeol Sci. 1990;17(4):431‐451. doi: 10.1016/0305-4403(90)90007-R [DOI] [Google Scholar]
- 41. Bocherens H, Drucker D, Taubald H. Preservation of bone collagen sulphur isotopic compositions in an Early Holocene river‐bank archaeological site. Palaeogeogr Palaeoclimatol Palaeoecol. 2011;310(1‐2):32‐38. doi: 10.1016/j.palaeo.2011.05.016 [DOI] [Google Scholar]
- 42. Farnsworth P, Brady J, DeNiro M, MacNeish R. A re‐evaluation of the isotopic and archaeological reconstructions of diet in the Tehuacan Valley. Am Antiq. 1985;50(1):102‐116. doi: 10.2307/280636 [DOI] [Google Scholar]
- 43. Harbeck M, Grupe G. Experimental chemical degradation compared to natural diagenetic alteration of collage: Implications for collagen quality indicators for stable isotope analysis. Archaeol Anthropol Sci. 2009;1(1):43‐57. doi: 10.1007/s12520-009-0004-5 [DOI] [Google Scholar]
- 44. van Klinken G. Bone collagen quality indicators for palaeodietary and radiocarbon measurements. J Archaeol Sci. 1999;26(6):687‐695. doi: 10.1006/jasc.1998.0385 [DOI] [Google Scholar]
- 45. McFarlane G, Guatelli‐Steinberg D, Loch C, et al. An inconstant biorhythm: The changing pace of Retzius periodicity in human permanent teeth. Am J Phys Anthropol. 2021;175(1):172‐186. doi: 10.1002/ajpa.24206 [DOI] [PubMed] [Google Scholar]
- 46. Scharlotta I, Goude G, Herrscher E, Bazaliiskii VI, Weber AW. ‘Mind the gap’ – Assessing methods for aligning age determination and growth rate in multi‐molar sequences of dietary isotopic data. Am J Hum Biol. 2018;30(5):e23163. doi: 10.1002/ajhb.23163 [DOI] [PubMed] [Google Scholar]
- 47. Collins M, Galley P. Towards an optimal method of archaeological collagen extraction: The influence of pH and grinding. Ancient Biomolecules. 1998;2:209‐222. [Google Scholar]
- 48. Jørkov M, Heinemeier J, Lynnerup N. Evaluating bone collagen extraction methods for stable isotope analysis in dietary studies. J Archaeol Sci. 2007;34(11):1824‐1829. doi: 10.1016/j.jas.2006.12.020 [DOI] [Google Scholar]
- 49. Sayle K, Brodie C, Cook G, Hamilton W. Sequential measurement of δ15N, δ13C and δ34S values in archaeological bone collagen at the Scottish Universities Environmental Research Centre (SUERC): A new analytical frontier. Rapid Commun Mass Spectrom. 2019;33(15):1258‐1266. doi: 10.1002/rcm.8462 [DOI] [PubMed] [Google Scholar]
- 50. Sponheimer M, Ryder C, Fewlass H, Smith E, Pestle W, Talamo S. Saving old bones: A non‐destructive method for bone collagen prescreening. Sci Rep. 2019;9(1):13928. doi: 10.1038/s41598-019-50443-2 [DOI] [PMC free article] [PubMed] [Google Scholar]
- 51. Beck L, Cuif J, Pichon L, Vaubaillon S, Dambricourt Malassé A, Abel R. Checking collagen preservation in archaeological bone by non‐destructive studies (micro‐CT and IBA). Nucl Instrum Methods Phys Res Sect B. 2012;273:203‐207. doi: 10.1016/j.nimb.2011.07.076 [DOI] [Google Scholar]
Associated Data
This section collects any data citations, data availability statements, or supplementary materials included in this article.
Supplementary Materials
Appendix S1. Calibration and Analytical Uncertainty for Isotopic Measurements
Data S2: R scripts
Appendix S2.1. Results of sample and standard measurments from EA‐IRMS analyses at SFU.
Appendix S2.2. Results of sample and standard measurements from EA‐IRMS analyses at SFU.
Appendix S2.3. Results of sample and standard measurements from EA‐IRMS analyses at IsoAnalytical.
Appendix S3.1. Results of all analysed samples from serial sampling of dentine.
Appendix S3.2. Lost in weight of dentine samples after solubilization.
Appendix S3.3. Results of all analysed samples for the solubilization tests.
Data Availability Statement
All data associated with this study is provided in the supplements of this article.