

Abstract
Background: Cerebrospinal fluid (CSF) platelet‐derived growth factor receptor‐β (PDGFRβ) has been proposed as a biomarker of blood–brain barrier (BBB) breakdown. We studied PDGFRβ levels as a biomarker for cerebral amyloid angiopathy (CAA), amnestic mild cognitive impairment (aMCI), or Alzheimer's disease (AD).
Methods: CSF PDGFRβ levels were quantified by enzyme‐linked immunosorbent assay in patients with CAA, patients with aMCI/AD, and in matched controls. In aMCI/AD we evaluated CSF PDGFRβ both by clinical phenotype and by using the AT(N) biomarker classification system defined by CSF amyloid (A), tau (T), and neurodegeneration (N) biomarkers.
Results: PDGFRβ levels were similar in CAA patients and controls (P = .78) and in aMCI/AD clinical phenotype and controls (P = .91). aMCI/AD patients with an AD+ biomarker profile (A+T+[N+]) had increased PDGFRβ levels compared to (A–T–[N–]) controls (P = .006).
Conclusion: Our findings indicate that PDGFRβ levels are associated with an AD+ biomarker profile but are not a suitable biomarker for CAA or aMCI/AD clinical syndrome.
Keywords: Alzheimer's disease, biomarkers, blood–brain barrier, cerebral amyloid angiopathy, cerebrospinal fluid, pericytes, platelet‐derived growth factor receptor‐β
1. INTRODUCTION
Cerebral amyloid angiopathy (CAA) is characterized by amyloid beta (Aβ) deposition in the adventitia and media of the small arteries and arterioles and in the basement membrane of capillaries, probably due to impaired Aβ clearance. 1 In more advanced cases, the vascular accumulation of Aβ leads to complete degeneration of the mural vascular cells. As a result, the vessel wall weakens, which leads to compromised integrity of the blood–brain barrier (BBB) 2 and to extravasation of blood into the parenchyma in the form of lobar cerebral microbleeds (CMBs) and intracerebral hemorrhages (ICHs). 1 Currently, the diagnosis of CAA during life is based on the modified Boston criteria, 3 using magnetic resonance imaging (MRI) markers of the hemorrhagic manifestations of CAA. However, these are indirect signs of relatively late stages of CAA and they do not provide definitive proof of the disease. Cerebrospinal fluid (CSF) markers may provide an opportunity to identify CAA at an earlier stage and may enable the use of such biomarkers to monitor the progression of cerebral vascular Aβ pathology.
CSF platelet‐derived growth factor receptor‐beta (PDGFRβ) is a potential biomarker for CAA. PDGFRβ has been suggested as a biomarker of pericytes 4 , 5 and cerebral pericytes have a critical role in the maturation and the maintenance of the BBB. 4 In addition, increased PDGFRβ levels in CSF were associated with increased BBB permeability using dynamic contrast‐enhanced MRI (DCE‐MRI) in patients with mild cognitive impairment (MCI). 6 , 7
Also, CSF PDGFRβ concentrations were increased in individuals with MCI (defined as a clinical dementia rating [CDR] score of 0.5), 6 , 7 , 8 , 9 and increased to yet a higher level in dementia patients (CDR of 1.0). 7 , 9 Moreover, increased CSF PDGFRβ levels were observed in participants with an AD+ biomarker profile (defined as abnormal CSF Aβ42, phosphorylated tau [p‐tau], and total tau [t‐tau] levels; cognitive status was unknown) compared to controls without such a biomarker profile. 10
The aim of this study was: (1) to investigate whether CSF PDGFRβ levels are elevated in CAA patients compared to controls, and (2) to verify previously described results on CSF PDGFRβ levels in amnestic MCI (aMCI) patients (CDR 0.5), AD patients with mild dementia (CDR 1.0) and with moderate dementia (CDR 2.0) who were diagnosed according to clinical criteria, and controls (3) to verify CSF PDGFRβ levels in aMCI/AD patients with an AD+ biomarker profile 11 compared to controls without such profile.
2. METHODS
2.1. Western blot
Sodium dodecyl sulfate polyacrylamide gel electrophoresis/western blot analysis was performed to demonstrate the presence and molecular size of PDGFRβ in CSF. See supporting information for a detailed description of the methodology.
2.2. Study populations
We defined a “CAA control group,” for which we included 11 patients with CAA from the Radboud University Medical Center (RUMC), Nijmegen, the Netherlands, and 14 patients with CAA from the Massachusetts General Hospital (MGH), Boston, United States, and 27 controls from the RUMC. Patients could be included if they had a diagnosis of probable or definite CAA based on the modified Boston criteria3 CAA was categorized and patients were assigned to the following groupings of certainty: definite CAA (autopsy confirmed, n = 2), probable CAA with supporting pathology (n = 6), and probable CAA (n = 17; Table 1). Controls all underwent lumbar puncture as part of the diagnostic workup of neurologic symptoms or to exclude central nervous system involvement of a systemic disease. They neither had the suspected neurological disease, nor a neurodegenerative disease, known cognitive impairment, sepsis, a recent stroke (< 6 months), or a malignancy in the central nervous system.
TABLE 1.
Characteristics of the CAA control group
| Controls; n = 27 | CAA; n = 25 | P‐value | |
|---|---|---|---|
| Age (years) | 62.9 ±10.0 | 66.1 ± 10.1 | P = 0.25 a |
| Sex, M/F | 12/15 | 14/11 | P = 0.41 b |
| CSF total protein (mg/mL) | 0.83 [0.78‐1.03] | 0.93 [0.86–1.01] | P = 0.045 c |
| CSF Aβ40 (pg/mL) | 6338 ± 2351 | 3830 ± 1890 | P < 0.0001 a |
| CSF PDGFRβ (ng/mL) | 3.35 ± 0.94 | 3.39 ± 1.10 | P = 0.88 a |
Abbreviation: Aβ40, amyloid beta 40; CAA, cerebral amyloid angiopathy; CSF, cerebrospinal fluid; F, female; M, male; PDGFRβ, platelet‐derived growth factor receptor β.
aStudent's t‐test.
bChi‐square test.
cMann‐Whitney U test.
Unadjusted p values are stated.
Note: Means and standard deviation are depicted for age, CSF Aβ40 levels, and CSF PDGFRβ levels, because they had a Gaussian distribution. Medians and interquartile range are depicted for total protein levels because these had a non‐Gaussian distribution.
HIGHLIGHTS
An amyloid/tau/neurodegeneration–positive (A+T+N+) biomarker profile correlated with significantly higher cerebrospinal fluid (CSF) platelet‐derived growth factor receptor‐β (PDGFRβ) levels.
CSF PDGFRβ levels were similar in cerebral amyloid angiopathy (CAA) patients and controls.
CSF PDGFRβ levels were similar in clinically diagnosed amnestic mild cognitive impairment/Alzheimer's disease patients and controls.
We cannot confirm previous results on PDGFRβ as a biomarker of blood–brain barrier dysfunction.
RESEARCH IN CONTEXT
Systematic review: Cerebrospinal fluid (CSF) platelet‐derived growth factor receptor‐β (PDGFRβ) levels have been described as biomarkers of blood–brain barrier dysfunction and early cognitive decline. We aimed to explore this biomarker potential in a unique population of patients with cerebral amyloid angiopathy (CAA) and of patients with amnestic mild cognitive impairment (aMCI) and Alzheimer's disease (AD).
Interpretation: We found similar CSF PDGFRβ levels in CAA patients versus controls as well as in clinically diagnosed aMCI/AD patients versus controls. However, CSF PDGFRβ was strongly associated with a positive AD biomarker profile in aMCI/AD patients.
Future directions: CSF PDGFRβ as a biomarker of AD pathology should be investigated in more independent laboratories and patient cohorts.
We also defined an “AD control group.” Of these, 19 patients had aMCI (CDR = 0.5), 28 patients had mild dementia (CDR = 1.0), and 12 patients had moderate dementia (CDR = 2.0) and 32 controls, all from the RUMC. Patients could be included if they either had a clinical diagnosis of aMCI at the moment of the lumbar puncture followed by a diagnosis of probable AD in a later stage, or a diagnosis of probable AD. Diagnosis was established during multidisciplinary memory clinic meetings, according to the Petersen 12 and National Institute of Neurological and Communicative Disorders and Stroke–Alzheimer's Disease and Related Disorders Association criteria. 13 The controls fulfilled the criteria as mentioned above. The CDR score 14 was defined by a certified geriatrician after a comprehensive assessment of the patient, including information from a knowledgeable informant. Mini‐Mental State Examination (MMSE) scores 15 were available for all AD patients (Table 2).
TABLE 2.
Patient characteristics, MRI markers, and CSF biomarker levels of the AD control group
| Controls; n = 32 | aMCI (CDR 0.5); n = 19 | AD (CDR 1); n = 28 | AD (CDR 2); n = 12 | P‐value | |
|---|---|---|---|---|---|
| Age (years) | 61 [56‐67] | 72 [70‐78] | 74 [66‐77] | 73 [64‐77] | P < .0001 a |
| Sex, M/F | 15/17 | 7/12 | 8/20 | 3/9 | P = .46 b |
| MMSE score | n.a. | 26 ± 2 | 22 ± 3 | 15 ± 5 | P < .0001 a |
| APOE genotype | n.a. |
ε3/ε3 (n = 3); ε3/ε4 (n = 7); ε4/ε4 (n = 3); n.a. (n = 6) |
ε2/ε4 (n = 1); ε3/ε3 (n = 4); ε3/ε4 (n = 18); ε4/ε4 (n = 3); n.a. (n = 2) |
ε2/ε4 (n = 1); ε3/ε3 (n = 4); ε3/ε4 (n = 6); ε4/ε4 (n = 1) |
P = .64 d |
| CSF total protein (mg/mL) | 0.91 [0.79–.02] | 0.87 [0.79–0.93] | 0.86 [0.79–0.97] | 0.78 [0.73–0.95] | P = .46 c |
| CSF t‐tau (pg/mL) | 267 [179–386] | 504 [419–691] | 661 [468–1060] | 530 [334–874] | P < .0001 c |
| CSF p‐tau (pg/mL) | 47.5 [32.3–56.8] | 91.0 [71.0–114.0] | 98.5 [85.3–130.8] | 85.0 [65.8–106.5] | P < .0001 c |
| CSF Aβ42 (pg/mL) | 864 [664–1142] | 459 [404–516] | 461 [394–538] | 505 [388– 699] | P < .0001 c |
| CSF PDGFRβ (ng/mL) | 3.36 [2.58–3.93] | 3.01 [2.55–3.58] | 3.44 [2.90–4.61] | 2.93 [2.39–3.50] | P = .29 c |
Abbreviations: Aβ42, amyloid beta 42; AD, Alzheimer's disease; APOE, apolipoprotein E; CSF, cerebrospinal fluid; F, female; M, male; MCI, mild cognitive impairment; MMSE, Mini‐Mental State Examination; MRI, magnetic resonance imaging; n.a., not available; PDGFRβ, platelet‐derived growth factor receptor β; p‐tau, phosphorylated tau; t‐tau, total tau.
aAnalysis of variance.
bChi‐square test.
cKruskall‐Wallis test.
dFisher's exact test.
Notes: Means ± standard deviations are reported for MMSE scores, because they had a Gaussian distribution. Medians and interquartile range are depicted for age and CSF biomarkers, because they had a non‐Gaussian distribution. Unadjusted P‐values are stated. Sex was compared using a Chi‐square test.
We categorized this AD‐control group also into “AD biomarker positive” aMCI/AD patients and “AD biomarker negative” controls according to AT(N) criteria, 11 based on predefined cutoff values 16 (CSF Aβ42 [A]+: < 500 pg/mL; CSF phosphorylated tau [T]+: > 85 pg/mL; CSF total tau [N]+: > 350 pg/mL).
2.3. CSF analysis
For all patients and controls CSF was obtained via lumbar puncture and collected in polypropylene tubes, centrifuged 10 minutes at 800 x g, aliquoted, and stored in polypropylene tubes at −80°C.
TABLE 3.
Characteristics of a subset of the AD control group with both CSF and serum available
| Controls; n = 10 | aMCI; n = 13 | AD CDR 1.0; n = 17 | aMCI/AD (all) | P‐value d | |
|---|---|---|---|---|---|
| Age (years) | 63 ± 10 | 72 ± 5 | 71 ± 8 | 71 ± 7 | P = .008 a |
| Sex, M/F | 5/5 | 7/6 | 8/9 | 15/15 | P = 1 b |
| CSF total protein (mg/mL) | 0.92 ± 0.14 | 0.91 ± 0.17 | 0.88 ± 0.11 | 0.89 ± 0.14 | P = .62 a |
| CSF PDGFRβ (ng/mL) |
3.04 [2.44–6.61] |
2.58 [2.43–3.74] |
3.16 [2.86–4.32] |
3.09 [2.54–3.98] |
P = .61 c |
| Serum PDGFRβ (ng/mL) |
30.13 [22.37–41.48] |
34.84 [26.60–37.43] |
35.75 [26.73–41.73] |
34.96 [27.3–39.0] |
P = .59 c |
| Q‐Albumin | 7.26 ± 2.43 | 7.37 ± 2.62 | 6.34 ± 1.94 | 6.79 ± 2.28 | P = .58 a |
| Q‐ PDGFRβ | 105.43 ± 43.35 | 98.66 ± 28.17 | 109.75 ± 31.32 | 104.94 ± 30.01 | P = .97 a |
| PGDFRβ index |
13.32 [9.67–21.17] |
13.94 [9.28–22.63] |
17.49 [12.65–20.83] |
14.39 [11.66–27.82] |
P = .61 c |
Abbreviations: AD, Alzheimer's disease; aMCI, amnestic mild cognitive impairment; CDR, Clinical Dementia Rating; CSF, cerebrospinal fluid; PDGFRβ, platelet‐derived growth factor receptor β; Q‐albumin, CSF/serum albumin ratio; Q‐PDGFRβ, CSF/serum PDGFRβ ratio; PDGFRβ index, Q‐PDGFRβ/Q‐albumin ratio.
aStudent's t‐test.
bChi‐square test.
cMann Whitney U test.
dThis column depicts the P‐value of the comparison between controls and aMCI/AD (all).
Notes: Medians and interquartile range are depicted for CSF PDGFRβ, serum PDGFRβ, and the PDGFRβ index, because they had a non‐Gaussian distribution. Means and standard deviations are depicted for age, CSF total protein, and Q‐albumin, because they had a Gaussian distribution.
We quantified PDGFRβ levels using the Human Total PDGFRβ DuoSet IC enzyme‐linked immunosorbent assay (ELISA; R&D Systems Europe). The ELISA was adapted and validated for quantification of PDGFRβ in CSF and serum. The manufacturers’ instructions were followed, except for the following steps. Standards and patient samples were diluted in 20 mM Tris buffer (pH 7.3), containing 137 mM NaCl, 0.05% Tween‐20, and 0.1% bovine serum albumin. CSF samples were diluted four times. A 2‐fold serial diluted standard curve, ranging from 125 to 8000 pg/mL, was used. The lower limit of quantification was 44.1 pg/mL. The mean intra‐assay coefficient of variation (CV) was 8.4% ± 5.2 and the mean inter‐assay CV was 18.7% ± 2.1 for CSF samples (PDGFRβ concentration range 1,800–4,100 pg/mL). The mean recovery of recombinant protein spiked in CSF was 81 ± 17% and the linearity of dilution was 100% to 125% for 2* to 16* CSF dilutions; these are acceptable results. 17
Total protein levels in CSF were determined using Pierce BCA protein assay kit (Thermo Fisher Scientific).
In all PDGFRβ and total protein CSF analyses, five quality controls were analyzed on each plate to check and correct, when deemed necessary, any variations between plates. These controls consisted of pooled CSF samples that were stored in aliquots at –80°C. For each analysis a fresh aliquot was used.
Aβ42, p‐tau, and t‐tau levels in CSF from the AD control group were analyzed using INNOTEST ELISAs (Fujirebio). Aβ42, p‐tau, and t‐tau levels in CSF from the CAA control group were analyzing using automated versions using a Lumipulse apparatus (Fuijrebio). For the comparison of CSF Aβ40 between CAA patients and controls, we analyzed these levels using an Euroimmun ELISA.
2.4. Serum analysis
For all patients and controls serum was obtained via venipuncture and collected in polypropylene tubes, centrifuged 10 minutes at 800 x g, aliquoted, and stored in polypropylene tubes at −80°C.
We quantified PDGFRβ levels in serum by ELISA as described above for CSF analysis, except that serum samples were diluted 25 times. The mean intra‐assay CV was 2.9 ± 1.7% and the mean inter‐assay CV was 14.4 ± 4.9% for serum samples (PDGFRβ concentration range 26,200–40,500 pg/mL). The mean recovery of recombinant protein spiked in serum was 60 ± 10% and the linearity of dilution was 100% to 125% for 8* to 64* serum dilutions. Apolipoprotein E (APOE) genotyping was performed as described earlier. 18
We studied the relation of PDGFRβ with blood–CSF barrier integrity in a subset of the aMCI/AD patients and controls. Both the CSF/serum albumin ratio (Q‐albumin) and CSF total protein levels are an indicator of the integrity of the blood–CSF barrier. Although Q‐albumin is often interpreted as a marker of BBB disruption, instead it is a reflection of the integrity of the blood–CSF barrier. 19 , 20 , 21 , 22 , 23 We selected 30 aMCI/AD patients and 10 controls for whom paired CSF/serum samples and albumin concentrations in both fluids were available and calculated Q‐albumin (Table 3). To correct for possible transport of PDGFRβ across the blood–CSF barrier, which may be advanced in the case of impaired blood–CSF barrier function, we calculated the PDGFRβ index ([Q‐PDGFRβ: CSF PDGFRβ/serum PDGFRβ]/Q‐albumin).
2.5. MRI analysis
MRI analysis included axial T1 weighted, T2 weighted, coronal fluid attenuated inversion recovery (FLAIR) sequences and either a gradient echo (GRE) T2* weighted or a susceptibility weighted (SWI) sequence. See supporting information for a detailed description.
2.6. Data analysis
The data analysis of this study was done using IBM SPSS for Windows, version 25.0 (IBM Corp) and GraphPad Prism 5.03. If parameters had a Gaussian distribution, parameters were depicted as mean ± standard deviation and group differences were analyzed with a Student's t‐test or an analysis of variance. Otherwise, parameters were stated as medians with interquartile ranges and a Mann‐Whitney U test or a Kruskal‐Wallis test was used. The Shapiro–Wilk test was used to analyze the normality of the data. Sex was analyzed by a Chi‐square test. Global atrophy score (GCA), medial temporal lobe atrophy (MTA) score, and Fazekas scores were compared using Fisher's exact test. Spearman rank correlation was used to evaluate correlation between two variables. We corrected for age and sex by performing multiple regression with age and sex as independent variables. In a second model, we adjusted for age, sex, and total protein levels. PDGFRβ levels were log transformed for the multiple regression analysis when necessary. Statistical outliers were identified using Grubbs’ outlier test (P < .01) and excluded from the multiple regression analysis when appropriate.
To explore potential specific relationships between PDGFRβ and AD pathology, we performed a subgroup analysis of aMCI/AD patients who were “AD biomarker positive” (i.e., A+T+[N]+) compared to “AD biomarker negative” (i.e., A–T–[N]–) controls.
We also performed a subgroup analysis in which we compared CSF PDGFRβ levels from controls without or with only mild white matter hyperintensities (WMH) to aMCI/AD patients with a similar Fazekas score. This was necessary to be able to compare results to previous studies in which patients with neuroimaging signs of neurovascular damage were excluded. 7 , 8 , 9 We defined WMH with no or mild WMH as a Fazekas score 0 or 1, and we pooled six controls from the CAA control group with four from the AD control group to increase group size. Moderate to severe WMH was defined as a Fazekas score of 2 or 3.
2.7. Ethical statement
Lumbar punctures and venipunctures were performed after informed consent from the patients themselves or from the patients’ legal representatives. See supporting information for further details.
3. RESULTS
3.1. PDGFRβ analysis by western blotting
Western blot analysis showed PDGFRβ expression by cultured human brain pericytes (Figure S1A in supporting information). We observed a 190 kDa band, which corresponds to the full length of the protein. Recombinant human PDGFRβ standards (recPDGFRβ) was detected as a band of 150 kDa with a concentration‐dependent intensity, and with a detection limit of 0.25 ng protein (Figure S1B). In CSF, we consistently observed a band stained for PDGFRβ with a molecular weight of 120 kDa (Figure S1B).
3.2. CSF PDGFRβ levels in CAA patients
CSF PDGFRβ levels in patients with CAA (3.39 ± 1.10 ng/mL) were similar to those in controls (3.35 ± 0.94 ng/mL; P = .88, Table 1 and Figure 1A). Adjustment for age and sex (difference in CSF PDGFRβ levels, P = .95), and adding CSF total protein to this analysis did not change the results (P = .67). Furthermore, CSF PDGFRβ levels were similar between CAA patients from RUMC and MGH (P = .87) and between CAA patients and controls from RUMC (P = .87). We found no correlation between CSF PDGFRβ and age (P = .091, spearman rank coefficient [rsp] = 0.218). As expected, Aβ40 levels in CAA patients were lower than in controls (P < .0001, Table 1).
FIGURE 1.
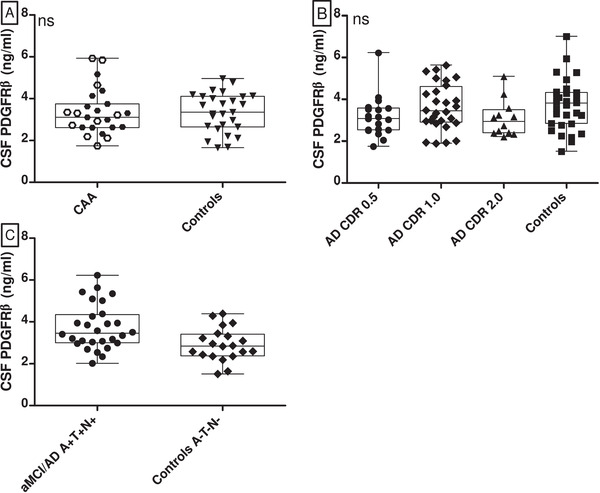
CSF PDGFRβ levels in CAA and aMCI/AD patients compared to controls. Box‐ and scatterplots (depicting median, interquartile range, and range) and scatter plot of CSF PDGFRβ levels in various groups. A, Comparison of CSF PDGFRβ levels in CAA patients versus controls. White hexagons represent CAA patients from RUMC, black hexagons represent CAA patients from MGH. The levels were similar (P = .88). B, CSF PDGFRβ levels in controls, aMCI patients (AD CDR 0.5), AD patients with mild dementia (AD CDR 1.0) and with moderate dementia (AD CDR 2.0). Levels were similar (P = .29). C, PDGFRβ levels in controls with normal AD biomarkers (A–T–[N–]) and aMCI/AD patients with positive AD biomarkers (A+T+[N+]). The PDGFRβ levels differed significantly between groups, P = .006. AD, Alzheimer's disease; aMCI, amnestic mild cognitive impairment; CAA, cerebral amyloid angiopathy; CDR, Clinical Dementia Rating; CSF, cerebrospinal fluid, ns, on‐significant; MGH, Massachusetts General Hospital; PDGFRβ, platelet derived growth factor receptor‐beta; RUMC, Radboud University Medical Center
We found similar CSF PDGFRβ levels in CAA patients with different APOE genotypes (P = .78; Table S1 in supporting information), similar levels in APOE ε4 carriers and APOE ε4 non‐carriers (P = .93), and in APOE ε2 carriers and APOE ε2 non‐carriers (P = .31).
We have categorized the CAA patients according to the number of CMB (n = 2–4, n = 5–25, n = 26–40, n > 40). In each of these subgroups we found similar levels of CSF PDGFRβ ( P = .26). There was neither a correlation between CSF PDGFRβ concentration and the scores on the cortical superficial sideoris (CSS) scale (rSP = 0.24; P = .29), and the number of intracerebral hemorrhages (ICHs) (rSP = 0.04; P = .87), nor between the number of days between the most recent ICH and the time of lumbar puncture (rSP = –0.116; P = .72), or days between most recent MRI and the time of lumbar puncture (rSP = 0.050; P = .84; Table S1).
CSF PDGFRβ correlated with CSF t‐tau levels (rSP = 0.47, P = .007) and CSF p‐tau levels (rSP = 0.51, P = .003), with CSF Aβ42 levels (rSP = 0.401, P = .025) and with CSF Aβ40 levels (rSP = 0.485, P < .0001; Table S1).
3.3. CSF PDGFRβ levels in aMCI/AD patients
CSF PDGFRβ levels were similar in aMCI/AD patients (median 3.16 ng/mL, interquartile range [IQR]: 2.54–3.94) and controls (median 3.36 ng/mL, IQR: 2.58–3.93; P = .91). These levels were also similar when the various disease stages of aMCI/AD (CDR 0.5–1.0–2.0; P = .29) were compared to each other and with controls (Figure 1B, Table 2). Adjusting for age and sex did not change results when comparing CDR 0.5 patients and controls (P = .14), CDR 1.0 patients and controls (P = .98), and CDR 2.0 patients and controls (P = .26). Adding CSF total protein to the analysis did not change results. PDGFRβ weakly correlated with age (rsp = 0.21, P = .046).
aMCI/AD patients who were “AD biomarker positive” (i.e., A+T+[N]+) had higher CSF PDGFRβ levels (mean 3.74 ± 1.08 ng/mL) than “AD biomarker negative” (i.e., A–T–[N]–) controls (mean 2.92 ± 0.79 ng/mL; P = .006; Figure 1C). The difference remained when adjusted for age and sex (P = .01). CSF PDGFRβ correlated with CSF t‐tau levels (rSP = 0.47, P < .0001) and CSF p‐tau levels (rSP = 0.43, P < .0001), but not with CSF Aβ42 levels (rSP = 0.03, P = .776).
CSF PDGFRβ levels were similar in aMCI/AD patients with a Fazekas score of 0/1, in aMCI/AD patients with a Fazekas score of 2/3, and in controls with a Fazekas score of 0/1 (P = .24; Table S2 and Figure S2A in supporting information). Moreover, CSF PDGFRβ levels were similar in aMCI/AD with different CDR scores (0, 0.5, 1.0, or 2.0) and control groups but with a similar Fazekas score of 0 or 1 (P = .76; Table S2 and Figure S2B).
We found similar CSF PDGFRβ levels in aMCI/AD patients with different APOE genotypes (P = .50; Table 2), and similar levels in APOE ε4 carriers and APOE ε4 non‐carriers (P = .41).
3.4. Correlation between PDGFRβ levels and blood–CSF barrier integrity
In the AD control group, CSF PDGFRβ levels correlated with CSF total protein levels (rSP = 0.46, P < .0001, Figure 2A), whereas in the CAA control group, there was no such correlation (rSP = 0.17, P = .22).
FIGURE 2.
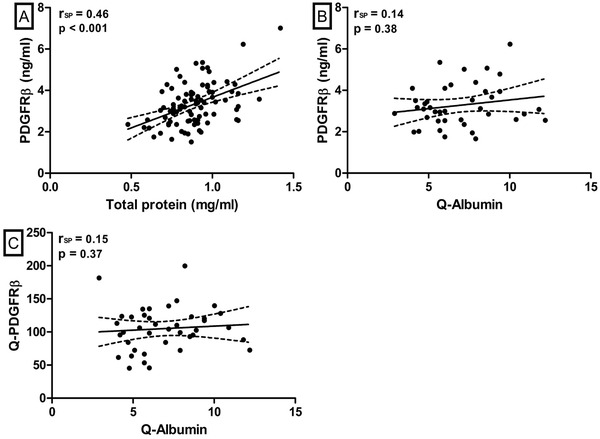
Correlations between CSF PDGFRβ and total protein or the albumin ratio. Scatterplot with regression line and 95% confidence interval of the relation of CSF PDGFRβ and Q‐PDGFRβ with measures of blood–CSF barrier integrity. A, Correlation between CSF PDGFRβ and total protein in the AD control group. Two outliers were removed for visual purposes (they were included in the correlation analysis). B, Correlation of CSF PDGFRβ and the albumin ratio (Q‐Albumin) in the CSF serum subgroup. C, Correlation of Q‐PDGFRβ and Q‐Albumin in the CSF serum subgroup. AD, Alzheimer's disease; CSF, cerebrospinal fluid; PDGFRβ, platelet‐derived growth factor receptor beta; RSP, Spearman correlation coefficient; Q‐Albumin, ratio between CSF and serum albumin; Q‐PDGFRβ, ratio between CSF and serum PDGFRβ
In the subgroup of the AD control group with available CSF and serum, serum PDGFRβ levels were similar in all groups (P = .59), and CSF and serum PDGFRβ levels were correlated (rSP = 0.58, P < .0001). However, neither CSF PDGFRβ levels (rSP = 0.14, P = .38) nor Q‐PDGFRβ (rSP = 0.15, P = .37) correlated with Q‐Albumin (Figure 2B,C). Last, we found a similar PDGFRβ index in the aMCI/AD patients and controls (P = .61).
4. DISCUSSION
This study shows that CSF PDGFRβ levels are neither altered in CAA patients nor in clinically defined aMCI or AD patients. However, CSF PDGFRβ levels are increased in aMCI/AD patients with an “AD biomarker positive” phenotype (i.e., A+T+[N]+). In addition, we found a strong correlation of CSF PDGFRβ levels with both t‐tau and p‐tau levels, but not with Aβ42. CSF PDGFRβ levels did not correlate with Q‐albumin, a marker for blood–CSF barrier integrity.
Our finding that PDGFRβ levels were not increased in CAA patients versus controls is striking because CAA is pre‐eminently associated with BBB dysfunction. 24 , 25 , 26 The accumulation of Aβ as CAA may lead to decreased perivascular Aβ clearance, more Aβ accumulation, Aβ‐associated cellular degeneration, loss of blood vessel function and integrity, and subsequent ischemia and hemorrhagic manifestations including CMBs, cortical superficial siderosis, and large cortical hemorrhages, 3 all reflective of increased BBB dysfunction. 26 , 27 , 28 , 29 In addition, immunohistochemical research has shown that capillary CAA in AD patients is associated with morphologic and possibly physiologic alterations of the neurovascular unit and increased BBB permeability. 24 It was also shown that Aβ leads to degeneration of cultured human brain pericytes. 30 Thus, our findings suggest that although BBB dysfunction is tightly associated with CAA, this is not reflected by increased PDGFRβ levels in CSF. It cannot be excluded, however, that a potential increased release of PDGFRβ in CSF is counterbalanced by pericyte degeneration in CAA patients, leading to a net amount of PDGFRβ in the CSF similar to controls.
CSF PDGFRβ levels were also not associated with clinically diagnosed aMCI or AD. However, CSF PDGFRβ levels were increased in “AD biomarker positive” patients compared to “AD biomarker negative” controls. These results are similar to those previously reported, 10 but are in contrast to other studies in which an increase of PDGFRβ in MCI and mild dementia patients, independent of p‐tau status, was described. 6 , 7 , 8 , 9 Several differences between these studies and ours may contribute to the disparate results. First, we included patients with aMCI and AD dementia, whereas in the published studies patients were included with the more heterogeneous diagnoses “MCI” and mild dementia, but not necessarily with AD‐related MCI or dementia. Second, patients and controls with vascular brain injury were excluded from those studies, as opposed to our study. Therefore, we performed a subgroup analysis limited to those aMCI and AD patients without cerebral small vessel disease, as quantified by WMH score. Here, however, we did not find any evidence that an increased degree of WMH leads to differences in CSF PDGFRβ levels, suggesting that the inclusion of patients with cerebral vascular pathology in our studies, as opposed to previous studies, does not provide an explanation for the discrepant findings. It should be noted, however, that we had a relatively small sample size available for this analysis, because an MRI scan was not available for each patient. Third, unlike previous studies, 6 , 7 we used a sandwich ELISA instead of quantitative western blotting. It cannot be excluded that the use of different quantification methods leads to different results. However, using the same recombinant protein and detection antibody as in these previous western blotting studies we obtained the same sensitivity to detect PDGFRβ, and our western blotting yielded estimates of 8–25 ng/mL PDGFRβ in CSF, which is close to the range of our ELISA results. These results suggest that our quantitative ELISA results are robust. In contrast, in the previous western blotting studies much higher CSF PDGFRβ levels were observed than we (and others) obtained using sandwich immunoassays. 9 , 10 Despite that we aimed for using comparable methodology, we did not detect a band in CSF at the reported molecular weight of > 150 kDa, but instead consistently found an immunoreactive 120 kDa band, likely representing the PDGFRβ ectodomain shed by the metalloproteinase ADAM10. 31 Thus, it cannot be fully excluded that different PDGFRβ species are measured in the different studies.
We found a strong correlation of PDGFRβ levels with both t‐tau and p‐tau levels, but not with Aβ42, suggesting that CSF PDGFRβ is closely related to tau pathology and neurodegeneration, but not to amyloid pathology. There is evidence suggesting that BBB dysfunction is associated with tau pathology in AD, and vice versa, that tau pathology may affect BBB function. 32 , 33 , 34 However, because we found no association of PDGFRβ levels in CSF with the presumed BBB dysfunction in CAA, it remains obscure what causes the relation with tau pathology.
We did not observe an effect of APOE genotype on CSF PDGFRβ levels. The APOE ε4 allele is a major genetic risk factor for AD 35 and APOE ε4 carriers showed exacerbated pericyte loss and BBB breakdown. 36 In line with this association, it was previously demonstrated that CSF PDGFRβ levels are increased in APOE ε4 carriers with no or MCI compared to matched APOE ε3 homozygotes. 8 However, when we stratified our patients into APOE ε4 carriers versus non‐carriers, we could not confirm this difference in CSF PDGFRβ levels neither in CAA patients nor in the MCI/AD patients, although our group sizes were limited.
We also studied the relationship of CSF PDGFRβ with serum PDGFRβ, and with markers of blood–CSF barrier integrity, that is, CSF total protein levels and the CSF/serum albumin ratio (Q‐albumin). 19 , 21 , 22 We made contrasting observations with regard to these correlations: in the AD control group we found a correlation between CSF PDGFRβ and CSF total protein, whereas in the CAA control group we did not find such correlation. Although this discrepancy is difficult to explain, it is in line with previous studies reporting either a positive or absent correlation with Q‐albumin. 6 , 7 , 9 , 10 Furthermore, it is important to note that, although Q‐albumin (and CSF total protein) are often interpreted as a marker for BBB disruption, they are reflections of the blood–CSF barrier instead. 19 , 20 , 21 , 22 , 23 The positive correlation of PDGFRβ with CSF total protein levels in a proportion of our patients could be interpreted as that blood PDGFRβ contributes to the observed CSF levels. In addition, we found a positive correlation between CSF and serum PDGFRβ, which suggests that, at least in part, the CSF PDGFRβ concentration is driven by the serum PDGFRβ concentrations. Using the PDGFRβ index we corrected for potential differences in blood–CSF barrier function; an increased PDGFRβ index in a population would implicate an intrathecal production of PDGFRβ in that specific population. However, our data on the PDGFRβ indices confirmed once more that PDGFRβ levels were not increased in clinically diagnosed aMCI/AD patients, implying that previously reported increases in CSF PDGFRβ may have been driven by an elevated contribution of serum levels of PDGFRβ to the observed CSF concentrations of PDGFRβ, and not by an intrathecal production of PDGFRβ in AD.
A limitation of this study is that we did not have the opportunity to establish BBB breakdown using DCE‐MRI. In addition, our sample sizes were relatively small, although for many of our observations we also did not even observe trends for statistical significance. Furthermore, we did not have SWI or T2* scans available for our control group, so we could not exclude CAA pathology in our controls. However, based on our recent systematic review, 37 we know that the prevalence of probable CAA based on SWI or T2* MRI cognitively normal elderly is approximately 5%, so chances that our findings are biased because of the (undetected) occurrence of CAA in controls are low. However, a strength of our study is the inclusion of aMCI/AD and control subjects with thorough clinical evaluation, for many of whom imaging and AD biomarker data were also available. Moreover, we studied a unique group of CAA patients, a disease specifically associated with BBB dysfunction, to evaluate the validity of CSF PDGFRβ as a possible biomarker for BBB integrity, which we, however, could not demonstrate.
5. CONCLUSIONS
This study demonstrated an increased CSF PDGFRβ level in patients with an AD+ biomarker profile compared to controls without an AD+ biomarker profile, suggesting an association of CSF PDGFRβ levels with tau pathology and neurodegeneration across AD and control patients. However, CSF PDGFRβ levels were not different in clinically diagnosed aMCI, AD, or CAA patients compared to controls. Thus, our results do not confirm previous suggestions by other investigators that CSF PDGFRβ is a biomarker of BBB dysfunction in AD or CAA.
CONFLICTS OF INTEREST
AM de Kort has nothing to disclose. HB Kuiperij has nothing to disclose. I Kersten has nothing to disclose. AAM Versleijen has nothing to disclose. FHBM Schreuder is supported by a senior clinical scientist grant of the Dutch Heart Foundation (grant 2019T060) and has been a speaker of a lecture sponsored by Bristol‐Myers Squibb (February 2021), both paid to institution. WE van Nostrand is supported by the Cerebral amyloid angiopathy fluid biomarkers evaluation (CAFE) project (RO1 NS104147; paid to institution) and the Structural Identification and Functional Consequences of Different Amyloid Strains in Alzheimer's disease project (RO1 AG061775; paid to institution). SM Greenberg has nothing to disclose. CJM Klijn is supported by a clinical established investigator grant of the Dutch Heart Foundation (grant 2012T077); by an ASPASIA grant from The Netherlands Organization for Health Research and Development, ZonMW (grant 015008048); by The Netherlands Cardiovascular Research Initiative, supported by the Dutch Heart Foundation (CVON2015‐01: CONTRAST) and the Brain Foundation Netherlands (HA2015.01.06), all paid to institution. She is data safety monitoring committee member for OPTIMAS (NCT03759938), ENCHANTED2 (NCT04140110), and chair for MOSES (NCT03961334), none with payment. JAHR Claassen was supported by EFRO (PROHEALTH – PROJ‐01003) and NWO (MOCIA), both paid to institution. MM Verbeek was supported by the BIONIC project (no. 733050822, which has been made possible by ZonMW within the framework of “Memorabel,” the research and innovation program for dementia, as part of the Dutch national “Deltaplan for Dementia”: zonmw.nl/dementiaresearch), the CAFE project (the National Institutes of Health, USA, grant number R01 NS104147), and by grants from the Selfridges Group Foundation and Stofwisselkracht, all paid to institution.
Supporting information
Supporting information.
ACKNOWLEDGMENTS
We thank Levi Romanesco for his assistance in rating of the MRIs.
De Kort AM, Kuiperij HB, Kersten I, et al. Normal cerebrospinal fluid concentrations of PDGFRβ in patients with cerebral amyloid angiopathy and Alzheimer's disease. Alzheimer's Dement. 2022;18:1788–1796. 10.1002/alz.12506
Anna M. De Kort and H. Bea Kuiperij contributed equally to this article.
REFERENCES
- 1. Charidimou A, Boulouis G, Gurol ME, et al. Emerging concepts in sporadic cerebral amyloid angiopathy. Brain. 2017;140(7):1829‐1850. [DOI] [PMC free article] [PubMed] [Google Scholar]
- 2. Hultman K, Strickland S, Norris EH. The APOE ε4/ε4 genotype potentiates vascular fibrin(Ogen) deposition in amyloid‐laden vessels in the brains of Alzheimer's disease patients. J Cerebral Blood Flow Metabolism. 2013;33(8):1251‐1258. [DOI] [PMC free article] [PubMed] [Google Scholar]
- 3. Linn J, Halpin A, Demaerel P, et al. Prevalence of superficial siderosis in patients with cerebral amyloid angiopathy. Neurology. 2010;74(17):1346. [DOI] [PMC free article] [PubMed] [Google Scholar]
- 4. Armulik A, Genové G, Betsholtz C. Pericytes: developmental, physiological, and pathological perspectives, problems, and promises. Developmental Cell. 2011;21(2):193‐215. [DOI] [PubMed] [Google Scholar]
- 5. Craggs LJ, Fenwick R, Oakley AE, Ihara M, Kalaria RN. Immunolocalization of platelet‐derived growth factor receptor‐beta (PDGFR‐beta) and pericytes in cerebral autosomal dominant arteriopathy with subcortical infarcts and leukoencephalopathy (CADASIL). Neuropathol Applied neurobiology. 2015;41(4):557‐570. [DOI] [PMC free article] [PubMed] [Google Scholar]
- 6. Montagne A, Barnes Samuel R, Sweeney Melanie D, et al. Blood‐Brain barrier breakdown in the aging human hippocampus. Neuron. 2015;85(2):296‐302. [DOI] [PMC free article] [PubMed] [Google Scholar]
- 7. Nation DA, Sweeney MD, Montagne A, et al. Blood‐brain barrier breakdown is an early biomarker of human cognitive dysfunction. Nat Medi. 2019;25(2):270‐276. [DOI] [PMC free article] [PubMed] [Google Scholar]
- 8. Montagne A, Nation DA, Sagare AP, et al. APOE4 leads to blood–brain barrier dysfunction predicting cognitive decline. Nature. 2020;581(7806):71‐76. [DOI] [PMC free article] [PubMed] [Google Scholar]
- 9. Sweeney MD, Sagare AP, Pachicano M, et al. A novel sensitive assay for detection of a biomarker of pericyte injury in cerebrospinal fluid. Alzheimer's. Dement. 2020;6(16):821‐830. [DOI] [PMC free article] [PubMed] [Google Scholar]
- 10. Miners J, Kehoe SPG, Love S, Zetterberg H, Blennow K. CSF evidence of pericyte damage in Alzheimer's disease is associated with markers of blood‐brain barrier dysfunction and disease pathology. Alzheimer's Res Ther. 2019;11(1):1. [DOI] [PMC free article] [PubMed] [Google Scholar]
- 11. Jack CR Jr, Bennett DA, Blennow K, et al. NIA‐AA research framework: toward a biological definition of Alzheimer's disease. Alzheimers Dementia. 2018;14(4):535‐562. [DOI] [PMC free article] [PubMed] [Google Scholar]
- 12. Petersen RC. Mild cognitive impairment as a diagnostic entity. J Intern Med. 2004;256(3):183‐194. [DOI] [PubMed] [Google Scholar]
- 13. McKhann G, Drachman D, Folstein M, Katzman R, Price D, Stadlan EM. Clinical diagnosis of Alzheimer's disease: report of the NINCDS‐ADRDA work group under the auspices of department of health and human services task force on Alzheimer's disease. Neurology. 1984;34(7):939‐944. [DOI] [PubMed] [Google Scholar]
- 14. Morris JCJ. The clinical dementia rating (CDR): current version and scoring rules. Neurology. 1993;43(11):2412. [DOI] [PubMed] [Google Scholar]
- 15. Folstein MF, Folstein SE, McHugh PR. Mini‐mental state”: a practical method for grading the cognitive state of patients for the clinician. J Psychiatric Res. 1975;12(3):189‐198. [DOI] [PubMed] [Google Scholar]
- 16. Vos SJB, Visser PJ, Verhey F, et al. Variability of CSF Alzheimer's disease biomarkers: implications for clinical practice. PLoS One. 2014;9(6):e100784‐e. [DOI] [PMC free article] [PubMed] [Google Scholar]
- 17. Andreasson U, Perret‐Liaudet A, van Waalwijk van Doorn LJC, et al. A practical guide to immunoassay method validation. Front Neurol. 2015;6:179. [DOI] [PMC free article] [PubMed] [Google Scholar]
- 18. Wilhelmus MM, Otte‐Höller I, Davis J, Van Nostrand WE, de Waal RM, Verbeek MM. Apolipoprotein E genotype regulates amyloid‐beta cytotoxicity. J Neurosci. 2005;25(14):3621‐3627. [DOI] [PMC free article] [PubMed] [Google Scholar]
- 19. Reiber H, Peter JB. Cerebrospinal fluid analysis: disease‐related data patterns and evaluation programs. J Neurol Sci. 2001;184(2):101‐122. [DOI] [PubMed] [Google Scholar]
- 20. Reiber H. Flow rate of cerebrospinal fluid (CSF)–a concept common to normal blood‐CSF barrier function and to dysfunction in neurological diseases. J Neurol Sci. 1994;122(2):189‐203. [DOI] [PubMed] [Google Scholar]
- 21. Deisenhammer F, Bartos A, Egg R, et al. Guidelines on routine cerebrospinal fluid analysis. Report from an EFNS task force. Eur J Neurolo. 2006;13(9):913‐922. [DOI] [PubMed] [Google Scholar]
- 22. Andersson M, Alvarez‐Cermeño J, Bernardi G, et al. Cerebrospinal fluid in the diagnosis of multiple sclerosis: a consensus report. J Neurol Neurosurge Psychiatr. 1994;57(8):897‐902. [DOI] [PMC free article] [PubMed] [Google Scholar]
- 23. Farrall AJ, Wardlaw JM. Blood–brain barrier: ageing and microvascular disease – systematic review and meta‐analysis. Neurobiol Aging. 2009;30(3):337‐352. [DOI] [PubMed] [Google Scholar]
- 24. Magaki S, Tang Z, Tung S, et al. The effects of cerebral amyloid angiopathy on integrity of the blood‐brain barrier. Neurobiol Aging. 2018;70:70‐77. [DOI] [PMC free article] [PubMed] [Google Scholar]
- 25. del Valle J, Duran‐Vilaregut J, Manich G, et al. Cerebral amyloid angiopathy, blood‐brain barrier disruption and amyloid accumulation in SAMP8 mice. Neuro‐degenerative Dis. 2011;8(6):421‐429. [DOI] [PubMed] [Google Scholar]
- 26. Freeze WM, Bacskai BJ, Frosch MP, et al. Blood‐Brain barrier leakage and microvascular lesions in cerebral amyloid angiopathy. Stroke. 2019;50(2):328‐335. [DOI] [PMC free article] [PubMed] [Google Scholar]
- 27. Freeze WM, Jacobs HIL, Schreuder F, et al. Blood‐Brain barrier dysfunction in small vessel disease related intracerebral hemorrhage. Front Neurol. 2018;9:926. [DOI] [PMC free article] [PubMed] [Google Scholar]
- 28. Jolink WMT, Lindenholz A, van Etten ES, et al. Contrast leakage distant from the hematoma in patients with spontaneous ICH: a 7 T MRI study. J Cerebral Blood Flow Metabol. 2019. 0271678×19852876. [DOI] [PMC free article] [PubMed] [Google Scholar]
- 29. van Nieuwenhuizen KM, Hendrikse J, Klijn CJM. New microbleed after blood–brain barrier leakage in intracerebral haemorrhage. BMJ Case Reports. 2017;2017. bcr‐2016‐218794. [DOI] [PMC free article] [PubMed] [Google Scholar]
- 30. Verbeek MM, De Waal RMW, Schipper JJ, Van Nostrand WE. Rapid degeneration of cultured human brain pericytes by amyloid β protein. J Neurochem. 1997;68(3):1135‐1141. [DOI] [PubMed] [Google Scholar]
- 31. Mendelson K, Swendeman S, Saftig P, Blobel CP. Stimulation of platelet‐derived growth factor receptor beta (PDGFRbeta) activates ADAM17 and promotes metalloproteinase‐dependent cross‐talk between the PDGFRbeta and epidermal growth factor receptor (EGFR) signaling pathways. J Biol Chem. 2010;285(32):25024‐25032. [DOI] [PMC free article] [PubMed] [Google Scholar]
- 32. Cai Z, Qiao PF, Wan CQ, Cai M, Zhou NK, Li Q. Role of blood‐brain barrier in Alzheimer's disease. J Alzheimer's Dis. 2018;63(4):1223‐1234. [DOI] [PubMed] [Google Scholar]
- 33. Sagare AP, Bell RD, Zhao Z, et al. Pericyte loss influences Alzheimer‐like neurodegeneration in mice. Nat Communicat. 2013;4:2932. [DOI] [PMC free article] [PubMed] [Google Scholar] [Retracted]
- 34. Liu C‐C, Yamazaki Y, Heckman MG, et al. Tau and apolipoprotein E modulate cerebrovascular tight junction integrity independent of cerebral amyloid angiopathy in Alzheimer's disease. Alzheimer's Dement. 2020;16(10):1372‐1383. [DOI] [PMC free article] [PubMed] [Google Scholar]
- 35. Castellano JM, Kim J, Stewart FR, et al. Human apoE Isoforms differentially regulate brain amyloid‐β peptide clearance. Scie Translat Med. 2011;3(89):89ra57‐89ra57. [DOI] [PMC free article] [PubMed] [Google Scholar]
- 36. Riphagen JM, Ramakers IHGM, Freeze WM, et al. Linking APOE‐ε4, blood‐brain barrier dysfunction, and inflammation to Alzheimer's pathology. Neurobiol Aging. 2020;85:96‐103. [DOI] [PubMed] [Google Scholar]
- 37. Jäkel L, De Kort AM, Klijn CJM, Schreuder F, Verbeek MM. Prevalence of cerebral amyloid angiopathy: a systematic review and meta‐analysis. Alzheimer's Dement. 2022;18:10‐28. [DOI] [PMC free article] [PubMed] [Google Scholar]
Associated Data
This section collects any data citations, data availability statements, or supplementary materials included in this article.
Supplementary Materials
Supporting information.