



Abstract
Rationale
Cassava production faces challenges in a changing climate. Pulse labelling cassava with 13C‐CO2 has the potential to elucidate carbon allocation mechanisms of cassava under drought stress and with potassium application. Understanding these mechanisms could guide efforts to mitigate effects of drought in cassava cropping systems.
Methods
Forty‐eight cassava plants received a nutrient solution high or low in potassium. Water deficit was imposed on half of the plants at bulk root initiation stage, after which they were labelled for 8 h with 13C‐CO2 in a 15 m3 growth chamber. Plants were harvested 8 h, 9 days and 24 days after labelling, and separated into leaves, stems and roots. δ13C values of the different parts were measured using an isotope ratio mass spectrometer, from which 13C excess was calculated.
Results
Water deficit decreased transpiration (P < 0.001) and increased carbon respiration (P < 0.05). Potassium application increased assimilate distribution to the roots (P < 0.05) at 9 days after labelling, more strongly for plants under water deficit. The opposite was found at 24 days (P < 0.05) with the legacy of water deficit additionally increasing assimilate distribution to roots (P < 0.05). Youngest, fully expanded leaves contained up to 47% of initial 13C excess at 24 days after labelling.
Conclusions
Pulse labelling proved to be successful in shedding light on carbon allocation in relation to water and potassium availability. This technique, once adapted to field conditions, could further be used to improve fertilizer recommendations or change agronomic practices to cope with plant stress.
1. INTRODUCTION
Cassava (Manihot esculenta Crantz) is a staple crop for over an estimated 800 million people in the tropics. Although it is commonly known for its starchy roots, the leaves are a good nutritional source and are also widely consumed. 1 In 2020, the global cassava production totalled 302 million t of fresh cassava roots, making it the fifth‐most important staple crop, after maize, wheat, rice and potatoes. The top three producers are Nigeria, the Democratic Republic of the Congo (DRC) and Thailand with 20%, 14% and 10% of the world production, respectively. 2
It is predicted that in the east of the DRC, one of the important cassava‐growing regions, drought spells will occur more frequently because of climate change. 3 Even though climate change is expected to lead to suitability increases of up to 20% for cassava production in most of sub‐Saharan Africa, 4 , 5 , 6 the predicted increase in the frequency of drought spells will negatively affect cassava production. Yield reductions caused by water deficits have been found to range from 9% to 62%, 7 , 8 , 9 , 10 , 11 , 12 being the most severe when the deficit occurs in the first 5 months after planting 8 , 9 and especially during the initiation of storage root bulking. 11 Overall, with a growing population and increased risks of yield losses, the region is facing a challenging food security in the future.
Cassava root yield is strongly determined by source–sink interactions. Sugars are produced in the fully developed leaves (source), after which they are loaded onto the phloem (transport) and stored or used in roots, stems and growing tissues (sinks). Improving source–sink interactions will improve storage root yield. 13 , 14 Drought can alter these source–sink interactions by affecting the source (e.g., decreased stomatal conductance and CO2 uptake decrease photosynthesis 15 ), transport (e.g., increased phloem viscosity or turgor loss obstruct transport 16 ) and the sinks (e.g., storage organs can turn into sources of carbohydrates for growing tissues 17 , 18 ). As a drought stress coping mechanism, cassava stems have been observed to act as an intermediate storage organ, remobilizing starch during periods of water deficit. 19 Connor et al (1981) 7 showed that under water deficit, the proportion of assimilates routed to the roots increased. Sustained root growth and thus allocation of assimilates to roots under dry conditions was also noted as a favourable trait for increased cassava production under water stressed conditions. 20
To mitigate the effects of drought on yields, potassium application has been proposed. 21 , 22 Potassium plays a key role in processes such as stomatal regulation, CO2 fixation, phloem transport of sugars, activation of enzymes in starch synthesis, maintenance of turgor and osmotic regulation. 22 In cassava, potassium was found to act as a major osmolyte for osmotic adjustment during water deficit, contributing to up to 60% of the osmotic potential. 23 Furthermore, water use efficiency was increased by adequate potassium application of field‐grown cassava. 24 In a greenhouse trial, Wasonga et al 25 found that potassium application increased net photosynthesis by influencing stomatal conductance as well as chlorophyll content. Potassium lowered leaf sugar and starch concentrations, which was proposed as a result from a faster translocation from source to sink. 26
The allocation of assimilates in cassava plants has previously been described by mass distributions, simply comparing the weight of the different plant parts. The distribution was found to depend strongly on the growth stage, 9 , 27 , 28 as well as on the variety 29 , 30 , 31 and growing conditions. 25 , 31 , 32 , 33 In the first months after planting, until bulk root initiation, most of the assimilates are distributed on the above‐ground biomass, mainly into the leaves, 9 , 31 , 33 whereas the sink strength of the roots increases from bulk root initiation till harvest. 9 , 27
Even though mass distributions can be a good tool to identify how water deficit and potassium application influence assimilate allocation, the technique falls short in understanding physiological processes that take place at shorter time scales (from hours to days) 34 and in detecting smaller fluxes. 35 Such an understanding is essential to reveal stress mechanisms on younger plants. Knowledge of stress mechanisms in young plants could help avoid long waiting times until full root development at harvest and thus reduce cost of trials and experiments for variety selection or improve agronomic practices. 36 A proposed approach for assessing these physiological processes is pulse labelling, through stable or radioactive carbon isotopes, such as 13C, 14C or the less commonly used 11C. Typically, a pulse of CO2, enriched with one of these isotopes, is supplied to the plants in a closed environment, such as a growth chamber. The assimilated carbon can then be traced by analysing the concentration and isotopic ratio of the plant tissue above and below ground. Pulse labelling has previously been used to assess the distribution of assimilates for various crops. 37 , 38 , 39 , 40 , 41 , 42 , 43 , 44 , 45 , 46 For root and tuber crops, we found papers describing the effect of assimilate distribution in sweet potato under drought, showing a decrease in assimilation as well as a decrease in carbon allocation to the tubers under drought. 37 , 46 For potato, it was found that heat stress lowered assimilate export from labelled leaves as well as allocation to the tubers. 40 Other papers described assimilate fluxes to the rhizosphere 39 , 41 and contributions of leaves at different ages and positions to storage root development. 38 In sugar beet, assimilate export from upper leaves was hampered under magnesium deficiency. 42 However, for all crops, only two studies were found which assessed the combined effect of potassium stress and water deficit on the assimilate distribution. 43 , 44 K application increased 13C uptake and transport rate in Eucalypt, while drought did not significantly alter uptake and transfer. For maize, increased sugar accumulation was found in leaves under potassium deficiency. 43 , 44 Nevertheless, only one paper was found on cassava, describing assimilate partitioning of plants at 6 months and older after planting. 27
To our knowledge, there was no description of the effects of water deficit and potassium application on source–sink relations of cassava plants at the bulk root initiation stage. Therefore, the objective of this study was (a) to test the applicability of 13C‐CO2 pulse labelling on whole cassava plants, (b) to assess how water deficit affects source–sink relations at bulk root initiation stage, (c) to investigate whether potassium application can mitigate the adverse effects of water deficit by maintaining higher assimilate production and translocation to the roots and (d) to assess source–sink relations of cassava plants during a period of recovery from water deficit.
2. METHODS
2.1. Experimental set‐up
In 2019, a large pot experiment testing the effect of water deficit and potassium application on carbon partitioning of cassava was set up in the greenhouses of the FAO/IAEA Soil and Water Management & Crop Nutrition (SWMCN) Laboratory, Seibersdorf, Austria. This experiment was based on an unbalanced, randomized block design with three main factors: (a) water availability (100% vs. 50% of field capacity), (b) potassium availability (high vs. low) and (c) harvest time (at three different times), with four plants for each treatment combination.
In total, 75 cassava cuttings of the M'Bailo variety (see Table 1 for the distribution of the plants over the treatments), originating from the east of the DRC, were used. This local variety has a branching growing pattern, is further characterized by its tolerance to cassava mosaic disease and cassava green mite and has an expected yield of 15–20 t/ha with a growth cycle of 12–18 months. 47 , 48 No prior information was available about its performance under drought conditions. Pots with 7 L content were filled with 5 kg of washed quartz sand substrate (0.06–2 mm, bulk density of 1500 kg/m3) to allow precise control on nutrient supply, and to avoid as much carbon exchange between soil and air during labelling as possible. All cuttings were reduced to 20 cm and were then planted vertically in the pots, by inserting two‐thirds of each cutting below the surface of the sand substrate. Temperature and relative humidity in the greenhouse were monitored with four data loggers (Onset HOBO MX1101) throughout the experiment. Mean daily temperature, relative humidity and vapour pressure deficit during the growing period were 26.1 ± 3.2°C, 57 ± 8% and 1.56 ± 0.56 kPa, respectively.
TABLE 1.
Distribution of 75 plants over the different treatments
| W+K+ | W+K– | W–K+ | W–K– | |
|---|---|---|---|---|
| Before labelling (H0) | 3 | 3 | 3 | 3 |
| 8 h after labelling (H1) | 2 + 2 | 2 + 2 | 2 + 2 | 2 + 2 |
| 9 days after labelling (H2) | 2 + 2 | 2 + 2 | 2 + 2 | 2 + 2 |
| 24 days after labelling (H3) | 2 + 2 | 2 + 2 | 2 + 2 | 2 + 2 |
| Extra | 15 | |||
Notes: W+ and W– indicate plants at 100% or 50% of field capacity, respectively, during the period of water deficit. K+ and K– are plants receiving high or low potassium nutrient solution, respectively. 2 + 2 means that two plants went into the growth chamber at 59 DAP and two plants at 60 DAP. Fifteen extra plants were planted to replace cuttings which did not sprout.
The experiment was conducted from 5 July 2019 to 27 September 2019. During an initial period of 51 days, all plants were watered to 100% of field capacity (7.4 vol%). Field capacity of the substrate was determined before the experiment by applying water to freely draining pots and weighing at the moment a constant weight was reached. Water content of the sand substrate was monitored and readjusted thrice a week by weighing each pot and adding demineralized water to reach 100% of the field capacity. Pots without plants were included to measure evaporation and to allow simple calculation of transpiration.
At 52 days after planting (DAP), approximating the time of storage root initiation phase of cassava, 49 a drought treatment was imposed on half of the plants by withholding water until a level of 50% field capacity (3.7 vol%) was reached. This level was reached for all plants 3 days after the start of the drought treatment. At the start of this drought period, all youngest, fully expanded leaves (YFEL), which are the fourth or fifth leaf starting from the growing tip, were marked with a label (Tag 1 in Figure 1). During this period, water content of the substrate was also monitored on a daily basis to keep pots as close to their target levels as possible (100% (W+) or 50% (W–) of field capacity). Mean daily water contents of the two watering treatments right before watering during the period of water deficit are given in Figure S2 (supporting information).
FIGURE 1.

Subdivision of plant parts based on Tag 1 and Tag 2 at H0 (before labelling), H1 (8 h after labelling), H2 (9 days after labelling) and H3 (24 days after labelling). Source: https://bit.ly/3KinU53 via vecteezy.com [Color figure can be viewed at wileyonlinelibrary.com]
At 68 DAP, plants were allowed to recover by watering plants of both W+ and W– treatments to 100% of field capacity. All YFEL were marked with a label (Tag 2 in Figure 1), resulting in two tags on the plants towards the end of the experiment. This re‐watering period lasted until 84 DAP, after which the experiment was terminated.
Thrice per week, 100 ml of a modified Steiner solution, 50 either high (1.437mM K+, potassium activity ratio = 1.47 mmol0.5/L0.5) or low (0.359mM K+, potassium activity ratio = 0.29 mmol0.5/L0.5) in potassium, was added before watering. A full description of the stock solutions can be found in Tables S1 and S2 (supporting information). Treatments are indicated as K+ and K– for high potassium and low potassium nutrient solutions, respectively.
2.2. 13C‐CO2 labelling
At 2 months after planting (59 and 60 DAP), 1 week after initiation of water deficit for plants of the W– treatment, 48 cassava plants (24 plants on each day) (Table 1), representing all combinations of water and potassium availability treatments, were transferred for 13C‐CO2 labelling from the greenhouse to an airtight walk‐in growth chamber. This growth chamber had a volume of 15 m3. A description of the growth chamber can be found in Slaets et al. 51 Temperature and relative humidity were controlled at 25°C and 70%, respectively, by a Control 2000 microcontroller (Rumed, Rubarth Apparate GmbH, Laatzen, Germany). CO2 concentrations as well as the δ13C‐CO2 in the growth chamber were monitored using an Off‐Axis Integrated‐Cavity Output Spectroscopy (Off‐Axis ICOS, Los Gatos Research, San Jose, CA, USA) in flow‐through mode. A day length of 12 h was established by 48 fluorescent tubes of 54 W (54 W840, Aura Light GmbH, Hamburg, Germany).
CO2 levels were lowered before applying the pulse through photosynthesis by positioning the plants in the sealed growth chamber, thus maximizing the enrichment of the 13C‐pulse. A pulse of 13C‐CO2 was given around 14 h, once CO2 levels dropped below 300 ppm by volume (ppmv). For this pulse, a single injection of 13C‐CO2 (13C fraction of 99%) from a 0.4‐L bottle (2.3*106 Pa, Sigma Aldrich, St Louis, MO, USA) was given to the growth chamber at a flow rate of 400 ml/min, which was adjusted by a mass flow controller (FMA5512, OMEGA Engineering, INC., Norwalk, CT, USA). An injection time of 8 min was used to reach a calculated δ13C of 43 836‰ with a final concentration of 410 ppmv CO2 in the growth chamber atmosphere. Plants were left to take up the 13C‐CO2 label in the closed growth chamber with the lights on for 8 h and 10 min. As no new CO2 was added, CO2 concentrations inside the growth chamber dropped to 95 ppmv. Plants were left in the closed chamber with the lights off until harvest (12 h later). After this labelling period, the growth chamber was opened, and plants were taken out and harvested or transferred back to the greenhouse. Three plants per treatment were kept outside the growth chamber and were thus not labelled to calculate excess 13C in the labelled plants (Table 1).
2.3. Sampling procedure
Plants were harvested (a) at 59 DAP (right before labelling; three plants per treatment, H0), (b) at 59 or 60 DAP (approximately 8 h after the start of the labelling with lights on and 12 h with the lights off; four plants per treatment, H1), (c) at 68 or 69 DAP (9 days after labelling; four plants per treatment, H2) and (d) at 83 or 84 DAP (24 days after labelling; four plants per treatments, H3). Plants of H0, H1 and H2 were divided in roots, lower leaves, lower stem, middle leaves, middle stem (below Tag 1), and upper leaves 1, upper stem 1 and YFEL (above Tag 1), as illustrated in Figure 1. Plants of H3 were separated into similar parts, but additionally contained upper leaves 2 and upper stem 2 (above Tag 2).
2.4. Analysis of δ13C and carbon content
All plant parts were oven‐dried at 70°C for 48 h. Dry weight of the parts was then recorded, and samples were ground to powder using a micro ball mill (MM200, Retsch GmbH, Germany). Prior to isotopic analysis, 1.5–3 mg was weighed into tin cups. The δ13C and carbon content (%) were then measured using an elemental analyser (Vario Isotope Select, Elementar, Germany) coupled to an isotope ratio mass spectrometer (IRMS) (isoprime 100, Elementar, Germany), located in the FAO/IAEA Soil and Water Management & Crop Nutrition (SWMCN) Laboratory. Normalization of δ13C values compared to the international Vienna‐Pee Dee Belemnite standard (V‐PDB) was done using two calibrated in‐house standards: a sugar beet standard (δ13CVPDB = −26.07‰) and a sugarcane standard (δ13CVPDB = −10.95‰). Both in‐house standards were calibrated against IAEA‐CH‐6 (δ13CVPDB = −10.449 ± 0.033‰) and IAEA‐CH‐7 (δ13CVPDB = −32.151 ± 0.050‰).
2.5. Analysis of the leaf K concentration
The YFEL from 10 randomly picked cassava plants of each K‐treatment was taken at 52 DAP (before drought was initiated) to measure K concentration. For each water and fertilizer combination, lower leaves of five plants (three control plants and two randomly picked plants from the harvest at 68 and 69 DAP) were taken and analysed for K concentration. Subsequently, 50 mg of dried and ground plant material was digested in glass tubes with 2 ml nitric acid (29%) in a heating block. Measurements were made using an inductive coupled plasma optical emission spectrometer (iCAP 7,400 Duo, Thermo Scientific, China) at the Soil and Water Management Laboratories of the KU Leuven, Belgium.
2.6. Calculation of excess 13C
To obtain the excess 13C in the plants for assessing the carbon allocation of cassava, we first calculated the relative abundance ( ) of 13C for each sample with Equation (1).
| (1) |
where δ13C is the isotopic signature of the sample, as obtained by the IRMS, and RVPDB is the isotope ratio of the international VPDB standard, 0.01118. 52 Relative 13C abundances were calculated both for the different parts (i) of labelled ( ) and unlabeled ( ) plants.
To obtain the 13C excess in grams of part i in each plant, Equation (2) was used.
| (2) |
where is the average relative abundance of part i of the three unlabelled plants for the same treatment as , is the dry weight in grams of that labelled part i and is the carbon concentration (%) of the labelled part i. The whole plant 13C excess (for H1 equal to net assimilation after one day‐night cycle) was then calculated as the sum of the 13C excess weights of the separate plant parts (see Equation 3).
| (3) |
The obtained whole plant 13C excess was also normalized for total plant carbon weight and leaf carbon weight, to minimize differences due to variability among plants.
Distributions of 13C excess were calculated as the amount of 13C excess in part i, divided by the whole plant 13C excess as shown in Equation (4).
| (4) |
For the final distribution data, we combined separate parts to obtain only three main parts: leaves (contains YFEL, upper leaves 1, upper leaves 2, middle leaves and lower leaves), stems (upper stem 1, upper stem 2, middle and lower stem) and roots.
2.7. Data analysis
In short, we have an unbalanced, randomized block design with water (W+ and W–), fertilizer (K+ and K–) and harvest time (H1, H2 and H3) as main factors, with four replicates for each treatment combination, and growth chamber (59 or 60 DAP) as a block divided over five tables in the greenhouse. Due to die‐off and missing data, resulting in unbalanced sample observations, analysis of variance (ANOVA) following a linear mixed‐effect model approach was chosen. Models for plant water use during the different periods were estimated with water, fertilizer and their interaction term as fixed effects and a random intercept for table. Models for total biomass, new growth, whole plant 13C excess were estimated for each harvest separately with water, fertilizer and their interaction term as fixed effects, while a random intercept for table and growth chamber was calculated. The effect of water and fertilizer on percentage of 13C excess distribution was estimated per treatment and part over the different harvests (harvest as fixed effect), with a random intercept for table and growth chamber. Percentage of 13C excess distribution was also modelled per harvest and per part with water, fertilizer and their interaction as fixed effects and with a random intercept for growth chamber and table.
Significance of fixed effects (water, fertilizer, water × fertilizer and harvest) was estimated based on a type‐III ANOVA using the Satterthwaite's approximation method. Model definition and ANOVA were performed using the lme4 package 53 in R studio (R version 4.0.3). Pairwise comparisons of groups, based on estimated marginal means (EMM), were computed with Tukey's test. EMMs were computed with the emmeans package, and calculations and graphs were made using the tidyverse package. 54
3. RESULTS
3.1. Effect of potassium, water deficit and re‐watering on transpiration
Figure 2 shows the transpiration of the plants during the experiment. The potassium treatment affected the transpiration of the plants during the optimal period (first 52 DAP) (P < 0.01), by reducing transpiration in the K+ plants with 5% (206 ml) compared to the K– plants. However, no significant effect of the fertilizer treatment was found during the drought or re‐watering period. During the first and second parts of the drought period, the watering treatment significantly affected the transpiration of the plants. Plants of the W– treatment transpired, respectively, 28% (P < 0.001) and 38% (P < 0.001) less during these periods compared to the plants that received optimal watering throughout the whole experiment.
FIGURE 2.

A, Daily transpiration of cassava plants over the course of the experiment. Lines and dots are averages per treatment combination. Black colour represents plants at W+ (100% of field capacity), and grey colour represents plants at W– (50% of field capacity) during the period of imposed water deficit. Full lines are plants at optimal potassium nutrient solution (K+), whereas dotted lines represent plants at suboptimal potassium nutrient solution (K–). The vapour pressure deficit is given as the daily mean VPD and is represented by a black dashed line. H0, H1, H2 and H3 indicate harvest moments: H0 (before labelling), H1 (8 h after labelling), H2 (9 days after labelling) and H3 (24 days after labelling). B–E, Total transpiration for the different experimental periods. N per group is 30, 15, 8 and 4 for plot (B, C, D and E), respectively
For the re‐watering period, even though W– plants were again equally watered as W+ plants, they did not transpire as much as W+ plants, i.e., 20% less (P < 0.01). Nevertheless, 6 days after the W– plants were re‐watered, there was no longer a significant effect (P > 0.1) of the watering treatment found on the transpiration of the plants.
3.2. Biomass production
Total biomass of the plants was not significantly affected by the watering or fertilizer treatments at any harvest date (Table 2). However, an effect of watering could be found on the biomass of the new growth, which is the shoot material above Tag 1, at H2 (9 days after labelling) and H3 (24 days after labelling). W– plants produced 26% and 27% less dry matter in the new shoots compared to the W+ plants in H2 and H3, respectively. However, the new growth that developed after the initiation of drought was not significantly affected by watering at H0 (before labelling) or H1 (8 h after labelling). A significant effect of K was found at H0, yet this was not found any longer at H1. Plants with lower K application (K–) had 26% less new growth.
TABLE 2.
Total biomass production (g dry weight) and new shoot growth (g dry weight) of the plants at H0 (right before labelling), H1 (8 h after labelling), H2 (9 days after labelling) and H3 (24 days after labelling)
| W+K+ | W+K– | W–K+ | W–K– | Weffect | Keffect | W x Keffect | |
|---|---|---|---|---|---|---|---|
| Total biomass H0 (g) | 17.0A ± 2.2 | 16.3A ± 2.7 | 15.3A ± 2.7 | 16.5A ± 2.7 | 0.77 | 0.93 | 0.74 |
| Total biomass H1 (g) | 13.4A ± 1.5 | 16.6A ± 1.2 | 14.8A ± 1.7 | 14.5A ± 1.2 | 0.81 | 0.25 | 0.17 |
| Total biomass H2 (g) | 15.5A ± 2.0 | 20.2A ± 2.0 | 19.3A ± 2.6 | 17.6A ± 4.2 | 0.78 | 0.52 | 0.19 |
| Total biomass H3 (g) | 25.9A ± 2.8 | 23.7A ± 3.2 | 21.9A ± 2.5 | 21.4A ± 3.2 | 0.21 | 0.58 | 0.75 |
| New growth H0 (g) | 1.93A ± 0.18 | 1.17A ± 0.18 | 1.47A ± 0.18 | 1.33A ± 0.18 | 0.41 | 0.04 | 0.12 |
| New growth H1 (g) | 1.75A ± 0.22 | 1.38A ± 0.22 | 1.30A ± 0.23 | 1.20A ± 0.22 | 0.15 | 0.25 | 0.53 |
| New growth H2 (g) | 1.46AB ± 0.22 | 1.88A ± 0.22 | 1.16B ± 0.22 | 1.31AB ± 0.22 | 0.02 | 0.09 | 0.37 |
| New growth H3 (g) | 3.50A ± 0.40 | 4.19A ± 0.36 | 2.93A ± 0.39 | 2.71A ± 0.45 | 0.02 | 0.54 | 0.27 |
Notes: ‘New shoot growth’ is defined as all shoot parts growing above Tag 1 (YFEL, upper leaves 1 and 2, upper stems 1 and 2). W+ and W– indicate plants at 100% or 50% of field capacity, respectively, during the period of imposed water deficit. K+ and K– are plants receiving high or low potassium nutrient solution, respectively. Values for treatment combinations (W+K+, W+K–, …) are presented as estimated marginal mean ± standard error, whereas P‐values of the ANOVA are given for each effect (Weffect, Keffect, …). P‐values are in bold if smaller than 0.05. Treatments containing the same letter do not differ significantly by Tukey's HSD post hoc tests (α = 0.05).
3.3. Leaf potassium concentration
At the onset of drought, a high potassium concentration in the nutrient solution did not significantly influence the leaf potassium concentration of the YFEL at 52 days after planting. K+ leaves contained 2.19 ± 0.18% potassium, whereas K– leaves contained 2.16 ± 0.26% potassium. However, the watering treatment affected the potassium concentration of the lower leaves at 68 DAP significantly (P < 0.05). Drought decreased leaf potassium concentration from 1.71 ± 0.28% in W+ plants to 1.44 ± 0.19% in W– plants, a decrease of 0.27% potassium.
3.4. Whole plant 13C excess and 13C excess of new growth
Net assimilation of 13C‐CO2 after a day‐night cycle, as measured by whole plant 13C excess at H1, is shown in Figure 3, as well as whole plant 13C excess at H2 and H3. Neither fertilizer treatment nor watering treatment significantly affected the total amount of incorporated 13C at H1. This also holds true when whole plant 13C excess is normalized for the plant carbon weight or leaf carbon weight. A significant difference (P < 0.05) was found, however, in the whole plant 13C excess at H3 between W+ and W– treatments. Plants under drought contained 24% less 13C excess.
FIGURE 3.

Whole plant 13C excess at H1 (8 h after labelling), H2 (9 days after labelling) and H3 (24 days after labelling). Whole plant 13C excess is given in mg 13C. Black colour represents plants at W+ (100% of field capacity), and grey colour represents plants at W– (50% of field capacity) during the period of imposed water deficit. Full lines are plants at optimal potassium nutrient solution (K+), whereas dotted lines represent plants at suboptimal potassium nutrient solution (K–). Values for treatment combinations (W+K+, W+K–, …) per harvest are presented as estimated marginal means. Error bars represent estimated standard errors
Based on a comparison of whole plant 13C excess between H1 and H3, it is estimated that 12%, 20%, 41% and 43% of the new assimilates were lost through respiration for the W+K+, W+K–, W–K+ and W–K–, respectively.
Overall, looking at the separate plant parts, δ13C ranged from an enrichment of 2865‰ (upper leaves of W–K– plant at H1) at 8 h after labelling, to as low as −30.4‰ (roots of W+K+ plant at H1), the latter implying no enrichment by 13C.
When comparing the 13C excess of those parts from H3, that grew during the re‐watering period (and thus without any labelled CO2), with the same parts in H1, it is found that those parts are still enriched with 13C. In the YFEL up to 47% of the amount that was initially present at H1 is found in the YFEL in H3. This was up to 32% and 23% for the upper leaves and upper stem, respectively.
3.5. 13C excess partitioning over time and per treatment
Important to note is not only how treatments affect assimilation of new carbon compounds, also where those assimilates are being stored or used in the plants. Figure 4 shows the distribution of the assimilates, produced by the plants during the 8 h labelling period, at the three harvest times.
FIGURE 4.
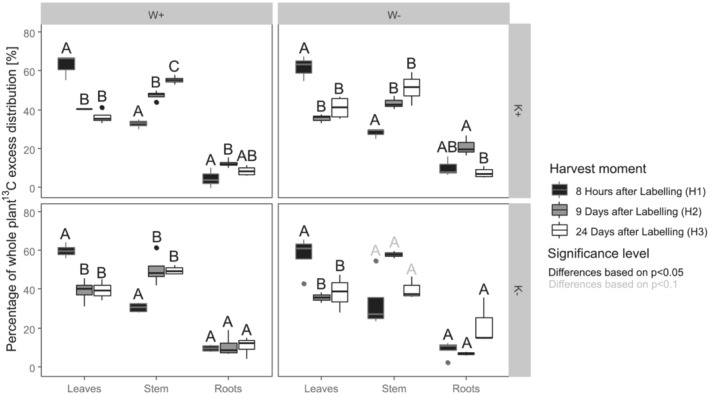
Distribution of 13C excess in the three major plant parts as expressed by percentage of whole plant 13C excess for the three harvests. Letters show significant differences over time per treatment and part, based on a type‐III ANOVA (fixed effect of harvest, random intercept for growth chamber and table) followed by a Tukey's HSD. Shown differences over time are based on α = 0.05 (black letters) or α = 0.1 (grey letters)
At H1, on average for all treatments, 60% of the whole plant 13C excess was found in the leaves. On average, 31% was found in the stem material, whereas 9% of the 13C excess was found in the roots. At H2 (9 days after labelling), 38%, 49% and 13% were found in leaves, stems and roots, respectively. Finally, at H3 (24 days after labelling) similar values were found as for 9 days, with 39%, 50% and 11% found in leaves, stems and roots, respectively.
The main shift from H1 to H2, where plants at W– are still under drought, is a decrease in leaf 13C excess distribution, whereas stems increase in their share of new assimilates for all treatments, but W–K–. The share of assimilates in the roots for K+ plants increases from H1 to H2, but only significantly for W+ treatment. This trend is not seen in K– plants, where the share remains constant.
Some differences are found between H2 and H3. At this point, plants of W– also received sufficient water to reach 100% of field capacity. No significant change in leaf 13C excess distribution was found for any of the treatments. Main changes are found in roots and stems. Although the share of assimilates in stems for W+K+ plants continues to increase, the share of assimilates seems to stabilize in the other treatments. However, in the W–K+ treatment, a significant (P < 0.05) decrease from H2 to H3 of distribution to the roots was found.
Whereas Figure 4 shows the differences over time, for the same treatment and parts, Table 3 compares the distribution between the different treatments per part for each harvest. For H1, the treatments had no significant effect on any of the distributions. Significant differences could be found in H2. Here, plants at K+, regardless of the watering treatment, had fewer assimilates distributed to the stems, while containing a higher share of 13C excess in the roots, with a larger difference between plants that were experiencing water deficit (W–). A small significant effect (P < 0.1) was found for the water treatment on the leaves. Plants at W+ had more assimilates distributed to the leaves. For H3 (meaning during the re‐watering period), no differences were found in the leaves, yet both water and potassium application influenced the distribution in the stems and roots. The legacy of water deficit caused a significantly higher assimilate distribution to the roots and lower distribution to the stem. Potassium application caused a higher distribution to the stem, but a lower distribution to the roots.
TABLE 3.
Percentage of whole plant 13C excess distribution per harvest and per part
| Harvest | Part | W+K+ | W+K– | W–K+ | W–K– | Weffect | Keffect | W x Keffect |
|---|---|---|---|---|---|---|---|---|
| H1 | Leaves | 64A ± 4% | 57A ± 4% | 57A ± 4% | 58A ± 4% | 0.20 | 0.19 | 0.21 |
| Stem | 32A ± 5% | 32A ± 4% | 30A ± 5% | 33A ± 4% | 0.94 | 0.70 | 0.76 | |
| Roots | 4A ± 3% | 10A ± 2% | 11A ± 3% | 9A ± 2% | 0.17 | 0.34 | 0.11 | |
| H2 | Leaves | 40A ± 2% | 39A ± 2% | 36A ± 2% | 36A ± 3% | 0.09 | 0.78 | 0.80 |
| Stem | 47A ± 3% | 50A ± 3% | 43A ± 3% | 57A ± 4% | 0.66 | 0.02 | 0.10 | |
| Roots | 12AB ± 2% | 11AB ± 2% | 21A ± 3% | 7B ± 3% | 0.36 | 0.01 | 0.04 | |
| H3 | Leaves | 36A ± 3% | 39A ± 3% | 40A ± 3% | 39A ± 3% | 0.44 | 0.69 | 0.34 |
| Stem | 56A ± 2% | 51A ± 3% | 50A ± 2% | 40B ± 3% | <0.01 | <0.01 | 0.09 | |
| Roots | 8A ± 3% | 10AB ± 3% | 9A ± 3% | 22B ± 3% | 0.03 | 0.02 | 0.07 |
Notes: H0 (right before labelling), H1 (8 h after labelling), H2 (9 days after labelling) and H3 (24 days after labelling). W+ and W– indicate plants at 100% or 50% of field capacity, respectively, during the period of imposed water deficit. K+ and K– are plants receiving high or low potassium nutrient solution, respectively. Values for treatment combinations (W+K+, W+K–, …) are presented as estimated marginal mean ± standard error, whereas P‐values of the type‐III ANOVA are given for each effect (Weffect, Keffect, …). P‐values are in bold if smaller than 0.05. Treatments containing the same letter do not differ significantly by Tukey's HSD post hoc tests (α = 0.05).
4. DISCUSSION
4.1. Drought decreased transpiration and potassium concentrations in older leaves
Cassava plants reacted to water deficit with a rapid reduction in transpiration as expected (Figure 2). The reduced transpiration is presumably due to a rapid stomatal closure as has been previously observed in many plants and cassava. 19 , 25 , 55 Cassava plants use this mechanism to avoid dehydration of leaves and deplete soil water reserves more slowly. 19 Even though new shoot growth was reduced under drought, it did not affect transpiration during the last days of re‐watering, as a full recovery of transpiration happened. This would suggest a higher stomatal conductance for a lower leaf area. Increased stomatal conductance of leaves formed during recovery from water deficit was previously found in cassava. 56
We also found that water deficit decreased potassium concentration in lower leaves with 0.27% potassium, which coincides with what was previously found in literature for cassava. 12 , 25 , 57 The decrease in potassium may be explained by a decrease in transpiration, which reduces the flow of mineral nutrients through the xylem. 57 To avoid potassium deficiency in sink tissues, plants remobilize potassium through the phloem from older leaves. 58 However, in this case, applying more potassium could not reverse the effects of water deficit on leaf potassium concentrations.
A small, but significant, decrease in transpiration was also found during the initial optimal watering period for plants that received optimal levels of potassium (Figure 2). However, potassium application had no significant effect on transpiration of plants during and after water deficit. Both findings do not align with what was found by Wasonga et al, 25 who showed significantly higher transpiration in pot‐grown plants receiving more potassium. In our study, all potassium concentrations in the analysed leaves were above the critical level for YFEL of cassava plants at 3 MAP, namely 1.44% potassium, as defined by Howeler et al. 59 Given the small difference in transpiration in our study, and because leaf potassium concentrations were found in optimal ranges for all treatments, no further attention was given. A more drastic difference between potassium concentrations in the optimal and suboptimal solutions may be needed to further unravel the role of potassium in drought stress response.
4.2. Water deficit slowed down new growth and increased respiration of new assimilates
Neither the 2‐week period of water deficit nor the potassium application had significant effects on the total biomass production, as found in Table 2. However, new growth was significantly smaller for plants that had the full 2‐week period of water deficit (H2 and H3). Explanation for this could be that cassava reacts to drought by reducing cell division and expansion of new leaves, resulting in smaller leaves 60 and in general less shoot growth. 12 However, those new leaves, formed in W– plants, may have exhibited higher net photosynthetic rates, as previously found for cassava, 56 and so compensated for the reduced growth during the dry spell.
Using our 13C excess data from Figure 3, an increase in respiration, rather than a decrease in net assimilation after a day‐night cycle, was also observed for those cassava plants under water deficit. This is based on the finding that initially plants did not show a significantly different 13C assimilation. However, at the last harvest H3, plants at W– contained a significantly lower whole plant 13C excess compared to plants at W+. A review by Flexas et al 61 shows that both a decrease and increase in respiration have been found before in plants under water deficit.
Potassium did not have a significant effect on either process, which again could be explained by optimal potassium concentrations found in the leaves of both K+ and K– treatments. Nevertheless, the expected decrease in the net assimilation of 13C‐CO2 during labelling due to drought was not found in our study. Suboptimal light conditions (PPFD of 250 μmol/m2/s) and rapidly dropping CO2 levels (dropping below 200 ppmv after 150 min and reaching a plateau at 95 ppmv at the start of the night, 8 h after labelling) in the growth chamber may have limited plant functioning additionally by affecting stomatal conductance and CO2 supply. More severe water deficit, leading to stomatal closure, could have overcome this masking effect of the other factors.
4.3. Carbon allocation during water deficit
Pulse labelling the plants with 13C‐CO2 made it possible to follow new assimilates in the different plant parts over time and assess the effects of water deficit and potassium application. We found that, at the time of labelling, the distribution of assimilates to the different parts was not significantly influenced by any of the treatments, as seen in Table 3. Potassium application, however, affected this distribution at 9 days after labelling. Plants receiving more potassium had higher percentage of assimilates distributed to the roots and less to the stems. A faster translocation of assimilates from leaves to stems to roots has already been proposed before in pot‐grown cassava, but without clear evidence. 26 More importantly, for plants under water deficit, this effect of potassium application was slightly stronger in the roots, compared to plants that received optimal watering throughout.
Although the percentage of new assimilates in the roots was not significantly affected during the drought for treatment with less potassium, applying potassium increased the share to the roots further during drought, but also for the plants which received sufficient water. However, stems were found to contain the largest share of new assimilates 9 days after labelling (H2), which is different from what was found in Hume (1975). 27 In their study, plants in the field at 8 months after planting and 8 days after labelling (in our case 9 days after labelling) had 63% of the new assimilates still in the leaves, 28% in the stem and 8% in the roots: having more of the assimilates still in the leaves and less in the stem as compared to our results. However, a 2‐day longer chase period and the use of pot‐grown plants in our study could complicate direct comparison with the study from Hume. Plants in this study were labelled in the dry season in Ghana, suggesting a high vapour pressure deficit, which most likely increased stomatal resistance or induced stomatal closure. This influenced assimilate transport from source leaves to sink tissues. 62
4.4. Carbon allocation after re‐watering
During the re‐watering period, potassium application changed assimilate distribution for both watering treatments inversely as compared to the period before re‐watering, as can be seen in Table 3. Increased potassium application caused more assimilates to be in the stem and less in the roots. Potassium application influenced this process also slightly more strongly in the plants that experienced water deficit before. Furthermore, W– plants decreased assimilate distribution to the stem and increased it to the roots, meaning that the legacy of water deficit had influence on assimilate distribution in the re‐watering period.
Regardless of the treatment, a considerable amount of carbohydrates, assimilated during the 13C‐CO2 pulse, was detected in the newly grown parts (YFEL, upper leaves 2 and upper stem 2) of the last harvest, meaning 24 days after labelling. Young leaves are partly heterotrophic and therefore receive carbohydrates from other sources than from their own photosynthesis. 63 We can conclude that older assimilates (in this case 24 days old) are also relocated to growing tissues. In this study, we found that the YFEL of the last harvest contained up to 47% of the amount of enriched assimilates which were present in the YFEL right after labelling. Here, the imposed treatments did not affect this amount significantly. The effect of old assimilates in specific carbon compounds would be worth exploring.
4.5. Learning, improvements and future applications of the method
Pulse labelling with 13C‐CO2 could reveal the fate of new assimilates in young cassava plants and how water deficit and potassium application influenced their distribution, even before potassium deficits were detected. Nevertheless, some improvements to the method will increase its strength to understand stress mechanisms in cassava plants.
Based on this study, we advise researchers to include measurements of root and shoot respiration to enable a closed carbon balance. The used method could only give an estimate of respiration, but not how much recent assimilates are allocated to respiration (both growth and maintenance respiration) of roots or above‐ground biomass. A problem with the respiration estimate is that it depends on the assumption that there is only little variability between plants of the different harvest periods, which might be difficult to defend for cassava plants. We suggest them to also include physiological (e.g., stomatal conductance and photosynthetic capacity) and morphological measurements to assess plant stress levels, as processes such as photosynthesis and transpiration strongly affect source–sink relations.
Another recommendation is that leaf blades and petioles are preferably analysed separately and not as one part. It was previously found that petioles can also serve as intermediate starch reserves which are depleted during stress. 19 Furthermore, analysing carbon enrichment in different pools (e.g., cellulose, soluble sugars, starch) can help us understand ongoing processes of storage and remobilization during events of stress, as it was not clear whether the measured 13C excess was mobile or not in this experiment.
Lastly, to detect treatment effects on carbon allocation, any variability between plants should be kept as low as possible. Cassava plants, undergoing the same treatments, exhibit high morphological variability and thus increasing number of replicates might facilitate interpretation. Also, care should be taken to grind and homogenize samples from pulse labelling studies sufficiently. In this study, initial tests were performed to find out the effectiveness of grinding by hand (crushing the samples to a size of about 2 mm) and ball milling. Ball milling, the method used in this study, was shown to be superior to grinding by hand in keeping variability between technical replicates low. Data (Figure S1 [supporting information]) suggest that processing only parts of leaves or grinding too roughly will complicate the interpretation of experimental results, because of large δ13C variability within leaves, as also demonstrated by Nguyen Tu et al. 64
As a next step to deploy this method, an approach to label cassava plants in the field needs to be developed, with older plants, having already more developed roots. This would increase our fundamental knowledge on the role of water deficit and potassium application under field conditions, and so allow us to further adapt soil and water management practices to mitigate the impact of changing weather patterns.
5. CONCLUSIONS
The use of pulse labelling to assess carbon allocation in young cassava plants was here proven to be a practical tool to enhance fundamental understanding of cassava physiology. By applying a pulse of 13C‐CO2, we could reveal the fate of new assimilates in the plant and how short‐term water deficits and potassium application influenced their distribution. The use of different harvest times has been shown to be essential for understanding the transport of assimilates.
Through this experiment, an increase in respiration of the new assimilates could be demonstrated for cassava plants under water deficit, as well as the recovery of growth and transpiration during a period of re‐watering after dry spells. Potassium application increased carbon allocation to the roots at 9 days after labelling, but decreased allocation to the roots in favour of stems at 24 days after labelling. It was also found that these effects of potassium were more strongly pronounced under drought. Therefore, labelling showed clearly how potassium may play a role in translocation and re‐translocation of assimilates.
PEER REVIEW
The peer review history for this article is available at https://publons.com/publon/10.1002/rcm.9426.
Supporting information
TABLE S1: Composition of the K+ (high potassium) nutrient solution
TABLE S2: Composition of the K– (low potassium) nutrient solution
TABLE S3: Potassium (K), calcium (Ca) and magnesium (Mg) concentrations found in the lower leaves after 1 week of water deficit. W+ and W– indicate plants at 100% or 50% of field capacity, respectively, during the period of imposed water deficit. K+ and K– are plants receiving high or low potassium nutrient solution, respectively. Values for treatment combinations (W+K+, W+K–,…) are presented as estimated marginal mean ± standard error, whereas P‐values of the ANOVA are given for each effect (Weffect, Keffect,…)
FIGURE S1:Variability of three separate leaf samples at (A) natural abundance and (B,C) enriched, ground by hand or ground by micro ball mill. Dots represent the means of six repetitions, whereas the error bar shows the standard deviation around the mean
FIGURE S2: Mean daily water content of the two watering treatments right before watering during the period of water deficit. Error bars show the standard deviation around the mean
ACKNOWLEDGMENTS
This research was conducted at the Soil and Water Management and Crop Nutrition greenhouse and laboratory of the Joint FAO/IAEA Centre of Nuclear Techniques in Food and Agriculture. The research was financed by the Belgian government through the Consortium for Improving Agriculture‐based Livelihoods in Central Africa (CIALCA, www.cialca.org), a project of the International Institute of Tropical Agriculture (IITA). Special thanks go to Yang Ding and Hami Said for providing support with work in the greenhouse, Maria Heiling for brainstorming sessions, Christian Resch and Roman Gruber for the 13C analysis, Arsenio Toloza, Norbert Jagoditsch and Georg Weltin for their help during the harvest and Juan Carlos Laso Bayas for statistical advice.
Van Laere J, Willemen A, De Bauw P, Hood‐Nowotny R, Merckx R, Dercon G. Carbon allocation in cassava is affected by water deficit and potassium application – A 13C‐CO2 pulse labelling assessment. Rapid Commun Mass Spectrom. 2023;37(2):e9426. doi: 10.1002/rcm.9426
DATA AVAILABILITY STATEMENT
The data that support the findings of this study are available from the corresponding author upon reasonable request.
REFERENCES
- 1. Parmar A, Sturm B, Hensel O. Crops that feed the world: Production and improvement of cassava for food, feed, and industrial uses. Food Secur. 2017;9(5):907‐927. doi: 10.1007/s12571-017-0717-8 [DOI] [Google Scholar]
- 2. FAO . FAOSTAT statistical database. Published Online 2020.
- 3. Haensler A, Saeed F, Jacob D. Assessment of projected climate change signals over Central Africa based on a multitude of global and regional climate projections. Climate Change Scenarios for the Congo Basin 2013;No. 11.
- 4. Jarvis A, Ramirez‐Villegas J, Vanessa B, Campo H, Navarro‐Racines C. Is cassava the answer to African climate change adaptation? Trop Plant Biol. 2012;5(1):9‐29. doi: 10.1007/s12042-012-9096-7 [DOI] [Google Scholar]
- 5. Rippke U, Ramirez‐Villegas J, Jarvis A, et al. Timescales of transformational climate change adaptation in sub‐Saharan African agriculture. Nat Climate Change. 2016;6(6):605‐609. doi: 10.1038/nclimate2947 [DOI] [Google Scholar]
- 6. Manners R, Vandamme E, Adewopo J, et al. Suitability of root, tuber, and banana crops in Central Africa can be favoured under future climates. Agr Syst. 2021;193:103246. doi: 10.1016/J.AGSY.2021.103246 [DOI] [Google Scholar]
- 7. Connor DJ, Cock JH, Parra GE. Response of cassava to water shortage I. growth and yield. Field Crop Res. 1981;4(C):181‐200. doi: 10.1016/0378-4290(81)90071-X [DOI] [Google Scholar]
- 8. Oliveira SL, Macedo MMC, Porto M, Carvalho M. Effects of water stress on cassava root production. Pesquia Agropecuria Brasil. 1982;17(1):121‐124. [Google Scholar]
- 9. Alves AAC. Cassava botany and physiology. In: Hillocks RJ, Tresh JM, eds. Cassava: Biology, Production and Utilization. CABI; 2002:67‐89. doi: 10.1079/9780851995243.0067 [DOI] [Google Scholar]
- 10. Baker GR, Fukai S, Wilson GL. The response of cassava to water deficits at various stages of growth in the subtropics. Aust J Agr Res. 1989;40(3):517‐528. doi: 10.1071/AR9890517 [DOI] [Google Scholar]
- 11. Daryanto S, Wang L, Jacinthe PA. Drought effects on root and tuber production: A meta‐analysis. Agric Water Manag. 2016;176:122‐131. doi: 10.1016/j.agwat.2016.05.019 [DOI] [Google Scholar]
- 12. El‐Sharkawy MA, Cadavid LF. Response of cassava to prolonged water stress imposed at different stages of growth. Exp Agric. 2002;38(3):333‐350. doi: 10.1017/S001447970200306X [DOI] [Google Scholar]
- 13. Mehdi R, Lamm CE, Bodampalli Anjanappa R, et al. Symplasmic phloem unloading and radial post‐phloem transport via vascular rays in tuberous roots of Manihot esculenta. J Exp Bot. 2019;70(20):5559‐5573. doi: 10.1093/JXB/ERZ297 [DOI] [PMC free article] [PubMed] [Google Scholar]
- 14. Sonnewald U, Fernie AR, Gruissem W, et al. The cassava source–sink project: Opportunities and challenges for crop improvement by metabolic engineering. Plant J. 2020;103(5):1655‐1665. doi: 10.1111/TPJ.14865 [DOI] [PubMed] [Google Scholar]
- 15. Shan Z, Luo X, Wei M, Huang T, Khan A, Zhu Y. Physiological and proteomic analysis on long‐term drought resistance of cassava (Manihot esculenta Crantz). Sci Rep. 2018;8(1):1, 17982‐12. doi: 10.1038/s41598-018-35711-x [DOI] [PMC free article] [PubMed] [Google Scholar]
- 16. Sevanto S. Drought impacts on phloem transport. Curr Opin Plant Biol. 2018;43:76‐81. doi: 10.1016/J.PBI.2018.01.002 [DOI] [PubMed] [Google Scholar]
- 17. Zierer W, Rüscher D, Sonnewald U, Sonnewald S. Tuber and tuberous root development. Annu Rev Plant Biol. 2021;72(1):551‐580. doi: 10.1146/ANNUREV-ARPLANT-080720-084456 [DOI] [PubMed] [Google Scholar]
- 18. Omondi JO, Lazarovitch N, Rachmilevitch S, Yermiyahu U. Phosphorus affects storage root yield of cassava through root numbers. J Plant Nutr. 2019;42(17):2070‐2079. doi: 10.1080/01904167.2019.1655033 [DOI] [Google Scholar]
- 19. Duque LO, Setter TL. Cassava response to water deficit in deep pots: Root and shoot growth, ABA, and carbohydrate reserves in stems, leaves and storage roots. Trop Plant Biol. 2013;6(4):199‐209. doi: 10.1007/S12042-013-9131-3/FIGURES/11 [DOI] [Google Scholar]
- 20. Duque LO, Setter TL. Partitioning index and non‐structural carbohydrate dynamics among contrasting cassava genotypes under early terminal water stress. Environ Exp Bot. 2019;163:24‐35. doi: 10.1016/J.ENVEXPBOT.2019.03.023 [DOI] [Google Scholar]
- 21. Wang M, Zheng Q, Shen Q, Guo S. The critical role of potassium in plant stress response. Int J Mol Sci. 2013;14(4):7370‐7390. doi: 10.3390/IJMS14047370 [DOI] [PMC free article] [PubMed] [Google Scholar]
- 22. Cakmak I. The role of potassium in alleviating detrimental effects of abiotic stresses in plants. J Plant Nutr Soil Sci. 2005;168(4):521‐530. doi: 10.1002/JPLN.200420485 [DOI] [Google Scholar]
- 23. Alves AAC, Setter TL. Abscisic acid accumulation and osmotic adjustment in cassava under water deficit. Environ Exp Bot. 2004;51(3):259‐271. doi: 10.1016/J.ENVEXPBOT.2003.11.005 [DOI] [Google Scholar]
- 24. Ezui KS, Franke AC, Leffelaar PA, et al. Water and radiation use efficiencies explain the effect of potassium on the productivity of cassava. Eur J Agron. 2017;83:28‐39. doi: 10.1016/J.EJA.2016.11.005 [DOI] [Google Scholar]
- 25. Wasonga DO, Kleemola J, Alakukku L, Mäkelä PSA. Growth response of cassava to deficit irrigation and potassium fertigation during the early growth phase. Agronomy. 2020;10(3):321 doi: 10.3390/agronomy10030321 [DOI] [Google Scholar]
- 26. Omondi JO, Lazarovitch N, Rachmilevitch S, Kukew T, Yermiyahu U, Yasuor H. Potassium and storage root development: Focusing on photosynthesis, metabolites and soluble carbohydrates in cassava. Physiol Plant. 2020;169(2):169‐178. doi: 10.1111/PPL.13060 [DOI] [PubMed] [Google Scholar]
- 27. Hume DJ. Translocation of 14C‐labelled photosynthetic assimilates in cassava (Manihot esculenta Crantz). Ghana J Agric Sci. 1975;8(1):69‐75. Accessed October 4, 2021. https://inis.iaea.org/search/search.aspx?orig_q=RN:8324801 [Google Scholar]
- 28. Adiele JG, Schut AGT, van den Beuken RPM, et al. A recalibrated and tested LINTUL‐cassava simulation model provides insight into the high yield potential of cassava under rainfed conditions. Eur J Agron. 2021;124:126242. doi: 10.1016/J.EJA.2021.126242 [DOI] [Google Scholar]
- 29. Lahai MT, Ekanayake IJ. Accumulation and distribution of dry matter in relation to root yield of cassava under a fluctuating water table in inland valley ecology. Afr J Biotechnol. 2009;8(19):4895‐4905. doi: 10.4314/ajb.v8i19.65183 [DOI] [Google Scholar]
- 30. Ramanujam T, Lakshmi KR. The pattern of dry matter production and partitioning in cassava. Indian J Plant Physiol. 1984;27(2):138‐144. [Google Scholar]
- 31. Carretero CL, Cantos M, García JL, Azcón R, Troncoso A. Growth responses of micropropagated cassava clones as affected by glomus Intraradices colonization. J Plant Nutr. 2009;32(2):261‐273. doi: 10.1080/01904160802608601 [DOI] [Google Scholar]
- 32. Yabuta S, Fukuta T, Tamaru S, et al. The productivity of cassava (Manihot esculenta Crantz) in Kagoshima, Japan, which belongs to the temperate zone. Agronomy. 2021;11(10):2021. doi: 10.3390/AGRONOMY11102021 [DOI] [Google Scholar]
- 33. Manrique LA. Effects of nitrogen fertilization on growth and yield of cassava in Hawaii: II dry matter production and efficiency of partitioning. Commun Soil Sci Plant Anal. 1990;21(13–16):1817‐1830. doi: 10.1080/00103629009368342 [DOI] [Google Scholar]
- 34. Epron D, Bahn M, Derrien D, et al. Pulse‐labelling trees to study carbon allocation dynamics: A review of methods, current knowledge and future prospects. Tree Physiol. 2012;32(6):776‐798. doi: 10.1093/TREEPHYS/TPS057 [DOI] [PubMed] [Google Scholar]
- 35. Rog I, Jakoby G, Klein T. Carbon allocation dynamics in conifers and broadleaved tree species revealed by pulse labeling and mass balance. For Ecol Manage. 2021;493:119258. doi: 10.1016/J.FORECO.2021.119258 [DOI] [Google Scholar]
- 36. Okogbenin E, Setter TL, Ferguson M, et al. Phenotypic approaches to drought in cassava: Review. Front Physiol. 2013;4:93. doi: 10.3389/fphys.2013.00093 [DOI] [PMC free article] [PubMed] [Google Scholar]
- 37. Li S, Zhao L, Sun N, Liu Q, Li H. Photosynthesis product allocation and yield in sweet potato with different irrigation levels at mid‐season. Agric Water Manag. 2021;246:106708 doi: 10.1016/J.AGWAT.2020.106708 [DOI] [Google Scholar]
- 38. Golovko TK, Tabalenkova GN. Source‐sink relationships in potato plants. Russ J Plant Physiol. 2019;66(4):664‐671. doi: 10.1134/S1021443719030051 [DOI] [Google Scholar]
- 39. Gschwendtner S, Esperschuetz J, Buegger F, et al. Effects of genetically modified starch metabolism in potato plants on photosynthate fluxes into the rhizosphere and on microbial degraders of root exudates. FEMS Microbiol Ecol. 2011;76(3):564‐575. doi: 10.1111/j.1574-6941.2011.01073.x [DOI] [PubMed] [Google Scholar]
- 40. Gawronska H, Thornton MK, Dwelle RB. Influence of heat stress on dry matter production and photo‐assimilate partitioning by four potato clones. Am Potato J. 1992;69(10):653‐665. doi: 10.1007/BF02852678 [DOI] [Google Scholar]
- 41. Hannula SE, Boschker HTS, de Boer W, van Veen JA. 13C pulse‐labeling assessment of the community structure of active fungi in the rhizosphere of a genetically starch‐modified potato (Solanum tuberosum) cultivar and its parental isoline. New Phytol. 2012;194(3):784‐799. doi: 10.1111/J.1469-8137.2012.04089.X [DOI] [PubMed] [Google Scholar]
- 42. Hermans C, Bourgis F, Faucher M, Strasser RJ, Delrot S, Verbruggen N. Magnesium deficiency in sugar beets alters sugar partitioning and phloem loading in young mature leaves. Planta. 2005;220(4):541‐549. doi: 10.1007/S00425-004-1376-5 [DOI] [PubMed] [Google Scholar]
- 43. Epron D, Cabral OMR, Laclau JP, et al. In situ 13CO2 pulse labelling of field‐grown eucalypt trees revealed the effects of potassium nutrition and throughfall exclusion on phloem transport of photosynthetic carbon. Tree Physiol. 2015;36(1):6‐21. doi: 10.1093/treephys/tpv090 [DOI] [PubMed] [Google Scholar]
- 44. Martineau E, Domec JC, Bosc A, et al. The role of potassium on maize leaf carbon exportation under drought condition. Acta Physiol Plant. 2017;39(10):219. doi: 10.1007/s11738-017-2515-5 [DOI] [Google Scholar]
- 45. Aranjuelo I, Cabrera‐Bosquet L, Mottaleb SA, Araus JL, Nogués S. 13C/12C isotope labeling to study carbon partitioning and dark respiration in cereals subjected to water stress. Rapid Commun Mass Spectrom. 2009;23(17):2819‐2828. doi: 10.1002/RCM.4193 [DOI] [PubMed] [Google Scholar]
- 46. Huan L, Jin‐qiang W, Qing L. Photosynthesis product allocation and yield in sweet potato with spraying exogenous hormones under drought stress. J Plant Physiol. 2020;253:153265. doi: 10.1016/J.JPLPH.2020.153265 [DOI] [PubMed] [Google Scholar]
- 47. Ndengo NE, Lema A, Munseki K, Hanna R, Ngbolua K. Criblage de génotypes de manioc (Manihot esculenta Crantz) pour la résistance à la cochenille Africaine de racines et tubercules (Stictococcus vayssierei Richard) dans différentes zones agro‐écologiques de Beni (Nord Kivu, RD Congo). Int J Innov Appl Stud. 2016;16(1):210‐225. [Google Scholar]
- 48. de Bauw P, Birindwa D, Merckx R, et al. Improved genotypes and fertilizers, not fallow duration, increase cassava yields without compromising arbuscular mycorrhizal fungus richness or diversity. Mycorrhiza. 2021;31(4):483‐496. doi: 10.1007/S00572-021-01039-0 [DOI] [PubMed] [Google Scholar]
- 49. Carvalho LJCB. Storage root of cassava : Morphological types, anatomy, formation, growth, Development and Harvest Time. IntechOpen; 2018. doi: 10.5772/intechopen.71347 [DOI] [Google Scholar]
- 50. Steiner AA. A universal method for preparing nutrient solutions of a certain desired composition. Plant and Soil. 1961;15(2):134‐154. http://www.jstor.org/stable/42931931. doi: 10.1007/BF01347224 [DOI] [Google Scholar]
- 51. Slaets JIF, Resch C, Mayr L, et al. Laser spectroscopy steered 13C‐labelling of plant material in a walk‐in growth chamber. Rapid Commun Mass Spectrom. 2020;34(8):e8669. doi: 10.1002/rcm.8669 [DOI] [PubMed] [Google Scholar]
- 52. Werner RA, Brand WA. Referencing strategies and techniques in stable isotope ratio analysis. Rapid Commun Mass Spectrom. 2001;15(7):501‐519. doi: 10.1002/rcm.258 [DOI] [PubMed] [Google Scholar]
- 53. Bates D, Mächler M, Bolker BM, Walker SC. Fitting linear mixed‐effects models using lme4. J Stat Softw. 2015;67(1):1‐48. doi: 10.18637/JSS.V067.I01 [DOI] [Google Scholar]
- 54. Wickham H, Averick M, Bryan J, et al. Welcome to the Tidyverse. J Open Source Softw. 2019;4(43):1686 doi: 10.21105/JOSS.01686 [DOI] [Google Scholar]
- 55. El‐Sharkawy MA. Cassava biology and physiology. Plant Mol Biol. 2004;56(4):481‐501. doi: 10.1007/S11103-005-2270-7 [DOI] [PubMed] [Google Scholar]
- 56. Cayon MG, El‐Sharkawy MA, Cadavid LF. Leaf gas exchange of cassava as affected by quality of planting material and water stress. Photosynthetica. 1997;34(3):409‐418. doi: 10.1023/A:1006868219162 [DOI] [Google Scholar]
- 57. de Almeida SM, Zanetti S, Luiz Santos H, Melo Pereira LF. Nutritional status, yield components, and yield of cassava as influenced by phenological stages and water regimes. J Plant Nutr. 2021;44(19):2912‐2927. doi: 10.1080/01904167.2021.1927084 [DOI] [Google Scholar]
- 58. Rouphael Y, Cardarelli M, Schwarz D, Franken P, Colla G. Effects of drought on nutrient uptake and assimilation in vegetable crops. In: Plant Responses to Drought Stress: From Morphological to Molecular Features. Springer; 2012:171‐195. doi: 10.1007/978-3-642-32653-0_7 [DOI] [Google Scholar]
- 59. Howeler RH. Cassava mineral nutrition and fertilization. In: Hillocks RJ, Thresh JM, eds. Cassava: Biology, Production and Utilization. CABI Publishing; 2002:115‐148. doi: 10.1079/9780851995243.0115 [DOI] [Google Scholar]
- 60. Alves AAC, Setter TL. Response of cassava leaf area expansion to water deficit: Cell proliferation, cell expansion and delayed development. Ann Bot. 2004;94(4):605‐613. doi: 10.1093/AOB/MCH179 [DOI] [PMC free article] [PubMed] [Google Scholar]
- 61. Flexas J, Galmes J, Ribas‐Carbo M, Medrano H. The effects of water stress on plant respiration. Plant Respiration. 2005;10:85‐94. doi: 10.1007/1-4020-3589-6_6 [DOI] [Google Scholar]
- 62. Nikinmaa E, Hölttä T, Hari P, et al. Assimilate transport in phloem sets conditions for leaf gas exchange. Plant Cell Environ. 2013;36(3):655‐669. doi: 10.1111/PCE.12004 [DOI] [PubMed] [Google Scholar]
- 63. Turgeon R. The sink‐source transition in leaves. Annu Rev Plant Physiol Plant Mol Biol. 2003;40(1):119‐138. doi: 10.1146/ANNUREV.PP.40.060189.001003 [DOI] [Google Scholar]
- 64. Nguyen Tu TT, Biron P, Maseyk K, et al. Variability of 13C‐labeling in plant leaves. Rapid Commun Mass Spectrom. 2013;27(17):1961‐1968. doi: 10.1002/RCM.6650 [DOI] [PubMed] [Google Scholar]
Associated Data
This section collects any data citations, data availability statements, or supplementary materials included in this article.
Supplementary Materials
TABLE S1: Composition of the K+ (high potassium) nutrient solution
TABLE S2: Composition of the K– (low potassium) nutrient solution
TABLE S3: Potassium (K), calcium (Ca) and magnesium (Mg) concentrations found in the lower leaves after 1 week of water deficit. W+ and W– indicate plants at 100% or 50% of field capacity, respectively, during the period of imposed water deficit. K+ and K– are plants receiving high or low potassium nutrient solution, respectively. Values for treatment combinations (W+K+, W+K–,…) are presented as estimated marginal mean ± standard error, whereas P‐values of the ANOVA are given for each effect (Weffect, Keffect,…)
FIGURE S1:Variability of three separate leaf samples at (A) natural abundance and (B,C) enriched, ground by hand or ground by micro ball mill. Dots represent the means of six repetitions, whereas the error bar shows the standard deviation around the mean
FIGURE S2: Mean daily water content of the two watering treatments right before watering during the period of water deficit. Error bars show the standard deviation around the mean
Data Availability Statement
The data that support the findings of this study are available from the corresponding author upon reasonable request.