

Abstract
Many analytical challenges in biomedicine arise from the generally high heterogeneity and complexity of glycan‐ and glycoconjugate‐containing samples, which are often only available in minute amounts. Therefore, highly sensitive workflows and detection methods are required. In this review mass spectrometric workflows and detection methods are evaluated for glycans and glycoproteins. Furthermore, glycomic methodologies and innovations that are tailored for enzymatic treatments, chemical derivatization, purification, separation, and detection at high sensitivity are highlighted. The discussion is focused on the analysis of mammalian N‐linked and GalNAc‐type O‐linked glycans.
Keywords: glycomics, high sensitivity, mass spectrometry
Abbreviations
- 2‐AA
2‐ aminobenzoic acid
- 2‐AB
2‐aminobenzoamide
- APTS
9‐aminopyrene‐1,4,6‐trisulfonic acid
- CE
capillary electrophoresis
- DEN
dopant‐enriched nitrogen
- ESI
electrospray ionization
- FASP
filter‐based sample preparation methods
- FFPE
formalin‐fixed and Paraffin‐embedded
- FLD
fluorescence detection
- GirP
Girard's reagent P
- HILIC
hydrophilic interaction liquid chromatography
- IgG
immunoglobulin G
- IMS
ion mobility spectrometry
- LC
liquid chromatography
- LIF
laser induced fluorescence
- MALDI
matrix‐assisted laser desorption/ionization
- MS
mass spectrometry
- MSI
mass spectrometry imaging
- PCMF
post‐column make‐up flow
- PD
pharmacodynamic
- PGC
porous graphitized carbon
- PK
pharmacokinetic
- PSA
prostate‐specific antigen
- PVDF
polyvinylidene fluoride
- RFMS
RapiFluor‐MS
- RP
reversed phase
- SEC
size exclusion chromatography
- SPE
solid phase extraction
- TOF
time‐of‐flight
- UPLC
ultra‐performance liquid chromatography
1. INTRODUCTION
1.1. The need for high sensitivity glycomics
Glycoconjugates play a major role in a diverse range of complex biological processes including immune recognition of pathogens, cell–matrix and cell–cell interactions, cellular differentiation, and proliferation (Varki, 2017). Protein‐linked glycans which mainly occur as N‐linked and mucin‐type O‐linked glycans (Figure 1) are involved in directing intracellular protein trafficking and targeting, modulating protein‐protein interactions, and protein clearance. Next to the GalNAc‐linked O‐glycans, also other protein linked O‐glycans exist such as O‐fucose, O‐glucose, O‐N‐acetylglucosamine, O‐mannose, and O‐xylose (Figure 1) (Schjoldager et al., 2020). Moreover, additional glycan classes such as lipid‐linked glycans and glycosaminoglycans (Figure 1) are likewise involved in a range of biological processes such as inflammation, molecular signaling, cell proliferation, and tissue architecture (Puri et al., 2020; Zhang et al. 2019). The focus of this review will be on the most abundant mammalian glycan classes (N‐ and O‐GalNAc linked glycans).
Figure 1.

Major types of glycosylation on human cell membranes [Color figure can be viewed at wileyonlinelibrary.com]
In accordance with their multiple biological functions, glycans are implicated in most human diseases including cancer, autoimmune as well as cardiovascular and metabolic disorders (Reily et al., 2019; Rudman et al., 2019; Walt et al., 2012). Regarding the role of glycans in cancer, cellular transformation, and the development of cancer are associated with changes in the glycosylation, contributing to various disease processes including proliferation and metastasis (Pinho & Reis, 2015; Zhang, Ten Dijke, et al. 2020). Interestingly, most cancer biomarkers that are routinely detected in blood for diagnosis and prognosis are glycoproteins (e.g., prostate‐specific antigen for the early detection of prostate cancer), the same accounts for biomarkers used to monitor therapy treatment (e.g., carcinoembryonic antigen for various types of cancer) (Hanna‐Sawires et al., 2021; Kirwan et al., 2015).
In the field of biomedicine and biopharma, glycan analysis is relevant for many different purposes. Namely, most biopharmaceuticals are glycoproteins and often the glycan part has an impact on the biological activity. Consequently, characterization of the glycosylation of biopharmaceuticals is mandatory as glycans are considered to be critical quality attributes (Reusch & Tejada, 2015). For example, the absence of fucose in the N‐glycans of a therapeutic antibody may lead to a tremendous increase in antibody dependent cell‐mediated cytotoxicity (Chung et al., 2012). The availability of high‐throughput methods is, therefore, of high importance for clone selection, process development and lot release. Moreover, glycans on therapeutic glycoproteins often have an impact on safety, immunogenicity and pharmacokinetic/pharmacodynamic (PK/PD) behavior. Recently, there is an increasing interest in proteoform‐resolved PK analysis of biopharmaceuticals to assess the specific fates of different glycoforms. These analyses often come with formidable challenges due to the complexity of the biological matrices and the target molecules. In addition, often very limited amounts of material are available (Falck et al., 2021; Han et al., 2021).
On a genomic and transcriptomic level, various molecular analyses can be performed on large numbers of samples at ultrahigh sensitivity, for example at the single cell level or at the level of small cell populations (Aldridge & Teichmann, 2020). While proteomic and metabolomic analyses are lagging behind regarding throughput, sensitivity levels are being reached that enable the analysis of small cell populations down to single cells, providing valuable qualitative and quantitative information (Duncan et al., 2019; Fessenden, 2016; Slavov, 2021; Williams et al., 2020).
On the contrary, these sensitivity levels are only rarely reached for molecular glycomic analyses, such as in a proof‐of‐concept study that demonstrated single molecule glycan detection, visualization, and differentiation upon using mass spectrometry (MS) combined with electron microscopy detection for sample preparation, ionization and vacuum separation (Wu et al., 2020). Also, capillary electrophoresis laser‐induced fluorescence detection (CE‐LIF) of reducing‐end labeled glycans using highly fluorescent dyes has shown sensitivities compatible with single‐cell analysis (Whitmore et al., 2007). However, these high sensitivity approaches have not yet found their way into single molecule or single cell applications, in part due to the lack of throughput and suitable sample preparation methods.
Instead, glycomic signatures are often inferred from the transcriptomic analysis of “glycogenes” such as for the glycosyltransferases (Dusoswa et al., 2020; Nairn et al., 2008). In addition, cellular and tissue‐level glycomic signatures are often determined using glycan‐binding proteins in, for example, immunohistochemistry (Jeschke et al., 2005; Lenos et al., 2015), solid‐phase proximity ligation experiments (de Oliveira et al., 2018), or flow cytometry (Zhang, van Die, et al. 2020). These approaches, however, often do not provide detailed structural features of the glycan, implicating the need for high sensitivity and higher resolution glycomic methodologies that allow a comprehensive assessment of glycomic signatures.
In this review recent developments in the field of high sensitivity based glycomics are highlighted. High sensitivity MS glycomics builds on various innovations of the past few decades, including in‐gel enzymatic N‐glycan release followed by MS for the characterization of the N‐glycosylation of proteins as pioneered by Harvey and coworkers (Kuster et al., 2001; Wheeler & Harvey, 2001). Other important innovations involve simple sample preparation methods such as enzymatic N‐glycan release in combination with filter‐based micro dialysis desalting steps for facile characterization of N‐glycans by matrix‐assisted laser desorption/ionization (MALDI)‐MS or direct infusion electrospray ionization (ESI)‐MS (Wheeler et al., 2009). Here, we will provide a perspective on high sensitivity glycomics covering the analysis of not only released glycans but also glycopeptide‐based glycoproteomics and intact glycoprotein analysis by MS (Figure 2).
Figure 2.

Various analyte classes that can be studied in glycomic research [Color figure can be viewed at wileyonlinelibrary.com]
2. NON‐MS BASED APPROACHES
Flow cytometry, using glycan‐binding proteins such as plant lectins and monoclonal antibodies, is often applied for non‐MS‐based glycosylation analysis of cells. In cases where, for example, human lectins are used, the data may have direct implications for cellular interactions relying on these glycans, making these types of studies highly relevant in the context of, for example, microbial and cellular glycoimmunology and cancer glycobiology (Holst et al., 2017). Similarly, lectin arrays—be it slide‐based or bead‐based—are applied to type the glycosylation of glycoproteins in biopharma (Roucka et al., 2016) and biomedicine (Jegouzo et al., 2020; Pilobello & Mahal, 2007).
To deduce the glycomic makeup of a cell, the cellular glycosylation can be characterized using transcriptomic signatures (Bennun et al., 2013). However, protein glycosylation is a complex and multifactorial process which is not only influenced by enzyme activity but also by substrate availability as well as the competition between them (Varki, 2017). Moreover, the regulatory mechanisms are still poorly understood, even for the best‐studied model proteins including immunoglobulin G (IgG) (Klarić et al., 2020).
The gold standard method for glycan fluorescence detection is hydrophilic interaction liquid chromatography (HILIC) of 2‐aminobenzamide (2‐AB)‐labeled glycans which exhibits limited sensitivity (typical limits of detection are low femtomole quantities of glycans on column; Table 1) (Wuhrer et al., 2004). In contrast, CE‐LIF detection is a highly sensitive method for the detection of labeled glycans reaching down to yoctomole levels (Table 1) (Whitmore et al., 2007), albeit this was not embedded in an analytical workflow. Previously, sensitivities have been reported in the low attomole range (Guttman, 1996), relying on the 9‐aminopyrene‐1,4,6‐trisulfonic acid (APTS) tag (Table 1) or related tags with multiple negative charges. However, it should be noted that, while CE is able to provide high sensitivity, the sensitivity of the overall workflow is often confined by the limited sample amount being injected and consumed for the analysis. The sample volume that is needed to perform the analysis is generally in the range of a few microliters of which only low nanoliter volumes are consumed (Lageveen‐Kammeijer et al., 2019). This often results in the consumption of <2% of the total sample volume, this could be considered as a disadvantage of the platform. On the other hand, samples can be reanalyzed on the same platform or even by different platforms.
Table 1.
Overview of glycome profiling tools
| Glycome profiling tool | Analytes | Sensitivity | Advantages | Disadvantages | Reference |
|---|---|---|---|---|---|
| Released glycans | |||||
| Non‐MS based | |||||
| CE‐LIF | Glycosphingolipid | Mid ymol |
Ultrahigh sensitivity High throughput Short analysis time High dynamic range Isomeric separation Small sample volume |
Indirect structural information Labeling necessary Small sample volume requires sensitive detection |
Whitmore et al. (2007) |
| CGE‐LIF | APTS‐labeled | Low amol |
High sensitivity Separation of isomeric species |
High sample volume (~3 µl) needed | Guttman (1996) |
| DNA sequencer | APTS‐labeled | Low fmol |
High sensitivity Isomeric separation Short analysis time |
Callewaert et al. (2001) | |
| HILIC‐UPLC‐FLD | 2‐AB | Low fmol |
High dynamic range Isomeric separation Database availability |
Low to medium throughput Labeling advantageous |
Wuhrer et al. (2004); Royle et al. (2002); Rudd and Dwek (1997) |
| MS‐based | |||||
| CE‐MS—DEN gas | Negative mode (APTS labeled) | Not defined |
High sensitivity Isomeric separation |
High volume (~3 µl) needed Low throughput Labeling needed |
Marie et al. (2021) |
| Positive mode (glycan standard; GirP labeled) | Low amol | Lageveen‐Kammeijer et al. (2019) | |||
| nanoRPLC‐MS | Positive mode | Mid amol | Short analysis time | Medium throughput | Unpublished |
| nanoLC‐PGC‐MS—DEN gas | Negative mode (glycan standard) | Mid fmol |
Isomeric separation Diagnostic ions |
Extensive sample preparation Low throughput Labeling needed |
Madunic et al. (2021) |
| MALDI‐TOF‐MS | Positive mode (glycan standard) | Mid fmol |
Small sample volume Distinction of sialic acid isomers (derivatization) High throughput |
Lageveen‐Kammeijer et al. (2019) | |
| MALDI‐MSI | Negative mode (glycan standard) | Low fmol | Diagnostic ions (neg mode) | Low throughput | Heijs, Potthoff, et al. (2020) |
| Positive mode (glycan standard) | Mid amol | Heijs, Potthoff, et al. (2020) | |||
| MALDI‐2 (MSI) | Negative mode (glycan standard) | Low amol | Diagnostic ions (neg mode) | Low throughput | Heijs, Potthoff, et al. (2020) |
| Glycopeptide analysis | |||||
| MS based | |||||
| CE‐MS—DEN gas | Positive mode (IgG glycopeptides) | Low amol | Distinction of sialic acid isomers |
High volume (~3 µl) needed Low throughput |
Kammeijer et al. (2016) |
| nanoLC‐MS | Positive mode (IgG glycopeptides) | Low fmol | Low throughput | Kammeijer et al. (2016) | |
A variety of different hardware setups exist, including DNA analyzer platforms used for glycan analysis and chip‐based solutions (Ruhaak et al., 2010; Sarkozy et al., 2020). Providing high‐throughput applications, either due to multiplexing (e.g., DNA analyzer platforms) (Ruhaak et al., 2010) or due to very short run times of only several minutes (Zhuang et al. 2007). CE‐LIF can achieve similar precision (Reiding et al., 2019) as HILIC with fluorescence detection (FLD), making it a very attractive method for non‐MS‐based high sensitivity glycomics.
3. MS GLYCOMICS: SAMPLE PREPARATION
Next to the choice of a suitable detection method, the choice of an appropriate, sensitive sample preparation method is key for achieving high sensitivity workflows. Characteristics of such sample preparation workflows are miniaturization and the minimization of losses by diminishing the number of (sample handling) steps. Also, to achieve ultimate sensitivity of the overall workflow, it is desirable that a large portion of the prepared sample can be used for detection/analysis. Miniaturization generally also facilitates multiplexing (e.g., sample preparation in a 96‐ or 384‐well plates) and tends to speed up and simplify the sample preparation procedures. For example, tedious vacuum centrifugation steps can be replaced by a simple evaporation step (Váradi et al., 2014). In the following section we will discuss several key aspects of high sensitivity glycomics sample preparation methods, with a focus on glycomic methods and their corresponding clean‐up steps.
3.1. Glycoprotein immobilization
Immobilization of glycoproteins is an important aspect of many N‐ and O‐glycan sample preparation methods. This includes covalent immobilization of glycoproteins on beads (Yang et al., 2017) and, the more widely used procedure, immobilization of proteins on polyvinylidene fluoride (PVDF) membranes (Jensen et al., 2012). Both approaches are scalable by adjusting the number of beads and the size of the membrane piece. Immobilization on the PVDF membranes may be in part confounded by the presence of detergents in the sample, as the detergent coats the membrane and prevents adsorption of the protein, reducing its immobilization. Especially in the case of minute amounts, the ionic detergent decreases the protein binding (e.g., sodium dodecyl sulphate [SDS]; unpublished data). Immobilization on beads is often achieved using amine‐targeting chemistry and buffers, containing ammonia or primary amines which interfere with the immobilization. Glycoprotein immobilization allows solid‐phase glycan derivatization with facile cleanup (Yang et al., 2017) and enzymatic N‐glycan release, eventually followed by O‐glycan release applying reductive beta‐elimination (Jensen et al., 2012).
3.2. Glycan release
To study the glycosylation of biospecimens, various techniques are available that either chemically or enzymatically release the glycans from their conjugates. Before the release, the tremendous glycan heterogeneity of a conjugate should be considered, including its macro‐ (site occupancy) and microheterogeneity (variation of glycans at a specific site). For example, it should be investigated whether the release can be performed in a nonselective manner, introducing no alterations of the glycan moiety, and providing a representative profile of the conjugate. Often an enzymatic approach is selected, that enables the release of N‐glycans in‐solution, with PNGase F being the most commonly used enzyme for mammalian samples. This enzyme exhibits a wide specificity, yet an α1,3‐linked core fucose will not be accepted, which is commonly found in, for example, plants and insects. In general, only 5 up to 10 microliter of serum/plasma as starting material is required (approximately 70 microgram of protein content per microliter) to obtain a representative glycomic profile for most MS platforms (Adua et al., 2021; Reiding et al., 2019; Vreeker et al., 2018).
While a wide repertoire of additional enzymes is available for the release of N‐glycans, the possibilities of releasing O‐linked glycans remain limited (Karlsson et al., 2017; Mulagapati et al., 2017; Wilkinson & Saldova, 2020). While several enzymes are now commercially available, they often show a restricted specificity (e.g., only core 1 and 3 O‐glycans) limiting their applicability. Instead, a chemical release is often selected, such as hydrazinolysis or beta‐elimination, but these procedures generally degrade the protein, may affect glycan integrity, require hazardous chemicals and often involve extensive clean‐up steps (Merry & Astrautsova, 2003; Wilkinson & Saldova, 2020).
Hinneburg et al. (2017) presented a highly sensitive method to simultaneously release N‐ and O‐glycans from a tissue section. In addition, they demonstrated that only 2,000 cells from formalin‐fixed and paraffin‐embedded (FFPE) sections were required to obtain reliable and quantitative glycomic profiles using laser capture microdissection (Hinneburg et al., 2017). With this workflow distinct glycan expressions were found between tumor (hepatocellular carcinoma) and nontumor (noncancer hepatic tissue) tissues and revealed that similar glycomic profiles could be obtained for unstained versus hematoxylin and eosin stained FFPE tissues. However, slight differences were noted for the glycomic profiles when fresh frozen tissues were used. Another protocol, published by the Lebrilla lab (Li et al., 2020), demonstrated that, next to the sequential release of N‐ and O‐glycans, also the glycan head groups of glycosphingolipids can be characterized by using the same enriched membrane fraction. To allow a comprehensive analysis of all these analyte classes by liquid chromatography (LC)‐MS, the workflow requires around one million cells as starting material. It should be noted that before cell membrane extraction, lysis of the cells and tissues is required.
3.3. In‐gel N‐glycan release
In cases where limited sample amounts are available, or when further purification is desired, N‐glycan release could be performed by using an in‐gel N‐glycan release. This method was pioneered by Kuster et al. (1997) building on the success of in‐gel proteomics sample preparation. An important breakthrough paving the way for the success of MS‐based proteomics was the establishment of in‐gel protease digestion as a sample preparation technique (Shevchenko et al., 1996; Wilm et al., 1996). This was a key step because it brought together a workhorse protein separation technique in biology (SDS gel electrophoresis) and MS (a sensitive and multianalyte detection system). The idea was soon thereafter extended to release N‐glycans from gel‐separated proteins using PNGase F (Kuster et al., 1997, 1998; Wheeler & Harvey, 2001) which improved sample preparation along several lines at once. Glycan analysis is generally performed on a pure protein to reveal protein‐specific glycosylation profiles. Given that most glycoproteins are integral plasma membrane proteins, the use of detergents is often mandatory for efficient extraction. Detergents are, however, generally incompatible with MS detection. In addition, membrane protein purification by chromatographic or other methods remains difficult which often means that a particular glycoprotein of interest cannot be purified to homogeneity. The use of sodium dodecyl sulphate polyacrylamide gel electrophoresis (SDS‐PAGE) as a sample preparation step solves both issues at the same time. Gel electrophoresis tolerates samples of practically any buffer composition and provides an additional, standardized step of protein purification. Gels are also safe containers for proteins, which allow the efficient removal of any buffer component that may interfere with downstream sample derivatization or analytical techniques. In‐gel N‐glycan release also improved the overall sensitivity of the analytical workflow as quantities in the range of 1 up to 100 microgram protein were sufficient to obtain N‐glycan profiles (Clark et al., 1999; Kuster et al., 2001, 2000; Rudd et al., 1999). Further advantageous features of the in‐gel deglycosylation method include the fact that protein identification by standard proteomic approaches can still be performed efficiently, including N‐glycan site localization when considering the Asn‐Asp conversion that comes with PNGase F digestion. The latter may be further aided by releasing the glycans in the presence of 50% 18O‐labeled water to leave a characteristic isotopic signature that can be recognized by MS (Kuster & Mann, 1999; Liu et al., 2010). Even if the focus of the analysis is the protein and not the glycans, in‐gel deglycosylation can be a powerful step as it removes the often‐large glycan “shield” that could render tryptic cleavage sites due to inaccessibility to the protease. One of the downsides of the approach is that it does not reveal site‐specific N‐glycan patterns. Moreover, the assumption that the band is “clean” and only contains a single protein may often not be justified, as proteins with similar properties would comigrate. If in‐gel deglycosylation is performed on such a band, a total glycan profile would be obtained, and it cannot be distinguished whether a specific glycan is corresponding to the protein of interest or another comigrating protein. However, this may be mitigated by a proteomic analysis of the same sample that estimates how much of the total protein in a particular gel band is represented by the protein of interest. SDS‐PAGE is also difficult to scale‐up which is mostly a minor issue given the continuous thrive for working with rare biological material. These shortcomings aside, the method has been adopted rapidly by the field (Duarte et al., 2021; Royle et al., 2003; Rudd et al., 1999). Because ultra‐performance liquid chromatography (UPLC)‐FLD, MALDI‐time‐of‐flight (TOF)‐MS and nanoESI‐TOF‐MS/MS show considerable orthogonality, their integration for N‐glycosylation analysis of gel‐separated proteins proved highly valuable (Ritchie et al., 2010). In‐gel N‐glycan release may be combined with sialic acid derivatization and MALDI‐TOF‐MS analysis after sialic acid stabilization (von der Ohe et al., 2002). With the use of specific sialic acid derivatization workflows, sialic acid linkage differentiation can be achieved (Bieberich, 2014; Marti Fernandez et al., 2019; Stavenhagen et al., 2018). The approach is versatile and has been applied to Coomassie‐stained protein bands in SDS‐PAGE using fluorescent labeling and HILIC‐HPLC‐FLD or CE‐LIF, optionally combined with an array of exoglycosidase treatments for glycan sequencing (Aghamohseni et al., 2014; Royle et al., 2007; Schwarzer et al., 2008). In‐gel N‐glycan release has also been applied to 2D‐gel electrophoresis revealing differential glycosylation of charge‐resolved haptoglobin proteoforms (He et al., 2006). Another valuable addition is negative‐mode nanoESI‐TOF‐MS/MS as the tandem mass spectra often allow the dissection of N‐glycan structures (Chandler et al., 2014; Harvey et al., 2008). Recently, in‐gel enzymatic N‐glycan release has successfully been combined with a high‐sensitivity glycoanalytical workflow including linkage‐specific sialic acid derivatization, Girard's reagent P labeling and capillary electrophoresis mass spectrometry (CE‐MS; Duarte et al., 2021).
While in‐gel N‐glycan release has its place, it should be noted that in‐gel trypsin digestion followed by bottom‐up glycoproteomic workflows is gaining importance in the glycosylation analysis of gel‐separated proteins (Duarte et al., 2021; Rodrigues et al., 2021). Yet, released N‐glycan analysis has a role as it often allows a more thorough analysis of the glycan structure as compared to glycopeptide analysis, in particular when powerful glycan separation and tandem MS approaches such as porous graphitized carbon (PGC)‐LC‐MS/MS are applied (Stadlmann et al., 2008; Wuhrer, 2013). As an alternative, in‐gel hydrazinolysis may be applied for chemical release of N‐glycans (He et al., 2006), followed by fluorescent labeling and HPLC‐FLD. The approach features, surprisingly, good sensitivity with high‐quality glycosylation profiles achieved with as little as one microgram of human IgG. Due to the suitability of hydrazinolysis for the release of O‐glycans next to N‐glycans, in‐gel hydrazinolysis has potential for a more comprehensive glycosylation profiling of gel‐separated proteins at the released glycan level.
Glycomic analysis of gel‐separated proteins has alternatively been demonstrated after electroblotting onto a PVDF membrane via spatially resolved N‐glycan release and on‐membrane MALDI‐TOF‐MS (Kimura et al., 2007). Interestingly, the approach allowed multiplexing by applying a range of different enzymes in parallel, including PNGase F and trypsin, supporting parallel glycomic and proteomic characterization of individual protein spots in 2D‐gel electrophoresis. While the approach has not been followed up a lot, it may have potential when integrated with recent glycomic MS imaging (MSI) workflows (see Section 4.5). Wilson et al. (2002) similarly used 2D‐gel electrophoresis with electroblotting for glycomics analysis, applying sequentially PNGase F treatment and reductive beta‐elimination for N‐ and O‐glycan release, followed by PGC‐LC‐MS/MS, achieving the charge isoform‐resolved, comprehensive glycomic characterization of various major human plasma glycoproteins.
Filter‐based sample preparation methods which are widely used in proteomics (Wiśniewski et al., 2009) are also are amenable for high sensitivity N‐glycomics analyses (Abdul Rahman et al., 2014; Feng et al., 2019; Hecht et al., 2015) as well as the analysis of proteoglycans applying, for example, chondroitinase ABC (Sethi et al., 2020).
3.4. Labeling procedures
To facilitate glycan detection after the usage of separation platforms such as CE or LC, often a chromophore or fluorophore is introduced. Specific derivatization strategies may also help to improve sensitivity in MS detection, such as the addition of a charged group at the reducing end or by increasing the hydrophobicity and stabilizing the sialic acid residues through permethylation. Moreover, dependent on the labeling type, this may facilitate structural elucidation by improving fragmentation of the analyte. Zhou et al. (2017) recently compared the analysis of released glycans after reduction, permethylation, and the application of various reducing‐end tags (Figure 3). A gain in intensity is observed when a tag is added to the reducing end and when the hydroxyl groups are derivatized compared to the MS analysis of reduced N‐glycans. However, sample loss might occur due to incomplete reactions that are associated with the labeling procedure, especially for the low abundant glycans. Overall, the usage of charged tags (RapiFluor‐MS; RFMS (Lauber et al., 2015) or procainamide) provided the highest sensitivity for nonsialylated glycan analysis (Figure 3B). While permethylation was found to outperform these approaches when sialylated species are of interest (Figure 3C), indicating the importance of stabilization of sialic acid and removal of the associated negative charge.
Figure 3.
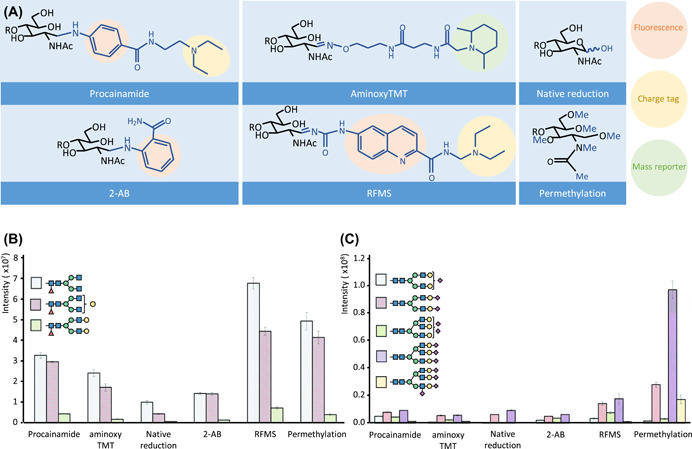
Overview of selected glycan derivatization approaches. (A) representation of different derivatization products; R, 4‐linked saccharide. Bar graphs illustrate the observed intensities of differently derivatized glycans released from (B) IgG and (C) fetuin analyzed by LC‐MS. Adapted from (Zhou et al. 2017) with permission from The Royal Society of Chemistry. LC‐MS, liquid chromatography mass spectrometry [Color figure can be viewed at wileyonlinelibrary.com]
Permethylated glycans show very favorable ionization properties in ESI and MALDI, like other relatively hydrophobic analytes. In ESI, both proton and sodium adducts of permethylated glycans are readily formed (Ashline et al., 2017; Cho et al., 2020), while sodium adducts prevail in MALDI‐MS (Zhong et al. 2018). Permethylation together with liquid‐liquid extraction or reversed phase (RP)‐solid phase extraction (SPE) represents an efficient clean‐up step for MS analysis of glycans, corresponding workflows are well established and have been adapted to the 96‐well plate format (Shajahan et al., 2019; Shubhakar et al., 2016). It should be noted that the usage of liquid‐liquid extraction (as purification method) results in a loss of hydrophilic analytes, such as sulphated O‐glycans. The full benefit of the very high sensitivity of the MS detection of permethylated glycans is not realized in biomedical and biopharma applications, as the sample preparation still requires considerable amounts of glycans and glycoconjugates. Hence, innovation and particularly miniaturization of permethylation sample preparation is seen as a key point for realizing ultrahigh sensitivity workflows. A recent publication on the use of carbon nanoparticles for an SPE cleanup of permethylated glycans before MALDI‐MS provides a promising perspective (Zhong et al. 2018). However, it should be noted that permethylation also comes with its downsides such as rather time‐consuming protocols, the usage of toxic reagents and, as with most derivatization procedures, potential by‐products that increase sample heterogeneity.
Over a decade ago, it was demonstrated by Naven and Harvey that a ten‐fold increase in MALDI‐MS sensitivity could be obtained compared to underivatized glycan detection when a cationic reducing‐end label was introduced through hydrazone formation (Naven & Harvey, 1996). One of the major advantages of this procedure is that no additional clean‐up procedures are required as, during the reaction, no salts are used or produced, allowing immediate analysis of the sample. An overview is provided of hydrazone‐based reducing end labeling procedures for MS analysis by Lattová and Perreault (Lattová & Perreault, 2013). Next to derivatizing the reducing end of the glycan, recent studies focused on the stabilization of the sialylated species. This allows the distinction between differently linked sialic acids, next to an improved detection level in positive ionization mode (de Haan et al., 2020; Pongracz et al., 2019).
3.5. Glycoproteomics
To gain a better understanding of the fundamental role of glycans and glycoconjugates, glycoprotein‐based approaches are required, providing insights in the macro‐ and microheterogeneity of protein glycosylation as well as integrating the glycomics and proteomics fields. For this purpose, general bottom‐up proteomics workflows are often applied by performing a proteolytic digest. In cases where a specific nonabundant protein is targeted from a complex biological sample, the sensitivity can be increased by introducing a depletion or immunoaffinity step (e.g., SDS‐PAGE or immunoaffinity) for removing the most abundant proteins or to selectively capture the protein of interest, respectively (Ruhaak et al., 2018). Additional glycopeptide enrichment strategies, such as HILIC‐SPE, are often applied as glycopeptides often occur in substoichiometric quantities due to glycosylation microheterogeneity and tend to ionize less efficiently compared to most other peptides (Stavenhagen et al., 2013). Due to the various advancements that have been made regarding sample preparation procedures as well as technical improvements the glycoproteomics field is rapidly evolving (Riley et al., 2021; Thomas & Scott, 2021).
3.6. Clean‐up steps
3.6.1. Porous graphitized carbon solid‐phase extraction (PGC‐SPE)
PGC‐SPE is regularly used for glycan clean‐up, and often facilitates the separation between neutral and acidic glycans (Packer et al., 1998; Stavenhagen et al., 2015). Next to ready‐to‐use PGC cartridges, miniaturized PGC‐SPE devices are applied in high sensitivity glycomics, including self‐packed micro‐SPE devices in, for example, pipette tips with filters (Delafield & Li, 2020; Xin et al., 2012). Commercial Hypercarb™ PGC SPE 96‐well plates (Thermo Fisher Scientific) come in different sizes ranging from 10 to 100 mg bed weight, but miniaturized versions are self‐prepared on 96‐well plate filter plates using bulk PGC material (Zhang, Madunić, et al. 2020). While monosaccharides often show insufficient retention for PGC purification, disaccharides tend to be at least partially retrieved by PGC‐SPE, most common glycomic PGC‐SPE applications target glycans as opposed to mono‐ and disaccharides. Large multiantennary glycans with multiple LacNAc repeats, sialic acids as well as other negative charges (in particular glycopeptides) can be hard to elute from PGC and hence may be poorly covered in workflows including PGC‐SPE (Stavenhagen et al., 2015). Elution of glycans from PGC is generally achieved in an MS‐compatible manner, with acetonitrile‐water mixtures which optionally contain a volatile acid (formic acid or trifluoroacetic acid) to facilitate the elution of acidic glycans (Packer et al., 1998).
3.6.2. Hydrophilic interaction liquid chromatography
HILIC is highly suitable for glycan and glycoconjugate purification, due to the hydrophilic character of the glycan moiety, which can be applied as an enrichment step before analysis or as a chromatography mode for LC (see Section 4.2). A range of different stationary phases is available including amine‐based stationary phases which show under low ionic strength conditions mixed‐mode retention with a contribution of ionic interactions (Wuhrer et al., 2009). HILIC stationary phases that do not retain, based on ionic interactions, are, for example, amide‐ and diol‐functionalized beads, polyacrylamide‐based beads as well as cellulose‐based materials such as microcrystalline cellulose and cotton (Wuhrer et al., 2009). Microcrystalline cellulose can be packed as a slurry in columns of different sizes and can, for example, be packed in 96‐well plates for miniaturized SPE. Cotton can be used in the form of cotton wool (Selman et al., 2011) or cotton thread (Vreeker et al., 2018). The latter one is particularly suitable for preparing micro‐SPE devices in pipetting tips on a robotics platform in high‐throughput mode (Vreeker et al., 2018). Overall, HILIC‐SPE is often applied for the purification of glycans, glycan alditols, many different reducing end‐tagged glycans, and glycopeptides. While the aglycons are modulating HILIC retention, an efficient HILIC enrichment can often be achieved by minor adjustments of the loading and washing conditions, for example, change of organic solvent or concentration (Mysling et al., 2010). Due to the hydrophilic environment, it might be challenging to enrich via HILIC when large, hydrophobic aglycons are present—be it fluorescence tags or peptide portions—as they may results in solubility issues during loading, washing and elution steps. It should be noted that for glycoproteomic applications hydrophilic non‐glycosylated peptides can be coenriched (Mysling et al., 2010).
3.6.3. Reverse phase solid‐phase extraction (RP‐SPE)
RP‐SPE can be used for clean‐up after reducing end‐labeling (Ruhaak et al., 2010) or for purification of glycoconjugates such as glycolipids and glycopeptides. In glycolipid analysis, the enzymatic release of the glycan head group is often followed by a RP‐SPE step for removing ceramides and detergents, retrieving the released glycans in the flow‐through (Jongsma et al., 2021). RP‐SPE is applicable in a broad range of dimensions, and there are various miniaturized formats available such as ZipTip® Pipette Tips (Merck Millipore) which are particularly suitable for sample cleanup before MS analysis.
4. MS GLYCOMICS: INTEGRATED WORKFLOWS
4.1. Capillary electrophoresis mass spectrometry
CE‐MS is a powerful technique when it comes down to sensitivity. Just recently a study reported on the sheathless‐based CE‐MS detection of sialic acid‐derivatized N‐glycans labeled with Girard's reagent P (GirP) (Lageveen‐Kammeijer et al., 2019). The workflow relies on an established, single pot sialic acid derivatization chemistry that allows to differentiate sialic acid linkages and is a further development of a protocol originally described by Wheeler et al. (2009). Sialic acid derivatization is followed by a simple, miniaturized cotton HILIC SPE step performed using a cotton thread of several 100 microgram as stationary phase, with elution of the derivatized glycans in 10 microliter of water (Reiding et al., 2016). An aliquot of the eluate is then used for single‐step GirP derivatization followed by CE‐MS analysis. For CE‐MS, the use of a sheathless porous capillary sprayer comes with excellent sensitivity and reasonable robustness for glycan analysis. An important aspect in boosting sensitivity is the use of dopant‐enriched nitrogen (DEN) gas to promote ionization of labeled glycans. While this approach has previously been established for the analysis of glycopeptides (Kammeijer et al., 2016), it is similarly powerful for the ESI analysis of glycans. For CE‐MS, a hardware adaptation was induced in the form of a tube concentrically surrounding the spray tip for directing the DEN gas flow. The sensitivity gain by implementing DEN gas is approximately three‐fold for N‐glycans (Lageveen‐Kammeijer et al., 2019) and 25‐fold for model glycopeptides (Kammeijer et al., 2016). Overall, the method shows an excellent sensitivity of the final CE‐MS glycan detection step, with low attomole amounts of glycans being detected (Figure 4 and Table 1), mainly due to the miniaturized ESI setup featuring favorable ionization conditions. For the overall workflow, likewise, a very high sensitivity is achieved, with five femtomole of a protein‐linked glycan species present in the glycoprotein starting material allowing confident MS detection and relative quantification (Lageveen‐Kammeijer et al., 2019). Another recent publication, by the Ivanov group, demonstrated that the implementation of this DEN gas was also beneficial for the analysis of APTS‐labeled glycans measured in negative mode (Marie et al., 2021). For this purpose, isopropanol was selected as the most suitable dopant, resulting in an approximately 100‐fold increase in sensitivity, allowing the detection of glycans in extracellular vesicles from <500 nanoliter of blood (injected amount) and reporting on the identification of more than 400 N‐glycan structures.
Figure 4.

Sensitivity assessment of sheathless CE‐ESI‐MS analysis of glycans using DEN gas. Glycans were subjected to a glycomic workflow including derivatization (dimethylamidation) and reducing‐end labeling with GirP using a starting amount of 5 femtomole. (A) Extracted ion electropherograms of the glycan standards (H3N4 and H5N4) with a consumed amount of 20 attomole. Spectra of the doubly charged analytes corresponding to H3N4 and H5N4are illustrated in (B) and (C), respectively. GirP illustrates the label attached to the glycans. Figure adapted with permission from Lageveen‐Kammeijer et al. (2019). Copyright © 2019. DEN, dopant‐enriched nitrogen; GirP, Girard's reagent P [Color figure can be viewed at wileyonlinelibrary.com]
Recently, the CE‐MS detection of APTS‐labeled glycans has been improved by allowing high sensitivity fluorescence detection in the Taylor cone (Figure 5) (Szarka et al., 2019). This very promising innovation improves the sensitivity using the fluorescence detection at the Taylor cone (Figure 5E) compared to the detection in capillary‐scale flow chambers (Figure 5C). One may assume that the fluorescence detection in the Taylor plume would likewise be an elegant solution for the combination with MS detection in nanoLC mode.
Figure 5.

CE‐MS separation of APTS labeled IgG1 N‐glycans hyphenated with fluorescence detection. A schematic representation of the setup for iLIF detection at the Taylor cone of CE‐ESI‐MS is provided in (A), and a magnification of the situation at the Taylor cone is given in (B). (C) and (E) provide the fluorescence signal obtained at the capillary tip and in the Taylor cone, respectively. The inserts indicate the observed fluorescent signal and blue highlights the electropherogram region. (D) and (F) illustrate the obtained MS signal in negative ionization mode. Extracted ion electropherograms of the most abundant N‐glycans in human IgG1 are depicted in (F). Figure adapted with permission from (Szarka et al., 2019). Copyright © 2019, American Chemical Society. APTS, 9‐aminopyrene‐1,4,6‐trisulfonic acid; iLIF, imaging laser‐induced fluorescence [Color figure can be viewed at wileyonlinelibrary.com]
4.2. HILIC‐ and RP‐LC‐MS of tagged glycans
The LC‐MS detection of fluorescently labeled glycans likewise showed a major push towards high sensitivity detection. Next to CE‐LIF, HILIC‐UPLC‐FLD is one of the most applied separation principles for detection of fluorescently labeled glycans (Reusch et al., 2015). An important aspect determining sensitivity is the choice of the tag—both for fluorescence and MS detection (Pabst et al., 2009).
In terms of coupling chemistry, the most common tags used for HILIC fall into two groups: conventional tags such as 2‐aminobenzoic acid (2‐AA), 2‐AB, APTS and, more recently, tags through reductive amination such as procainamide (Kozak et al., 2015; Ruhaak et al., 2010). Of those, APTS shows very high fluorescence sensitivity (Pabst et al., 2009), yet its use for high sensitivity applications can be compromised by sometimes only mediocre labeling yields. While APTS is mostly used for CE applications, it is also very much suitable for HILIC with FLD. For MS detection APTS is a very challenging label, and despite its highly acidic nature ESI‐MS detection of tagged glycans is generally performed in positive‐ionization mode (Bunz, Cutillo, et al., 2013; Bunz, Rapp, et al., 2013). 2‐AA and 2‐AB are both performing similarly well in positive‐ion mode MS detection, with 2‐AA likewise allowing sensitive negative‐mode detection in both MALDI‐ and ESI‐MS applications (Anumula & Dhume, 1998; Ruhaak et al., 2008; Reiding et al., 2017).
An alternative group of tags that are specifically used for N‐glycan analysis are the amine‐reactive reagents which are targeting the glycosyl amine that is generated by PNGase F‐mediated release of N‐glycans (Lim et al., 2019). These tags (e.g., RFMS and procainamide; Figure 3) often combine fast, facile workflows with high sensitivity in fluorescence and MS detection (Keser et al., 2018). The sensitivity gain, relative to the gold standard 2‐AB tag, has been reported to be approximately four‐fold in FLD and more than 50‐fold in MS detection (Keser et al., 2018). Although these gains may strongly depend on the chosen analytical platforms and settings. These tags are largely used in biopharma applications, where the high sensitivity is not per se needed, as sample amounts are hardly ever limiting, and the fast, mild, and facile sample preparation might be more important. Nonetheless, these tags may also have major potential for biomedical research applications.
While the solvent mixtures used for N‐glycan elution are often favorable for online ESI‐MS detection (low concentrations of volatile acid or salt, high concentrations of acetonitrile), the column dimensions and flow conditions prohibit to operate at its highest‐sensitivity for MS detection: oftentimes, analytical‐scale or microbore separations are performed, and miniaturization of HILIC‐FLD‐MS or HILIC‐MS of N‐glycans to the capillary‐scale or nano‐scale is seldomly achieved (Wuhrer et al., 2004, 2004); this may be due to a lack of commercially available columns, as well as the often limited robustness and separation performance of these setups.
When pushing HILIC‐FLD or HILIC‐MS detection of reducing end‐labeled glycans towards high sensitivity, miniaturization, and reduction of the complexity of the workflow become important factors. An established, miniaturized and multiplexed workflow for the analysis of 2‐AA‐labeled glycans relies on a single HILIC‐SPE cleanup step (Ruhaak et al., 2008). By moving to nanoRP‐LC‐MS as a higher‐sensitivity detection method, this workflow becomes suitable for the analysis of minute sample amounts, as discussed in a recent review on RP‐separation methods for glycan analysis (Vreeker & Wuhrer, 2017). In RP‐LC‐MS, elution conditions are often favorable for MS detection for late‐eluting analytes, while early eluting peaks may show somewhat lower sensitivity in MS detection due to low organic modifier content in the eluent. The analysis of 2‐AA‐labeled glycans by nanoRP‐LC‐MS separation with a qTOF‐MS detection system employed with DEN gas featured an approximately 100 times higher sensitivity than HILIC‐FLD using a 2 mm column ID setup, with the sensitivity of the nanoRP‐LC‐MS setup being in the attomole range (Table 1), while FLD showed low femtomole sensitivity (unpublished results).
4.3. Porous graphitized carbon liquid chromatography mass spectrometry (PGC‐LC‐MS)
A particularly versatile approach for the in‐depth structural characterization of a broad range of glycans is PGC‐LC‐MS and has been pioneered by Packer et al. (1998). Compared to other platforms, PGC‐LC‐MS has several advantageous features: the PGC stationary phase shows outstanding glycan isomer separation, particularly in the case of glycans and glycoconjugates with only a small aglycone (Ruhaak et al., 2009). Often anomer separation is observed for reducing‐end glycans, resulting in rather complex chromatograms (Xu et al., 2020). The complexity can be reduced by analyzing glycan alditols (obtained after reduction) as they feature migration patterns that are not further influenced by anomer separation (Jensen et al., 2012; Zhang, Madunić, et al., 2020). Therefore, PGC‐LC‐MS is often used for the analysis of glycan alditols. PGC‐LC‐MS shows extensive isomer separation for N‐glycans, O‐glycans and glycosphingolipid‐derived glycans (Anugraham et al., 2015; Jensen et al., 2012; Zhang, van Die, et al., 2020; Zhang, Madunić, et al., 2020), thereby, considerably enhancing the MS structural elucidation of glycans. PGC‐LC‐MS is a particularly good match with the analysis of O‐glycan alditols (product of reductive beta‐elimination), due to its excellent separation power of isomeric species resulting in obtaining glycan profiles with high structural diversity (Madunic et al., 2021). For N‐glycans and glycolipid glycan moieties, the reduction step under alkaline conditions comes with a downside, that is, the loss of alkaline‐labile modifications such as O‐acetyl groups. These losses are avoided by reducing the glycans before analysis. The most applied ionization mode for PGC‐LC‐MS is negative ion mode, due to informative cross‐ring cleavages of glycan alditols in MS/MS. In addition, negative‐mode collision induced dissociation experiments, as opposed to positive‐ion mode, show a pronounced stability of, for example, terminal fucose residues (Harvey, 2005; Wuhrer & Deelder, 2005).
To further improve the detection sensitivity of a PGC‐LC‐MS platform, a recent study investigated the usage of a post‐column make‐up flow (PCMF) using various organics (Hinneburg et al., 2019). For this purpose post‐column addition of methanol, isopropanol and acetonitrile was compared to a conventional PGC‐LC‐MS setup (Jensen et al., 2012). Overall, a 30‐ up to a 100‐fold increase in glycan signal intensity was obtained for various released N‐glycans with an even up to 250‐fold increase for O‐glycans (Figure 6). As expected, this resulted in higher‐quality MS/MS spectra. While all glycans benefited from the PCMF, the early eluting glycans are the main beneficiaries, showing the highest enhancement in intensity and area under the curve. The best sensitivities were obtained by adding 100% acetonitrile or isopropanol, which resulted in a 57% (v/v) net concentration at the ionization source.
Figure 6.

Effect of different post‐column makeup flow supplements on N‐ and O‐glycan detection. The fold change of the AUC relative to the original setup is plotted with supplements consisting of methanol (orange), isopropanol (blue) or acetonitrile (green), resulting in a net concentration of 57% organic solvent (v/v) at the ion source. N‐ and O‐glycans were measured separately. Each symbol indicates a specific glycan subtype. Figure reused from (Hinneburg et al., 2019). AUC, area under the curve [Color figure can be viewed at wileyonlinelibrary.com]
Building on these results, another study investigated whether applying DEN gas in the electrospray ionization source could be used to increase detection sensitivity for glycan alditols in negative‐ion mode (Madunic et al., 2021). Here, similar findings were obtained compared to the PCMF platform, resulting in an increased sensitivity especially for the early‐eluting glycans, where the mobile phase contained very low concentrations of organics. While isopropanol as a dopant provided the best result regarding fragmentation spectra, methanol seemed to be more suitable for improved signal‐to‐noise ratios. Overall, it was estimated that glycans could be detected at mid femtomole amount (Table 1).
Sample preparation workflows for PGC are compatible with high sensitivity analysis of N‐glycans and O‐glycans from purified proteins, but also from tissue samples (Hinneburg et al., 2017). Recently, the sample preparation workflow for nanoPGC‐LC‐MS was transferred to 96‐well plate format, without compromising on precision and sensitivity (Zhang, Madunić, et al. 2020). High sensitivity applications of nanoPGC‐LC‐MS include the analysis of N‐ and O‐glycomic signatures from tumor tissue regions of approximately 2,000 cells prepared by laser capture microdissection (Hinneburg et al., 2017). However, nanoPGC‐LC‐MS is only used by a small number of laboratories, as these column formats are not commercially available, and columns are often packed in‐house (Karlsson et al., 2004). Capillary‐scale and microbore PGC‐LC‐MS is more common, yet with lower sensitivity.
4.4. Ion mobility spectrometry MS (IMS‐MS)
An emerging separation technique in the glycomics field is IMS coupled to MS, due to its ability to separate isomeric species in the gas‐phase. Recently a comprehensive overview of advancements of IMS‐MS for glycomic applications has been published by Chen et al. (2018). Like CE, the analytes are separated by creating an electric field based upon their mobility, which is influenced by the hydrodynamic volume and charge of an analyte. However, as opposed to CE, the analytes are ionized and interact with a carrier gas. The powerful technique has already been demonstrated for its ability to separate isomeric glycan species (Pallister et al., 2020; Sastre Toraño et al., 2021) or to detect variations in site‐occupancy (Guttman & Lee, 2016). While IMS does not directly improve the sensitivity of the analysis, it does provide valuable structural information compared to the conventional separation platforms such as CE or LC. However, it should be noted that an improved peak capacity and separation is observed when IMS is combined with one of these separation platforms (allowing a two‐dimensional separation) (Lareau et al., 2015).
4.5. MALDI MSI
MSI of N‐glycans is generally performed in MALDI mode and has been pioneered by Drake and co‐workers (Powers et al., 2013). A pixel of an N‐glycan MSI experiment generally covers a single or a few cells, dependent on the tissue type and the chosen experimental conditions. Hence, single cell N‐glycomic analyses by MALDI‐MSI are within reach. In addition, the information content can be increased by applying on‐tissue derivatization of glycans by linkage‐specific sialic acid derivatization, thereby allowing facile differentiation of linkage isomers based on the linkage‐specific mass shifts (Holst et al., 2016). Recent applications of N‐glycan MSI are largely focused on tumor tissue analysis (Boyaval et al., 2020; Carter et al., 2020; Drake et al., 2017, 2020; Heijs, Holst‐Bernal, et al., 2020; McDowell et al., 2020). A variation of the N‐glycan MSI approach has recently been established for antibody array‐based glycoprotein enrichment from biofluids with subsequent N‐glycan imaging (Black et al., 2019). By combining laser‐induced post ionization with conventional MALDI‐MSI in negative mode, or so called MALDI‐2, the detection sensitivity could be increased for both positive ionization mode [M + Na]+ as well as negative ionization mode [M‐H]‐ by one and three orders of magnitude, respectively (Heijs, Potthoff, et al., 2020). This resulted in a low limit of detection of two attomole per pixel in negative‐ion mode for MALDI‐2 compared to two femtomole per pixel in negative ion mode and 22 attomole per pixel in positive ion mode for conventional MALDI‐MSI (Figure 7 and Table 1). Of note, preliminary results revealed that MALDI‐2 was only advantageous in negative mode as MALDI‐2 does not seem to outperform conventional MALDI‐MSI in positive mode when salt‐adducts are formed.
Figure 7.

Sensitivity gain by MALDI‐2 of glycans in negative‐ion mode. A dilution series of maltoheptaose was spray‐coated on glass slide and analyzed by (A) MALDI‐ 2‐MS in negative ion mode, (B) MALDI‐MS in negative ion mode, and (C) MALDI‐MS in positive ion mode. The bar graphs show the mean intensity of the performed experiments (n = 5). The lower limit of detection (signal‐to‐noise ratio ≥3) is indicated with an *. Error bars represent the standard error of the mean. Figure adapted with permission from (Heijs, Potthoff, et al., 2020). Copyright © 2020, American Chemical Society. MALDI‐MS, matrix‐assisted laser desorption/ionization mass spectrometry [Color figure can be viewed at wileyonlinelibrary.com]
4.6. Glycopeptide analysis
Glycopeptide analysis is a very attractive approach for high sensitivity glycomic analysis and sample preparation workflows are often very similar to those of high sensitivity quantitative proteomics. Due to the often substoichiometric nature of protein glycosylation and the often‐poor ionization properties of glycosylated peptides, sensitivity of glycopeptide‐based glycoproteomics tends to severely lag that of other mainstream bottom‐up proteomics applications. Nevertheless, due to the nanoLC setup (which is commonly used in proteomics) glycopeptide analyses in nanoRP‐LC‐MS mode tend to show good sensitivities. An important factor is the choice of the ionization conditions: the use of DEN gas—in particular acetonitrile‐enriched nitrogen gas—was reported to result in a tremendous boost of signal intensities (Alagesan & Kolarich, 2019) and has found its way into routine applications (Falck et al., 2017; Larsen et al., 2021).
Importantly, nanoRP‐LC‐MS analysis of glycopeptides can be embedded into simple, miniaturized workflows for high sensitivity site‐specific glycosylation analysis as exemplified for the Fc glycosylation analysis of antibodies. While bulk IgG analysis from serum or plasma does not generally require high sensitivity approaches due to the high concentration of IgGs in these biofluids (Falck et al., 2017), there are multiple applications that come with only minute amounts of IgG and hence require high sensitivity. This include the analysis of IgG glycosylation from other biofluids such as saliva (Plomp et al., 2018), the analysis of antigen‐specific IgG from different biofluids (Larsen et al., 2021; Scherer et al., 2009), and the analysis of IgG Fc glycosylation from small‐scale or B‐cell in vitro cultures (Wang et al., 2011). For more information on glycopeptide analysis using MS, we refer to various excellent in‐depth reviews (Cao et al., 2016; Chernykh et al., 2021; Dalpathado & Desaire, 2008; Ruhaak et al., 2018).
4.7. Intact glycoprotein analysis
Intact glycoprotein analysis has a vast potential for sensitive glycosylation analysis, due to the mostly simple and straight‐forward sample preparation workflows. Recently, mass spectrometers and corresponding methods have been tailored for the sensitive analysis of intact (glyco)proteins, be it under native or denatured conditions. Sample preparation for intact glycoprotein analysis is often particularly simple, including, for example, only a buffer exchange or an affinity capturing step (Donnelly et al., 2019; Lacey et al., 2001). MS analysis can then be achieved by direct infusion ESI‐MS, or by online ESI‐MS in RP‐LC‐MS or CE‐MS configuration (Donnelly et al., 2019; Gstöttner et al., 2020). It should be noted that these workflows are particularly well applicable for the analysis of biopharmaceuticals or glycoproteins that are present at high concentrations in biofluids. However, in these cases, high sensitivity is often not essential as high amounts of the glycoprotein are generally available. In contrast, high sensitivity is of relevance for complex mixtures such as plasma or serum, especially when the targets are glycoproteins that are present at low concentrations. For example, a recent publication investigated the various proteoform variants of prostate‐specific antigen (PSA) present in urine of prostate cancer patients (Moran et al., 2021). Next to PSA glycoforms, six proteolytic cleavage variants could be identified on an intact level (Figure 8). While further research is still required, the intact analysis of PSA in combination with a bottom‐up approach provides an important basis for future studies that focus on biomarker characterization in the field of prostate cancer. Especially in assays like these, high‐efficiency sample preparation is important, for example, via affinity capturing. Due to its overall simplicity, intact glycoprotein analysis has vast potential for high sensitivity applications, and we expect this field to evolve quickly in the coming years.
Figure 8.
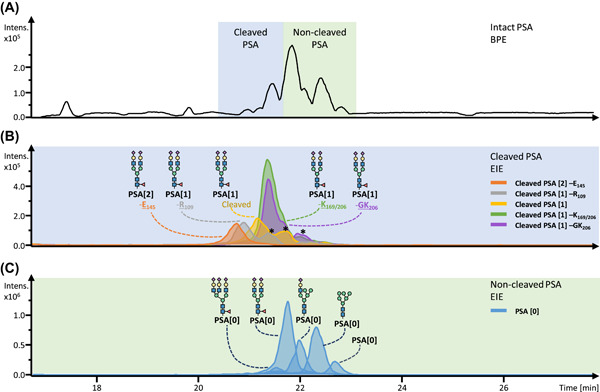
Intact analysis using CE‐ESI‐MS of PSA captured from a patient pool. (A) BPE of intact urinary PSA. (B) EIEs reveal various PSA proteoforms with and without internal cleavages. The proteoforms are illustrated with their most abundant glycan. The square brackets indicated the number of internal cleavages, followed by a potential loss of amino acid(s). (C) EIEs of the most abundant glycan structures (tri‐, di‐, mono‐sialylated and high mannose type) as well as the nonglycosylated proteoforms without an internal cleavage. Overlapping m/z values are indicated with an *. Figure adapted with permission from (Moran et al., 2021). Copyright © 1969, Elsevier. BPE, base peak electropherogram; EIE, extracted ion electropherogram; PSA, prostate‐specific antigen [Color figure can be viewed at wileyonlinelibrary.com]
4.8. Middle‐up and middle‐down glycoprotein analysis
Intact characterization of biopharmaceuticals can be complemented by the mass analysis of individual subunits which is known as the middle‐up approach (Lermyte et al., 2019). In case these individual subunits are characterized by MS/MS the approach is referred to as middle‐down. For example, proteolytic cleavage of the hinge region of antibodies is well‐established to yield an Fc‐ and a Fab‐domain and is often performed in combination with reduction of disulfide bridges. The main advantage over direct intact analysis is a reduced molecular weight of individual analytes and the assignment of specific modifications to individual subunits. For middle‐up and middle‐down MS analysis of antibodies various separation platforms are available such as size exclusion chromatography (Haberger et al., 2016), RPLC (Wang et al., 2018), HILIC (D'Atri et al., 2017; Sénard et al., 2020) or CE (Gstöttner et al., 2020; Sénard et al., 2020). Especially in combination with affinity chromatography a powerful platform is being created, providing insights how individual glycoforms on an antibody interact with an immobilized receptor. For this procedure high sensitivity is desired, to detect and characterize low abundant glycoforms which might play a crucial role in, for example, antibody‐dependent cell‐mediated cytotoxicity (Figure 9) (Lippold, Nicolardi, Domínguez‐Vega, et al., 2019; Lippold, Nicolardi, Wuhrer, et al., 2019).
Figure 9.

FcɣRIIIa AC of a therapeutic mAb. (A) UV chromatogram reported with non‐MS compatible conditions. AC‐MS under MS‐compatible conditions represented by extracted ion chromatograms of detected glycoforms on intact level (B) or Kgp middle‐up level (C). The * indicates multiple possibilities, the most probable glycoform is presented. Figure adapted from Lippold, Nicolardi, Domínguez‐Vega, et al. (2019) and Lippold, Nicolardi, Wuhrer, et al. (2019). Copyright © 2019. Published with license by Taylor & Francis Group, LLC. AC, affinity chromatography [Color figure can be viewed at wileyonlinelibrary.com]
In this review we only highlighted a few novel applications and developments in the field of glycopeptide, intact glycoprotein as well as middle‐up and middle‐down analysis and we would like to refer the reader to other reviews for a more extensive overview regarding recent advancements made on these topics (Camperi et al., 2020; Narimatsu et al., 2018; O'Flaherty et al., 2018; Ohyama et al., 2020; Ruhaak et al., 2018; Xiao et al., 2018, 2019; Yang, Franc, et al., 2017; Yu et al. 2018).
5. CONSIDERATIONS
Here a bird's eye view was provided of various MS based techniques and their corresponding sensitivities (Table 1). While most glycomic studies allege to have developed a sensitive method, only few studies actually assess the limit of detection (e.g., by using internal standards). To enable a better comparison between the significance and complimentarity of the various aplications, there is an urgent need for studies that support their sensitivity claims by properly designed experiments. However, the heterogeneous character of the glycoconjugates as well as the lack of standards could be considered the main bottleneck for this assessment. Due to recent progress in chemoenzymatic synthesis, the preparation of structurally defined, stable isotope‐labeled oligosaccharide and glycoconjugate standards has become feasible (Etxebarria & Reichardt, 2016; Guberman & Seeberger, 2019; Liu et al., 2019).
Moreover, there seems to be no general consensus in the glycomics field as what is considered the true sensitivity of an assay. While an absolute sensivitity for determining a single glycan can be given, similar to other omics fields, it may be debatable whether this is the most relevant information, as a single glycan does not provide direct insights in the biological pathway or what alterations might occur during a disease. Therefore, the scope should be clearly defined before the study, for example, the top 10 most abundant glycans should be characterized which may often result in a 100‐fold higher limit of detection as well as sample consumption compared to the detection limit for merely the most abundant glycan. Additionally, while it is important to know the sensitivity of the analtyical platform, it is more critical and informative when the required starting amount is defined as often more sample is needed to perform the entire analytical procedure compared to what is being needed or consumed for the final detection step. Eventually the glycomic field will be evolving to single cell analysis, however, this will only be informative when more than a single glycan species can be detected.
This review mainly focused on the analysis of mammalian N‐ and GalNAc‐type O‐linked glycans and, while not discussed here, we would like to highlight that the other glycan classes are equally significant (Puri et al., 2020; Schjoldager et al., 2020; Zhang et al., 2019; Zhang, van Die, et al., 2020). However, due to the lack of characterization tools and generic protocols, these analytes are still underexplored.
To gain a better understanding of the disease progression as well as to unravel the biology behind the alterations it will be essential to not only pinpoint changes in a glycomic profile of various diseases but also to integrate this information with other omics fields (Kellman & Lewis, 2021). The first steps are already initiated by integrating glycomic and glycoproteomic data with previously published datasets (e.g., transcriptomics) (Madunic et al., 2021) as well as to correlate it with data on The Human Tissue and Blood Atlas (part of the Human Protein Atlas) (Kawahara et al., 2021) While these studies reused publised data by other research groups, actually the same patient or cell (line) should be explored with all different omics applications, to minimize confounding by batch‐to‐batch and interindividual variation. Bringing the various omics disciplines and expertise together provides valuable insights on how the glycome and glycoproteome are regulated via glycosidases and glycosyltransferases (Blazev et al., 2021).
6. CONCLUSIONS
In this review we presented recent developments in the field of high sensitivity MS based glycomics. This emerging field still lags analytical sensitivity when compared to the genomics and transcriptomics field and to a lesser extent proteomics and metabolomics. Though, recent developments towards higher sensitivity glycomics are encouraging, and detection of glycan signatures at single molecule or single cell level have come within reach. To gain a better understanding of underlying molecular mechanisms it is important to not solely focus on glycomics signatures but rather incorporate these with omics applications. Overall, high sensitivity MS glycomics will often require a reduction in number and complexity of sample preparation steps, and a balance between glycan structural information versus glycome coverage and sensitivity. Glycopeptide‐centered approaches increasingly complement glycomic approaches and perform very well regarding sensitivity as they build on established as well as quickly evolving high sensitivity proteomic workflows. Moreover, intact glycoprotein analysis by MS has a huge potential for high sensitivity glycomic analyses, with relatively straight‐forward sample preparation as an advantage, and we expect that high sensitivity intact protein analysis will claim its place in the field.
ACKNOWLEDGEMENTS
We thank Y.E.M. van der Burgt and K. Madunić for proofreading the manuscript.
Biographies
Guinevere S.M. Lageveen‐Kammeijer received her PhD on exploring prostate‐specific antigen, the well‐known biomarker for prostate cancer, and its glycosylation by capillary electrophoresis and mass spectrometry. Currently, Guinevere performs her post‐doctoral research at the Center for Proteomics and Metabolomics at the Leiden University Medical Center, in the group of prof. Manfred Wuhrer. She currently works on further expanding a mass spectrometry‐based prostate‐specific antigen glycosylation assay which she developed during her PhD. In addition, she explores the possibilities for the in‐depth analysis of glycans and intact glycoproteins for biomarker discovery for other diseases as well as for the characterization of biopharmaceuticals.

Bernhard Kuster is a chemist by training and obtained a PhD from the University of Oxford where he worked at the Glycobiology Institute with David J. Harvey, followed by a Postdoc at EMBL (Heidelberg). After seven years at Cellzome (now GSK), Bernhard became Full Professor of Proteomics at the Technical University of Munich (TUM) in 2007. Bernhard currently is also the Director of the Bavarian Biomolecular Mass Spectrometry Center, and Vice Dean of Information Management of the School of Life Sciences at TUM. Bernhard's research focuses on proteomics and its application to chemical biology and precision medicine.

Dietmar Reusch studied chemistry at the University of Applied Science Reutlingen and obtained his PhD from the Free University Amsterdam with the thesis “Methods for the glycosylation analysis of therapeutic antibodies”. In 1988 he joined Roche Diagnostics GmbH (formerly Boehringer Mannheim) in Penzberg, Germany. Here he began his work on glycans by developing kits and enzymes for glycan research. He is currently Director Development Analytics Characterization in Roche Pharma Development. He focuses on the characterization of large molecules including glycoanalysis of therapeutic antibodies and other glycoprotein drugs.

Manfred Wuhrer studied biochemistry in Regensburg and got his training in glycosylation analysis during his PhD and postdoc with Prof. Rudolf Geyer at Giessen University, Germany. In 2003, he joined the Leiden University Medical Center in the Netherlands. From 2013 to 2015 he worked in Amsterdam at the Vrije Universiteit as Prof. Analytics of Biomolecular Interactions. Since 2015, he is heading the Center for Proteomics and Metabolomics of the LUMC as Prof. Proteomics and Glycomics. He continues the development of mass spectrometric methods for glycomics and glycoproteomics, and their application in clinical research and biotechnology.

Lageveen‐Kammeijer GSM, Kuster B, Reusch D, Wuhrer M. High sensitivity glycomics in biomedicine. Mass Spec Rev. 2022;41:1014‐1039. 10.1002/mas.21730
REFERENCES
- Abdul Rahman, S. , Bergström E., Watson C. J., Wilson K. M., Ashford D. A., Thomas J. R., Ungar D., and Thomas‐Oates J. E.. 2014. Filter‐aided N‐glycan separation (FANGS): A convenient sample preparation method for mass spectrometric N‐glycan profiling, Journal of Proteome Research, 13: 1167‐76. [DOI] [PMC free article] [PubMed] [Google Scholar]
- Adua, E. , Memarian E., Afrifa‐Yamoah E., Russell A., Trbojević‐Akmačić I., Gudelj I., Jurić J., Roberts P., Lauc G., and Wang W.. 2021. N‐glycosylation profiling of type 2 diabetes mellitus from baseline to follow‐up: an observational study in a Ghanaian population, Biomarkers in Medicine, 15: 467‐80. [DOI] [PubMed] [Google Scholar]
- Aghamohseni, H. , Ohadi K., Spearman M., Krahn N., Moo‐Young M., Scharer J. M., Butler M., and Budman H. M.. 2014. Effects of nutrient levels and average culture pH on the glycosylation pattern of camelid‐humanized monoclonal antibody, Journal of Biotechnology, 186: 98‐109. [DOI] [PubMed] [Google Scholar]
- Alagesan, K. & Kolarich D. 2019. To enrich or not to enrich: Enhancing (glyco)peptide ionization using the CaptiveSpray nanoBooster™, bioRxiv: 597922. 10.1101/597922 [DOI]
- Aldridge, S. , and Teichmann S. A.. 2020. Single cell transcriptomics comes of age, Nature Communications, 11: 4307. [DOI] [PMC free article] [PubMed] [Google Scholar]
- Anugraham, M. , Everest‐Dass A. V., Jacob F., and Packer N. H.. 2015. A platform for the structural characterization of glycans enzymatically released from glycosphingolipids extracted from tissue and cells, Rapid Communications in Mass Spectrometry, 29: 545‐61. [DOI] [PubMed] [Google Scholar]
- Anumula, K. R. , and Dhume S. T.. 1998. High resolution and high sensitivity methods for oligosaccharide mapping and characterization by normal phase high performance liquid chromatography following derivatization with highly fluorescent anthranilic acid, Glycobiology, 8: 685‐94. [DOI] [PubMed] [Google Scholar]
- Ashline, D. J. , Zhang H., and Reinhold V. N.. 2017. Isomeric complexity of glycosylation documented by MSn, Analytical and Bioanalytical Chemistry, 409: 439‐51. [DOI] [PubMed] [Google Scholar]
- Bennun, S. V. , Yarema K. J., Betenbaugh M. J., and Krambeck F. J.. 2013. Integration of the transcriptome and glycome for identification of glycan cell signatures, PLOS Computational Biology, 9: e1002813. [DOI] [PMC free article] [PubMed] [Google Scholar]
- Bieberich, E. 2014. Synthesis, processing, and function of N‐glycans in N‐glycoproteins. in Yu R. K. and C.‐L, Schengrund (eds.), Glycobiology of the nervous system (Springer New York: New York, NY: ). [Google Scholar]
- Black, A. P. , Liang H., West C. A., Wang M., Herrera H. P., Haab B. B., Angel P. M., Drake R. R., and Mehta A. S.. 2019. A novel mass spectrometry platform for multiplexed N‐glycoprotein biomarker discovery from patient biofluids by antibody panel based N‐glycan imaging, Anal Chem, 91: 8429‐35. [DOI] [PMC free article] [PubMed] [Google Scholar]
- Blazev, R. , Ashwood C., Abrahams J. L., Chung L. H., Francis D., Yang P., Watt K. I., Qian H., Quaife‐Ryan G. A., Hudson J. E., Gregorevic P., Thaysen‐Andersen M., and Parker B. L.. 2021. Integrated glycoproteomics identifies a role of N‐glycosylation and galectin‐1 on myogenesis and muscle development, Molecular & Cellular Proteomics, 20: 100030. [DOI] [PMC free article] [PubMed] [Google Scholar]
- Boyaval, F. , Van Zeijl R., Dalebout H., Holst S., van Pelt G. W., Farina‐Sarasqueta A., Mesker W. E., Tollenaar R., Morreau H., Wuhrer M., and Heijs B.. 2020. N‐Glycomic signature of stage II colorectal cancer and its association with the tumor microenvironment, Molecular & Cellular Proteomics, 20: 100057. [DOI] [PMC free article] [PubMed] [Google Scholar]
- Bunz, S. C. , Cutillo F., and Neusüß C.. 2013. Analysis of native and APTS‐labeled N‐glycans by capillary electrophoresis/time‐of‐flight mass spectrometry, Analytical and Bioanalytical Chemistry, 405: 8277‐84. [DOI] [PubMed] [Google Scholar]
- Bunz, S. C. , Rapp E., and Neusüß C.. 2013. Capillary electrophoresis/mass spectrometry of APTS‐labeled glycans for the identification of unknown glycan species in capillary electrophoresis/laser‐induced fluorescence systems, Analytical Chemistry, 85: 10218‐24. [DOI] [PubMed] [Google Scholar]
- Callewaert, N. , Geysens S., Molemans P., and Contreras R.. 2001. Ultrasensitive profiling and sequencing of N‐linked oligosaccharides using standard DNA‐sequencing equipment, Glycobiology, 11: 275‐81. [DOI] [PubMed] [Google Scholar]
- Camperi, J. , Pichon V., and Delaunay N.. 2020. Separation methods hyphenated to mass spectrometry for the characterization of the protein glycosylation at the intact level, Journal of Pharmaceutical and Biomedical Analysis, 178: 112921. [DOI] [PubMed] [Google Scholar]
- Cao, L. , Qu Y., Zhang Z., Wang Z., Prytkova I., and Wu S.. 2016. Intact glycopeptide characterization using mass spectrometry, Expert Review of Proteomics, 13: 513‐22. [DOI] [PMC free article] [PubMed] [Google Scholar]
- Carter, C. L. , Parker G. A., Hankey K. G., Farese A M., MacVittie T. J., and Kane M. A.. 2020. MALDI‐MSI spatially maps N‐glycan alterations to histologically distinct pulmonary pathologies following irradiation, Scientific Reports, 10: 11559. [DOI] [PMC free article] [PubMed] [Google Scholar]
- Chandler, K. B. , Brnakova Z., Sanda M., Wang S., Stalnaker S. H., Bridger R., Zhao P., Wells L., Edwards N. J., and Goldman R.. 2014. Site‐specific glycan microheterogeneity of inter‐alpha‐trypsin inhibitor heavy chain H4, Journal of Proteome Research, 13: 3314‐29. [DOI] [PMC free article] [PubMed] [Google Scholar]
- Chen, Z. , Glover M. S., and Li L.. 2018. Recent advances in ion mobility–mass spectrometry for improved structural characterization of glycans and glycoconjugates, Current Opinion in Chemical Biology, 42: 1‐8. [DOI] [PMC free article] [PubMed] [Google Scholar]
- Chernykh, A. , Kawahara R., and Thaysen‐Andersen M.. 2021. Towards structure‐focused glycoproteomics, Biochemical Society Transactions, 49: 161‐86. [DOI] [PMC free article] [PubMed] [Google Scholar]
- Cho, B. G. , Peng W., and Mechref Y.. 2020. Separation of permethylated O‐glycans, free oligosaccharides, and glycosphingolipid‐glycans using porous graphitized carbon (PGC) column, Metabolites, 10: 433. [DOI] [PMC free article] [PubMed] [Google Scholar]
- Chung, S. , Quarmby V., Gao X., Ying Y., Lin L., Reed C., Fong C., Lau W., Qiu Z. J., Shen A., Vanderlaan M., and Song A.. 2012. Quantitative evaluation of fucose reducing effects in a humanized antibody on Fcgamma receptor binding and antibody‐dependent cell‐mediated cytotoxicity activities, MAbs, 4: 326‐40. [DOI] [PMC free article] [PubMed] [Google Scholar]
- Clark, R. A. , Kuster B., Benallal M., Anner B. M., Dwek R. A., Harvey D. J., and Wing D. R.. 1999. Characterisation of tissue‐specific oligosaccharides from rat brain and kidney membrane preparations enriched in Na+,K+‐ATPase, Glycoconjugate Journal, 16: 437‐56. [DOI] [PubMed] [Google Scholar]
- D'Atri, V. , Fekete S., Beck A., Lauber M., and Guillarme D.. 2017. Hydrophilic interaction chromatography hyphenated with mass spectrometry: A powerful analytical tool for the comparison of originator and biosimilar therapeutic monoclonal antibodies at the middle‐up level of analysis, Analytical Chemistry, 89: 2086‐92. [DOI] [PubMed] [Google Scholar]
- Dalpathado, D. S. , and Desaire H.. 2008. Glycopeptide analysis by mass spectrometry, Analyst, 133: 731‐38. [DOI] [PubMed] [Google Scholar]
- de Haan, N. , Yang S., Cipollo J., and Wuhrer M.. 2020. Glycomics studies using sialic acid derivatization and mass spectrometry, Nature Reviews Chemistry, 4: 229‐42. [DOI] [PubMed] [Google Scholar]
- de Oliveira, F. M. S. , Mereiter S., Lönn P., Siart B., Shen Q., Heldin J., Raykova D., Karlsson N. G., Polom K., Roviello F., Reis C. A., and Kamali‐Moghaddam M.. 2018. Detection of post‐translational modifications using solid‐phase proximity ligation assay, New Biotechnology, 45: 51‐59. [DOI] [PubMed] [Google Scholar]
- Delafield, D. G. , and Li L.. 2020. Recent advances in analytical approaches for glycan and glycopeptide quantitation, Molecular & Cellular Proteomics, 20: 100054. [DOI] [PMC free article] [PubMed] [Google Scholar]
- Donnelly, D. P. , Rawlins C. M., DeHart C. J., Fornelli L., Schachner L. F., Lin Z., Lippens J. L., Aluri K. C., Sarin R., Chen B., Lantz C., Jung W., Johnson K. R., Koller A., Wolff J. J., Campuzano I. D. G., Auclair J. R., Ivanov A. R., Whitelegge J. P., Paša‐Tolić L., Chamot‐Rooke J., Danis P. O., Smith L. M., Tsybin Y. O., Loo J. A., Ge Y., Kelleher N. L., and Agar J. N.. 2019. Best practices and benchmarks for intact protein analysis for top‐down mass spectrometry, Nature Methods, 16: 587‐94. [DOI] [PMC free article] [PubMed] [Google Scholar]
- Drake, R. R. , McDowell C., West C., David F., Powers T. W., Nowling T., Bruner E., Mehta A. S., Angel P. M., Marlow L. A., Tun H. W., and Copland J. A.. 2020. Defining the human kidney N‐glycome in normal and cancer tissues using MALDI imaging mass spectrometry, J Mass Spectrom, 55: e4490. [DOI] [PMC free article] [PubMed] [Google Scholar]
- Drake, R. R. , Powers T. W., Jones E. E., Bruner E., Mehta A. S., and Angel P. M.. 2017. Chapter four—MALDI mass spectrometry imaging of N‐linked glycans in cancer tissues. in Drake R. R. and McDonnell L. A. (eds.), Advances in cancer research (Academic Press; ). [DOI] [PMC free article] [PubMed] [Google Scholar]
- Duarte, H. O. , Rodrigues J. G., Gomes C., Hensbergen P. J., Hipgrave Ederveen A. L., de Ru A. H., Mereiter S., Polónia A., Fernandes E., Ferreira J. A., van Veelen P. A., Santos L. L., Wuhrer M., Gomes J., and Reis C. A.. 2021. ST6Gal1 targets the ectodomain of ErbB2 in a site‐specific manner and regulates gastric cancer cell sensitivity to trastuzumab, Oncogene, 40: 3719‐33. [DOI] [PMC free article] [PubMed] [Google Scholar]
- Duncan, K. D. , Fyrestam J., and Lanekoff I.. 2019. Advances in mass spectrometry based single‐cell metabolomics, Analyst, 144: 782‐93. [DOI] [PubMed] [Google Scholar]
- Dusoswa, S. A. , Verhoeff J., Abels E., Mendez‐Huergo S. P., Croci D. O., Kuijper L. H., de Miguel E., Wouters Vmcj, Best M. G., Rodriguez E., Cornelissen L. A. M., van Vliet S. J., Wesseling P., Breakefield X. O., Noske D. P., Wurdinger T., Broekman M. L. D., Rabinovich G. A., van Kooyk Y., and Garcia‐Vallejo J. J.. 2020. Glioblastomas exploit truncated O‐linked glycans for local and distant immune modulation via the macrophage galactose‐type lectin', Proceedings of the National Academy of Sciences of the United States of America, 117: 3693‐703. [DOI] [PMC free article] [PubMed] [Google Scholar]
- Etxebarria, J. , and Reichardt N.‐C.. 2016. Methods for the absolute quantification of N‐glycan biomarkers, Biochimica et Biophysica Acta General Subjects, 1860: 1676‐87. [DOI] [PubMed] [Google Scholar]
- Falck, D. , Jansen B. C., de Haan N., and Wuhrer M.. 2017. High‐throughput analysis of IgG Fc glycopeptides by LC‐MS, Methods in Molecular Biology, 1503: 31‐47. [DOI] [PubMed] [Google Scholar]
- Falck, D. , Thomann M., Lechmann M., Koeleman C. A. M., Malik S., Jany C., Wuhrer M., and Reusch D.. 2021. Glycoform‐resolved pharmacokinetic studies in a rat model employing glycoengineered variants of a therapeutic monoclonal antibody, MAbs, 13: 1865596. [DOI] [PMC free article] [PubMed] [Google Scholar]
- Feng, Y. , Chen B., Yu Q., Zhong X., Frost D. C., Ikonomidou C., and Li L.. 2019. Isobaric multiplex labeling reagents for carbonyl‐containing compound (SUGAR) tags: A probe for quantitative glycomic analysis, Analytical Chemistry, 91: 3141‐46. [DOI] [PMC free article] [PubMed] [Google Scholar]
- Fessenden, M. 2016. Metabolomics: Small molecules, single cells, Nature, 540: 153‐55. [DOI] [PubMed] [Google Scholar]
- Gstöttner, C. , Nicolardi S., Haberger M., Reusch D., Wuhrer M., and Domínguez‐Vega E.. 2020. Intact and subunit‐specific analysis of bispecific antibodies by sheathless CE‐MS, Analytica Chimica Acta, 1134: 18‐27. [DOI] [PubMed] [Google Scholar]
- Guberman, M. , and Seeberger P. H.. 2019. Automated glycan assembly: A perspective, Journal of the American Chemical Society, 141: 5581‐92. [DOI] [PMC free article] [PubMed] [Google Scholar]
- Guttman, A. 1996. High‐resolution carbohydrate profiling by capillary gel electrophoresis, Nature, 380: 461‐62. [DOI] [PubMed] [Google Scholar]
- Guttman, M. , and Lee K. K.. 2016. Site‐specific mapping of sialic acid linkage isomers by ion mobility spectrometry, Analytical Chemistry, 88: 5212‐7. [DOI] [PMC free article] [PubMed] [Google Scholar]
- Haberger, M. , Leiss M., Heidenreich A‐K., Pester O., Hafenmair G., Hook M., Bonnington L., Wegele H., Haindl M., Reusch D., and Bulau P.. 2016. Rapid characterization of biotherapeutic proteins by size‐exclusion chromatography coupled to native mass spectrometry, MAbs, 8: 331‐39. [DOI] [PMC free article] [PubMed] [Google Scholar]
- Han, M. , Wang Y., Cook K., Bala N., Soto M., Rock D. A., Pearson J. T., and Rock B. M.. 2021. Universal automated immunoaffinity purification‐CE‐MS platform for accelerating next generation biologic design, Analytical Chemistry, 93: 5562‐69. [DOI] [PubMed] [Google Scholar]
- Hanna‐Sawires, R. G. , Schiphuis J. H., Wuhrer M., Vasen H. F. A., van Leerdam M. E., Bonsing B. A., Mesker W. E., van der Burgt Y. E. M., and Tollenaar R.. 2021. Clinical perspective on proteomic and glycomic biomarkers for diagnosis, prognosis, and prediction of pancreatic cancer, International Journal of Molecular Sciences, 22: 2655. [DOI] [PMC free article] [PubMed] [Google Scholar]
- Harvey, D. J. 2005. Fragmentation of negative ions from carbohydrates: Part 3. Fragmentation of hybrid and complex N‐linked glycans, Journal of the American Society for Mass Spectrometry, 16: 647‐59. [DOI] [PubMed] [Google Scholar]
- Harvey, D. J. , Royle L., Radcliffe C. M., Rudd P. M., and Dwek R. A.. 2008. Structural and quantitative analysis of N‐linked glycans by matrix‐assisted laser desorption ionization and negative ion nanospray mass spectrometry, Analytical Biochemistry, 376: 44‐60. [DOI] [PubMed] [Google Scholar]
- He, Z. , Aristoteli L. P., Kritharides L., and Garner B.. 2006. HPLC analysis of discrete haptoglobin isoform N‐linked oligosaccharides following 2D‐PAGE isolation, Biochemical and Biophysical Research Communications, 343: 496‐503. [DOI] [PubMed] [Google Scholar]
- Hecht, E. S. , McCord J. P., and Muddiman D. C.. 2015. Definitive screening design optimization of mass spectrometry parameters for sensitive comparison of filter and solid phase extraction purified, INLIGHT plasma N‐glycans, Analytical Chemistry, 87: 7305‐12. [DOI] [PMC free article] [PubMed] [Google Scholar]
- Heijs, B. , Holst‐Bernal S., de Graaff M. A., Briaire‐de Bruijn I. H., Rodriguez‐Girondo M., van de Sande M. A. J., Wuhrer M., McDonnell L. A., and Bovée J.. 2020. Molecular signatures of tumor progression in myxoid liposarcoma identified by N‐glycan mass spectrometry imaging, Lab Invest, 100: 1252‐61. [DOI] [PubMed] [Google Scholar]
- Heijs, B. , Potthoff A., Soltwisch J., and Dreisewerd K.. 2020. 'MALDI‐2 for the enhanced analysis of N‐linked glycans by mass spectrometry imaging, Analytical Chemistry, 92: 13904‐11. [DOI] [PMC free article] [PubMed] [Google Scholar]
- Hinneburg, H. , Chatterjee S., Schirmeister F., Nguyen‐Khuong T., Packer N. H., Rapp E., and Thaysen‐Andersen M.. 2019. Post‐column make‐up flow (PCMF) enhances the performance of capillary‐flow PGC‐LC‐MS/MS‐based glycomics, Analytical Chemistry, 91: 4559‐67. [DOI] [PubMed] [Google Scholar]
- Hinneburg, H. , Korać P., Schirmeister F., Gasparov S., Seeberger P. H., Zoldoš V., and Kolarich D.. 2017. Unlocking cancer glycomes from histopathological formalin‐fixed and paraffin‐embedded (FFPE) tissue microdissections, Molecular & Cellular Proteomics, 16: 524‐36. [DOI] [PMC free article] [PubMed] [Google Scholar]
- Hinneburg, H. , Schirmeister F., Korać P., and Kolarich D.. 2017. 'N‐ and O‐Glycomics from minor amounts of formalin‐fixed, paraffin‐embedded tissue samples. in Lauc G. and Wuhrer M. (eds.), High‐throughput glycomics and glycoproteomics: Methods and protocols (Springer New York: New York, NY: ). [DOI] [PubMed] [Google Scholar]
- Holst, S. , Belo A. I., Giovannetti E., van Die I., and Wuhrer M.. 2017. Profiling of different pancreatic cancer cells used as models for metastatic behaviour shows large variation in their N‐glycosylation, Sci Rep, 7: 16623. [DOI] [PMC free article] [PubMed] [Google Scholar]
- Holst, S. , Heijs B., de Haan N., van Zeijl R. J., Briaire‐de Bruijn I. H., van Pelt G. W., Mehta A. S., Angel P. M., Mesker W. E., Tollenaar R. A., Drake R. R., Bovee J. V., McDonnell L. A., and Wuhrer M.. 2016. Linkage‐specific in situ sialic acid derivatization for N‐glycan mass spectrometry imaging of formalin‐fixed paraffin‐embedded tissues, Analytical Chemistry, 88: 5904‐13. [DOI] [PubMed] [Google Scholar]
- Jegouzo, S. A. F. , Nelson C., Hardwick T., Wong S. T. A., Lau N. K. K., Neoh G. K. E., Castellanos‐Rueda R., Huang Z., Mignot B., Hirdaramani A., Howitt A., Frewin K., Shen Z., Fox R. J., Wong R., Ando M., Emony L., Zhu H., Holder A., Werling D., Krishnan N., Robertson B. D., Clements A., Taylor M. E., and Drickamer K.. 2020. Mammalian lectin arrays for screening host‐microbe interactions, Journal of Biological Chemistry, 295: 4541‐55. [DOI] [PMC free article] [PubMed] [Google Scholar]
- Jensen, P. H. , Karlsson N. G., Kolarich D., and Packer N. H.. 2012. Structural analysis of N‐ and O‐glycans released from glycoproteins, Nature Protocols, 7: 1299‐310. [DOI] [PubMed] [Google Scholar]
- Jeschke, U. , Mylonas I., Shabani N., Kunert‐Keil C., Schindlbeck C., Gerber B., and Friese K.. 2005. Expression of sialyl lewis X, sialyl Lewis A, E‐cadherin and cathepsin‐D in human breast cancer: Immunohistochemical analysis in mammary carcinoma in situ, invasive carcinomas and their lymph node metastasis, Anticancer Research, 25: 1615‐22. [PubMed] [Google Scholar]
- Jongsma, M. L. M. , de Waard A. A., Raaben M., Zhang T., Cabukusta B., Platzer R., Blomen V. A., Xagara A., Verkerk T., Bliss S., Kong X., Gerke C., Janssen L., Stickel E., Holst S., Plomp R., Mulder A., Ferrone S., Claas F. H. J., Heemskerk M. H. M., Griffioen M., Halenius A., Overkleeft H., Huppa J. B., Wuhrer M., Brummelkamp T. R., Neefjes J., and Spaapen R. M.. 2021. The SPPL3‐defined glycosphingolipid repertoire orchestrates HLA class I‐mediated immune responses, Immunity, 54: 132‐50. [DOI] [PMC free article] [PubMed] [Google Scholar]
- Kammeijer, G. S. M. , Kohler I., Jansen B. C., Hensbergen P. J., Mayboroda O. A., Falck D., and Wuhrer M.. 2016. Dopant enriched nitrogen gas combined with sheathless capillary electrophoresis‐electrospray ionization‐mass spectrometry for improved sensitivity and repeatability in glycopeptide analysis, Analytical Chemistry, 88: 5849‐56. [DOI] [PubMed] [Google Scholar]
- Karlsson, N. G. , Wilson N. L., Wirth H. J., Dawes P., Joshi H., and Packer N. H.. 2004. Negative ion graphitised carbon nano‐liquid chromatography/mass spectrometry increases sensitivity for glycoprotein oligosaccharide analysis, Rapid Communications in Mass Spectrometry, 18: 2282‐92. [DOI] [PubMed] [Google Scholar]
- Karlsson, N. G. , Jin C., Rojas‐Macias M. A., and Adamczyk B.. 2017. Next generation O‐linked glycomics, Trends in Glycoscience and Glycotechnology, 29: E35‐E46. [Google Scholar]
- Kawahara, R. , Recuero S., Srougi M., Leite K. R. M., Thaysen‐Andersen M., and Palmisano G.. 2021. The complexity and dynamics of the tissue glycoproteome associated with prostate cancer progression, Molecular & Cellular Proteomics, 20: 100026. [DOI] [PMC free article] [PubMed] [Google Scholar]
- Kellman, B. P. , and Lewis N. E.. 2021. Big‐data glycomics: Tools to connect glycan biosynthesis to extracellular communication, Trends in Biochemical Sciences, 46: 284‐300. [DOI] [PMC free article] [PubMed] [Google Scholar]
- Keser, T. , Pavić T., Lauc G., and Gornik O.. 2018. Comparison of 2‐aminobenzamide, procainamide and RapiFluor‐MS as derivatizing agents for high‐throughput HILIC‐UPLC‐FLR‐MS N‐glycan analysis, Frontiers in Chemistry, 6: 324. [DOI] [PMC free article] [PubMed] [Google Scholar]
- Kimura, S. , Kameyama A., Nakaya S., Ito H., and Narimatsu H.. 2007. Direct on‐membrane glycoproteomic approach using MALDI‐TOF mass spectrometry coupled with microdispensing of multiple enzymes, Journal of Proteome Research, 6: 2488‐94. [DOI] [PubMed] [Google Scholar]
- Kirwan, A. , Utratna M., O'Dwyer M. E., Joshi L., and Kilcoyne M.. 2015. glycosylation‐based serum biomarkers for cancer diagnostics and prognostics, BioMed Research International, 2015: 490531. [DOI] [PMC free article] [PubMed] [Google Scholar]
- Klarić, L. , Tsepilov Y. A., Stanton C. M., Mangino M., Sikka T. T., Esko T., Pakhomov E., Salo P., Deelen J., McGurnaghan S. J., Keser T., Vučković F., Ugrina I., Krištić J., Gudelj I., Štambuk J., Plomp R., Pučić‐Baković M., Pavić T., Vilaj M., Trbojević‐Akmačić I., Drake C., Dobrinić P., Mlinarec J., Jelušić B., Richmond A., Timofeeva M., Grishchenko A. K., Dmitrieva J., Bermingham M. L., Sharapov S. Zh., Farrington S. M., Theodoratou E., Uh H‐W., Beekman M., Slagboom E. P., Louis E., Georges M., Wuhrer M., Colhoun H. M., Dunlop M. G., Perola M., Fischer K., Polasek O., Campbell H., Rudan I., Wilson J. F., Zoldoš V., Vitart V., Spector T., Aulchenko Y. S., Lauc G., and Hayward C.. 2020. Glycosylation of immunoglobulin G is regulated by a large network of genes pleiotropic with inflammatory diseases, Science Advances, 6: eaax0301. [DOI] [PMC free article] [PubMed] [Google Scholar]
- Kozak, R. P. , Tortosa C. B., Fernandes D. L., and Spencer D. I.. 2015. Comparison of procainamide and 2‐aminobenzamide labeling for profiling and identification of glycans by liquid chromatography with fluorescence detection coupled to electrospray ionization‐mass spectrometry, Anal Biochem, 486: 38‐40. [DOI] [PubMed] [Google Scholar]
- Kuster, B. , Hunter A. P., Wheeler S. F., Dwek R. A., and Harvey D. J.. 1998. Structural determination of N‐linked carbohydrates by matrix‐assisted laser desorption/ionization‐mass spectrometry following enzymatic release within sodium dodecyl sulphate‐polyacrylamide electrophoresis gels: Application to species‐specific glycosylation of alpha1‐acid glycoprotein, Electrophoresis, 19: 1950‐9. [DOI] [PubMed] [Google Scholar]
- Kuster, B. , Krogh T. N., Mortz E., and Harvey D. J.. 2001. Glycosylation analysis of gel‐separated proteins, Proteomics, 1: 350‐61. [DOI] [PubMed] [Google Scholar]
- Kuster, B. , and Mann M.. 1999. 18O‐Labeling of N‐glycosylation sites to improve the identification of gel‐separated glycoproteins using peptide mass mapping and database searching, Analytical Chemistry, 71: 1431‐40. [DOI] [PubMed] [Google Scholar]
- Kuster, B. , Shainskaya A., Pu H. X., Goldshleger R., Blostein R., Mann M., and Karlish S. J.. 2000. A new variant of the gamma subunit of renal Na,K‐ATPase. Identification by mass spectrometry, antibody binding, and expression in cultured cells, Journal of Biological Chemistry, 275: 18441‐6. [DOI] [PubMed] [Google Scholar]
- Kuster, B. , Wheeler S. F., Hunter A. P., Dwek R. A., and Harvey D. J.. 1997. Sequencing of N‐linked oligosaccharides directly from protein gels: In‐gel deglycosylation followed by matrix‐assisted laser desorption/ionization mass spectrometry and normal‐phase high‐performance liquid chromatography, Anal Biochem, 250: 82‐101. [DOI] [PubMed] [Google Scholar]
- Lacey, J. M , Bergen H R., Magera M. J, Naylor S., and O'Brien J. F. 2001. Rapid determination of transferrin isoforms by immunoaffinity liquid chromatography and electrospray mass spectrometry, Clinical Chemistry, 47: 513‐18. [PubMed] [Google Scholar]
- Lageveen‐Kammeijer, G. S. M. , de Haan N., Mohaupt P., Wagt S., Filius M., Nouta J., Falck D., and Wuhrer M.. 2019. Highly sensitive CE‐ESI‐MS analysis of N‐glycans from complex biological samples, Nature Communications, 10: 2137. [DOI] [PMC free article] [PubMed] [Google Scholar]
- Lareau, N. M. , May J. C., and McLean J. A.. 2015. Non‐derivatized glycan analysis by reverse phase liquid chromatography and ion mobility‐mass spectrometry, Analyst, 140: 3335‐38. [DOI] [PMC free article] [PubMed] [Google Scholar]
- Larsen, M. D. , de Graaf E. L., Sonneveld M. E., Plomp H. R., Nouta J., Hoepel W., Chen H. J., Linty F., Visser R., Brinkhaus M., Šuštić T., de Taeye S. W., Bentlage A. E. H., Toivonen S., Koeleman C. A. M., Sainio S., Kootstra N. A., Brouwer P. J. M., Geyer C. E., Derksen N. I. L., Wolbink G., de Winther M., Sanders R. W., van Gils M. J., de Bruin S., Vlaar A. P. J., Rispens T., den Dunnen J., Zaaijer H. L., Wuhrer M., Ellen van der Schoot C., and Vidarsson G.. 2021. Afucosylated IgG characterizes enveloped viral responses and correlates with COVID‐19 severity, Science, 371: eabc8378. [DOI] [PMC free article] [PubMed] [Google Scholar]
- Lattová, E. , and Perreault H.. 2013. The usefulness of hydrazine derivatives for mass spectrometric analysis of carbohydrates, Mass Spectrometry Reviews, 32: 366‐85. [DOI] [PubMed] [Google Scholar]
- Lauber, M. A. , Yu Y‐Q., Brousmiche D. W., Hua Z., Koza S. M., Magnelli P., Guthrie E., Taron C. H., and Fountain K. J.. 2015. Rapid preparation of released N‐glycans for HILIC analysis using a labeling reagent that facilitates sensitive fluorescence and ESI‐MS detection, Analytical Chemistry, 87: 5401‐09. [DOI] [PubMed] [Google Scholar]
- Lenos, K. , Goos J. A., Vuist I. M., den Uil S. H., Delis‐van Diemen P. M., Belt E. J., Stockmann H. B., Bril H., de Wit M., Carvalho B., Giblett S., Pritchard C. A., Meijer G. A., van Kooyk Y., Fijneman R. J., and van Vliet S. J.. 2015. MGL ligand expression is correlated to BRAF mutation and associated with poor survival of stage III colon cancer patients, Oncotarget, 6: 26278‐90. [DOI] [PMC free article] [PubMed] [Google Scholar]
- Lermyte, F. , Tsybin Y. O., O'Connor P. B., and Loo J. A.. 2019. Top or middle? Up or down? Toward a standard lexicon for protein top‐down and allied mass spectrometry approaches, J Am Soc Mass Spectrom, 30: 1149‐57. [DOI] [PMC free article] [PubMed] [Google Scholar]
- Li, Q. , Xie Y., Wong M., Barboza M., and Lebrilla C. B.. 2020. Comprehensive structural glycomic characterization of the glycocalyxes of cells and tissues, Nature Protocols, 15: 2668‐704. [DOI] [PMC free article] [PubMed] [Google Scholar]
- Lim, M. S. , So M. K., Lim C. S., Song D. H., Kim J. W., Woo J., and Ko B. J.. 2019. Validation of Rapi‐Fluor method for glycan profiling and application to commercial antibody drugs, Talanta, 198: 105‐10. [DOI] [PubMed] [Google Scholar]
- Lippold, S. , Nicolardi S., Domínguez‐Vega E., Heidenreich A‐K., Vidarsson G., Reusch D., Haberger M., Wuhrer M., and Falck D.. 2019. Glycoform‐resolved FcɣRIIIa affinity chromatography–mass spectrometry, MAbs, 11: 1191‐96. [DOI] [PMC free article] [PubMed] [Google Scholar]
- Lippold, S. , Nicolardi S., Wuhrer M., and Falck D.. 2019. Proteoform‐resolved FcɤRIIIa binding assay for fab glycosylated monoclonal antibodies achieved by affinity chromatography mass spectrometry of Fc moieties, Frontiers in Chemistry , 7: 698. [DOI] [PMC free article] [PubMed] [Google Scholar]
- Liu, L. , Prudden A. R., Capicciotti C. J., Bosman G. P., Yang J.‐Y., Chapla D. G., Moremen K. W., and Boons G.‐J.. 2019. Streamlining the chemoenzymatic synthesis of complex N‐glycans by a stop and go strategy, Nature Chemistry, 11: 161‐69. [DOI] [PMC free article] [PubMed] [Google Scholar]
- Liu, Z. , Cao J., He Y., Qiao L., Xu C., Lu H., and Yang P.. 2010. Tandem 18O stable isotope labeling for quantification of N‐glycoproteome, Journal of Proteome Research, 9: 227‐36. [DOI] [PubMed] [Google Scholar]
- Madunic, K. , Wagt S., Zhang T., Wuhrer M., and Lageveen‐Kammeijer G. S. M.. 2021. Dopant‐enriched nitrogen gas for enhanced electrospray ionization of released glycans in negative ion mode, Analytical Chemistry, 93, 6919‐23. [DOI] [PMC free article] [PubMed] [Google Scholar]
- Madunic, K. , Zhang T., Mayboroda O. A., Holst S., Stavenhagen K., Jin C., Karlsson N. G., Lageveen‐Kammeijer G. S. M., and Wuhrer M.. 2021. Colorectal cancer cell lines show striking diversity of their O‐glycome reflecting the cellular differentiation phenotype, Cellular and Molecular Life Sciences, 78: 337‐50. [DOI] [PMC free article] [PubMed] [Google Scholar]
- Marie, A‐L. , Ray S., Lu S., Jones J., Ghiran I., and Ivanov A. R.. 2021. High‐sensitivity glycan profiling of blood‐derived immunoglobulin G, plasma, and extracellular vesicle isolates with capillary zone electrophoresis‐mass spectrometry, Analytical Chemistry, 93: 1991‐2002. [DOI] [PMC free article] [PubMed] [Google Scholar]
- Marti Fernandez, I. , Macrini C., Krumbholz M., Hensbergen P. J., Hipgrave Ederveen A. L., Winklmeier S., Vural A., Kurne A., Jenne D., Kamp F., Gerdes L. A., Hohlfeld R., Wuhrer M., Kümpfel T., and Meinl E.. 2019. The glycosylation site of myelin oligodendrocyte glycoprotein affects autoantibody recognition in a large proportion of patients, Frontiers in Immunology, 10: 1189. [DOI] [PMC free article] [PubMed] [Google Scholar]
- McDowell, C. T. , Klamer Z., Hall J., West C. A., Wisniewski L., Powers T. W., Angel P. M., Mehta A. S., Lewin D. N., Haab B. B., and Drake R. R.. 2020. Imaging mass spectrometry and lectin analysis of N‐linked glycans in carbohydrate antigen‐defined pancreatic cancer tissues, Molecular & Cellular Proteomics, 20: 100012. [DOI] [PMC free article] [PubMed] [Google Scholar]
- Merry, T. , and Astrautsova S.. 2003. Chemical and enzymatic release of glycans from glycoproteins. in Thibault P. and Honda S. (eds.), Capillary electrophoresis of carbohydrates (Humana Press: Totowa, NJ: ). [DOI] [PubMed] [Google Scholar]
- Moran, A.B. , Dominguez‐Vega E., Nouta J., Pongracz T., de Reijke T.M., Wuhrer M., and Lageveen‐Kammeijer G. S. M.. 2021. Profiling the proteoforms of urinary prostate‐specific antigen by capillary electrophoresis‐mass spectrometry—Data set. Journal of Proteomics, 238, 104148. [DOI] [PubMed] [Google Scholar]
- Mulagapati, S. , Koppolu V., and Raju T. S.. 2017. Decoding of O‐linked glycosylation by mass spectrometry, Biochemistry, 56: 1218‐26. [DOI] [PubMed] [Google Scholar]
- Mysling, S. , Palmisano G., Højrup P., and Thaysen‐Andersen M.. 2010. Utilizing ion‐pairing hydrophilic interaction chromatography solid phase extraction for efficient glycopeptide enrichment in glycoproteomics, Analytical Chemistry, 82: 5598‐609. [DOI] [PubMed] [Google Scholar]
- Nairn, A. V. , York W. S., Harris K., Hall E. M., Pierce J. M., and Moremen K. W.. 2008. Regulation of glycan structures in animal tissues: Transcript profiling of glycan‐related genes, Journal of Biological Chemistry, 283: 17298‐313. [DOI] [PMC free article] [PubMed] [Google Scholar]
- Narimatsu, H. , Kaji H., Vakhrushev S. Y., Clausen H., Zhang H., Noro E., Togayachi A., Nagai‐Okatani C., Kuno A., Zou X., Cheng L., Tao S.‐C., and Sun Y.. 2018. Current technologies for complex glycoproteomics and their applications to biology/disease‐driven glycoproteomics, Journal of Proteome Research, 17: 4097‐112. [DOI] [PubMed] [Google Scholar]
- Naven, T. J. P. , and Harvey D. J.. 1996. Cationic derivatization of oligosaccharides with Girard's T reagent for improved performance in matrix‐assisted laser desorption/ionization and electrospray mass spectrometry, Rapid Communications in Mass Spectrometry, 10: 829‐34. [Google Scholar]
- O'Flaherty, R. , Trbojević‐Akmačić I., Greville G., Rudd P. M., and Lauc G.. 2018. The sweet spot for biologics: recent advances in characterization of biotherapeutic glycoproteins, Expert Review of Proteomics, 15: 13‐29. [DOI] [PubMed] [Google Scholar]
- Ohyama, Y. , Nakajima K., Renfrow M. B., Novak J., and Takahashi K.. 2020. Mass spectrometry for the identification and analysis of highly complex glycosylation of therapeutic or pathogenic proteins, Expert Review of Proteomics, 17: 275‐96. [DOI] [PMC free article] [PubMed] [Google Scholar]
- Pabst, M. , Kolarich D., Pöltl G., Dalik T., Lubec G., Hofinger A., and Altmann F.. 2009. Comparison of fluorescent labels for oligosaccharides and introduction of a new postlabeling purification method, Analytical Biochemistry, 384: 263‐73. [DOI] [PubMed] [Google Scholar]
- Packer, N. H. , Lawson M. A., Jardine D. R., and Redmond J. W.. 1998. A general approach to desalting oligosaccharides released from glycoproteins, Glycoconjugate Journal, 15: 737‐47. [DOI] [PubMed] [Google Scholar]
- Pallister, E. G. , Choo M. S. F., Walsh I., Nee Tai J., Jie Tay S., Sheng Yang Y., Kong Ng S., Rudd P. M., Flitsch S. L., and Nguyen‐Khuong T.. 2020. Utility of ion‐mobility spectrometry for deducing branching of multiply charged glycans and glycopeptides in a high‐throughput positive ion LC‐FLR‐IMS‐MS workflow, Analytical Chemistry, 92: 15323‐35. [DOI] [PubMed] [Google Scholar]
- Pilobello, K. T. , and Mahal L. K.. 2007. Deciphering the glycocode: The complexity and analytical challenge of glycomics, Current Opinion in Chemical Biology, 11: 300‐5. [DOI] [PubMed] [Google Scholar]
- Pinho, S. S. , and Reis C. A.. 2015. Glycosylation in cancer: Mechanisms and clinical implications, Nature Reviews Cancer, 15: 540‐55. [DOI] [PubMed] [Google Scholar]
- Plomp, R. , de Haan N., Bondt A., Murli J., Dotz V., and Wuhrer M.. 2018. Comparative glycomics of immunoglobulin A and G from saliva and plasma reveals biomarker potential, Frontiers in Immunology, 9: 2436. [DOI] [PMC free article] [PubMed] [Google Scholar]
- Pongracz, T. , Wuhrer M., and de Haan N.. 2019. Expanding the reaction space of linkage‐specific sialic acid derivatization, Molecules, 24: 3617. [DOI] [PMC free article] [PubMed] [Google Scholar]
- Powers, T. W. , Jones E. E., Betesh L. R., Romano P. R., Gao P., Copland J. A., Mehta A. S., and Drake R. R.. 2013. Matrix assisted laser desorption ionization imaging mass spectrometry workflow for spatial profiling analysis of N‐linked glycan expression in tissues, Anal Chem, 85: 9799‐806. [DOI] [PMC free article] [PubMed] [Google Scholar]
- Puri, S. , Coulson‐Thomas Y. M., Gesteira T. F., and Coulson‐Thomas V. J.. 2020. Distribution and function of glycosaminoglycans and proteoglycans in the development, homeostasis and pathology of the ocular surface, Frontiers in Cell and Developmental Biology, 8. [DOI] [PMC free article] [PubMed] [Google Scholar]
- Reiding, K. R. , Bondt A., Hennig R., Gardner R. A., O'Flaherty R., Trbojević‐Akmačić I., Shubhakar A., Hazes J. M. W., Reichl U., Fernandes D. L., Pučić‐Baković M., Rapp E., Spencer D. I. R., Dolhain Rjem, Rudd P. M., Lauc G., and Wuhrer M.. 2019. High‐throughput serum N‐glycomics: Method comparison and application to study rheumatoid arthritis and pregnancy‐associated changes, Molecular & Cellular Proteomics, 18: 3‐15. [DOI] [PMC free article] [PubMed] [Google Scholar]
- Reiding, K. R. , Lonardi E., Hipgrave A. L. Ederveen, and Wuhrer M.. 2016. Ethyl esterification for MALDI‐MS analysis of protein glycosylation, Methods Mol Biol, 1394: 151‐62. [DOI] [PubMed] [Google Scholar]
- Reiding, K. R. , Ruhaak L. R., Uh H. W., El Bouhaddani S., van den Akker E. B., Plomp R., McDonnell L. A., Houwing‐Duistermaat J. J., Slagboom P. E., Beekman M., and Wuhrer M.. 2017. Human plasma N‐glycosylation as analyzed by matrix‐assisted laser desorption/ionization‐fourier transform ion cyclotron resonance‐MS associates with markers of inflammation and metabolic health, Molecular & Cellular Proteomics, 16: 228‐42. [DOI] [PMC free article] [PubMed] [Google Scholar]
- Reily, C. , Stewart T. J., Renfrow M. B., and Novak J.. 2019. Glycosylation in health and disease, Nature Reviews Nephrology, 15: 346‐66. [DOI] [PMC free article] [PubMed] [Google Scholar]
- Reusch, D. , Haberger M., Maier B., Maier M., Kloseck R., Zimmermann B., Hook M., Szabo Z., Tep S., Wegstein J., Alt N., Bulau P., and Wuhrer M.. 2015. Comparison of methods for the analysis of therapeutic immunoglobulin G Fc‐glycosylation profiles–part 1: Separation‐based methods, MAbs, 7: 167‐79. [DOI] [PMC free article] [PubMed] [Google Scholar]
- Reusch, D. , and Tejada M. L.. 2015. Fc glycans of therapeutic antibodies as critical quality attributes, Glycobiology, 25: 1325‐34. [DOI] [PMC free article] [PubMed] [Google Scholar]
- Riley, N. M. , Bertozzi C. R., and Pitteri S. J.. 2021. A pragmatic guide to enrichment strategies for mass spectrometry‐based glycoproteomics, Molecular & Cellular Proteomics, 20: 100029. [DOI] [PMC free article] [PubMed] [Google Scholar]
- Ritchie, G. , Harvey D. J., Feldmann F., Stroeher U., Feldmann H., Royle L., Dwek R. A., and Rudd P. M.. 2010. Identification of N‐linked carbohydrates from severe acute respiratory syndrome (SARS) spike glycoprotein, Virology, 399: 257‐69. [DOI] [PMC free article] [PubMed] [Google Scholar]
- Rodrigues J. G., Duarte H. O., Gomes C., Balmaña M., Martins Á. M., Hensbergen P. J., de Ru A. H., Lima J., Albergaria A., van Veelen P. A., Wuhrer M., Gomes J., and Reis C. A.. 2021. Terminal α2,6‐sialylation of epidermal growth factor receptor modulates antibody therapy response of colorectal cancer cells, Cellular Oncology, 44: 835‐850. [DOI] [PubMed] [Google Scholar]
- Roucka, M. , Zimmermann K., Fido M., and Nechansky A.. 2016. Application of lectin array technology for biobetter characterization: Its correlation with FcgammaRIII binding and ADCC, Microarrays, 6: 1. [DOI] [PMC free article] [PubMed] [Google Scholar]
- Royle, L. , Mattu T. S., Hart E., Langridge J. I., Merry A. H., Murphy N., Harvey D. J., Dwek R. A., and Rudd P. M.. 2002. An analytical and structural database provides a strategy for sequencing O‐glycans from microgram quantities of glycoproteins, Anal Biochem, 304: 70‐90. [DOI] [PubMed] [Google Scholar]
- Royle, L. , Radcliffe C. M., Dwek R. A., and Rudd P. M.. 2007. Detailed structural analysis of N‐glycans released from glycoproteins in SDS‐PAGE gel bands using HPLC combined with exoglycosidase array digestions. in Brockhausen Inka (ed.), Glycobiology protocols (Humana Press: Totowa, NJ: ). [DOI] [PubMed] [Google Scholar]
- Royle, L. , Roos A., Harvey D. J., Wormald M. R., van Gijlswijk‐Janssen D., Redwan E‐R. M., Wilson I. A., Daha M. R., Dwek R. A., and Rudd P. M.. 2003. Secretory IgA N‐ and O‐glycans provide a link between the innate and adaptive immune systems, Journal of Biological Chemistry, 278: 20140‐53. [DOI] [PubMed] [Google Scholar]
- Rudd, P. M. , and Dwek R. A.. 1997. Rapid, sensitive sequencing of oligosaccharides from glycoproteins, Current Opinion in Biotechnology, 8: 488‐97. [DOI] [PubMed] [Google Scholar]
- Rudd, P. M. , Endo T., Colominas C., Groth D., Wheeler S. F., Harvey D. J., Wormald M. R., Serban H., Prusiner S. B., Kobata A., and Dwek R. A.. 1999. Glycosylation differences between the normal and pathogenic prion protein isoforms, Proceedings of the National Academy of Sciences, 96: 13044‐49. [DOI] [PMC free article] [PubMed] [Google Scholar]
- Rudd, P. M. , Mattu T. S., Masure S., Bratt T., Van den Steen P. E., Wormald M. R., Kuster B., Harvey D. J., Borregaard N., Van Damme J., Dwek R. A., and Opdenakker G.. 1999. Glycosylation of natural human neutrophil gelatinase B and neutrophil gelatinase B‐associated lipocalin, Biochemistry, 38: 13937‐50. [DOI] [PubMed] [Google Scholar]
- Rudman, N. , Gornik O., and Lauc G.. 2019. Altered N‐glycosylation profiles as potential biomarkers and drug targets in diabetes, FEBS Lett, 593: 1598‐615. [DOI] [PubMed] [Google Scholar]
- Ruhaak, L. R. , Deelder A. M., and Wuhrer M.. 2009. Oligosaccharide analysis by graphitized carbon liquid chromatography–mass spectrometry, Analytical and Bioanalytical Chemistry, 394: 163‐74. [DOI] [PubMed] [Google Scholar]
- Ruhaak, L. R. , Hennig R., Huhn C., Borowiak M., Dolhain R. J., Deelder A. M., Rapp E., and Wuhrer M.. 2010. Optimized workflow for preparation of APTS‐labeled N‐glycans allowing high‐throughput analysis of human plasma glycomes using 48‐channel multiplexed CGE‐LIF, J Proteome Res, 9: 6655‐64. [DOI] [PubMed] [Google Scholar]
- Ruhaak, L. R. , Huhn C., Waterreus W‐J., de Boer A. R., Neusüss C., Hokke C. H., Deelder A. M., and Wuhrer M.. 2008. Hydrophilic interaction chromatography‐based high‐throughput sample preparation method for N‐glycan analysis from total human plasma glycoproteins, Analytical Chemistry, 80: 6119‐26. [DOI] [PubMed] [Google Scholar]
- Ruhaak, L. R. , Xu G., Li Q., Goonatilleke E., and Lebrilla C. B.. 2018. Mass spectrometry approaches to glycomic and glycoproteomic analyses, Chemical Reviews, 118: 7886‐930. [DOI] [PMC free article] [PubMed] [Google Scholar]
- Ruhaak, L. R. , Zauner G., Huhn C., Bruggink C., Deelder A. M., and Wuhrer M.. 2010. Glycan labeling strategies and their use in identification and quantification, Analytical and Bioanalytical Chemistry, 397: 3457‐81. [DOI] [PMC free article] [PubMed] [Google Scholar]
- Sarkozy, D. , Borza B., Domokos A., Varadi E., Szigeti M., Meszaros‐Matwiejuk A., Molnar‐Gabor D., and Guttman A.. 2020. Ultrafast high‐resolution analysis of human milk oligosaccharides by multicapillary gel electrophoresis, Food Chem, 341: 128200. [DOI] [PubMed] [Google Scholar]
- Sastre Toraño, J. , Aizpurua‐Olaizola O., Wei N., Li T., Unione L., Jiménez‐Osés G., Corzana F., Somovilla V. J., Falcon‐Perez J. M., and Boons G.‐J.. 2021. Identification of isomeric N‐glycans by conformer distribution fingerprinting using ion mobility mass spectrometry, Chemistry, 27: 2149‐54. [DOI] [PMC free article] [PubMed] [Google Scholar]
- Scherer, H. U. , Wang J., Toes R. E., van der Woude D., Koeleman C. A., de Boer A. R., Huizinga T. W., Deelder A. M., and Wuhrer M.. 2009. Immunoglobulin 1 (IgG1) Fc‐glycosylation profiling of anti‐citrullinated peptide antibodies from human serum, Proteomics Clin Appl, 3: 106‐15. [DOI] [PubMed] [Google Scholar]
- Schjoldager, Katrine T , Narimatsu Yoshiki, Joshi Hiren J, and Clausen Henrik. 2020. Global view of human protein glycosylation pathways and functions, Nature Reviews Molecular Cell Biology, 21: 729‐49. [DOI] [PubMed] [Google Scholar]
- Schwarzer, J. , Rapp E., and Reichl U.. 2008. N‐glycan analysis by CGE–LIF: Profiling influenza A virus hemagglutinin N‐glycosylation during vaccine production, Electrophoresis, 29: 4203‐14. [DOI] [PubMed] [Google Scholar]
- Selman, M. H. , Hemayatkar M., Deelder A. M., and Wuhrer M.. 2011. Cotton HILIC SPE microtips for microscale purification and enrichment of glycans and glycopeptides, Anal. Chem., 83: 2492‐9. [DOI] [PubMed] [Google Scholar]
- Sénard, T. , Gargano A. F. G., Falck D., de Taeye S. W., Rispens T., Vidarsson G., Wuhrer M., Somsen G. W., and Domínguez‐Vega E.. 2020. MS‐based allotype‐specific analysis of polyclonal IgG‐Fc N‐glycosylation, Frontiers in Immunology, 11, 2049. [DOI] [PMC free article] [PubMed] [Google Scholar]
- Sethi, M. K. , Downs M., and Zaia J.. 2020. Serial in‐solution digestion protocol for mass spectrometry‐based glycomics and proteomics analysis, Molecular Omics, 16: 364‐76. [DOI] [PMC free article] [PubMed] [Google Scholar]
- Shajahan, A. , Supekar N., Heiss C., and Azadi P.. 2019. High‐throughput automated micro‐permethylation for glycan structure analysis, Analytical Chemistry, 91: 1237‐40. [DOI] [PMC free article] [PubMed] [Google Scholar]
- Shevchenko, A. , Wilm M., Vorm O., and Mann M.. 1996. Mass spectrometric sequencing of proteins silver‐stained polyacrylamide gels, Analytical Chemistry, 68: 850‐8. [DOI] [PubMed] [Google Scholar]
- Shubhakar, A. , Kozak R. P., Reiding K. R., Royle L., Spencer D. I., Fernandes D. L., and Wuhrer M.. 2016. Automated high‐throughput permethylation for glycosylation analysis of biologics using MALDI‐TOF‐MS, Analytical Chemistry, 88: 8562‐9. [DOI] [PubMed] [Google Scholar]
- Slavov, N. 2021. Single‐cell protein analysis by mass spectrometry, Current Opinion in Chemical Biology, 60: 1‐9. [DOI] [PMC free article] [PubMed] [Google Scholar]
- Stadlmann, J. , Pabst M., Kolarich D., Kunert R., and Altmann F.. 2008. Analysis of immunoglobulin glycosylation by LC‐ESI‐MS of glycopeptides and oligosaccharides, Proteomics, 8: 2858‐71. [DOI] [PubMed] [Google Scholar]
- Stavenhagen, K. , Hinneburg H., Thaysen‐Andersen M., Hartmann L., Varón Silva D., Fuchser J., Kaspar S., Rapp E., Seeberger P. H., and Kolarich D.. 2013. Quantitative mapping of glycoprotein micro‐heterogeneity and macro‐heterogeneity: An evaluation of mass spectrometry signal strengths using synthetic peptides and glycopeptides, Journal of Mass Spectrometry, 48: i. [DOI] [PubMed] [Google Scholar]
- Stavenhagen, K. , Kayili H. M., Holst S., Koeleman C. A. M., Engel R., Wouters D., Zeerleder S., Salih B., and Wuhrer M.. 2018. N‐ and O‐glycosylation Analysis of Human C1‐inhibitor Reveals Extensive Mucin‐type O‐Glycosylation, Molecular & Cellular Proteomics, 17: 1225‐38. [DOI] [PMC free article] [PubMed] [Google Scholar]
- Stavenhagen, K. , Kolarich D., and Wuhrer M.. 2015. Clinical glycomics employing graphitized carbon liquid chromatography‐mass spectrometry, Chromatographia, 78: 307‐20. [DOI] [PMC free article] [PubMed] [Google Scholar]
- Szarka, M. , Szigeti M., and Guttman A.. 2019. imaging laser‐induced fluorescence detection at the taylor cone of electrospray ionization mass spectrometry, Analytical Chemistry, 91: 7738‐43. [DOI] [PubMed] [Google Scholar]
- Thomas, D. R. , and Scott N. E.. 2021. Glycoproteomics: Growing up fast, Current Opinion in Structural Biology, 68: 18‐25. [DOI] [PubMed] [Google Scholar]
- Váradi, C. , Lew C., and Guttman A.. 2014. Rapid magnetic bead based sample preparation for automated and high throughput N‐glycan analysis of therapeutic antibodies, Analytical Chemistry, 86: 5682‐7. [DOI] [PubMed] [Google Scholar]
- Varki, A. 2017. Biological roles of glycans, Glycobiology, 27: 3‐49. [DOI] [PMC free article] [PubMed] [Google Scholar]
- von der Ohe, M. , Wheeler S. F., Wuhrer M., Harvey D. J., Liedtke S., Mühlenhoff M., Gerardy‐Schahn R., Geyer H., Dwek R. A., Geyer R., Wing D. R., and Schachner M.. 2002. Localization and characterization of polysialic acid–containing N‐linked glycans from bovine NCAM, Glycobiology, 12: 47‐63. [DOI] [PubMed] [Google Scholar]
- Vreeker, G. C. M. , Nicolardi S., Bladergroen M. R., van der Plas C. J., Mesker W. E., Tollenaar Raem, van der Burgt Y. E. M., and Wuhrer M.. 2018. Automated plasma glycomics with linkage‐specific sialic acid esterification and ultrahigh resolution MS, Analytical Chemistry, 90: 11955‐61. [DOI] [PMC free article] [PubMed] [Google Scholar]
- Vreeker, G. C. , and Wuhrer M.. 2017. Reversed‐phase separation methods for glycan analysis, Anal Bioanal Chem, 409: 359‐78. [DOI] [PMC free article] [PubMed] [Google Scholar]
- Walt, D. , Aoki‐Kinoshita K. F., Bertozzi C. R., Boons G.‐J., Darvill A., Hart G., Kiessling L., Lowe J., Moon R.. 2012. Transforming glycoscience: A roadmap for the future (National Academies Press: Washington, DC: ). [PubMed] [Google Scholar]
- Wang, C. , Vemulapalli B., Cao M., Gadre D., Wang J., Hunter A., Wang X., and Liu D.. 2018. A systematic approach for analysis and characterization of mispairing in bispecific antibodies with asymmetric architecture, MAbs, 10: 1226‐35. [DOI] [PMC free article] [PubMed] [Google Scholar]
- Wang, J. , Balog C. I., Stavenhagen K., Koeleman C. A., Scherer H. U., Selman M. H., Deelder A. M., Huizinga T. W., Toes R. E., and Wuhrer M.. 2011. Fc‐glycosylation of IgG1 is modulated by B‐cell stimuli, Molecular & Cellular Proteomics, 10: M110.004655. [DOI] [PMC free article] [PubMed] [Google Scholar]
- Wheeler, S. F. , Domann P., and Harvey D. J.. 2009. Derivatization of sialic acids for stabilization in matrix‐assisted laser desorption/ionization mass spectrometry and concomitant differentiation of alpha(2 ‐‐> 3)‐ and alpha(2 ‐‐> 6)‐isomers, Rapid Communications in Mass Spectrometry, 23: 303‐12. [DOI] [PubMed] [Google Scholar]
- Wheeler, S. F. , and Harvey D. J.. 2001. Extension of the in‐gel release method for structural analysis of neutral and sialylated N‐linked glycans to the analysis of sulfated glycans: application to the glycans from bovine thyroid‐stimulating hormone, Anal Biochem, 296: 92‐100. [DOI] [PubMed] [Google Scholar]
- Whitmore, C. D. , Olsson U., Larsson E. A., Hindsgaul O., Palcic M. M., and Dovichi N. J.. 2007. Yoctomole analysis of ganglioside metabolism in PC12 cellular homogenates, Electrophoresis, 28: 3100‐04. [DOI] [PubMed] [Google Scholar]
- Wilkinson, H. , and Saldova R.. 2020. Current methods for the characterization of O‐glycans, Journal of Proteome Research, 19: 3890‐905. [DOI] [PubMed] [Google Scholar]
- Williams, S. M. , Liyu A. V., Tsai C. F., Moore R. J., Orton D. J., Chrisler W. B., Gaffrey M. J., Liu T., Smith R. D., Kelly R. T., Pasa‐Tolic L., and Zhu Y.. 2020. Automated coupling of nanodroplet sample preparation with liquid chromatography‐mass spectrometry for high‐throughput single‐cell proteomics, Anal Chem, 92: 10588‐96. [DOI] [PMC free article] [PubMed] [Google Scholar]
- Wilm, M. , Shevchenko A., Houthaeve T., Breit S., Schweigerer L., Fotsis T., and Mann M.. 1996. Femtomole sequencing of proteins from polyacrylamide gels by nano‐electrospray mass spectrometry, Nature, 379: 466‐9. [DOI] [PubMed] [Google Scholar]
- Wilson, N. L. , Schulz B. L., Karlsson N. G., and Packer N. H.. 2002. Sequential analysis of N‐ and O‐linked glycosylation of 2D‐PAGE separated glycoproteins, Journal of Proteome Research, 1: 521‐29. [DOI] [PubMed] [Google Scholar]
- Wiśniewski, J. R. , Zougman A., Nagaraj N., and Mann M.. 2009. Universal sample preparation method for proteome analysis, Nature Methods, 6: 359‐62. [DOI] [PubMed] [Google Scholar]
- Wu, X. , Delbianco M., Anggara K., Michnowicz T., Pardo‐Vargas A., Bharate P., Sen S., Pristl M., Rauschenbach S., Schlickum U., Abb S., Seeberger P. H., and Kern K.. 2020. Imaging single glycans, Nature, 582: 375‐78. [DOI] [PubMed] [Google Scholar]
- Wuhrer, M. 2013. Glycomics using mass spectrometry, Glycoconjugate Journal, 30: 11‐22. [DOI] [PMC free article] [PubMed] [Google Scholar]
- Wuhrer, M. , de Boer A. R., and Deelder A. M.. 2009. Structural glycomics using hydrophilic interaction chromatography (HILIC) with mass spectrometry, Mass Spectrometry Reviews, 28: 192‐206. [DOI] [PubMed] [Google Scholar]
- Wuhrer, M. , and Deelder A. M.. 2005. Negative‐mode MALDI‐TOF/TOF‐MS of oligosaccharides labeled with 2‐aminobenzamide, Analytical Chemistry, 77: 6954‐9. [DOI] [PubMed] [Google Scholar]
- Wuhrer, M. , Koeleman C. A., Deelder A. M., and Hokke C. H.. 2004. Normal‐phase nanoscale liquid chromatography‐mass spectrometry of underivatized oligosaccharides at low‐femtomole sensitivity, Analytical Chemistry, 76: 833‐8. [DOI] [PubMed] [Google Scholar]
- Wuhrer, M. , Koeleman C.A.M., Hokke C. H., and Deelder A.M.. 2004. Nano‐scale liquid chromatography‐mass spectrometry of 2‐aminobenzamide‐labeled oligosaccharides at low femtomole sensitivity, International Journal of Mass Spectrometry, 232: 51‐57. [DOI] [PubMed] [Google Scholar]
- Xiao, H. , Sun F., Suttapitugsakul S., and Wu R.. 2019. Global and site‐specific analysis of protein glycosylation in complex biological systems with mass spectrometry, Mass Spectrometry Reviews, 38: 356‐79. [DOI] [PMC free article] [PubMed] [Google Scholar]
- Xiao, H. , Suttapitugsakul S., Sun F., and Wu R.. 2018. Mass spectrometry‐based chemical and enzymatic methods for global analysis of protein glycosylation, Accounts of Chemical Research, 51: 1796‐806. [DOI] [PMC free article] [PubMed] [Google Scholar]
- Xin, L. , Zhang H., Liu H., and Li Z.. 2012. Equal ratio of graphite carbon to activated charcoal for enrichment of N‐glycopeptides prior to matrix‐assisted laser desorption/ionization time‐of‐flight mass spectrometric identification, Rapid Communications in Mass Spectrometry, 26: 269‐74. [DOI] [PubMed] [Google Scholar]
- Xu, G. , Goonatilleke E., Wongkham S., and Lebrilla C. B.. 2020. Deep structural analysis and quantitation of O‐linked glycans on cell membrane reveal high abundances and distinct glycomic profiles associated with cell type and stages of differentiation, Analytical Chemistry, 92: 3758‐68. [DOI] [PMC free article] [PubMed] [Google Scholar]
- Yang, S. , Zhang L., Thomas S., Hu Y., Li S., Cipollo J., and Zhang H.. 2017. Modification of sialic acids on solid phase: Accurate characterization of protein sialylation, Analytical Chemistry, 89: 6330‐35. [DOI] [PMC free article] [PubMed] [Google Scholar]
- Yang, Y. , Franc V., and Heck A. J. R.. 2017. Glycoproteomics: A balance between high‐throughput and in‐depth analysis, Trends Biotechnol, 35: 598‐609. [DOI] [PubMed] [Google Scholar]
- Yu, A. , Zhao J., Peng W., Banazadeh A., Williamson S. D., Goli M., Huang Y., and Mechref Y.. 2018. Advances in mass spectrometry‐based glycoproteomics, Electrophoresis, 39: 3104‐22. [DOI] [PMC free article] [PubMed] [Google Scholar]
- Zhang, J. , Ten Dijke P., Wuhrer M., and Zhang T.. 2020. Role of glycosylation in TGF‐β signaling and epithelial‐to‐mesenchymal transition in cancer, Protein Cell, 12: 89‐106. [DOI] [PMC free article] [PubMed] [Google Scholar]
- Zhang, T. , de Waard A. A., Wuhrer M., and Spaapen R. M.. 2019. The role of glycosphingolipids in immune cell functions, Front Immunol, 10: 90. [DOI] [PMC free article] [PubMed] [Google Scholar]
- Zhang, T. , Madunić K., Holst S., Zhang J., Jin C., Ten Dijke P., Karlsson N. G., Stavenhagen K., and Wuhrer M.. 2020. Development of a 96‐well plate sample preparation method for integrated N‐ and O‐glycomics using porous graphitized carbon liquid chromatography‐mass spectrometry, Molecular Omics, 16: 355‐63. [DOI] [PubMed] [Google Scholar]
- Zhang, T. , van Die I., Tefsen B., van Vliet S. J., Laan L. C., Zhang J., Ten Dijke P., Wuhrer M., and Belo A. I.. 2020. Differential O‐ and glycosphingolipid glycosylation in human pancreatic adenocarcinoma cells with opposite morphology and metastatic behavior, Frontiers in Oncology, 10: 732. [DOI] [PMC free article] [PubMed] [Google Scholar]
- Zhong, J. , Banazadeh A., Peng W., and Mechref Y.. 2018. A carbon nanoparticles‐based solid‐phase purification method facilitating sensitive MALDI‐MS analysis of permethylated N‐glycans, Electrophoresis, 39: 3087‐95. [DOI] [PMC free article] [PubMed] [Google Scholar]
- Zhou, S. , Veillon L., Dong X., Huang Y., and Mechref Y.. 2017. Direct comparison of derivatization strategies for LC‐MS/MS analysis of N‐glycans, Analyst, 142: 4446‐55. [DOI] [PMC free article] [PubMed] [Google Scholar]
- Zhuang, Z. , Starkey J. A., Mechref Y., Novotny M. V., and Jacobson S. C.. 2007. Electrophoretic analysis of N‐glycans on microfluidic devices, Anal Chem, 79: 7170‐5. [DOI] [PubMed] [Google Scholar]