

Summary
Heterotrophic nanoflagellates (HNF) and ciliates are major protistan planktonic bacterivores. The term HNF, however, describes a functional guild only and, in contrast to the morphologically distinguishable ciliates, does not reflect the phylogenetic diversity of flagellates in aquatic ecosystems. Associating a function with taxonomic affiliation of key flagellate taxa is currently a major task in microbial ecology. We investigated seasonal changes in the HNF and ciliate community composition as well as taxa‐specific bacterivory in four hypertrophic freshwater lakes. Taxa‐specific catalyzed reporter deposition‐fluorescence in situ hybridization probes assigned taxonomic affiliations to 51%–96% (average ±SD, 75 ± 14%) of total HNF. Ingestion rates of fluorescently labelled bacteria unveiled that HNF contributed to total protist‐induced bacterial mortality rates more (56%) than ciliates (44%). Surprisingly, major HNF bacterivores were aplastidic cryptophytes and their Cry1 lineage, comprising on average 53% and 24% of total HNF abundance and 67% and 21% of total HNF bacterivory respectively. Kinetoplastea were important consumers of bacteria during summer phytoplankton blooms, reaching 38% of total HNF. Katablepharidacea (7.5% of total HNF) comprised mainly omnivores, with changing contributions of bacterivorous and algivorous phylotypes. Our results show that aplastidic cryptophytes, accompanied by small omnivorous ciliate genera Halteria/Pelagohalteria, are the major protistan bacterivores in hypertrophic freshwaters.
Introduction
Heterotrophic and mixotrophic flagellates and ciliates are considered as the key bacterivores in aquatic environments (Sherr and Sherr, 1988, 1994; Berninger et al., 1991; Arndt et al., 2000; Jones, 2000). Heterotrophic nanoflagellates (HNF, most commonly 2–8 μm in size) represent an extremely diverse polyphyletic group of largely uncultured protists, lacking sufficient distinctive morphological features for reliable species detection (e.g. Arndt et al., 2000; Jeuck and Arndt, 2013; Adl et al., 2019). Their phylogenetic diversity is hidden behind simple, oval cells, typically owning a single nucleus and one to two flagella. This holds particularly true for the so‐called ‘naked’ planktonic HNF, such as Kinetoplastea, Cercozoa, Spumella‐like and other chrysophytes, or stramenopiles (Arndt et al., 2000; Boenigk and Arndt, 2002; Jürgens and Matz, 2002; Grossmann et al., 2016). Consequently, in classical grazing studies on planktonic prokaryotes, bacterivorous HNF were treated as one taxonomically undefined functional guild, which reacts uniformly to certain environmental factors (Berninger et al., 1991; Sanders et al., 1992; Gasol and Vaqué, 1993).
Although the sequencing of 18S rRNA genes brought new insights into the phylogenetic diversity of protists in planktonic environments (Mangot et al., 2013; Simon et al., 2015; Adl et al., 2019; Bock et al., 2020), the relative abundances of particular protistan phylotypes obtained by sequencing poorly correspond to their microscopic counts in the natural samples (Mukherjee et al., 2015, 2020; Piwosz et al., 2020). The rapidly growing amount of sequence data resulted in a disproportional boom of diversity research not accompanied by a corresponding progress in studies on abundance, morphology and various ecological aspects of individual protistan groups, such as feeding modes or trophic roles in microbial food webs. This obvious imbalance in research likely represents one of the largest knowledge gaps in the field and significantly limits hypothesis‐driven research on ecological traits of protists (Grossmann et al., 2016; Stern et al., 2018; Pitsch et al., 2019; Piwosz et al., 2021).
However, eukaryotic 18S rRNA encoding gene sequences of natural protistan communities provide valuable information on the distribution patterns of various protistan groups in a broad variety of aquatic habitats (e.g. Logares et al., 2012; de Vargas et al., 2015; Bock et al., 2020; Sieber et al., 2020) and for designing novel probes for catalyzed reporter deposition fluorescence in situ hybridization (CARD‐FISH), targeting the major protistan groups in aquatic environments (Piwosz et al., 2021). The CARD‐FISH became an indispensable tool for studying eukaryotic communities in the plankton, focusing on their ecological role and trophic interactions (Not et al., 2005, 2008; Mangot et al., 2009; Lepère et al., 2010; Unrein et al., 2014; Mukherjee et al., 2015; Piwosz et al., 2016). Current CARD‐FISH protocols targeting protists in combinations with various fluorescence‐labelling techniques allow determining taxonomic affiliation and feeding modes of protists at a single cell level in natural environments (Massana et al., 2006, 2009; Unrein et al., 2014; Grujčić et al., 2018; Šimek et al., 2020).
The progress in applications of CARD‐FISH probes to protists detection was the basis for new intriguing findings in aquatic microbial ecology, reflecting a shift from originally morphology‐based microscopic approaches to their combinations with molecular methods: (i) Using specific FISH probes, novel lineages of marine Stramenopiles (MAST), such as nanoplanktonic MAST‐4 and MAST‐1 lineages were discovered as ubiquitous in open oceans, contributing up to 20% of all HNF and exhibiting high growth and bacterivory rates (Massana et al., 2006, 2009; Mangot et al., 2018); (ii) Several recent studies suggested that small aplastidic cryptophytes (Piwosz et al., 2016; Grujčić et al., 2018) can play an important role as pelagic HNF bacterivores; (iii) There is increasing evidence that Kinetoplastea and omnivorous Katablepharidacea can be important bacterivores in a broader variety of freshwater pelagic habitats (Arndt and Mathes, 1991; Boenigk and Arndt, 2000; Domaizon et al., 2003; Mukherjee et al., 2015, 2019). These findings indicated that small ‘Spumella‐like’ chrysophytes, choanoflagellates and other easily cultivable groups are less important planktonic flagellated bacterivores than has been assumed on the basis of classical morphology‐based microscopic studies (Arndt et al., 2000; Boenigk and Arndt, 2002; Jürgens and Matz, 2002; Jeuck and Arndt, 2013). Consequently, current concepts describing the composition and grazing activities of major freshwater bacterivorous HNF and ciliates (Šimek et al., 2019) require considerable revisions and verifications under natural conditions.
Shallow freshwater hypertrophic lakes are becoming the most common waterbodies worldwide (Scheffer, 2004; Meerhoff and Jeppesen, 2009), while microbial trophic interactions are largely understudied in these systems (Sommaruga, 1995; Šimek et al., 2019) with the exception of certain aspects of trophic cascading from fishes and zooplankton to primary producers and microbes (Jeppesen et al., 1998; Jürgens and Jeppesen, 2000). Notably, these hypertrophic lakes represent ideal, model ecosystems with high HNF and ciliate abundances (Arndt et al., 2000; Šimek et al., 2019) suitable for applications of CARD‐FISH probes targeting HNF at different taxonomic levels, which can serve as ‘high resolution in situ laboratories’ for testing hypotheses on the role and feeding preferences of aquatic protists.
To track the temporal HNF community dynamics in four hypertrophic lakes, we used CARD‐FISH probes targeting important groups containing bacterivorous representatives, while ciliate assemblages were analyzed by means of classical staining procedures (Posch et al., 2015). To assess taxon‐specific and aggregated bacterivory rates of HNF and ciliates, we used fluorescently labelled bacteria (FLB) as tracers. While major ciliate bacterivorous taxa in shallow lakes have been reported (Šimek et al., 2019), much less is known about core HNF bacterivorous taxa, requiring the use of FISH probes in combination with prey tracer techniques in situ (Massana et al., 2009; Unrein et al., 2014). The previous studies and our preliminary applications of CARD‐FISH probes targeting flagellates indicated high proportions of aplastidic cryptophytes, kinetoplastids and katablepharids in samples from eutrophic brackish waters (Piwosz et al., 2016, 2021), a mesoeutrophic reservoir (Grujčić et al., 2018; Šimek et al., 2020), and also from the investigated hypertrophic shallow lakes. These studies suggested that small aplastidic cryptophytes and their Cry1 lineage might be bacterivorous and, moreover, highly abundant members of plankton communities. Also a recent finding of a significant correlation between cryptophytes and bacteria in sequencing‐based study of 83 lakes on a European scale (Bock et al., 2020) seems to support this trophic coupling. Using available FISH probes, we tested whether the aplastidic Cryptophyceae and their Cry1 lineage are important flagellated bacterivores in hypertrophic lakes. Furthermore, we expect that these shallow lakes, rich in organic particles with associated bacteria, such as algal and colonial cyanobacterial blooms, host large populations of bacterivorous Kinetoplastea, considered as grazers on particle‐associated bacteria (Caron, 1987; Zubkov and Sleigh, 2000; Mukherjee et al., 2015). Members of another ubiquitous group of freshwaters flagellates, Katablepharidacea (Arndt et al., 2000; Bock et al., 2020; Sieber et al., 2020), are considered mostly as algivorous or omnivorous HNF. However, we hypothesize that they are important bacterivores in prokaryote‐rich hypertrophic lakes.
Results
Basic physical, chemical and microbial characteristics of the lakes
The monthly sampling (April–September 2018) yielded 24 analyses of microbiological and chemical parameters (Figs 1, 2, 3; Supplementary Tables S1 and S2). These data indicated the hypertrophic state of the lakes, reflected in low water transparency (15–90 cm), high nutrient and Chl‐a concentrations, and microbial abundances (Fig. 1). The average (±SD) abundances of the heterotrophic microbes were 21.8 ± 12.7 × 10⁶ bacteria ml−1, 11.1 ± 7.2 × 10³ HNF ml−1 and 265 ± 207 ciliates ml−1. Low microbial abundances in the lake Rod in April and May (Fig. 1B) and enhanced water transparency >130 cm was due to a temporal clear‐water phase with low Chl‐a concentrations and high cladoceran abundances (180–565 individuals L−1).
Fig. 1.
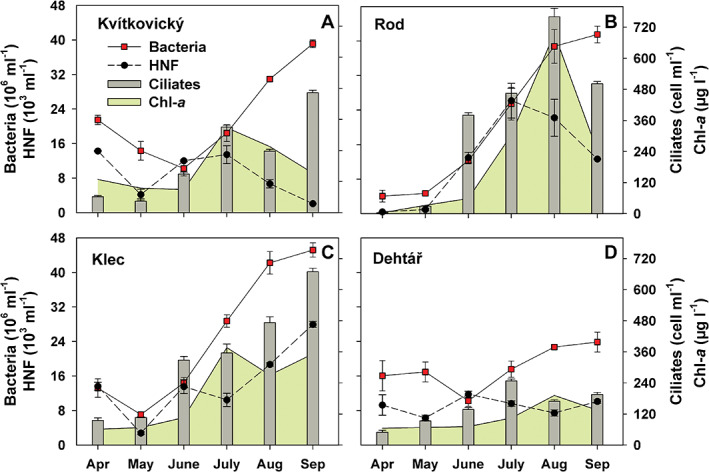
Time‐course changes in total abundance of bacteria, heterotrophic flagellates, ciliates and concentrations of chlorophyll‐a in ponds Kvítkovický (A), Rod (B), Klec (C) and Dehtář (D) over the period April–September 2018. Values are means of duplicates; error bars show range of values.
Fig. 2.
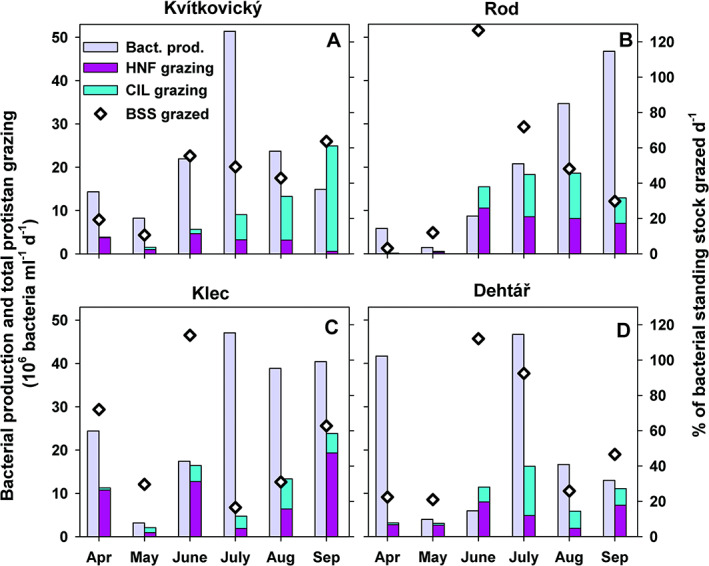
Bacterial production and HNF and ciliate bacterivory in ponds Kvítkovický (A), Rod (B), Klec (C) and Dehtář (D): Time‐course changes in bacterial production of free‐living bacteria (fraction <1 μm) compared to total aggregated protistan bacterivory divided into total HNF and ciliate grazing shown in stacked bars and in proportions (%) of total bacterial standing stocks (BSS, shown as black diamonds) removed by aggregated grazing of both protistan groups per day.
Fig. 3.
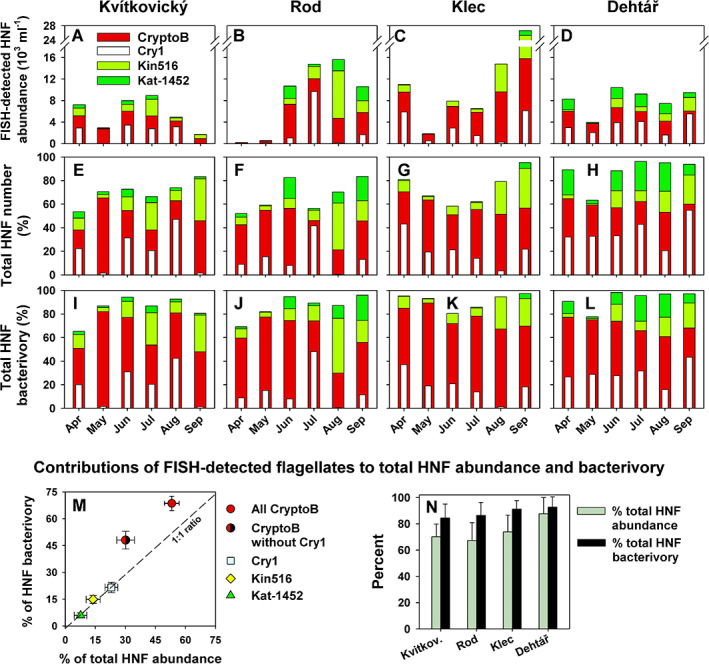
Time‐course changes in HNF assemblage composition and bacterivory in lakes Kvítkovický (A, E, I), Rod (B, F, J), Klec (C, G, K) and Dehtář (D, H, L) over the period April to September. Upper panels (A–D) show absolute abundances of the four FISH‐defined flagellate groups targeted by the probes CryptoB and Cry1‐652 allowing the detection of total aplastidic cryptophytes and its Cry1 lineage respectively, by the probe Kin516 for kinetoplastids and Kat‐1452 detecting katablepharids. Middle panels (E–H) show relative contributions of the four FISH‐defined flagellate groups to total HNF, and lower panels (I–L) show relative contributions of the four FISH‐defined flagellate groups to total HNF bacterivory. Values of abundances (A–D) and relative contributions (E–H) of FISH‐defined protistan groups are means of duplicates. The panel M shows overall averages (n = 24) of relative contributions of the probe‐defined groups to total HNF community and total HNF bacterivory, with error bars depicting bidirectional values of standard errors of the means. ‘CryptoB without Cry1’ represent mean values for the subgroup of the aplastidic cryptophytes targeted by the general probe CryptoB but not hybridized with the lineage‐specific probe Cry1‐652. The panel N shows average values (n = 6 samples per lake) of relative contributions of the probe‐defined groups to total HNF community and total HNF bacterivory in particular lakes, with error bars depicting SDs.
Microbial food web dynamics and bacterial mortality induced by protistan grazing
Marked increases in concentrations of bacteria, HNF, ciliates and Chl‐a were observed during the June–September period (Fig. 1). Phytoplankton biomass fluctuated in a wide range of Chl‐a values of 65–696 μg L−1 (Fig. 1; Supplementary Table S2). Based on the FLB tracer technique, HNF and ciliates were the most important bacterivores while no FLB uptake was observed in plastid‐bearing flagellated protists. The relative importance of aggregated HNF and ciliate bacterivory, as proportions of bacterial production grazed in the size fraction <1 μm, or proportions of bacterial standing stock grazed per day (Fig. 2A–D), accounted (average ± SD) for 53.1 ± 61% and 51 ± 60% (ranging only moderately – from 40.2% to 54.9% in the particular lakes, for details see Table 2) respectively. Average doubling times of suspended bacteria based on the thymidine uptake assay were 19 ± 10 h (median 23 h).
Table 2.
Parameters of protistan grazing on bacteria in four shallow hypertrophic lakes: Relative proportions of bacterial standing stocks grazed by both HNF and ciliates per day and the relative contributions of HNF and ciliates to their aggregated total bacterivory rates. The values represent averages (bold) with range of values (min–max) in parenthesis for the spring period (April to June, n = 3), summer (July to September, n = 3) and the whole study period (April‐September, n = 6).
| Lake | Period | Bacterial standing grazed per day (%) | HNF (%) | Ciliate (%) |
|---|---|---|---|---|
| April ‐ June | 28.5 (10.6 – 55.5) | 77.7 (66.4 – 84.4) | 22.3 (15.8 – 33.6) | |
| Kvítkovský | July ‐ Sept. | 51.9 (42.9 – 63.7) | 27.4 (24 – 35.8) | 72.6 (64.2 – 77.7) |
| April ‐ Sept. | 40.2 (10.6 – 63.7) | 55.2 (24 – 84.4) | 44.8 (15.8 – 77.7) | |
| April ‐ June | 47.2 (5.6 – 126) | 64.2 (56.2 – 68.4) | 35.8 (31.7 – 43.9) | |
| Rod | July ‐ Sept. | 49.9 (29.7 – 71.9) | 48.4 (43.8 – 54.5) | 51.6 (45.5 – 56.2) |
| April ‐ Sept. | 48.5 (5.6 – 126) | 56.3 (43.8 – 68.4) | 43.7 (31.7 – 56.2) | |
| April ‐ June | 71.9 (29.4 – 114) | 71.5 (45.4 – 91.7) | 28.5 (8.3 – 54.6) | |
| Klec | July ‐ Sept. | 36.8 (16.6 – 62.8) | 49.4 (39.9 – 60.2) | 50.6 (39.8 – 60.1) |
| April ‐ Sept. | 54.3 (16.6 – 114) | 60.8 (39.9 – 91.7) | 39.2 (8.3 – 60.1) | |
| April ‐ June | 51.8 (22.4 – 112) | 74.1 (70.1 – 77.2) | 25.9 (22.8 – 30.1) | |
| Dehtář | July ‐ Sept. | 54.9 (46.5 – 92.4) | 42.6 (29.9 – 65.2) | 57.4 (34.8 – 70.1) |
| April ‐ Sept. | 53.4 (22.4 – 112) | 58.3 (29.9 – 77.2) | 41.7 (22.8 – 70.1) |
There was a large temporal variability in the contributions of HNF and ciliates to their aggregated bacterivory rates (Fig. 2A–D). On average, HNF bacterivory was slightly but insignificantly (t‐test, p > 0.05) higher than ciliate grazing, accounting for 56% and 44% of total HNF and ciliate bacterivory, respectively. However, we found a consistent trend of higher proportions of HNF bacterivory in spring (66.4%–77.7%, Table 2), compared to higher ciliate contributions to the aggregated protistan grazing during summer months in all lakes (50.6%–72.6%).
Flagellate assemblage composition and grazing assessed by CARD‐FISH and FLB
The four selected FISH probes targeting major bacterivorous flagellate taxa (Fig. 3; Table 1) cumulatively targeted 51%–96% (average ± SD, 75 ± 14%) of total HNF (Fig. 3E–H). Thus, the dynamics of the majority of HNF bacterivores was covered at sufficient resolution, revealing marked compositional changes in time and between the lakes (Fig. 3), but also general patterns in the representation of the probe‐defined flagellate taxa. The following order of their average contributions (±SD, n = 24) to total HNF were determined: total heterotrophic Cryptophyceae (probe CryptoB, 53 ± 13%), its Cry1 lineage (Cry1‐652, 23 ± 16%), Kinetoplastea (Kin516, 14 ± 12%) and Katablepharidacea (Kat‐1452, 7.5 ± 8%). While high proportions of aplastidic CryptoB were observed in all samples, their Cry1 lineage showed a more irregular distribution, accounting for the majority of all aplastidic cryptophytes in some samples, while being almost absent in some late‐summer samples from Kvítkovický and Rod (Fig. 3A–D).
Table 1.
Characteristics of CARD‐FISH probes used in this study.
| Probe | Target | Sequence 5′‐3′ | Formamide concentration (%) | Reference |
|---|---|---|---|---|
| Crypto B | Cryptophyceae_1 | ACGGCCCCAACTGTCCCT | 50 | Metfies et al. (2007) |
| Cry1‐652 | CRY1 lineage of cryptophytes | TTTCACAGTWAACGATCCGCGC | 30 | Grujčić et al. (2018) |
| Kat‐1452 | Uncultured Katablepharidacea | TTCCCGCARMATCGACGGCG | 60 | Grujčić et al. (2018) |
| Kin516 | Kinetoplastea | ACCAGACTTGTCCTCC | 30 | Bochdansky and Huang (2010) |
| EUK516 | Competitor for probe Kin516 | ACCAGACTTGCCCTCC | 30 | Bochdansky and Huang (2010) |
The applied taxonomic terminology followed a review of Adl et al. (2019).
Kinetoplastids were present in all samples, but were more abundant during the summer period (Fig. 3A–H), along with algal and cyanobacterial blooms. This was also reflected in significant positive correlations of kinetoplastid numbers with concentrations of Chl‐a and cyanobacterial biomass (r 2 = 0.557 and 0.408 respectively, p < 0.001; Supplementary Fig. S1). Katablepharids were most abundant in the Rod and Dehtář lakes, particularly in summer months, while being almost absent in Klec (Fig. 3A–H).
On a cell‐specific basis of all HNF, flagellate grazing rates ranged from 7.6 to 39.2 bacteria flagellate−1 h−1, averaging 18.4 ± 8.5 (±SD) bacteria flagellate−1 h−1 and the mean cell volume (MCV) for the whole HNF community was 34.0 ± 11.5 μm3. However, the combination of CARD‐FISH and FLB tracer techniques allowed us to estimate also taxa‐specific MCV and grazing rates (Table 3) and aggregated grazing impacts of different probe‐defined flagellate taxa (Figs 3 and 4). Evaluating all samples (Fig. 3I–L), the average (±SD) contributions of the probe‐defined groups to total HNF bacterivory were: total aplastidic cryptophytes (probe CryptoB, 67 ± 13%), its Cry1 lineage (Cry1‐652, 21 ± 13%), kinetoplastids (Kin516, 14 ± 11%) and katablepharids (Kat‐1452, 7 ± 1.4%). Moreover, analyses of a number of DAPI‐stained bacteria in food vacuoles of CARD‐FISH‐targeted bacterivorous flagellates provided, independently of the tracer technique, an additional snap‐shot proxy of bacterial uptake rates and individual in situ variability of the uptake data (see examples in Table 4 and Supplementary Fig. S2). This relative proxy of bacterivory indicated comparable numbers of ingested natural bacteria over summer months by Cry1 and kinetoplastids compared to all HNF (Supplementary Fig. S2[A,C]), while being significantly higher in CryptoB group compared to all HNF (Fig. S2[B]). In contrast, Katablepharids showed remarkable changes in bacterial uptake over the season, with almost no bacteria ingested in the springtime, yielding a highly significant difference of this proxy compared to all HNF (Table 4 and Supplementary Fig. S2[D]).
Table 3.
Cell‐specific bacterial uptake rates, cell biovolumes of different probe‐defined flagellate taxa and estimated range of doubling times of the flagellate groups, based on bacterial prey biovolume ingested (bacterial MCV, 0.095 μm3) per hour as related to the flagellate MCV, assuming a range of 30–40% of HNF volumetric gross growth efficiency (Straile, 1997; Šimek et al., 2018).
| Probe | Cell‐specific uptake rates (bacteria cell‐1 h‐1) | Flagellate lineage‐specific cell volumes (μm3) | Estimated average doubling time (hours) | ||
|---|---|---|---|---|---|
| Mean ± SD | range | Mean ± SD | range | range | |
| CryptoB | 28.2 ± 11.9 | 10.6 – 55.2 | 53.8 ± 82.2 | 4.6 – 726 | 49 – 66 |
| Cry1‐652 | 18.3 ± 8.3 | 7.4 – 38.6 | 18.4 ± 9.2 | 4.5 – 41.5 | 24 –32 |
| Kin516 | 22.4 ± 9.7 | 8.9 – 46.0 | 73.8 ± 64.8 | 15.0 – 368 | 83 –111 |
| Kat‐1452 | 15.6 ± 7.7 | 5.2 – 34.6 | 149 ± 60.2 | 48.0 – 308 | 248 –330 |
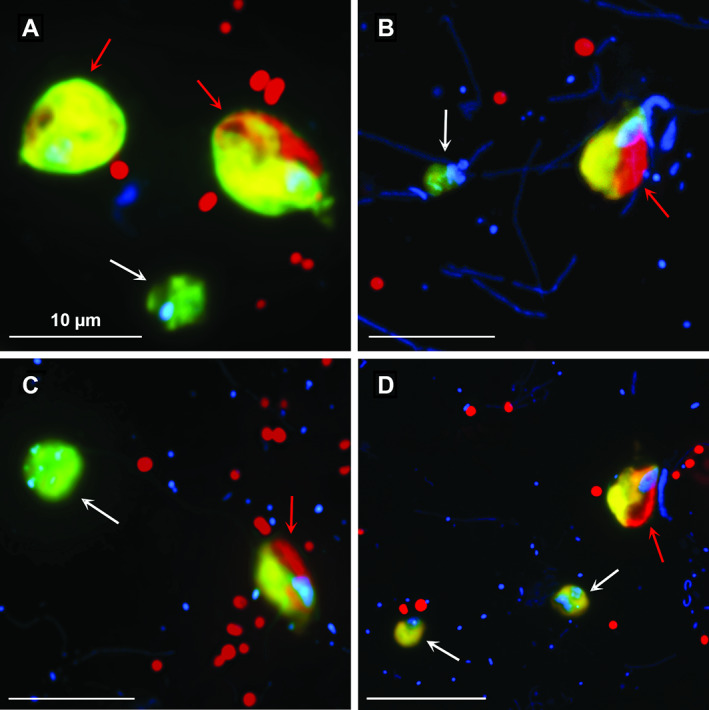
Fig. 4.
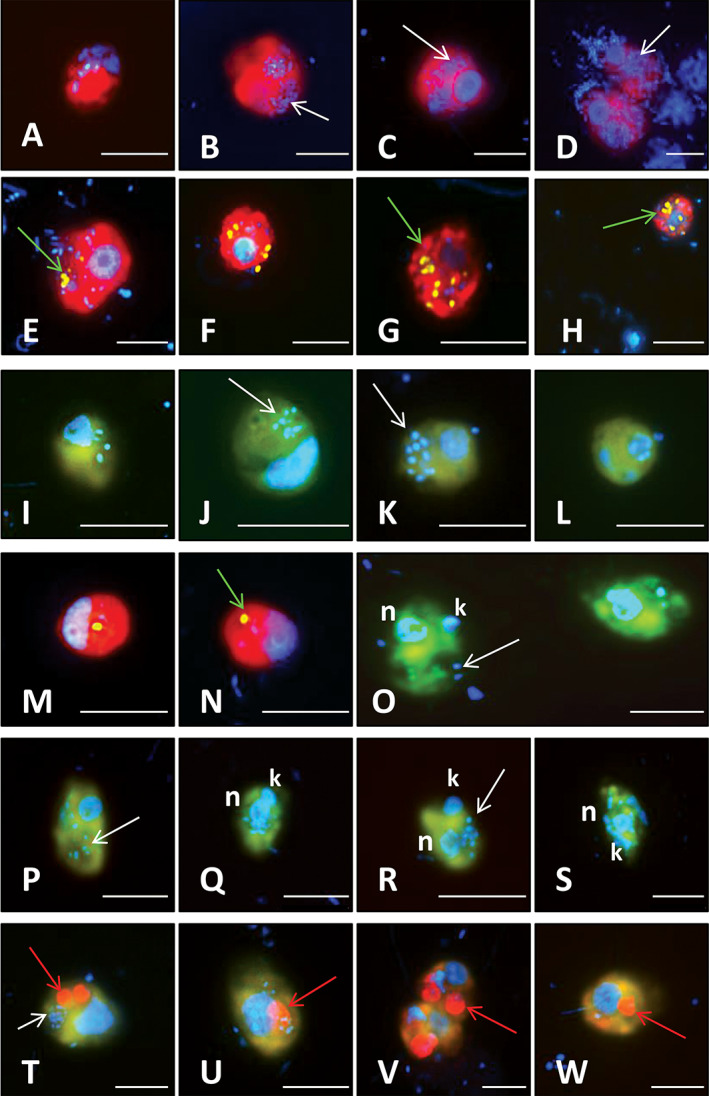
Microphotographs showing typical flagellate morphologies and sizes of the cells targeted by four eukaryotic FISH probes with ingested prey. Shown are overlay Z‐stack images of flagellates targeted by probes (FITC‐stained flagellates [yellow] and DAPI‐stained bacteria and protistan nuclei [blue]; I–L, O–W), or cryptophyte cells targeted by probes CryptoB or Cry1‐652 (Alexa546‐stained flagellates [red] in A–H, M, N; DAPI‐stained nuclei and bacteria [blue], and DTAF‐labelled ingested FLB [yellow]; E–H, M, N). Shown are flagellate morphotypes targeted by probe CryptoB (A–H) and by probe Cry1‐652 (I–N) with ingested bacteria; bacterivorous kinetoplastid flagellates targeted by probe Kin516 (O–S) with visible DAPI‐stained nucleus (n), kinetoplast (k) and ingested bacteria; and omnivorous katablepharids (T–W) targeted by probe Kat‐1452 with ingested bacterial (T, U) or algal prey (red spots in cells, T–W). White arrows highlight examples of typical positions of ingested bacteria (B–D, J, K, O, P, R, T), green arrows of ingested FLBs (E, G, H, N), and red arrows positions of ingested algae (T–W) in the grazer food vacuoles. The scale bar shows a length of 5 μm.
Table 4.
Average numbers (± SD) of ingested DAPI‐stained bacteria detected in food vacuoles of FISH‐positive subgroups of flagellates targeted by the probes Cry1‐652, CryptoB, Kin516, and Kat‐1452, compared to all HNF (All) present in selected samples from the lakes Rod, Dehtář and Klec. Significant differences (t‐test) between average (n = 51– 81) uptake rates of probe‐defined groups versus all flagellates are highlighted by p values in bold.
| HNF probe | Lake | Date | Bacteria flagellate‐1 | t‐test | |
|---|---|---|---|---|---|
| Probe‐targeted cells | All HNF cells | p | |||
| Rod | 17 ‐ Jul ‐ 2018 | 4.20 ± 2.11 | 4.12 ± 3.08 | 0.8806 | |
| Cry1‐652 | Dehtář | 19 ‐ Jul ‐ 2018 | 3.66 ± 1.91 | 3.40 ± 2.76 | 0.5656 |
| Dehtář | 16 ‐ Aug ‐ 2018 | 3.83 ± 1.75 | 4.31 ± 3.15 | 0.3263 | |
| Rod | 17 ‐ Jul ‐ 2018 | 5.07 ± 3.54 | 3.87 ± 2.53 | 0.0300 | |
| CryptoB | Dehtář | 16 ‐ Aug ‐ 2018 | 6.01 ± 5.28 | 3.95 ± 2.03 | 0.0017 |
| Dehtář | 13 ‐ Sep ‐ 2018 | 4.89 ± 3.38 | 3.53 ± 2.38 | 0.0148 | |
| Klec | 14 ‐ Aug ‐ 2018 | 5.62 ± 3.5 | 5.13 ± 3.26 | 0.4575 | |
| Kin516 | Rod | 14 ‐ Aug ‐ 2018 | 5.30 ± 2.48 | 5.02 ± 3.35 | 0.6145 |
| Dehtář | 13 ‐ Sep ‐ 2018 | 5.33 ± 2.63 | 3.70 ± 2.26 | 0.0008 | |
| Rod | 18 ‐ May ‐ 2018 | 1.32 ± 2.84 | 4.69 ± 2.41 | <0.0001 | |
| Kat‐1452 | Dehtář | 19 ‐ Jul ‐ 2018 | 3.96 ± 4.87 | 4.38 ± 2.96 | 0.5446 |
| Dehtář | 13 ‐ Sep ‐ 2018 | 6.16 ± 6.29 | 4.35 ± 2.60 | 0.0199 | |
Grazing of all aplastidic cryptophytes, targeted by the CryptoB probe, clearly dominated the aggregated protozoan (of both HNF and ciliate) bacterivory: this group alone consumed ~25%–35% of bacterial production. Note that it was quite easy to distinguish the smaller aplastidic (heterotrophic) and plastid‐bearing flagellate cells (‘green’ algae such Rhodomonas or Cryptomonas spp.) in natural samples processed by CARD‐FISH, both being targeted by the same general probe (CryptoB) for cryptophytes (Fig. 5). The autotrophic cryptophytes, such as Rhodomonas and Cryptomonas spp., have much larger cells (9–18 μm in size), keeping well preserved ovoid drop‐shaped morphology in FISH preparations, with characteristically located chloroplasts and no FLB uptake. In contrast, much smaller heterotrophic cryptophytes are voracious bacterivores without chloroplasts (Figs 4 and 5).
Fig. 5.
Microphotographs showing overlay Z‐stack images of aplastidic and chloroplast‐bearing cryptophytes (A–D) hybridized with probe CryptoB (FITC‐stained flagellates [yellow], DAPI‐stained protistan nuclei and bacteria [blue] and chloroplasts in cryptophytes and picocyanobacterial cells [red]). Presence of heterotrophic (white arrows) and autotrophic (red arrows) members of the target group is shown on the same microscopic field in samples from the studied lakes. A considerably larger cell size and the presence of chloroplasts in Rhodomonas sp. illustrate an easy differentiation of the autotrophic cryptophytes (red arrows in A–D) from their small heterotrophic counterparts. The scale bar shows a length of 10 μm.
The prominent heterotrophic bacterivores (CryptoB in Fig. 3) were morphologically diverse, with cell length from 3 to 12 μm and MCV of 54 ± 82 μm3 (Table 3, see examples in Fig. 4A–H). All these phylotypes ingested natural bacteria and FLB (Fig. 4E–H). Moreover, CryptoB displayed significantly higher numbers of ingested bacteria compared to all HNF present in samples, accompanied with larger uptake variability (Supplementary Fig. S2[B]). Overall, they contributed disproportionally more to total HNF bacterivory than to total HNF abundance (Fig. 3M). For instance, in May they accounted for 80%–90% of total HNF bacterivory (Fig. 3I–L). Also aggregated proportions of the HNF targeted by the three probes, CryptoB, Kin516 and Kat‐1492, contributed disproportionally more to total HNF bacterivory (84.6%–92.7%) than to total HNF abundance (68%–87.6%, for details see Fig. 3N).
Within the Cryptophyceae, members of the monophyletic lineage Cry1 (probe Cry1‐652) represented highly important HNF bacterivores, with relatively uniform morphology and location of nuclei in rounded cells (2.5–5 μm diameter, MCV of 18.4 ± 9.2 μm3; Fig. 4I–N). Their cell‐specific bacterivory rate (Table 3) and the variability of a number of ingested DAPI‐stained bacteria were similar to those of all HNF (Table 4, Supplementary Fig. 2S[A]). The NCBI NT database (Altschul et al., 1990) revealed that the sequences targeted by the Cry1‐652 probe are present in freshwater lakes in Europe, USA, Asia and Africa (Supplementary Table S3).
CARD‐FISH‐stained kinetoplastids were elongated‐ovoid to drop‐shaped flagellates (5–9 μm length, MCV of 74 ± 65 μm3), with a well distinguishable nucleus and kinetoplast after DAPI‐staining (Fig. 4O–S). Their cell‐specific bacterivory rates (Table 3) and numbers of ingested DAPI‐stained bacteria were mostly similar or slightly higher than those of all HNF (Table 4, Supplementary Fig. 2S[C]).
Kathablepharids targeted by probe Kat‐1452 were oblong cells with rounded ends (6–10 μm, MCV of 149 ± 60 μm3, Table 3) with a large posteriorly situated nucleus and two flagella. These phylotypes ingested both bacteria and small algal prey as documented in Fig. 4T–W. However, bacterial uptakes in July and September samples indicated a larger role of bacterivory during summer, compared to the negligible bacterivory (Supplementary Fig. 2S[D]) and the prominence of algivory exhibited by this group in May. Besides the studied hypertrophic lakes, the sequences targeted by Kat‐1452 probe were detected in freshwater habitats in Europe and USA (Supplementary Table S4).
Ciliate assemblage composition and bacterivory
The lakes were numerically dominated by Stichotrichia (Halteria and Pelagohalteria spp.), algivorous Prorodontida (Urotricha spp. and Balanion planktonicum), and Oligotrichia (namely, Rimostrombidium spp., Fig. 6A–D). The ciliate cell‐specific uptake rates ranged from 279 to 1976 bacteria ciliate−1 h−1, with the grazing rates reflecting the temporarily changing ciliate assemblage compositions in the lakes, that is shifts between morphospecies with distinct abilities to ingest bacteria (Fig. 6E–H). In terms of total ciliate bacterivory, the most important ciliate bacterivores were (Fig. 6E–H): (i) Halteria and Pelagohalteria spp., (ii) in some cases Oligotrichia (namely, Rimostrombidium spp.), followed by (iii) the less abundant but highly efficient bacterivores from Peritrichia (genera Vorticella and Epistylis), (iv) the more abundant tiny Scuticociliata (mainly genus Cyclidium), (v) the Prorodontida with negligible bacterial uptakes (only Coleps spp.), and (vi) unidentified ciliates mostly without bacterivorous activity (‘others’ in Fig. 6). However, at the genus level, Halteria/Pelagohalteria spp. were clearly the most important bacterivores in these lakes (Fig. 6E–H), comprising, on average, 56.1% of total ciliate grazing.
Fig. 6.
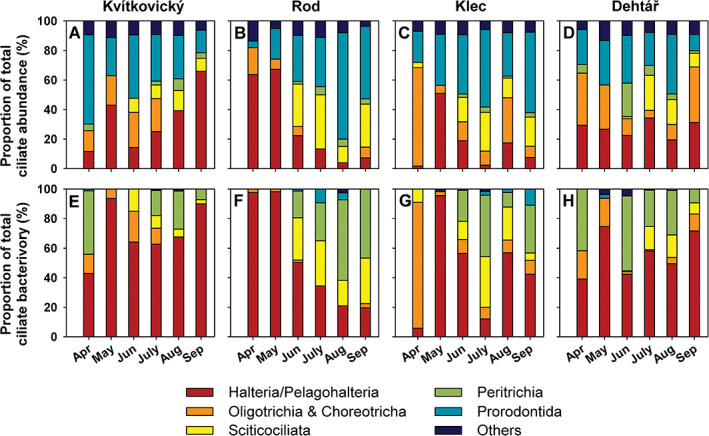
Time‐course changes in assemblage composition and ciliate bacterivory in ponds Kvítkovický (A, E), Rod (B, F), Klec (C, G) and Dehtář (D, H) over the April to September period. Upper panels (A–D) show assemblage composition of six ciliate groups in the ponds (Halteria/Pelagohalteria spp., Oligotrichia and Choreotrichia, Scuticociliata, Peritrichia, Prorodontida and ‘others’), based on protargol and DAPI staining and expressed as relative contributions to total ciliate abundance. Lower panels (E–H) show relative contributions of these six major taxonomic groups to total ciliate bacterivory based on FLB uptake assays.
Discussion
Flagellate groups assumed as major planktonic bacterivores
Our study, based on CARD‐FISH and tracer techniques applied in plankton environments, is the first one to convincingly document that aplastidic cryptophytes are prominent and seasonally ubiquitous HNF bacterivores, controlling a large part of bacterial production in hypertrophic shallow lakes (Figs 2, 3, 4), which are becoming increasingly important waterbody types worldwide. This finding differs from previous studies, based on morphology‐based microscopic approaches, attributing the role of major heterotrophic bacterivorous flagellates to heterokont taxa (mainly chrysomonads and bicosoecids), choanoflagellates, kataphepharids, kinetoplastids and cercozoans (Sherr and Sherr, 1994; Arndt et al., 2000; Boenigk and Arndt, 2000, 2002). From these groups, mainly easily cultivable aplastidic chrysophytes, such as Spumella‐like species or Paraphysomonas spp., have been assumed to be highly abundant and important bacterivorous taxa in the majority of freshwater and marine pelagic environments (Sherr and Sherr, 1994; Arndt et al., 2000; Boenigk and Arndt, 2002). This is also reflected in their frequent use as model flagellated bacterivores (Choi and Peters, 1992; Lim et al., 1999; Grossmann et al., 2016). Moreover, many chloroplast‐bearing taxa among chrysophytes and cryptophytes are also capable of phagotrophy, thus benefiting from a mixotrophic lifestyle (Holen and Boraas, 1995; Jones, 2000). However, mixotrophic nanoflagellates with the detectable FLB uptake were virtually absent in the hypertrophic lakes, compared to high HNF densities, while the prominent role of aplastidic cryptophytes as possible pelagic bacterivores (Fig. 3) has been overlooked until recently (Grujčić et al., 2018; Šimek et al., 2020).
In our study, we used CARD‐FISH probes detecting different taxonomic levels, from the lineage‐specific Cry1‐652 to class‐specific Kin516 (Kinetoplastea). Our approach represented a trade‐off between reachable taxonomic resolution and the highest proportions of major bacterivorous taxa detected with the available probes of different levels of taxonomic resolution. The approach proved to be successful since the aggregated coverage of three major probes, CryptoB, Kat‐1492 and Kin516, was on average (n = 6 samples per lake, Fig. 3N) 68%–87.6% of total HNF, while the parallel application of the FLB assay showed that these probe‐targeted flagellates accounted even for 84.6% to 92.7% of total HNF bacterivory. Thus only between 7.3% and 15.4% of total HNF bacterivory could not be attributed to probe‐defined flagellate groups in our study (Fig. 3N). Among the bacterivorous HNF that were not targeted by the FISH probes, chrysophytes and choanoflagellates likely played an important role (Arndt et al., 2000; Boenigk and Arndt, 2002; Bock et al., 2020). However, among chrysophytes only Dinobryon sp. was morphologically distinguishable bacterivore observed sporadically in samples after ice‐melt in March, while our study was performed during the April–September period. Likewise rather rare in our samples, choanoflagellates were sometimes distinguishable on the basis of a visible collar in some summer samples.
Aplastidic cryptophytes: a changing paradigm of the core planktonic bacterivores
Aplastidic cryptophytes have not been recognized as bacterivores for a long time, as 18S rRNA sequence data do not provide information on trophic interactions and the presence or absence of chloroplasts in cells. Thus, most sequences are attributed to autotrophic cryptophyte groups (e.g. Bjorbækmo et al., 2020), or to their known mixotrophic members described previously (Jones, 2000; Marshall and Laybourn‐Parry, 2002). Moreover, recent comparative analyses (Piwosz et al., 2020) indicate that cryptophytes in general, as well as their aplastidic Cry1 lineage, are underrepresented in amplicon sequencing results and thus metabarcoding data cannot precisely estimate their proportions. From whole group of heterotrophic cryptophytes currently only members of the genus Goniomonas have been isolated (being moderately distant from Cry1 lineage, see a phylogenetic tree in Šimek et al., 2020), with three described species, but only one typical freshwater representative, G. truncata (von der Heyden et al., 2004). Generally, the diversity of aplastidic species within cryptomonads has received little attention and interestingly there seems to be no evidence supporting the presence of a plastid of primary or secondary endosymbiotic ancestry in goniomonads (Cenci et al., 2018).
The Cry1 lineage of cryptophytes was originally discovered in sequence data (Shalchian‐Tabrizi et al., 2008) and tentatively suggested to include bacterivorous representatives (Piwosz et al., 2016). This was later confirmed by inspecting food vacuole contents of flagellate grazers grown in two individual samples from a mesotrophic reservoir used for laboratory experiments, manipulating bacterial prey availability by additions of different bacterial species (Grujčić et al., 2018; Šimek et al., 2020). In the latter studies, the bacterial enrichments induced the most rapid growth responses of small Cry1 cells with doubling times of 10–16 h. It might also indicate an opportunistic lifestyle of these small flagellates in plankton environments, that is the ability to rapidly decimate fast‐growing bacterioplankton taxa associated with particular algal blooms, which form short‐lived abundance peaks (Zeder et al., 2009; Eckert et al., 2011; Salcher et al., 2013; Šimek et al., 2014).
In addition, CARD‐FISH in combination with the FLB tracer techniques have clearly confirmed high rates of bacterivory in aplastidic cryptophyte taxa (Figs 3 and 4). The discovery of their high abundances in situ, their high growth potential and cell‐specific bacterivory rates (Table 3), and preliminary indications of their occurrence in other aquatic ecosystems ranging in trophy and salinity (Piwosz et al., 2016; Shiratori and Ishida, 2016, Piwosz, 2019; Šimek et al., 2020, see also Supplementary Table S3) can considerably broaden the understanding of trophic relationships among prokaryotes and bacterivorous HNF taxa. In contrast, easily distinguishable, chloroplast‐bearing autotrophic cryptophytes (e.g. Cryptomonas, Rhodomonas, Fig. 5) did not ingest FLB and represent a large group of intensively studied bloom‐forming algae (e.g. Sommer et al., 1986, 2012). However, progress in this field is currently severely limited by the lack of studies that combine CARD‐FISH and in situ prey tracer techniques in aquatic ecosystems with a broad range of trophic states.
Considering the large biovolume of bacterial prey ingested by the small Cry1 cells, and assuming the typical HNF gross growth efficiency of 30%–40% (Straile, 1997; Šimek et al., 2018), we estimated their in situ doubling times at ca. 24–32 h. Since their growth rates closely correspond to an approximately daily bacterioplankton doubling in the lakes, these taxa are apparently capable of meeting their entire carbon requirements solely on a bacterial diet, with e.g. doubling times of 10–16 h in bacteria‐enriched treatments (Šimek et al., 2020). Our doubling times presented for Cry1 (Table 3) could underestimate their growth potential on suspended bacteria, as a considerable part of bacterioplankton in the shallow lakes formed small flocks, representing inaccessible prey items to the tiny (2.5–5 μm diameter) Cry1 bacterivores. However, since these small and morphologically uniform HNF lack distinctive morphological features, it is not so surprising that they have so far ‘slipped under the radar’ of microbial ecologists.
All aplastistic cryptophytes targeted by the general CryptoB probe were morphologically more diverse. The probe also targets Cry1, but >50% of the FISH‐positive cells were diverse, relatively large (6–12 μm cell size; Fig. 4A–H) morphotypes of voracious bacterivores. They had significantly higher cell‐specific uptake rates than the Cry1 (Table 3), reaching in some individuals up to 70–80 bacterial cell−1 h−1. Their aggregated bacterivory accounted for approximately 35%–40% of total protist‐induced bacterial mortality, thus confirming the study hypothesis regarding their important trophic role.
Other CARD‐FISH detected protistan groups
Kinetoplastids, in line with our expectations, were more abundant during the summer (up to 38% of total HNF) and contributed significantly more to bacterial mortality rates during this period (Fig. 3), when larger algae or colonial cyanobacteria blooms were observed. Kinetoplastids are associated with detritus particles (Caron et al., 1982; Zubkov and Sleigh, 2000), where they can feed on surface‐associated bacteria (Caron, 1987; Weitere and Arndt, 2003). These flagellates were also reported from deep oxygenated lake waters during periods of high concentrations of settling organic particles (Mukherjee et al., 2015, 2019). These large ‘lake snow’ particles represent a substratum rich in organic matter, on which rapid growth of specific groups of associated bacteria was reported (Grossart et al., 2005), thus considerably enhancing the prey availability for the bacterivores specialized in feeding on surface‐associated bacteria (Caron, 1987; Zubkov and Sleigh, 2000). Since we used suspended FLB as bacterivory tracers, the cell‐specific bacterivory rates of kinetoplastids may be underestimated to a certain extent, because of their decreased efficiency in cropping suspended bacteria. Despite this, our estimates indicate that kinetoplastids comprised on average 13%, but up to 35% of the total HNF bacterivory during summer bloom events (Figs 1 and 3). Assuming that bacteria are the sole food source of kinetoplastids (Arndt et al., 2000; Boenigk and Arndt, 2000), their MCV and cell‐specific bacterivory rates yield doubling time estimates of ~3–4 days (Table 3). These results indicate slower growth compared to the approximately one doubling per day estimated for the small Cry1 cells and their bacterioplankton prey.
The Kat‐1452 probe targeted typical omnivorous katablepharids that ingested both bacteria (Domaizon et al., 2003) and smaller algae (Fig. 4T–W). However, recent experimental results indicated that they also prey on smaller HNF, e.g. on cells of the Cry1 lineage (Šimek et al., 2020). Thus, our current views on the complexity of trophic relationships between small, primarily bacterivorous flagellates and medium‐size omnivorous‐predatory HNF have been considerably revised (Piwosz et al., 2021). While previous studies demonstrated that katablepharids preferentially graze on smaller algae (Clay and Kugrens, 1999; Kwon et al., 2017; Ok et al., 2018), sometimes using a specific collective swarming strategy (Clay and Kugrens, 1999; Okamoto and Inouye, 2005), our analyses of individual bacterial uptakes (Supplementary Fig. 2S[D]) revealed a more diverse feeding strategy including a temporal shift from the dominance of largely algivorous Katablepharidacea (with low uptake of bacteria) in spring to omnivorous phylotypes with high uptake rates of bacteria in summer. Since also bacterial abundance peaked in summer, our results indicate the need for a finer taxonomic resolution of the katablepharids as well as other HNF groups in order to detect the presence of different lineages with specific food preferences. However, taking into account the large MCV of katablepharids in general (149 μm3), the contribution of a solely bacterial diet would be insufficient to support rapid growth (Table 3). This corresponds also to their moderate bulk bacterivory, accounting for 1%–16% of total HNF bacterivory.
Ciliate bacterivory rates
In terms of bulk ciliate bacterivory and cell‐specific grazing rates of particular ciliate species or morpho‐species (Posch et al., 2015), our current study confirms the conclusions of the previous study conducted on hypertrophic lakes, where total ciliates bacterivory rates were similar to those of HNF (Šimek et al., 2019). Interestingly, the major ciliate bacterivores were not specialized bacterivores but omnivorous Halteria/Pelagohalteria (Stichotrichia), feeding on a broader size spectrum of plankton particles (~0.5–6 μm, Jürgens and Šimek, 2000), while the Oligotrichia from the genus Rimostrombidium fed mainly on smaller algae (Müller and Schlegel, 1999; Posch et al., 2015; Šimek et al., 2019). These two groups accounted for, on average, ~2/3 of total ciliate bacterivory, while specialized peritrich and scuticociliate bacterivores (Beaver and Crisman, 1989; Foissner and Berger, 1996) comprised the remaining ~1/3 of the total ciliate bacterivory (Fig. 6E–G). However, even the low abundance of the efficient picoplankton grazers from peritrichous ciliate genera, such as Vorticella and Epistylis (Bickel et al., 2012; Šimek et al., 2019; Weisse et al., 2021) contributed disproportionally more to total bacterial mortality. The markedly increased contributions of ciliate bacterivory to aggregated HNF and ciliate grazing in the summer period (Table 2) was attributable to marked increases in total ciliate numbers in general, paralleled by enhanced proportions of bacterivorous peritrichs and scuticociliates (Fig. 6).
General implications of our findings
The aggregated FISH‐probe hybridization rates were high, sometimes exceeding 90% of total HNF (Fig. 3). This suggests that the flagellate groups such as choanoflagellates and chrysophytes, commonly considered the prominent freshwater bacterivores (Šimek et al., 1997; Boenigk and Arndt, 2002; Jürgens and Matz, 2002) substantially contributing to protistan‐related taxa in sequence‐based studies (Del Campo and Massana, 2011; Bock et al., 2020; Sieber et al., 2020), likely play smaller roles as bacterivores in hypertrophic lakes. Although we did not study these groups specifically with FISH probes (appropriate ones targeting specifically their bacterivorous members are not available, Piwosz et al., 2021), this conclusion is based on our finding that only ca. 7%–15% of total HNF bacterivory can be attributed to different groups than to those targeted by the CARD‐FISH‐probes used in our study (Fig. 3N). Moreover, aplastidic cryptophytes and their Cry1 lineage are also ubiquitous in other freshwater and brackish habitats (Piwosz et al., 2016; Grujčić et al., 2018; Šimek et al., 2020; Šimek and Mukherjee, unpublished data), with sequences and FISH‐positive cells of the Cry1 lineage being detected in aquatic habitats of trophic states from oligo‐ to hypertrophy (Figs 3 and 4; Supplementary Table S3). Our results also confirmed the trend of an increasing role of ciliate bacterivory towards hypertrophic habitats (Beaver and Crisman, 1989; Nakano et al., 1998; Zingel et al., 2007; Šimek et al., 2019; Weisse et al., 2021).
Our study presents the first seasonal field data on the composition of HNF assemblages with taxa‐specific bacterivory rates in hypertrophic shallow lakes; however, we are currently unable to generalize these findings over a broader scale of trophic states. From the general trends of decreasing concentrations of bacteria, phytoplankton, organic particles and limiting nutrients with increasing oligotrophy (Berninger et al., 1991; Gasol and Vaqué, 1993; Arndt et al., 2000), we assume that proportions of specialized bacterivorous kinetoplastids (Caron, 1987; Mukherjee et al., 2015, 2019) and bacterivorous lineages of katablepharids might be lower in more oligotrophic systems. In contrast, proportions of mixotrophic chrysophytes and cryptophytes, profiting from the flexible lifestyle under enhanced water transparency (contrasting to the hypertrophic turbid lakes), might be higher (Holen and Boraas, 1995; Jones, 2000). Notably, small cell size, fast growth and high bacterial ingestion rates of small aplastidic cryptophytes and their Cry1 lineage (Table 3, see also Šimek et al., 2020) could predetermine these groups to be highly competitive bacterivores even in various oligo‐mesotrophic environments with considerably lower bacterial densities.
Conclusions
We have shown that aplastidic cryptophytes and their Cry1 lineage are prominent bacterivores in hypertrophic lakes. Preliminary results on their abundance from other types of fresh and brackish waters (Piwosz et al., 2016, 2021) indicate that these understudied but ecologically prominent HNF taxa can represent core planktonic bacterivores, similarly to the suggested key role of the omnivorous Halteria/Pelagohalteria within ciliate assemblages in systems of higher trophic states (Šimek et al., 2019). Unfortunately, it is impossible to infer a hetero‐ or auto/mixotrophic lifestyle of flagellated protists only from the information carried by 18S rRNA sequences. Moreover, there are so far no isolated strains of aplastidic cryptophytes available, except members of the genus Goniomonas. Thus, before generalizing the hypothesis about the prominent role of aplastidic cryptophytes as freshwater pelagic bacterivores, investigations of a broad spectrum of freshwater bodies of different trophic states, using both CARD‐FISH and sequencing approaches, will be necessary. In addition, a combination of isolation and strain sequencing would considerably refine the existing reference databases and improve the phylogenetic relationships of aplastidic members within cryptophytes. These necessary sequential steps might help detecting the environmental sequences attributable to the ‘cryptic aplastidic’ groups that have so far been considered as autotrophic or mixotrophic lineages. Building on the complementarity of sequencing and FISH approaches, such information might allow designing new probes with high taxonomic resolution that can be combined with a double CARD‐FISH approach (Grujčić et al., 2018) for simultaneous unveiling of phylogenetic identity of both barely distinguishable small flagellates and their preferred prey.
Experimental procedures
Study sites and sampling
We sampled four hypertrophic shallow lakes in South Bohemia (Czech Republic, Supplementary Tables S1 and S2), with area in the range of 0.22–2.28 km2. These hypertrophic lakes were so far studied mainly from the point of view of fish production except for one study dealing with microbial food webs focusing on ciliate bacterivory in 10 different lakes (Šimek et al., 2019). In the current study, integrated water samples (45 L) were collected monthly, from April to September 2018, at seven sampling points along a linear transect of the open water zone from the surface layer (0–1 m) by a van Dorn sampler (Šimek et al., 2019). Two subsamples were filtered through a 200‐μm mesh into sterile glass bottles for microbial activity analyses (~2 L) and into a plastic bottle for chemistry and seston analyses (5 L). Three unfiltered subsamples (50–120 ml) were fixed with Lugol's solution for phytoplankton determination, with Lugol's solution post‐fixed by Bouin's fluid for ciliate analyses, and with 2% formaldehyde for prokaryote and HNF quantification.
Enumeration of microbes
Duplicate formaldehyde‐fixed samples were used for the enumeration of bacteria and heterotrophic protists on 0.2‐μm and 1‐μm pore‐size filters respectively (Šimek et al., 2019). All samples were stained with DAPI (4′,6‐diamidino‐2‐phenylindole) and microbes were counted via epifluorescence microscopy (Olympus BX53; Optical, Japan). Bacterial and flagellate cell dimensions were measured using a semiautomatic image analysis system (NIS‐Elements 5.1, Laboratory Imaging, Prague, Czechia), and biovolumes were computed as detailed elsewhere (Šimek et al., 2013). Large chloroplast‐bearing dinoflagellates (20–25 μm in size) occasionally occurred in the lakes, but they never ingested FLB since they prey upon other algae or protists (Arndt et al., 2000; Piwosz et al., 2021). Therefore they are not included in this study focused on bacterivorous nanoflagellates. Similarly, also other autotrophic flagellated protists with chloroplasts (e.g. Rhodomonas, Cryptomonas), which did not ingest bacteria in the lakes (Fig. 5), were not enumerated in DAPI and FISH preparations in this study focusing on bacterivorous HNF. However, we cannot entirely exclude the presence of mixotrophic flagellates with a fairly low uptake of bacteria, under detection limit of the FLB approach, thus by definition our study dealt with a subset of heterotrophic flagellated bacterivores grazing on heterotrophic bacteria.
Bacterial production
Bacterial production was measured with the thymidine incorporation assay. Triplicate 5‐ml subsamples were incubated for 30 min at in situ temperature with 20 nmol L−1 [methyl‐3H] thymidine (Moravek, Brea, CA, USA), then fixed with neutral buffered formaldehyde (2% final concentration), filtered through polycarbonate membrane filters (Osmonics, Livermore, CA, USA) of 0.2‐μm and 1‐μm porosity and extracted 10 times by 1 ml of ice‐cold 5% TCA. Thymidine incorporation by free pelagic bacteria (the 0.2–1 μm size fraction) was calculated as the difference between the radioactivity retained on 0.2‐μm and 1‐μm filters (Šimek et al., 2019). Cell production rates were calculated using the empirical conversion factor of 2 × 10¹⁸ bacterial cells per mol thymidine (Bell, 1990).
CARD‐FISH analyses of flagellate assemblages
Samples were fixed with a Lugol‐formol‐thiosulphate decolourization technique (Sherr and Sherr, 1994; Jezbera et al., 2005) and filtered within 24 h. Filters were stored at −20°C, until further processing. The probes used were chosen after an extensive survey of natural HNF communities in the studied shallow lakes and of three oligo‐mesotrophic and eutrophic reservoirs (Šimek and Mukherjee, unpublished data) to cover the highest proportions of total HNF with ingested fluorescently labelled or DAPI‐stained bacteria. We used four oligonucleotide probes (FITC‐ and Alexa546‐labelled, Piwosz et al., 2021), targeting the following protistan groups: all cryptophytes (CryptoB; Metfies and Medlin, 2007) and its Cry1 lineage (Cry1‐652; Grujčić et al., 2018), Katablepharidacea (Kat‐1452; Grujčić et al., 2018), Kinetoplastea (Kin516; Bochdansky and Huang, 2010), thus covering the most commonly occurring bacterivorous HNF in the studied shallow lakes. We also applied a FISH‐probe Cerc‐193 targeting the Cercozoan novel Clade 7 (Bass and Cavalier‐Smith, 2004), designed for flagellated Cercozoa in a mesotrophic freshwater reservoir (Šimek et al., 2020), but we did not detect any hybridized cells in the lakes. For detailed analyses of the probe targets see Šimek et al. (2020). Moreover, updated lists of currently available sequences targeted by phylogenetically narrower FISH probes (Cry1‐652 and Kat‐1492), detecting the Cry1 lineage and Katablepharidacea, and their original aquatic habitats were extracted from the NCBI NT database (Altschul et al., 1990); see Supplementary Tables S3 and S4; the hybridization conditions are given in Table 1. Details of the used CARD‐FISH protocol (Piwosz and Pernthaler, 2009), a troubleshooting guide addressing most frequent obstacles, and details on quality ranking and specificity tests for all FISH‐probes used are given in a recent review (Piwosz et al., 2021). Hybridization was conducted at 35°C for 2–3 h for all the probes, except for the Kin516, which required 12 h of hybridization (Mukherjee et al., 2019).
Duplicate CARD‐FISH preparations were analyzed by epifluorescence microscopy at 1000× magnification. Note that only aplastidic protists were considered in this study, while e.g. plastidic cryptophytes with no FLB uptake, easily distinguishable by the presence of chloroplasts in both Alexa546‐ and FITC‐staining (Fig. 5), were not enumerated. Chloroplasts produce bright red autofluorescence in the appropriate Chl‐a excitation filter setting that does not overlap with FITC staining and only slightly overlaps in Alexa546 staining excited at different wavelengths (Piwosz et al., 2021). The flagellate taxa‐specific MCVs were calculated based on the measurements of hybridized cell width and length (Šimek et al., 2020), using an image analysis system (NIS‐Elements 5.1).
Estimates of aggregated flagellate and ciliate grazing rates
Protistan bacterivory rates were estimated using FLB (Sherr et al., 1987) prepared from a mixture of isolated strains representing the core bacterioplankton genera in lakes: Limnohabitans planktonicus (short rods, MCV of 0.135 μm3) and L. parvus (MCV of 0.055 μm3) and one undescribed Polynucleobacter strain (czRimov8‐C6, short curved rods, MCV of 0.054 μm3, Šimek et al., 2019). The cells were mixed at a similar numerical ratio that yielded MCV ± SD of the mixture cells of 0.092 ± 0.021 μm3, which matched well the typical MCV of bacteria in the lakes (0.095 ± 0.027 μm3, median 0.089 μm3). For grazing experiments, 300‐ml samples were dispensed into 1‐L flasks and incubated at in situ temperature. The FLB tracers were added to constitute 8%–16% and 3%–7% of total bacteria for HNF and ciliate uptake estimates respectively, depending upon the season and prevailing protistan bacterivores (Šimek et al., 2019; Šimek and Sirová, 2019). We determined ciliate grazing rates in 5‐ and 10‐min subsamples, and flagellate grazing rates in 30‐min subsamples (yet within a linear increase in FLB uptake per flagellate), with greater FLB amounts added during colder water periods. The samples were fixed using a Lugol‐formol‐thiosulphate decolourization technique (Sherr and Sherr, 1994; Jezbera et al., 2005). Duplicate subsamples of 2–6 ml (flagellates) or 4–30 ml (ciliates) were stained with DAPI, passed through l‐μm black filters, and inspected via epifluorescence microscopy to count both HNF and ciliates as detailed elsewhere (Šimek et al., 2014, 2019). At least 100–200 ciliate and 200 HNF individuals were inspected for FLB ingestion in each sample. To estimate total protistan grazing, we multiplied average bacterial uptake rates of ciliates and HNF by their in situ abundances.
Estimates of taxa‐specific grazing rates
Samples incubated with FLB were fixed, concentrated and stored frozen at −20°C, until further processing with the CARD‐FISH protocol (see above). To examine taxa‐specific uptake rates of the probe‐targeted flagellate groups, their cells (>100 per sample) were inspected for FLB uptake (see Fig. 4) using a combination of optical filter sets for excitation of Alexa546‐stained (orange‐red colour), or FITC‐stained flagellates (green‐yellow), DTAF‐labelled FLB (yellow) and DAPI‐stained nuclei or bacteria (blue). To obtain a proxy of the differences in bacterial uptake rates in different HNF taxa in situ (independent on FLB tracer technique), the CARD‐FISH‐positive cells were localized and an average number of DAPI‐stained bacteria ingested per FISH‐positive flagellate was counted (>50 cells per sample). Then on the same microscopic slide, the average number of DAPI‐stained bacteria was also counted in food vacuoles of all randomly inspected DAPI‐stained HNF (>50 cells per sample).
Ciliate abundance and assemblage composition
Ciliate abundances and a community structure were evaluated by combining epifluorescence microscopy and quantitative protargol staining as described (Foissner and Berger, 1996; Posch et al., 2015). This method combination allowed determining most of the ciliates to the genus or morphotype level and, if possible, to species level, using identification guides (Foissner and Berger, 1996; Foissner et al., 1999). To identify ciliates by fluorescence microscopy, additional criteria such as ciliate cell sizes, the position and size of nuclei, and prey characteristics were used (Foissner and Berger, 1996; Šimek et al., 2019). Between 4% and 13% of the ciliates, however, could not be identified.
Imaging of protistan cells with different prey items ingested
Multicolour z‐stacks of images of protists with ingested bacterial/FLB or algal prey (Figs 4 and 5) were obtained with a motorized fluorescence microscope Nikon Eclipse 90i (Nikon, Tokyo, Japan) equipped with a monochromatic digital camera Andor Clara (Andor Technology, Belfast, UK), controlled by the software NIS‐Elements 5.11 as detailed elsewhere (Šimek et al., 2019).
Environmental parameters and chlorophyll‐a determination
Dissolved organic carbon was determined with the FormacsHT Analyzer (Skalar, Analytical B.V., Netherlands). For details on total and dissolved reactive phosphorus, total nitrogen and chlorophyll‐a analyses see Kopáček and Hejzlar (1993) and Šimek et al. (2014).
Funding Information
The study was largely supported by the Czech Science Foundation (GACR) project no. P504/19‐16554S awarded to DS and P504/19‐23261S awarded to JJ. IM was funded by the Czech Science Foundation (GACR) project no. 20‐12496X.
Author Contributions
K. Šimek conceived and designed the grazing experiments, analyzed ciliate communities and grazing, analyzed a part of FISH samples and wrote the paper with input from all authors. J. Nedoma, J. Jezberová and C. C. P. Paula were involved in the sampling, sample processing and data analyses. J. Nedoma elaborated an approach of image acquisition to document feeding modes of hybridized flagellates. I. Mukherjee processed samples for FISH analyses and with D. Sirová they contributed to data analyses and writing of the paper. J. Vrba coordinated the field sampling program and contributed to writing of the paper.
Supporting information
Appendix S1: Supporting Information.
Acknowledgement
We thank R. Malá and M. Štojdlová for their excellent laboratory assistance, to M. Salcher, K. Piwosz, T. Posch, and R. Ghai for their comments on the earlier versions of the manuscript.
References
- Adl, S.M. , Bass, D. , Lane, C.E. , Lukeš, J. , Schoch, C.L. , Smirnov, A. , et al. (2019) Revisions to the classification, nomenclature, and diversity of eukaryotes. J Eukaryot Microbiol 66: 4–119. [DOI] [PMC free article] [PubMed] [Google Scholar]
- Altschul, S.F. , Gish, W. , Miller, W. , Myers, E.W. , and Lipman, D.J. (1990) Basic local alignment search tool. J Mol Biol 215: 403–410. [DOI] [PubMed] [Google Scholar]
- Arndt, H. , Dietrich, D. , Auer, B. , Cleven, E.‐J. , Gräfenhan, T. , Weitere, M. , and Mylnikov, A.P. (2000) Functional diversity of heterotrophic flagellates in aquatic ecosystems. In The Flagellates, Leadbeater, B.S.C. , and Green, J.C. (eds). London: Taylor and Francis, pp. 240–268. [Google Scholar]
- Arndt, H. , and Mathes, J. (1991) Large heterotrophic flagellates form a significant part of protozooplankton biomass in lakes and rivers. Ophelia 33: 225–234. [Google Scholar]
- Bass, D. , and Cavalier‐Smith, T. (2004) Phylum‐specific environmental DNA analysis reveals remarkably high global biodiversity of Cercozoa (Protozoa). Int J Syst Evol Microbiol 54: 2393–2404. [DOI] [PubMed] [Google Scholar]
- Beaver, J.R. , and Crisman, T.L. (1989) The role of ciliated protozoa in pelagic freshwater ecosystems. Microb Ecol 17: 111–136. [DOI] [PubMed] [Google Scholar]
- Bell, R.T. (1990) An explanation for the variability in the conversion factor deriving bacterial cell production from incorporation of [3H]thymidine. Limnol Oceanogr 35: 910–915. [Google Scholar]
- Berninger, U.G. , Finlay, B.J. , and Kuuppo‐Leinikki, P. (1991) Protozoan control of bacterial abundances in freshwater. Limnol Oceanogr 36: 139–147. [Google Scholar]
- Bickel, S.L. , Tang, K.W. , and Grossart, H.‐P. (2012) Ciliate epibionts associated with crustacean zooplankton in German lakes: distribution, motility, and bacterivory. Front Microb 3: 243. [DOI] [PMC free article] [PubMed] [Google Scholar]
- Bjorbækmo, M.F.M. , Evenstad, A. , Røsæg, L.L. , Krabberød, A.K. , and Logares, R. (2020) The planktonic protist interactome: where do we stand after a century of research? ISME J 14: 544–559. [DOI] [PMC free article] [PubMed] [Google Scholar]
- Bochdansky, A.B. , and Huang, L. (2010) Re‐evaluation of the EUK516 probe for the domain Eukarya results in a suitable probe for the detection of Kinetoplastids, an important group of parasitic and free‐living flagellates. J Eukaryot Microbiol 57: 229–235. [DOI] [PubMed] [Google Scholar]
- Bock, C. , Jensen, M. , Forster, D. , Marks, S. , Nuy, J. , Psenner, R. , et al. (2020) Factors shaping community patterns of protists and bacteria on a European scale. Environ Microbiol 22: 2243–2260. [DOI] [PubMed] [Google Scholar]
- Boenigk, J. , and Arndt, H. (2000) Particle handling during interception feeding by four species of heterotrophic nanoflagellates. J Eukaryot Microbiol 47: 350–358. [DOI] [PubMed] [Google Scholar]
- Boenigk, J. , and Arndt, H. (2002) Bacterivory by heterotrophic flagellates: community structure and feeding strategies. Antonie Van Leeuwenhoek 81: 465–480. [DOI] [PubMed] [Google Scholar]
- Caron, D.A. (1987) Grazing of attached bacteria by heterotrophic microflagellates. Microb Ecol 13: 203–218. [DOI] [PubMed] [Google Scholar]
- Caron, D.A. , Davis, P. , Madin, L.P. , and Sieburth, J.M. (1982) Heterotrophic bacteria and bacterivorous protozoa in oceanic macroaggregates. Science 218: 795–797. [DOI] [PubMed] [Google Scholar]
- Cenci, U. , Sibbald, S.J. , Curtis, B.A. , Kamikawa, R. , Eme, L. , Moog, D. , et al. (2018) Nuclear genome sequence of the plastid‐lacking cryptomonad Goniomonas avonlea provides insights into the evolution of secondary plastids. BMC Biol 16: 137. [DOI] [PMC free article] [PubMed] [Google Scholar]
- Choi, J.W. , and Peters, F. (1992) Effects of temperature on two psychrophilic ecotypes of a heterotrophic nanoflagellate, Paraphysomonas imperforata . Appl Environ Microbiol 58: 593–599. [DOI] [PMC free article] [PubMed] [Google Scholar]
- Clay, B. , and Kugrens, P. (1999) Systematics of the enigmatic kathablepharids, including EM characterization of the type species, Kathablepharis phoenikoston, and new observations on K. remigera comb. nov. Protist 150: 43–59. [DOI] [PubMed] [Google Scholar]
- de Vargas, C. , Audic, S. , Henry, N. , Decelle, J. , Mahé, F. , Logares, R. , et al. (2015) Eukaryotic plankton diversity in the sunlit ocean. Science 348: 1261605. [DOI] [PubMed] [Google Scholar]
- del Campo, J. , and Massana, R. (2011) Emerging diversity within chrysophytes, choanoflagellates and bicosoecids based on molecular surveys. Protist 162: 435–448. [DOI] [PubMed] [Google Scholar]
- Domaizon, I. , Viboud, S. , and Fontvieille, D. (2003) Taxon‐specific and seasonal variations in flagellates grazing on heterotrophic bacteria in the oligotrophic Lake Annecy – importance of mixotrophy. FEMS Microbiol Ecol 46: 317–329. [DOI] [PubMed] [Google Scholar]
- Eckert, E.M. , Salcher, M.M. , Posch, T. , Eugster, B. , and Pernthaler, J. (2011) Rapid successions affect microbial N‐acetyl‐glucosamine uptake patterns during a lacustrine spring phytoplankton bloom. Environ Microbiol 14: 794–806. [DOI] [PubMed] [Google Scholar]
- Foissner, W. , and Berger, H. (1996) A user‐friendly guide to the ciliates (Protozoa, Ciliophora) commonly used by hydrobiologists as bioindicators in rivers, lakes, and waste waters, with notes on their ecology. Freshw Biol 35: 375–482. [Google Scholar]
- Foissner, W. , Berger, H. , and Schaumburg, J. (1999) Identification and ecology of limnetic plankton ciliates. Informationsber Bayer Landesamtes Wasserwirtsch Heft 3/99: 793. [Google Scholar]
- Gasol, J.M. , and Vaqué, D. (1993) Lack of coupling between heterotrophic nanoflagellates and bacteria: a general phenomenon across aquatic systems? Limnol Oceanogr 38: 657–665. [Google Scholar]
- Grossart, H.P. , Levold, F. , Allgaier, M. , Simon, M. , and Brinkhoff, T. (2005) Marine diatom species harbour distinct bacterial communities. Environ Microbiol 7: 860–873. [DOI] [PubMed] [Google Scholar]
- Grossmann, L. , Bock, C. , Schweikert, M. , and Boenigk, J. (2016) Small but manifold – hidden diversity in “Spumella‐like flagellates”. J Eukaryot Microbiol 63: 419–439. [DOI] [PMC free article] [PubMed] [Google Scholar]
- Grujčić, V. , Nuy, J.K. , Salcher, M.M. , Shabarova, T. , Kasalicky, V. , Boenigk, J. , et al. (2018) Cryptophyta as major bacterivores in freshwater summer plankton. ISME J 12: 1668–1681. [DOI] [PMC free article] [PubMed] [Google Scholar]
- Holen, D.A. , and Boraas, M.E. (1995) Mixotrophy in chrysophytes. In Chrysophyte Algae: Ecology, Phylogeny and Development, Sandgren, C.D. , Smol, J.P. , and Kristiansen, J. (eds): New York: Cambridge University Press, pp. 119–141. [Google Scholar]
- Jeppesen, E. , Søndergaard, M. , Jensen, J.P. , Mortensen, E. , Hansen, A.M. , and Jørgensen, T. (1998) Cascading trophic interactions from fish to bacteria and nutrients after reduced sewage loading: an 18‐year study of a shallow hypertrophic lake. Ecosystems 1: 250–267. [Google Scholar]
- Jeuck, A. , and Arndt, H. (2013) A short guide to common heterotrophic flagellates of freshwater habitats based on the morphology of living organisms. Ann Anat 164: 842–860. [DOI] [PubMed] [Google Scholar]
- Jezbera, J. , Horňák, K. , and Šimek, K. (2005) Food selection by bacterivorous protists: insight from the analysis of the food vacuole content by means of fluorescence in situ hybridization. FEMS Microbiol Ecol 52: 351–363. [DOI] [PubMed] [Google Scholar]
- Jones, R.I. (2000) Mixotrophy in planktonic protists: an overview. Freshw Biol 45: 219–226. [Google Scholar]
- Jürgens, K. , and Jeppesen, E. (2000) The impact of metazooplankton on the structure of the microbial food web in a shallow, hypertrophic lake. J Plankton Res 22: 1047–1070. [Google Scholar]
- Jürgens, K. , and Matz, C. (2002) Predation as a shaping force for the phenotypic and genotypic composition of planktonic bacteria. Antonie Van Leeuwenhoek 81: 413–434. [DOI] [PubMed] [Google Scholar]
- Jürgens, K. , and Šimek, K. (2000) Functional response and particle size selection of Halteria cf. grandinella, a common freshwater oligotrichous ciliate. Aquat Microb Ecol 22: 57–68. [Google Scholar]
- Kopáček, J. , and Hejzlar, J. (1993) Semi‐micro determination of total phosphorus in fresh waters with perchloric acid digestion. Int J Environ Anal Chem 53: 173–183. [Google Scholar]
- Kwon, J. , Jeong, H. , Kim, S. , Jang, S. , Lee, K. , and Seong, K. (2017) Newly discovered role of the heterotrophic nanoflagellate Katablepharis japonica, a predator of toxic or harmful dinoflagellates and raphidophytes. Harmful Algae 68: 224–239. [DOI] [PubMed] [Google Scholar]
- Lepère, C. , Masquelier, S. , Mangot, J. , Debroas, D. , and Domaizon, I. (2010) Vertical structure of small eukaryotes in three lakes that differ by their trophic status: a quantitative approach. ISME J 4: 1509–1519. [DOI] [PubMed] [Google Scholar]
- Lim, E.L. , Dennett, M.R. , and Caron, D.A. (1999) The ecology of Paraphysomonas imperforata based on studies employing oligonucleotide probe identification in coastal water samples and enrichment cultures. Limnol Oceanogr 44: 37–51. [Google Scholar]
- Logares, R. , Audic, S. , Santini, S. , Pernice, M.C. , de Vargas, C. , and Massana, R. (2012) Diversity patterns and activity of uncultured marine heterotrophic flagellates unveiled with pyrosequencing. ISME J 6: 1823–1833. [DOI] [PMC free article] [PubMed] [Google Scholar]
- Mangot, J.F. , Domaizon, I. , Taib, N. , Marouni, N. , Duffaud, E. , Bronner, G. , and Debroas, D. (2013) Short‐term dynamics of diversity patterns: evidence of continual reassembly within lacustrine small eukaryotes. Environ Microbiol 15: 1745–1758. [DOI] [PubMed] [Google Scholar]
- Mangot, J.F. , Forn, I. , Obiol, A. , and Massana, R. (2018) Constant abundances of ubiquitous uncultured protists in the open sea assessed by automated microscopy. Environ Microbiol 20: 3876–3889. [DOI] [PubMed] [Google Scholar]
- Mangot, J.F. , Lepère, C. , Bouvier, C. , Debroas, D. , and Domaizon, I. (2009) Community structure and dynamics of small eukaryotes targeted by new oligonucleotide probes: New insight into the lacustrine microbial food web. Appl Environ Microbiol 75: 6373–6381. [DOI] [PMC free article] [PubMed] [Google Scholar]
- Marshall, W. , and Laybourn‐Parry, J. (2002) The balance between photosynthesis and grazing in Antarctic mixotrophic cryptophytes during summer. Freshw Biol 47: 2060–2070. [Google Scholar]
- Massana, R. , Guillou, L. , Terrado, R. , Forn, I. , and Pedrós‐Alió, C. (2006) Growth of uncultured heterotrophic flagellates in unamended seawater incubations. Aquat Microb Ecol 45: 171–180. [Google Scholar]
- Massana, R. , Unrein, F. , Rodríguez‐Martínez, R. , Forn, I. , Lefort, T. , Pinhassi, J. , and Not, F. (2009) Grazing rates and functional diversity of uncultured heterotrophic flagellates. ISME J 3: 588–595. [DOI] [PubMed] [Google Scholar]
- Meerhoff, M. , and Jeppesen, E. (2009) Shallow lakes and ponds. In Encyclopedia of Inland Waters, 2nd ed, Likens, G.E. (ed): Amsterdam, Boston: Elsevier, pp. 645–655. [Google Scholar]
- Metfies, K. , and Medlin, L.K. (2007) Refining cryptophyte identification with DNA‐microarrays. J Plankton Res 29: 1071–1075. [Google Scholar]
- Mukherjee, I. , Hodoki, Y. , and Nakano, S. (2015) Kinetoplastid flagellates overlooked by universal primers dominate in the oxygenated hypolimnion of Lake Biwa, Japan. FEMS Microbiol Ecol 91: 83. [DOI] [PubMed] [Google Scholar]
- Mukherjee, I. , Hodoki, Y. , Okazaki, Y. , Fujinaga, S. , Ohbayashi, K. , and Nakano, S.I. (2019) Widespread dominance of Kinetoplastids and unexpected presence of Diplonemids in deep freshwater lakes. Front Microbiol 10: 2375. [DOI] [PMC free article] [PubMed] [Google Scholar]
- Mukherjee, I. , Salcher, M.M. , Andrei, A.Ş. , Kavagutti, V.S. , Shabarova, T. , Grujčić, V. , et al. (2020) A freshwater radiation of diplonemids. Environ Microbiol 22: 4658–4668. [DOI] [PubMed] [Google Scholar]
- Müller, H. , and Schlegel, A. (1999) Responses of three freshwater planktonic ciliates with different feeding modes to cryptophyte and diatom prey. Aquat Microb Ecol 17: 49–60. [Google Scholar]
- Nakano, S.I. , Ishii, N. , Manage, P.M. , and Kawabata, Z. (1998) Trophic roles of heterotrophic nanoflagellates and ciliates among planktonic organisms in a hypereutrophic pond. Aquat Microb Ecol 16: 153–161. [Google Scholar]
- Not, F. , Latasa, M. , Scharek, R. , Viprey, M. , Karleskind, P. , Balagué, V. , et al. (2008) Protistan assemblages across the Indian Ocean, with a specific emphasis on the picoeukaryotes. Deep Res Part I Oceanogr Res Pap 55: 1456–1473. [Google Scholar]
- Not, F. , Massana, R. , Latasa, M. , Marie, D. , Colson, C. , Eikrem, W. , et al. (2005) Late summer community composition and abundance of photosynthetic picoeukaryotes in Norwegian and Barents Seas. Limnol Oceanogr 50: 1677–1686. [Google Scholar]
- Ok, J.H. , Jeong, H.J. , Lim, A.S. , Lee, S.Y. , and Kim, S.J. (2018) Feeding by the heterotrophic nanoflagellate Katablepharis remigera on algal prey and its nationwide distribution in Korea. Harmful Algae 74: 30–45. [DOI] [PubMed] [Google Scholar]
- Okamoto, N. , and Inouye, I. (2005) The katablepharids are a distant sister group of the cryptophyta: a proposal for Katablepharidophyta divisio nova/Kathablepharida phylum novum based on SSU rDNA and beta‐tubulin phylogeny. Protist 156: 163–179. [DOI] [PubMed] [Google Scholar]
- Pitsch, G. , Bruni, E.P. , Forster, D. , Qu, Z. , Sonntag, B. , Stoeck, T. , and Posch, T. (2019) Seasonality of planktonic freshwater ciliates: are analyses based on V9 regions of the 18S rRNA gene correlated with morphospecies counts? Front Microbiol 10: 248. [DOI] [PMC free article] [PubMed] [Google Scholar]
- Piwosz, K. (2019) Weekly dynamics of abundance and size structure of specific nano‐phytoplankton lineages in coastal waters (Baltic Sea). Limnol Oceanogr 64: 2172–2186. [Google Scholar]
- Piwosz, K. , Kownacka, J. , Ameryk, A. , Zalewski, M. , and Pernthaler, J. (2016) Phenology of cryptomonads and the CRY1 lineage in a coastal brackish lagoon (Vistula Lagoon, Baltic Sea). J Phycol 52: 626–637. [DOI] [PubMed] [Google Scholar]
- Piwosz, K. , Mukherjee, I. , Salcher, M.M. , Grujčić, V. , and Šimek, K. (2021) CARD‐FISH in the sequencing era: opening a new universe of protistan ecology. Front Microbiol 12: 397. [DOI] [PMC free article] [PubMed] [Google Scholar]
- Piwosz, K. , and Pernthaler, J. (2009) Seasonal population dynamics and trophic role of planktonic nanoflagellates in coastal surface waters of the Southern Baltic Sea. Environ Microbiol 12: 364–377. [DOI] [PubMed] [Google Scholar]
- Piwosz, K. , Shabarova, T. , Pernthaler, J. , Posch, T. , Šimek, K. , Porcal, P. , and Salcher, M.M. (2020) Bacterial and eukaryotic small‐subunit amplicon data do not provide a quantitative picture of microbial communities, but they are reliable in the context of ecological interpretations. mSphere 5: e00052‐20. [DOI] [PMC free article] [PubMed] [Google Scholar]
- Posch, T. , Eugster, B. , Pomati, F. , Pernthaler, J. , Pitsch, G. , and Eckert, E.M. (2015) Network of interactions between ciliates and phytoplankton during spring. Front Microbiol 6: 1289. [DOI] [PMC free article] [PubMed] [Google Scholar]
- Salcher, M.M. , Posch, T. , and Pernthaler, J. (2013) In situ substrate preferences of abundant bacterioplankton populations in a prealpine freshwater lake. ISME J 7: 896–907. [DOI] [PMC free article] [PubMed] [Google Scholar]
- Sanders, R. , Caron, D. , and Berninger, U.G. (1992) Relationships between bacteria and heterotrophic nanoplankton in marine and fresh waters: an inter‐ecosystem comparison. Mar Ecol Prog Ser 86: 1–14. [Google Scholar]
- Scheffer, M. (2004) Ecology of shallow lakes. Dordrecht: Kluwer, p. 357. [Google Scholar]
- Shalchian‐Tabrizi, K. , Bråte, J. , Logares, R. , Klaveness, D. , Berney, C. , and Jakobsen, K.S. (2008) Diversification of unicellular eukaryotes: cryptomonad colonizations of marine and fresh waters inferred from revised 18S rRNA phylogeny. Wiley Online Libr 10: 2635–2644. [DOI] [PubMed] [Google Scholar]
- Sherr, B.F. , Sherr, E.B. , and Fallont, R.D. (1987) Use of monodispersed, fluorescently labeled bacteria to estimate in situ protozoan bacterivory. Appl Environ Microbiol 53: 958–965. [DOI] [PMC free article] [PubMed] [Google Scholar]
- Sherr, E.B. , and Sherr, B.F. (1988) Role of microbes in pelagic food webs: a revised concept. Limnol Oceanogr 33: 1225–1227. [Google Scholar]
- Sherr, E.B. , and Sherr, B.F. (1994) Bacterivory and herbivory: key roles of phagotrophic protists in pelagic food webs. Microb Ecol 28: 223–235. [DOI] [PubMed] [Google Scholar]
- Shiratori, T. , and Ishida, K.‐I. (2016) A new heterotrophic cryptomonad: Hemiarma marina n. g., n. sp. J Eukaryot Microbiol 63: 804–812. [DOI] [PubMed] [Google Scholar]
- Sieber, G. , Beisser, D. , Bock, C. , and Boenigk, J. (2020) Protistan and fungal diversity in soils and freshwater lakes are substantially different. Sci Rep 10: 20025. [DOI] [PMC free article] [PubMed] [Google Scholar]
- Šimek, K. , Grujčić, V. , Hahn, M.W. , Horňák, K. , Jezberová, J. , Kasalický, V. , et al. (2018) Bacterial prey food characteristics modulate community growth response of freshwater bacterivorous flagellates. Limnol Oceanogr 63: 484–502. [Google Scholar]
- Šimek, K. , Grujčić, V. , Mukherjee, I. , Kasalický, V. , Nedoma, J. , Posch, T. , et al. (2020) Cascading effects in freshwater microbial food webs by predatory Cercozoa, Katablepharidacea and ciliates feeding on aplastidic bacterivorous cryptophytes. FEMS Microbiol Ecol 96: fiaa121. [DOI] [PMC free article] [PubMed] [Google Scholar]
- Šimek, K. , Grujčić, V. , Nedoma, J. , Jezberová, J. , Šorf, M. , Matoušů, A. , et al. (2019) Microbial food webs in hypertrophic fishponds: omnivorous ciliate taxa are major protistan bacterivores. Limnol Oceanogr 64: 2295–2309. [Google Scholar]
- Šimek, K. , Hartman, P. , Nedoma, J. , Pernthaler, J. , Springmann, D. , Vrba, J. , and Psenner, R. (1997) Community structure, picoplankton grazing and zooplankton control of heterotrophic nanoflagellates in a eutrophic reservoir during the summer phytoplankton maximum. Aquat Microb Ecol 12: 49–63. [Google Scholar]
- Šimek, K. , Kasalický, V. , Jezbera, J. , Horňák, K. , Nedoma, J. , Hahn, M.W. , et al. (2013) Differential freshwater flagellate community response to bacterial food quality with a focus on Limnohabitans bacteria. ISME J 7: 1519–1530. [DOI] [PMC free article] [PubMed] [Google Scholar]
- Šimek, K. , Nedoma, J. , Znachor, P. , Kasalický, V. , Jezbera, J. , Horňák, K. , and Seďa, J. (2014) A finely tuned symphony of factors modulates the microbial food web of a freshwater reservoir in spring. Limnol Oceanogr 59: 1477–1492. [Google Scholar]
- Šimek, K. , and Sirová, D. (2019) Fluorescently labeled bacteria as a tracer to reveal novel pathways of organic carbon flow in aquatic ecosystems. J Vis Exp 2019: e59903. [DOI] [PubMed] [Google Scholar]
- Simon, M. , López‐García, P. , Deschamps, P. , Moreira, D. , Restoux, G. , Bertolino, P. , and Jardillier, L. (2015) Marked seasonality and high spatial variability of protist communities in shallow freshwater systems. ISME J 9: 1941–1953. [DOI] [PMC free article] [PubMed] [Google Scholar]
- Sommaruga, R. (1995) Microbial and classical food webs: a visit to a hypertrophic lake. FEMS Microbiol Ecol 17: 257–270. [Google Scholar]
- Sommer, U. , Adrian, R. , De Senerpont Domis, L. , Elser, J.J. , Gaedke, U. , Ibelings, B. , et al. (2012) Beyond the Plankton Ecology Group (PEG) model: mechanisms driving plankton succession. Annu Rev Ecol Evol Syst 43: 429–477. [Google Scholar]
- Sommer, U. , Gliwicz, M. , Lampert, W. , and Duncan, A. (1986) The PEG‐model of seasonal succession of planktonic events in fresh waters. Arch Hydrobiol 106: 433–471. [Google Scholar]
- Stern, R. , Kraberg, A. , Bresnan, E. , Kooistra, W.H.C.F. , Lovejoy, C. , Montresor, M. , et al. (2018) Molecular analyses of protists in long‐term observation programmes – current status and future perspectives. J Plankton Res 40: 519–536. [Google Scholar]
- Straile, D. (1997) Gross growth efficiencies of protozoan and metazoan zooplankton and their dependence on food concentration, predator‐prey weight ratio, and taxonomic group. Limnol Oceanogr 42: 1375–1385. [Google Scholar]
- Unrein, F. , Gasol, J.M. , Not, F. , Forn, I. , and Massana, R. (2014) Mixotrophic haptophytes are key bacterial grazers in oligotrophic coastal waters. ISME J 8: 164–176. [DOI] [PMC free article] [PubMed] [Google Scholar]
- von der Heyden, S. , Chao, E. , and Cavalier‐Smith, T. (2004) Genetic diversity of goniomonads: an ancient divergence between marine and freshwater species. Eur J Phycol 39: 343–350. [Google Scholar]
- Weisse, T. , Jezberová, J. , and Moser, M. (2021) Picoplankton feeding by the ciliate Vorticella similis in comparison to other peritrichs emphasizes their significance in the water purification process. Ecol Indic 121: 106992. [Google Scholar]
- Weitere, M. , and Arndt, H. (2003) Structure of the heterotrophic flagellate community in the water column of the River Rhine (Germany). J Eur Protistol 39: 287–300. [Google Scholar]
- Zeder, M. , Peter, S. , Shabarova, T. , and Pernthaler, J. (2009) A small population of planktonic Flavobacteria with disproportionally high growth during the spring phytoplankton bloom in a prealpine lake. Environ Microbiol 11: 2676–2686. [DOI] [PubMed] [Google Scholar]
- Zingel, P. , Agasild, H. , Noges, T. , and Kisand, V. (2007) Ciliates are the dominant grazers on pico‐and nanoplankton in a shallow, naturally highly eutrophic lake. Microb Ecol 53: 134–142. [DOI] [PubMed] [Google Scholar]
- Zubkov, M.V. , and Sleigh, M.A. (2000) Comparison of growth efficiencies of protozoa growing on bacteria deposited on surfaces and in suspension. J Eukaryot Microbiol 47: 62–69. [DOI] [PubMed] [Google Scholar]
Associated Data
This section collects any data citations, data availability statements, or supplementary materials included in this article.
Supplementary Materials
Appendix S1: Supporting Information.