

Summary
Specific sleep disorders have been linked to disease progression in different cancers. We hypothesised sleep symptom clusters would differ between cancer types. The aim of this study was to compare sleep symptom clusters in post‐treatment melanoma, breast and endometrial cancer patients. Data were collected from 124 breast cancer patients (1 male, 60 ± 15 years, 28.1 ± 6.6 kg/m2), 82 endometrial cancer patients (64.0 ± 12.5 years, 33.5 ± 10.4 kg/m2) and 112 melanoma patients (59 male, 65.0 ± 18.0 years, 29.1 ± 6.6 kg/m2). All patients completed validated questionnaires to assess sleep symptoms, including the Epworth Sleepiness Scale (ESS), Pittsburgh Sleep Quality Index (PSQI), Insomnia Severity Index (ISI), and Functional Outcomes of Sleep Questionnaire‐10 (FOSQ‐10). Snoring, tiredness, observed apneas, age, BMI, and gender data were also collected. Binary values (PSQI, ISI, FOSQ), or continuous variables for sleepiness (ESS) and perceived sleep quality (PSQI), were created and sleep symptom clusters were identified and compared across cancer cohorts. Four distinct sleep symptom clusters were identified: minimally symptomatic (n = 152, 47.7%); insomnia‐predominant (n = 87, 24.9%); very sleepy with upper airway symptoms (n = 51, 16.3%), and severely symptomatic with severe dysfunction (n = 34, 11.1%). Breast cancer patients were significantly more likely to be in the insomnia predominant or severely symptomatic with severe dysfunction clusters, whereas melanoma patients were more likely to be minimally symptomatic or sleepy with upper airway symptoms (p <0.0001). Endometrial cancer patients were equally distributed across symptom clusters. Sleep symptom clusters vary across cancer patients. A more personalised approach to the management of sleep‐related symptoms in these patients may improve the long term quality of life and survival.
Keywords: breast cancer, endometrial cancer, melanoma, sleep symptom clusters
1. INTRODUCTION
Cancer patients frequently complain of poor sleep across all stages of their cancer journey. Poor sleep is a broad, poorly defined term, reflecting patient perceptions of difficulty falling asleep, insufficient sleep duration, and interrupted and unrefreshing sleep; all accompanied by a range of daytime symptoms, including fatigue, tiredness, daytime sleepiness, low daytime activity, and depressive symptomology (Colagiuri et al., 2011). Indeed, elements of these symptoms are reported by 35–75% of all cancer patients (Palesh et al., 2013).
Assessing the clinical significance of sleep‐related symptoms in cancer cohorts is challenging. While they may arise from the holistic impacts of specific cancer pathologies (e.g., pain), treatment regime side effects, and patient anxiety, there is also the potential that they may reflect a co‐morbid specific sleep disorder (e.g., obstructive sleep apnea, insomnia). The differential diagnosis of sleep‐related symptoms in cancer patients is fundamental to understanding direct and indirect medical consequences that may arise from a specific sleep disorder afflicting a specific cancer patient.
There is now accumulating evidence suggesting that sleep disorders can influence both the risk and outcomes of cancer. For example, obstructive sleep apnea (OSA), has been linked to histologically more aggressive melanoma subtypes (Martinez‐Garcia et al., 2018) and an increase in circulating biomarkers associated with tumour growth (Santamaria‐Martos et al., 2018). Other cancers have also been associated with OSA, including lung cancer (Cabezas et al., 2019), brain tumours (Cho et al., 2020), breast cancer (Chang et al., 2014), colorectal cancer (Lee et al., 2017), and prostate and head and neck cancers (Fang et al., 2015). It is thought that these associations may be a consequence of intermittent hypoxia associated with upper airway obstruction during sleep (Almendros & Gozal, 2018). Insomnia, which is prevalent in breast cancer survivors (Lowery‐Allison et al., 2017), is thought to raise the risk of breast cancer recurrence (Collins et al., 2017). Circadian rhythm disruption (e.g., shift work) increases cancer risk, especially for breast (Szkiela et al., 2020) (Ball et al., 2016) and endometrial cancers (Viswanathan et al., 2007), although a recent meta‐analysis does not support this association (Travis et al., 2016). In addition, poor sleep, of any aetiology, is a predictor of poorer outcomes for cancer patients, with sleep disruption and duration, both short and long, being linked to reduced survival rates for advanced cancer patients (Collins et al., 2017). Given these two‐way interactions, there is an obvious need to define and assess sleep symptoms in cancer patients.
Sleep related symptoms are commonly assessed through a range of validated questionnaires. Typically these questionnaires are designed and validated for their ability to provide a risk assessment for a specific sleep disorder (e.g., OSA‐STOP BANG or insomnia ‐Insomnia Severity Index, ISI), or attempt to quantify the level and nature of sleep disturbance (e.g., Pittsburgh Sleep Quality Index, PISQ), or score severity for specific symptoms (e.g., Epworth Sleepiness Scale), or rate the impact of sleep disturbance on daytime function (e.g., Functional Outcomes of Sleep Questionnaire, FOSQ). Conventionally, an overall risk or impact score is calculated and then compared with a validated threshold score to distinguish from population values. While the score‐based outcomes have been validated for each specific questionnaire (e.g., risk of OSA), the individual question responses themselves provide a more detailed picture of sleep symptom phenotypes.
Sleep‐related symptom cluster analyses have been applied to sleep clinic databases from Iceland (Ye et al., 2014), an international collaboration (Keenan et al., 2018), France (Gagnadoux et al., 2016), Italy (Lacedonia et al., 2016), Greece (Vavougios et al., 2016), and Europe (Saaresranta et al., 2016), and have identified different sleep symptom phenotypes related to specific sleep disorders. Depending on the methodology and cluster variables used, these analyses have identified 3–6 different sleep symptom and comorbidity clusters (Bailly et al., 2016; Gagnadoux et al., 2016; Keenan et al., 2018; Lacedonia et al., 2016; Saaresranta et al., 2016; Ye et al., 2014). These phenotypic classifications have then been used to define sub‐populations within a specific sleep disorder cohort (Bailly et al., 2016; Keenan et al., 2018; Ye et al., 2014), to explore demographic and comorbidity interactions (Anttalainen et al., 2019; Lacedonia et al., 2016; Saaresranta et al., 2016; Vavougios et al., 2016) and to evaluate treatment response variation (Gagnadoux et al., 2016). This approach has not previously been applied to a cancer patient cohort. Although poor sleep is a common complaint across cancer types, it is not known if sleep‐related symptomology differs between or within these specific cancer cohorts. This may occur as a consequence of different interactions between specific cancers and sleep disorders. A recent review has underlined the bi‐directional interconnections between sleep and cancer, focusing on associations between specific sleep disorders (according to the International Classifications of Sleep Disorders 3rd Edition (ICSD‐3 [American Academy of Sleep Medicine, 2014]) and specific tumours (Mogavero et al., 2021). Understanding individual patient symptomology has the potential to inform personalised therapeutic intervention strategies aimed at alleviating symptoms, improving quality of life and helping to contribute to better outcomes.
The aim of the present study was to measure sleep symptom phenotypes in patients with a history of breast, endometrial, and melanoma cancer. These cancer types were selected based on their putative links with sleep disorders (Martinez‐Garcia et al., 2018; Palesh et al., 2013; Viswanathan et al., 2007) and the magnitude of the potential impact. Breast cancer is the leading cause of cancer globally with over 2,000,000 cases annually, endometrial cancer is the most common gynaecological cancer, and melanoma is the deadliest skin cancer, with over 400,000 and 300,000 cases diagnosed per year, respectively (Sung et al., 2021).
2. METHODS
2.1. Patients
The study was approved by the Western Sydney Local Health District ethics committee. Written informed consent was obtained from all patients.
Patients were recruited from either breast, gynaecological, or melanoma outpatient cancer clinics at Westmead Hospital, between 2017 and 2019. Patients were eligible if they were > 18 years of age, had a confirmed diagnosis of breast cancer, endometrial cancer, or melanoma and had completed corresponding treatment (e.g., chemotherapy, radiotherapy, or surgery) either 2 months (endometrial cancer patients), 6 months (melanoma patients), or 12 months (breast cancer patients) prior to study participation. Data from some patients have been reported elsewhere (Madut et al., 2021). The timing of recruitment was chosen to mitigate against the acute impacts of a recent diagnosis or treatment regime on study results. Patients were excluded if they were pregnant or had any serious or active medical or psychiatric comorbidities that would interfere with the subjects' compliance with the protocol or their assessment.
Age, gender, body mass index (BMI), cancer history (obtained through hospital medical records), systolic and diastolic blood pressure, and current medications at baseline were collected for each patient.
2.2. Symptom questionnaires and variable selection
All patients completed standardised, validated questionnaires to assess subjective sleep symptoms (hereafter known as “symptoms”). These included: Pittsburgh Sleep Quality Index (PSQI), Epworth Sleepiness Scale (ESS), Insomnia Severity Index (ISI), Functional Outcomes of Sleep Questionnaire (FOSQ‐10), and STOP BANG (Snoring, Tiredness, Observed apnea, High blood pressure [do you have or are you being treated for high blood pressure?], BMI, age, neck circumference, and gender) questionnaires.
Each of the above questionnaires has an associated and validated scoring system that is used to quantify an overall outcome based on the individual question responses. The overall questionnaire score data for the patients were not included in the current analysis, although results for some have been reported separately (Madut et al., 2021; Trivedi et al., 2021). For the purposes of the present study, demographic data and individual question response data were extracted from each completed questionnaire, in addition to systolic and diastolic blood pressure, with the resulting database serving as the data set for cluster analysis.
To achieve efficient clustering, based on reported symptoms, responses to all individual questions from ISI and FOSQ‐10, questions 5–8 (except 5j) of PSQI (see Appendix S1 for questionnaires), questions 1–3 of STOP‐BANG, and ESS total scores (0–24) were used to create individual “symptom‐variables”; each symptom‐variable representing a specific sleep symptom (i.e. symptoms related to insomnia, sleep‐related functional outcomes, sleep quality, obstructed nocturnal breathing, and daytime sleepiness). Symptom variables were coded into binary values (see Appendix Table 1). STOP‐BANG variables are binary. The ESS total scores and question 6 of PSQI (sleep quality‐very good to very bad), were converted into ordinal variables, by categorising responses into four “bands”; each representing increasing degrees of daytime sleepiness and poorer sleep quality, respectively. This resulted in 31 symptom‐variables being generated, with 31 binary and 2 ordinal variables (ESS total scores and PSQI question 6). Patient characteristics included in the cluster analysis were cancer type, gender, age, BMI, and systolic and diastolic blood pressure.
2.3. Statistical analysis
Statistical analyses were conducted using R (version 4.0.2). Descriptive statistics for participant characteristics and symptoms were generated for each cancer type, and differences between cohorts were assessed using separate ANOVA analyses and chi‐square tests for continuous and categorical variables, respectively.
Clusters were estimated using patients with five or fewer missing responses on the symptom‐variables. Patients were clustered using latent class analysis (LCA), a statistical technique allowing for separation response patterns into mutually exclusive clusters, based on response patterns to questionnaires. Latent class analysis models were fitted using the poLCA package for R (version 1.4.1), using a maximum of 100,000 iterations. Models were fitted with one cluster to six clusters. To find the global maximum likelihood solution, each model was estimated 100 times with random starting parameters, and the model with the greatest likelihood was used. Fit statistics including the sample size adjusted Bayesian information criterion (aBIC), Bayesian information criterion (BIC), and Akaike information criterion (AIC) were compared to identify the best model. Model selection was also informed by the interpretability of each model.
Confidence intervals for estimated response probabilities (conditional probability of reporting a symptom, provided being allocated into a certain cluster), and differences between clusters in those probabilities were generated through non‐parametric bootstrapping. m = 10,000 bootstrapped datasets with the same size as the original data were generated, by sampling patients with replacement from the full dataset. Latent class models were fitted to each bootstrapped sample, using the same randomly generated initial probabilities used for the original dataset to keep the order of clusters consistent.
Relationships between cluster membership and other variables were assessed using chi‐square tests for categorical variables, and ANOVA analyses for continuous variables. Since cluster assignments in latent class analyses are probabilistic, pseudo‐class draws were used in which each patient's cluster allocation was sampled 10,000 times, using their posterior probability of cluster assignment. Analyses were repeated in each sample, and the results were combined using rules for combining statistics in multiple imputation.
Multiple comparisons were controlled for using the Benjamini‐Hochberg method. A significance level of (p <0.05) was used for all analyses, after adjusting for multiple comparisons.
3. RESULTS
3.1. Patient characteristics
There were 318 patients included in the study, comprising 124 breast cancer patients, 82 endometrial cancer patients, and 112 melanoma patients. Patient demographic, anthropometric and blood pressure data, and cancer histopathology are summarised in Table 1. Since two of the cancers included occur predominantly or exclusively in women, all but one of the male patients were in the melanoma group. Melanoma patients were older (p <0.004) with comparatively higher systolic blood pressures (p <0.001). Endometrial cancer patients had a significantly higher BMI (p <0.001) compared with the other cancer patient groups.
TABLE 1.
Patient characteristics
| Cohort | Breast cancer | Endometrial cancer | Melanoma | Total | p |
|---|---|---|---|---|---|
| Total N (%) | 124 | 82 | 112 | 318 | |
| Gender | F 123 (99.2) M 1 (0.8) | F 82 (100.0) M 0 (0.0) | F 53 (47.3) M 59 (52.7) | F 258 (81.1) M 59 (18.6) | <0.001 |
| Age (years) | 60.0 (15.0) | 64.0 (12.5) | 65.0 (18.0) | 63.0 (15.0) | 0.004 |
| Systolic blood pressure (mmHg) | 125.0 (23.0) | 131.0 (16.5) | 135.0 (23.0) | 129.0 (23.5) | <0.001 |
| Diastolic blood pressure (mmHg) | 77.0 (12.5) | 79.0 (12.0) | 80.0 (11.5) | 79.0 (11.8) | 0.099 |
| Body mass index (kg/m2) | 28.1 (6.6) | 33.5 (10.4) | 29.1 (6.6) | 29.7 (7.5) | <0.001 |
3.2. Symptoms within cancer cohorts
Compared with the other cancer patients, breast cancer patients had significantly more symptoms in the ISI and PSQI questionnaires (Table 2). Breast cancer patients also had subjective difficulties with remembering things; however, no other differences in functional questions from the FOSQ‐10 questions were observed between cancer cohorts (Table 2). There were also no differences in the distribution of sleepiness from the ESS between cancer groups, with few patients complaining of this symptom within any cancer cohort; although breast cancer patients did complain more of daytime tiredness in the STOP‐BANG questionnaire (Table 2).
TABLE 2.
Responses to symptom‐variables in breast cancer, endometrial cancer and melanoma patients
| Symptom variable | Level | Breast cancer | Endometrial cancer | Melanoma | *p | |
|---|---|---|---|---|---|---|
| ESS | Total N (%) | 124 (39.0) | 82 (25.8) | 112 (35.2) | ||
| Not sleepy | 69 (55.6) | 49 (59.8) | 54 (48.2) | 0.261 | ||
| Mildly sleepy | 41 (33.1) | 20 (24.4) | 35 (31.2) | |||
| Moderately sleepy | 9 (7.3) | 11 (13.4) | 19 (17.0) | |||
| Severely sleepy | 5 (4.0) | 2 (2.4) | 3 (2.7) | |||
| FOSQ | Difficulty concentrating on things | 11 (8.9) | 7 (8.5) | 5 (4.5) | 0.371 | |
| Difficulty remembering things | 20 (16.1) | 5 (6.1) | 7 (6.2) | 0.016 | ||
| Difficulty operating a motor vehicle for short distances | 3 (2.4) | 2 (2.4) | 0 (0.0) | 0.251 | ||
| Difficulty operating a motor vehicle for long distances | 8 (6.5) | 4 (4.9) | 8 (7.1) | 0.821 | ||
| Difficulty visiting family or friends | 5 (4.0) | 4 (4.9) | 3 (2.7) | 0.716 | ||
| Relationship with family, friends, or colleagues affected | 3 (2.4) | 2 (2.4) | 3 (2.7) | 0.992 | ||
| Difficulty watching a movie | 10 (8.1) | 10 (12.2) | 10 (8.9) | 0.618 | ||
| Difficulty being active in the evening | 18 (14.5) | 12 (14.6) | 8 (7.1) | 0.140 | ||
| Difficulty being active in the morning | 14 (11.3) | 9 (11.0) | 9 (8.0) | 0.669 | ||
| Desire for intimacy or sex affected | 18 (14.5) | 8 (9.8) | 9 (8.0) | 0.219 | ||
| ISI | Difficulty falling asleep | 62 (50.0) | 22 (26.8) | 28 (25.0) | <0.001 | |
| Difficulty staying asleep | 72 (58.1) | 31 (37.8) | 42 (37.5) | 0.002 | ||
| Waking up too early | 59 (47.6) | 28 (34.1) | 39 (34.8) | 0.088 | ||
| Dissatisfied with current sleep pattern | 93 (75.0) | 45 (54.9) | 59 (52.7) | 0.001 | ||
| Sleep problems noticeable to others | 38 (30.6) | 19 (23.2) | 19 (17.0) | 0.048 | ||
| Worried or stressed about sleep problems | 44 (35.5) | 21 (25.6) | 19 (17.0) | 0.005 | ||
| Interferes with daily functioning | 41 (33.1) | 25 (30.5) | 26 (23.2) | 0.234 | ||
| PSQI | Cannot get to sleep | 80 (64.5) | 37 (45.1) | 36 (32.1) | <0.001 | |
| Wake up in the middle of the night | 107 (86.3) | 65 (79.3) | 88 (78.6) | 0.245 | ||
| Get up to use the bathroom | 104 (83.9) | 63 (76.8) | 83 (74.1) | 0.170 | ||
| Cannot breathe comfortably | 18 (14.5) | 16 (19.5) | 7 (6.2) | 0.019 | ||
| Cough or snore loudly | 53 (42.7) | 28 (34.1) | 46 (41.1) | 0.442 | ||
| Feel too cold | 35 (28.2) | 16 (19.5) | 16 (14.3) | 0.030 | ||
| Feel too hot | 83 (66.9) | 41 (50.0) | 37 (33.0) | <0.001 | ||
| Have bad dreams | 25 (20.2) | 18 (22.0) | 17 (15.2) | 0.440 | ||
| Have pain | 52 (41.9) | 25 (30.5) | 24 (21.4) | 0.003 | ||
| Overall sleep quality | Very good | 14 (11.3) | 16 (19.5) | 24 (21.4) | 0.208 | |
| Fairly good | 63 (50.8) | 39 (47.6) | 61 (54.5) | |||
| Fairly bad | 37 (29.8) | 22 (26.8) | 23 (20.5) | |||
| Very bad | 10 (8.1) | 5 (6.1) | 4 (3.6) | |||
| Sleep medication | 17 (13.7) | 6 (7.3) | 13 (11.6) | 0.348 | ||
| Trouble staying awake | 10 (8.1) | 7 (8.5) | 6 (5.4) | 0.626 | ||
| SB | Loud snoring | 39 (31.5) | 30 (36.6) | 41 (36.6) | 0.597 | |
| Feel tired, fatigued, or sleepy during daytime | 78 (62.9) | 55 (67.1) | 55 (49.1) | 0.023 | ||
| Stop breathing during sleep | 14 (11.3) | 8 (9.8) | 10 (8.9) | 0.834 |
Note: N = number of patients (% of the total number of patients within each cancer cohort), with high severity symptoms in each of the cancer cohort. *p‐values not adjusted for multiple comparisons. Bold font indicates statistically significant differences between cohort (p <0.05).
Abbreviations: ESS, Epworth sleepiness scale total scores; FOSQ, functional outcomes of sleep questionnaire; ISI, insomnia severity index; PSQI, Pittsburgh sleep quality index; SB, STOP‐BANG.
3.3. Symptom clusters
A model of four clusters was the optimal model, based on fit statistics and interpretability of the cluster models tested (See Appendix Table 2).
Based on patterns of estimated response probabilities in each symptom‐cluster (Figure 1), cluster 1 (n = 152; cohort proportion = 47.7%), was labelled “minimally symptomatic” as it had the lowest probability of most symptoms (Figure 1) and the highest sleep quality (Figure 2). The majority of patients sorted into this cluster (Figure 3).
FIGURE 1.
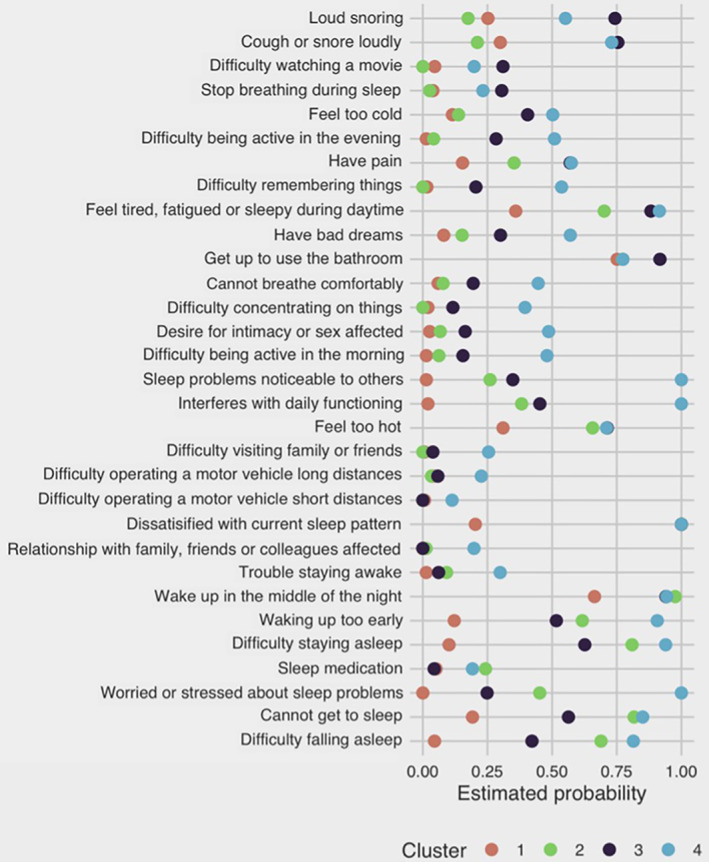
Estimated response probabilities of binary symptom‐variable for each symptom‐cluster (minimally symptomatic, cluster 1 = orange; insomnia predominant, cluster 2 = green; very sleepy with upper airway symptoms cluster 3 = purple; and severely symptomatic with severe dysfunction cluster 4 = blue). Sleep quality and sleepiness are not shown as they were not binary variables
FIGURE 2.
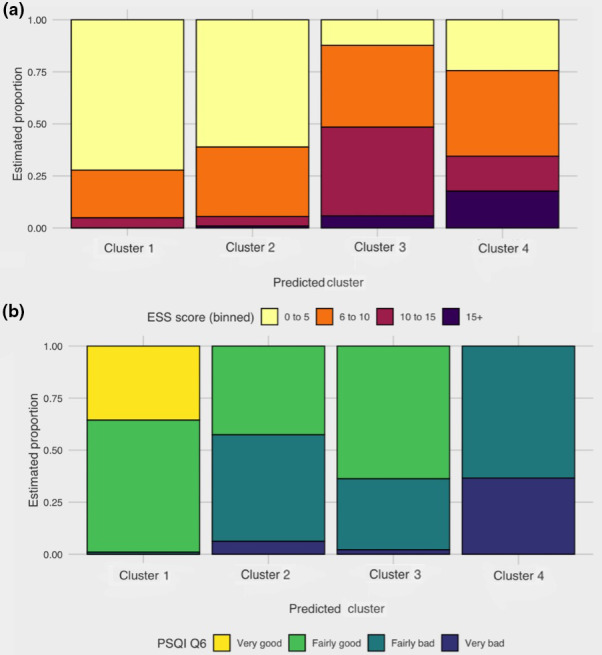
Estimated proportion of patients within each of the four symptom‐clusters (cluster 1, minimally symptomatic; cluster 2, insomnia predominant; cluster 3, very sleepy with upper airway symptoms; and cluster 4, severely symptomatic with dysfunction) having scores within bands for (a) ESS total scores and (b) PSQI question 6. (a) For the following bands shown for ESS total scores: (0–5, “not sleepy” (yellow); 6–10, “mildly sleepy” (orange); 10–15, “moderately sleepy” (maroon); and > 15, “severely sleepy” (purple)). (b) The following bands for question 6 of PSQI are (“very good”, yellow; “fairly good”, light green; “fairly bad”, dark green; and “very bad”, blue. PSQI, Pittsburgh Sleep Quality Index; ESS, Epworth Sleepiness Scale
FIGURE 3.
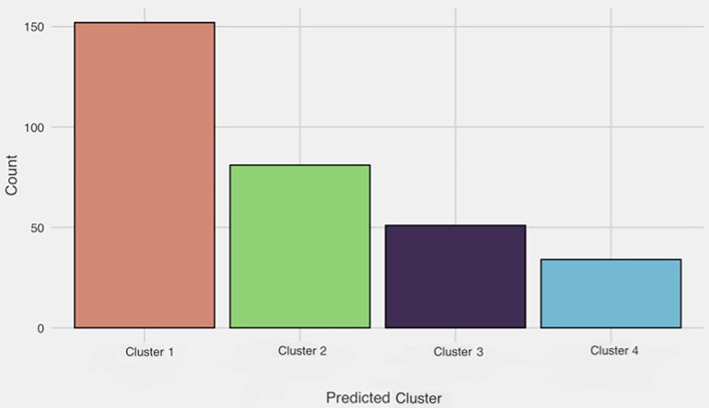
Frequency distribution for number of patients falling into each of the four symptom‐clusters. Cluster 1, minimally symptomatic; cluster 2, insomnia predominant; cluster 3, very sleepy with upper airway symptoms; and cluster 4, severely symptomatic with dysfunction
Cluster 2 (n = 87; cohort proportion = 24.9%) was labelled “insomnia predominant”, as it had a higher probability of all symptoms than Cluster 1 and had more pronounced insomnia symptoms. Cluster 2 also had a higher probability of patients taking sleep medication (Figure 4). Clusters 3 (n = 51; cohort proportion = 16.3%) and 4 (n = 34; cohort proportion = 11.1%) were labelled “very sleepy with upper airway difficulty” and “severely symptomatic with dysfunction” respectively, as both clusters displayed a high probability of most symptoms in comparison with the other clusters. Cluster 3 had a higher probability of most symptoms and relatively more reports of breathing difficulties during sleep, compared with other symptom‐clusters (Figure 4). Cluster 4 had a high symptom burden for most symptom‐variables, with patients reporting more issues with functional outcomes (Figures 1, 4) and “very bad” sleep quality (Figure 2), compared with other symptom‐clusters.
FIGURE 4.
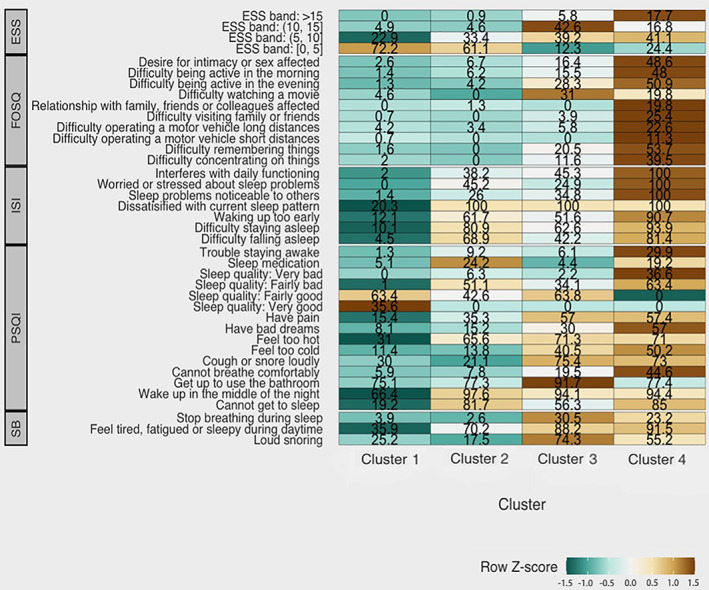
Heatmap profile of symptom burden within the four symptom‐clusters (cluster 1, minimally symptomatic; cluster 2, insomnia predominant; cluster 3, very sleepy with upper airway symptoms; and cluster 4, severely symptomatic with dysfunction), for symptom‐variables derived from ESS, FOSQ, ISI, PSQI, and SB (STOP‐BANG) questions, respectively. Values within each cell represent response probabilities for each cluster, where cell colour represents relatively low (green) and high (brown) degrees of symptom burden. For ESS total scores (0–5, “not sleepy”; 6–10, “mildly sleepy”; 10–15, “moderately sleepy”; and > 15, “severely sleepy.” PSQI, Pittsburgh Sleep Quality Index; ESS, Epworth Sleepiness Scale; ISI, Insomnia Severity Index; FOSQ, Functional Outcomes of Sleep Questionnaire; SB, STOP‐BANG
While all four symptom‐clusters had patients reporting little to no daytime somnolence; Clusters 3 and 4 had a higher proportion of patients with moderate and severe daytime somnolence, respectively (Figure 2).
3.4. Comparing symptom response patterns between clusters
Despite a sizeable difference in estimated response probabilities for many symptom‐variables between the four clusters (Figures 1, 4), there were no significant differences between the response probabilities between the different classes for individual symptoms (all p ≥0.05) (see Appendix Table 3).
3.5. Patient characteristics within symptom clusters
Descriptive statistics of participant characteristics for each estimated symptom‐cluster are shown in Tables 3 and 4.
TABLE 3.
Distribution of patient characteristics within each symptom cluster
| Characteristic | Cluster 1 | Cluster 2 | Cluster 3 | Cluster 4 |
|---|---|---|---|---|
| N (%) | 152 (47.7%) | 81 (24.9%) | 51 (16.3%) | 34 (11.1%) |
| Cancer cohort | ||||
| Breast cancer | 43 (28%) | 43 (53%) | 21 (41%) | 17 (50%) |
| Endometrial cancer | 41 (27%) | 18 (22%) | 13 (25%) | 10 (29%) |
| Melanoma | 68 (45%) | 20 (25%) | 17 (33%) | 7 (21%) |
| Gender | ||||
| Female | 110 (72%) | 74 (92%) | 43 (84%) | 31 (91%) |
| Male | 42 (28%) | 6 (7.5%) | 8 (16%) | 3 (8.8%) |
| Other anthropometric variables | ||||
| Age (years) | 63 (56–71) | 63 (57–69) | 61 (56–67) | 58 (53–66) |
| Systolic blood pressure (mmHg) | 130 (120–143) | 130 (115–139) | 125 (120–138) | 133 (120–138) |
| Diastolic blood pressure (mmHg) | 77 (73–83) | 79 (70–86) | 77 (77–84) | 80 (73–85) |
| BMI (kg/m2) | 30 (26–33) | 30 (26–33) | 32 (28–37) | 30 (24–34) |
Note: Cluster 1, minimally symptomatic; Cluster 2, insomnia predominant; Cluster 3, sleepy with upper airway symptoms; and Cluster 4, severe symptoms with severe dysfunction). N (%) = number of participants (% cohort proportion); median (25%–75%).
TABLE 4.
Comparisons of patient characteristics between clusters in the four cluster LCA model
| Patient characteristic | D | df | p* |
|---|---|---|---|
| Cancer cohort | 9.35 | 2, 3905239.7 | <0.001 |
| Gender | 7.78 | 2, 5747920.6 | <0.0013 |
| Age (years) | 6.33 | 1, 8661680.6 | <0.024 |
| Systolic blood pressure (mmHg) | 0.13 | 1, 24919626.4 | 0.72 |
| Diastolic blood pressure (mmHg) | 0.77 | 1, 18545045 | 0.57 |
| Body mass index | 0.16 | 1, 16713576 | 0.72 |
Note: *p‐values adjusted for multiple comparisons using the Benjamini‐Hochberg procedure for relationship between assigned cluster and patient characteristics. Bold font indicates variables with statistically significant differences between cancer groups.
Abbreviations: D, D statistic from combining test statistics from multiply imputed datasets; df, degrees of freedom obtained from the multiple imputations.
Cancer patients were significantly differently distributed between the four clusters (p = <0.001). Overall, breast cancer patients had more severe symptoms and were more likely to be included in Cluster 2 and 4 (Figure 5a). Melanoma patients tended to fall within clusters with low or moderate symptoms (Figure 5a). More males were present in the low or moderate symptom clusters (p = 0.0013) (Figure 5b), consistent with the higher proportion of melanoma patients in these clusters. Severely symptomatic patients with severe dysfunction were lower in age (p = 0.024), (Figure 5c), compared with other clusters.
FIGURE 5.
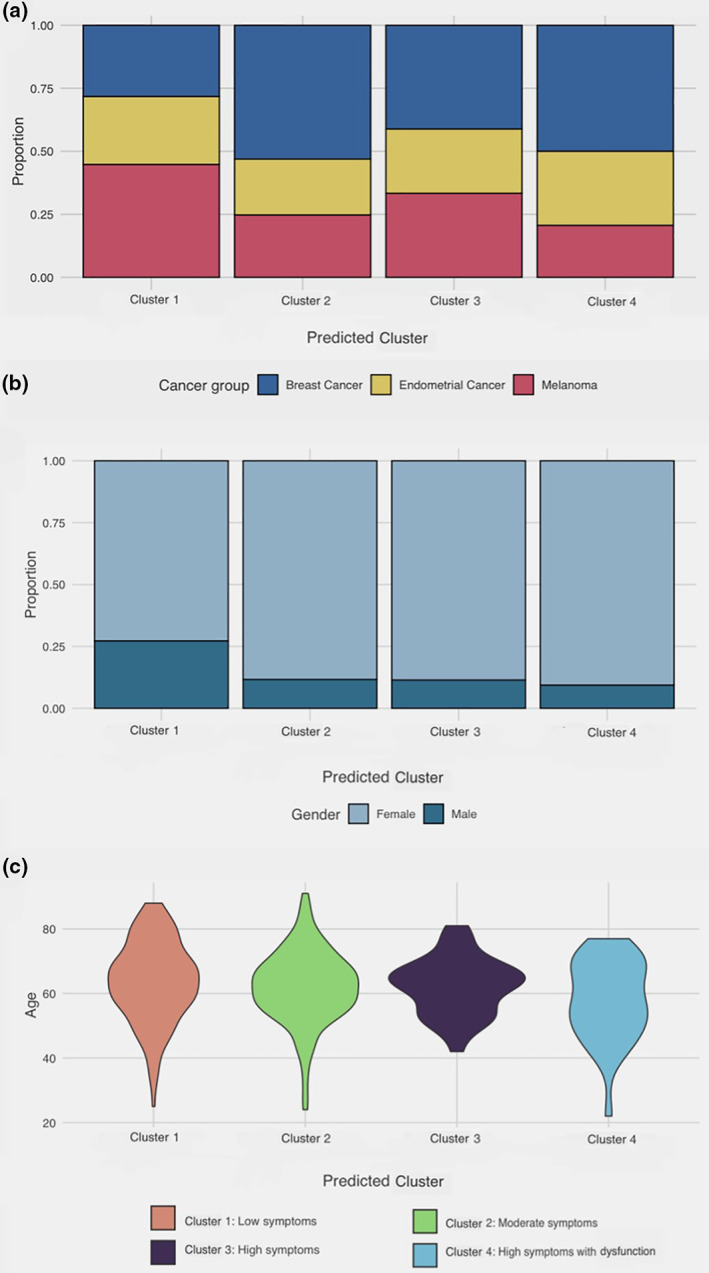
Proportion and distribution of covariates (cancer group, gender, and age) across the four symptom‐clusters (cluster 1, minimally symptomatic; cluster 2, insomnia predominant; cluster 3, very sleepy with upper airway symptoms; and cluster 4, severely symptomatic with dysfunction). (a) Bar graph describing the proportion of patients with a history of breast cancer (blue), endometrial cancer (yellow), and melanoma (red) within each symptom‐cluster. (b) Bar graph describing proportion of female (light blue) and male (dark blue) genders within each symptom‐cluster. (c) Distribution of age (years) within each symptom‐cluster (cluster 1, orange; cluster 2, green; cluster 3, purple; cluster 4, blue. Greater width indicates higher density probability of a particular age
There were no differences in BMI, systolic and diastolic blood pressures between the four symptom‐clusters (Table 4).
4. DISCUSSION
This is the first study to implement clustering analysis to quantify and characterise phenotypes of poor sleep within cancer patients. In this study, four distinct sleep symptom clusters were identified: a minimally symptomatic group, an insomnia predominant group, a very sleepy with upper airway symptoms group and a group who were severely symptomatic with dysfunction. Sleep symptom clusters differed between different cancer subgroups, with breast cancer patients more likely to have a phenotype characterised by insomnia or fatigue, with additional impacts on functional outcomes. Melanoma patients were less likely to have any symptoms at all, or have sleepiness with upper airway symptoms, and patients with endometrial cancer were evenly distributed between the different sleep symptom phenotypes.
Cluster analyses facilitate an understanding in the heterogeneity of clinical presentations of a disease, allowing for its improved recognition and understanding of symptom presentations. Variation in clinical presentations has been studied in sleep clinic patients with a sleep study confirmed OSA (Anttalainen et al., 2019; Bailly et al., 2016; Gagnadoux et al., 2016; Keenan et al., 2018; Lacedonia et al., 2016; Saaresranta et al., 2016; Vavougios et al., 2016; Ye et al., 2014). This includes patients with moderate–severe OSA (AHI ≥15 events/hr) in Iceland (Ye et al., 2014), in an international multicentre consortium (Keenan et al., 2018), and in subjects with at least mild sleep‐apnea (AHI ≥5 events/hr) in another international multicentre consortium (Saaresranta et al., 2016). Cluster analyses of sleep clinic patients, including comorbidities, demographics, OSA severity and symptoms, have also been performed on a database in Greece (Vavougios et al., 2016) and France (Bailly et al., 2016; Gagnadoux et al., 2016). Each of these OSA‐related cluster analyses had produced 3–6 different clusters of sleep symptoms using various combination of questionnaires, demographics, co‐morbidities, and sleep studies. These clusters are disturbed sleep with insomnia symptoms (Keenan et al., 2018; Ye et al., 2014), insomnia phenotype (Saaresranta et al., 2016), minimally symptomatic (Keenan et al., 2018; Ye et al., 2014), non‐sleepy, non‐insomnia phenotype (Saaresranta et al., 2016), and excessive daytime somnolence (Keenan et al., 2018; Saaresranta et al., 2016; Ye et al., 2014). These clusters were expanded to upper airway symptoms with sleepiness (Keenan et al., 2018) and upper airway symptoms dominant (Keenan et al., 2018), and a group with both insomnia and excessive daytime sleepiness (Saaresranta et al., 2016). Other groups have further expanded these clusters using demographic data and comorbidities (Bailly et al., 2016; Vavougios et al., 2016).
We have used validated questionnaires to assess insomnia symptoms, sleep quality (PSQI), sleepiness (ESS), OSA risk (STOP‐BANG), and the short form functional outcomes of sleep (FOSQ‐10), as well as demographics and blood pressure to describe sleep symptom clusters in a cancer cohort. Although these questionnaires are not identical to symptom assessments in other cluster studies, and were performed in a cancer cohort rather than in patients with a diagnosis of OSA, the sleep symptom clusters identified in this study of cancer groups are similar to those identified in OSA symptom cluster studies (Keenan et al., 2018; Saaresranta et al., 2016; Ye et al., 2014).
We have recently demonstrated that the prevalence of moderate–severe OSA in women with breast or endometrial cancer (AHI > 15 events/hr) is more than 57% in both groups (Madut et al., 2021). A high prevalence of at least moderate OSA in two of the included cancer cohorts, as a consequence of shared risk factors in an obese, older population, helps to explain similarities between OSA symptom cluster studies (Keenan et al., 2018; Saaresranta et al., 2016; Ye et al., 2014) and the sleep symptom clusters described in this study, despite the use of different inclusion requirements and methodology.
We also found demographic differences in the clusters, as have others (Bailly et al., 2016; Vavougios et al., 2016). Younger patients were more likely to have severe symptoms with severe dysfunction, and men were more likely to have minimal symptoms. Unlike previous OSA cluster analyses, which are up to 89% male (Bailly et al., 2016; Keenan et al., 2018; Lacedonia et al., 2016; Saaresranta et al., 2016; Vavougios et al., 2016; Ye et al., 2014), our cohort was composed predominantly (81%) of women. However, men were more likely to have minimal symptoms in our study, similar to the previously described non‐insomnia, non‐sleepy cohort (Saaresranta et al., 2016). Previous reports have suggested that younger OSA patients are more likely to report daytime sleepiness (Saaresranta et al., 2016), in contrast to our findings. The majority of participants in the cancer cohort are older, likely explaining the difference in findings. We also found no differences in systolic or diastolic blood pressure, or BMI between sleep symptom clusters, in contrast to others who have demonstrated variations in co‐morbidities across different clinical OSA phenotypes (Saaresranta et al., 2016). Thus, although we have performed a cluster analyses in a very different clinical population (mostly female cancer patients), we demonstrated similar sleep clusters to those described in OSA clinic populations. This is not surprising as we have used sleep symptom questionnaires in a group with a likely high prevalence of OSA (Madut et al., 2021).
Different sleep symptom clusters were present among the cancer cohorts, apart from the endometrial cancer cohort where distribution was equal across the symptom clusters. The reasons for this variation in distribution are not clear, however, interactions between specific sleep disorders and cancer may differ, and these differences may be explained by the presence of sleep disorders other than OSA. Epidemiological studies have linked night shift work, which results in exposure to light at night, and short sleep and sleep disruption as a risk factor for breast cancer and endometrial cancer (Grundy et al., 2013; Kakizaki et al., 2008; Viswanathan et al., 2007). OSA and fluctuations in oxygen related to recurrent upper airway obstruction are associated with an increased risk of cancer mortality and incidence (Marshall et al., 2014; Nieto et al., 2012). Associations between OSA severity and melanoma have been shown in prospective studies (Martinez‐Garcia et al., 2018), however these associations have not been found for breast cancer (Campos‐Rodriguez et al., 2018; Madut et al., 2021) or endometrial cancer (Madut et al., 2021). Short sleep duration and insomnia symptoms reportedly pre‐date the development of breast cancer in women (Phipps et al., 2016). The different distribution of sleep symptom clusters across cancer cohorts may be a consequence of different interactions between sleep disorders and cancer biology.
Previous sleep symptom cluster studies have demonstrated differences in treatment responses between clusters for patients with the same sleep disorder. For example, OSA patients with insomnia symptoms were less likely to be compliant with positive airway pressure treatment (CPAP) in one study (Gagnadoux et al., 2016), but both insomnia and sleepiness symptom clusters, although not minimally symptomatic clusters, were likely to have a symptomatic response to CPAP therapy in another study (Pien et al., 2018). The identification of an insomnia symptom cluster in the present study of cancer patients, which was particularly prevalent in the breast cancer cohort, but also prevalent in the endometrial cohort, highlights the importance of recognising that these women may have OSA as an explanation for insomnia symptoms, and that investigation and treatment may improve these symptoms.
Different sleep symptom clusters may also have implications for cancer outcomes. Insomnia symptoms have been found to be associated with increased cardiovascular mortality in the general population, however, a recent meta‐analysis concluded there was no association between insomnia symptoms and cancer mortality (Ge et al., 2019). Short self‐reported sleep duration, as well as increased snoring after cancer diagnosis, has been shown to be associated with reduced cancer survival in post‐menopausal women (Phipps et al., 2016). Similarly, sleepiness may also be a risk for poor outcomes in cancer, and a sleep duration of more than 9 hours is associated with increased risk of breast cancer mortality (Trudel‐Fitzgerald et al., 2017). Severe OSA had been linked to more aggressive melanomas (Martinez‐Garcia et al., 2018), however, it is unknown whether treatment of OSA will improve the outcome for these melanomas. Identification of different sleep symptom clusters in patients with cancer, and addressing underlying cause of these symptoms, may be important to improving cancer outcomes.
4.1. Limitations
Unlike previous sleep symptom cluster studies, this study was performed in 318, mostly female, patients. Previous cluster studies have used OSA databases of 800–6500 sleep clinic patients (Bailly et al., 2016; Keenan et al., 2018; Saaresranta et al., 2016; Vavougios et al., 2016; Ye et al., 2014), although one study was in 198 subjects only (Lacedonia et al., 2016), and these were predominantly male. We also studied two cancers which are either exclusively female (endometrial cancer), or predominantly female (breast cancer), which may have influenced the outcome, although there were no differences in the number of males and females across the clusters. In addition, patients were studied at different times after their initial treatment, which may also have influenced the distribution within clusters, although this seems unlikely as patients with endometrial cancer, who were studied earlier after diagnosis, were evenly distributed across the symptom clusters, whereas breast cancer patients who were studied later were unevenly distributed. In addition, within each cancer cohort there are variations within each of the cancers in terms of molecular and histopathological subtypes in addition to the cancer stage and grade which may also interact with sleep symptoms, although we do not have sufficient numbers to determine this. Similar to previous studies, this study is cross‐sectional, descriptive, and does not contain longitudinal or outcome data. This study only examined symptoms of sleep disorders, and there is no objective assessment or clinical diagnosis of sleep disorders. We also do not have the prevalence of OSA in these cancer cohorts, although it is likely that many of the subjects have at least moderate OSA based on our previous study (Madut et al., 2021), which includes a subgroup of the current study. In addition, it is possible that some of the symptoms may be due other medical diagnoses associated with cancer, such as anaemia. Despite these limitations, we were able to describe four distinct sleep symptom clusters in cancer patients, a similar outcome to those described in much larger and predominantly male sleep clinic groups.
5. CONCLUSION
In a group of 318 patients with a history of melanoma, breast and endometrial cancer we described four distinct sleep symptom clusters, which were differently distributed between the cancer groups. Identification of each of these sleep symptom clusters allows for a more personalised approach to the management of sleep in these cancer patients, which may then impact the long term quality of life and survival outcomes on an individual patient basis.
AUTHOR CONTRIBUTION
KK, Study design, Data Collection, Data Analysis, manuscript preparation, manuscript review. ASM: Data Collection, Manuscript review, No conflicts to declare. HS: Data Collection, manuscript preparation, manuscript review, no conflicts to declare. MM: Data analysis, manuscript preparation, manuscript review. AB: Study design, manuscript review, EE: Study design, Manuscript review. JH. Study design, Manuscript review GJM: Study design, Manuscript review. TCA. Study design, Data analysis, Manuscript preparation, manuscript review. ADF: Study design, manuscript review.
CONFLICT OF INTEREST STATEMENT
No authors have any conflict of interest to declare.
Supporting information
Appendix S1 Supporting Information.
ACKNOWLEDGMENTS
This research was supported by the Sydney Informatics Hub, a Core Research Facility of the University of Sydney. The authors would like to thank Veronika Fuchsova, Catherine Kennedy, Annie Stenlake, Masrura Kabir, Alissa Phung, Ragini Gengiah, Professor Christine L. Clarke, Associate Professor Nirmala Pathmanathan, Associate Professor James French, Dr Kristina Lindemann, Dr Robyn Sayers, Professor Paul Harnett, and Professor John Wheatley for their assistance with this study. Open access publishing facilitated by The University of Sydney, as part of the Wiley ‐ The University of Sydney agreement via the Council of Australian University Librarians. [Correction added on 26 May 2022, after first online publication: CAUL funding statement has been added.]
Kairaitis, K. , Madut, A. S. , Subramanian, H. , Trivedi, R. , Man, H. , Mather, M. , Brand, A. , Elder, E. , Howle, J. , Mann, G. J. , Amis, T. C. , & De Fazio, A. (2022). Cancer sleep symptom‐related phenotypic clustering differs across three cancer specific patient cohorts. Journal of Sleep Research, 31(5), e13588. 10.1111/jsr.13588
Funding information Cancer Institute of NSW through the Sydney West Translational Cancer Research Centre, Grant/Award Number: 15/TRC/1‐01; Neil and Norma Hill Foundation; ResMed Foundation; Strategic Priorities Areas for Research Collaboration Grant from the University of Sydney
DATA AVAILABILITY STATEMENT
The data in this study will be available in a freely accessible repository on acceptance of the publication.
REFERENCES
- Almendros, I. , & Gozal, D. (2018). Intermittent hypoxia and cancer: Undesirable bed partners? Respiratory Physiology & Neurobiology, 256, 79–86. 10.1016/j.resp.2017.08.008 [DOI] [PubMed] [Google Scholar]
- American Academy of Sleep Medicine . (2014). International classification of sleep disorders (3rd Edition ed.). American Academy of Sleep Medicine. [Google Scholar]
- Anttalainen, U. , Grote, L. , Fietze, I. , Riha, R. L. , Ryan, S. , Staats, R. , … Collaborators, E. S. (2019). Insomnia symptoms combined with nocturnal hypoxia associate with cardiovascular comorbidity in the European sleep apnea cohort (ESADA). Sleep & Breathing, 23(3), 805–814. 10.1007/s11325-018-1757-9 [DOI] [PMC free article] [PubMed] [Google Scholar]
- Bailly, S. , Destors, M. , Grillet, Y. , Richard, P. , Stach, B. , Vivodtzev, I. , … Investigators of the French national Sleep Apnea, r . (2016). Obstructive sleep apnea: A cluster analysis at time of diagnosis. PLoS One, 11(6), e0157318. 10.1371/journal.pone.0157318 [DOI] [PMC free article] [PubMed] [Google Scholar]
- Ball, L. J. , Palesh, O. , & Kriegsfeld, L. J. (2016). The pathophysiologic role of disrupted circadian and neuroendocrine rhythms in breast carcinogenesis. Endocrine Reviews, 37(5), 450–466. 10.1210/er.2015-1133 [DOI] [PMC free article] [PubMed] [Google Scholar]
- Cabezas, E. , Perez‐Warnisher, M. T. , Troncoso, M. F. , Gomez, T. , Melchor, R. , Pinillos, E. J. , … Seijo, L. M. (2019). Sleep disordered breathing is highly prevalent in patients with lung cancer: Results of the sleep apnea in lung cancer study. Respiration, 97(2), 119–124. 10.1159/000492273 [DOI] [PubMed] [Google Scholar]
- Campos‐Rodriguez, F. , Cruz‐Medina, A. , Selma, M. J. , Rodriguez‐de‐la‐Borbolla‐Artacho, M. , Sanchez‐Vega, A. , Ripoll‐Orts, F. , … Martinez‐Garcia, M. A. (2018). Association between sleep‐disordered breathing and breast cancer aggressiveness. PLoS One, 13(11), e0207591. 10.1371/journal.pone.0207591 [DOI] [PMC free article] [PubMed] [Google Scholar]
- Chang, W. P. , Liu, M. E. , Chang, W. C. , Yang, A. C. , Ku, Y. C. , Pai, J. T. , … Tsai, S. J. (2014). Sleep apnea and the subsequent risk of breast cancer in women: A nationwide population‐based cohort study. Sleep Medicine, 15(9), 1016–1020. 10.1016/j.sleep.2014.05.026 [DOI] [PubMed] [Google Scholar]
- Cho, J. H. , Lim, Y. C. , Han, K. D. , Lee, J. Y. , & Choi, J. H. (2020). The incidence of malignant brain tumors is increased in patients with obstructive sleep apnea: A national health insurance survey. PLoS One, 15(11), e0241598. 10.1371/journal.pone.0241598 [DOI] [PMC free article] [PubMed] [Google Scholar]
- Colagiuri, B. , Christensen, S. , Jensen, A. B. , Price, M. A. , Butow, P. N. , & Zachariae, R. (2011). Prevalence and predictors of sleep difficulty in a national cohort of women with primary breast cancer three to four months postsurgery. Journal of Pain and Symptom Management, 42(5), 710–720. 10.1016/j.jpainsymman.2011.02.012 [DOI] [PubMed] [Google Scholar]
- Collins, K. P. , Geller, D. A. , Antoni, M. , Donnell, D. M. , Tsung, A. , Marsh, J. W. , … Steel, J. L. (2017). Sleep duration is associated with survival in advanced cancer patients. Sleep Medicine, 32, 208–212. 10.1016/j.sleep.2016.06.041 [DOI] [PMC free article] [PubMed] [Google Scholar]
- Fang, H. F. , Miao, N. F. , Chen, C. D. , Sithole, T. , & Chung, M. H. (2015). Risk of cancer in patients with insomnia, parasomnia, and obstructive sleep apnea: A Nationwide nested case‐control study. Journal of Cancer, 6(11), 1140–1147. 10.7150/jca.12490 [DOI] [PMC free article] [PubMed] [Google Scholar]
- Gagnadoux, F. , Le Vaillant, M. , Paris, A. , Pigeanne, T. , Leclair‐Visonneau, L. , Bizieux‐Thaminy, A. , … Institut de Recherche en Sante Respiratoire des Pays de la Loire Sleep Cohort, G . (2016). Relationship between OSA clinical phenotypes and CPAP treatment outcomes. Chest, 149(1), 288–290. 10.1016/j.chest.2015.09.032 [DOI] [PubMed] [Google Scholar]
- Ge, L. , Guyatt, G. , Tian, J. , Pan, B. , Chang, Y. , Chen, Y. , … Yang, K. (2019). Insomnia and risk of mortality from all‐cause, cardiovascular disease, and cancer: Systematic review and meta‐analysis of prospective cohort studies. Sleep Medicine Reviews, 48, 101215. 10.1016/j.smrv.2019.101215 [DOI] [PubMed] [Google Scholar]
- Grundy, A. , Richardson, H. , Burstyn, I. , Lohrisch, C. , SenGupta, S. K. , Lai, A. S. , … Aronson, K. J. (2013). Increased risk of breast cancer associated with long‐term shift work in Canada. Occupational and Environmental Medicine, 70(12), 831–838. 10.1136/oemed-2013-101482 [DOI] [PubMed] [Google Scholar]
- Kakizaki, M. , Kuriyama, S. , Sone, T. , Ohmori‐Matsuda, K. , Hozawa, A. , Nakaya, N. , … Tsuji, I. (2008). Sleep duration and the risk of breast cancer: The Ohsaki cohort study. British Journal of Cancer, 99(9), 1502–1505. 10.1038/sj.bjc.6604684 [DOI] [PMC free article] [PubMed] [Google Scholar]
- Keenan, B. T. , Kim, J. , Singh, B. , Bittencourt, L. , Chen, N. H. , Cistulli, P. A. , … Pack, A. I. (2018). Recognizable clinical subtypes of obstructive sleep apnea across international sleep centers: A cluster analysis. Sleep, 41(3), zsx214. 10.1093/sleep/zsx214 [DOI] [PMC free article] [PubMed] [Google Scholar]
- Lacedonia, D. , Carpagnano, G. E. , Sabato, R. , Storto, M. M. , Palmiotti, G. A. , Capozzi, V. , … Gallo, C. (2016). Characterization of obstructive sleep apnea‐hypopnea syndrome (OSA) population by means of cluster analysis. Journal of Sleep Research, 25(6), 724–730. 10.1111/jsr.12429 [DOI] [PubMed] [Google Scholar]
- Lee, S. , Kim, B. G. , Kim, J. W. , Lee, K. L. , Koo, D. L. , Nam, H. , … Koh, S. J. (2017). Obstructive sleep apnea is associated with an increased risk of colorectal neoplasia. Gastrointestinal Endoscopy, 85(3), 568–573 e561. 10.1016/j.gie.2016.07.061 [DOI] [PubMed] [Google Scholar]
- Lowery‐Allison, A. E. , Passik, S. D. , Cribbet, M. R. , Reinsel, R. A. , O'Sullivan, B. , Norton, L. , … Kavey, N. B. (2017). Sleep problems in breast cancer survivors 1‐10years posttreatment. Palliative & Supportive Care, 16(3), 325–334. 10.1017/S1478951517000311 [DOI] [PubMed] [Google Scholar]
- Madut, A. , Fuchsova, V. , Man, H. , Askar, S. , Trivedi, R. , Elder, E. , … Kairaitis, K. (2021). Increased prevalence of obstructive sleep apnea in women diagnosed with endometrial or breast cancer. PLoS One, 16(4), e0249099. 10.1371/journal.pone.0249099 [DOI] [PMC free article] [PubMed] [Google Scholar]
- Marshall, N. S. , Wong, K. K. , Cullen, S. R. , Knuiman, M. W. , & Grunstein, R. R. (2014). Sleep apnea and 20‐year follow‐up for all‐cause mortality, stroke, and cancer incidence and mortality in the Busselton health study cohort. Journal of Clinical Sleep Medicine, 10(4), 355–362. 10.5664/jcsm.3600 [DOI] [PMC free article] [PubMed] [Google Scholar]
- Martinez‐Garcia, M. A. , Campos‐Rodriguez, F. , Nagore, E. , Martorell, A. , Rodriguez‐Peralto, J. L. , Riveiro‐Falkenbach, E. , … Gozal, D. (2018). Sleep‐disordered breathing is independently associated with increased aggressiveness of cutaneous melanoma: A multicenter observational study in 443 patients. Chest, 154(6), 1348–1358. 10.1016/j.chest.2018.07.015 [DOI] [PubMed] [Google Scholar]
- Mogavero, M. P. , DelRosso, L. M. , Fanfulla, F. , Bruni, O. , & Ferri, R. (2021). Sleep disorders and cancer: State of the art and future perspectives. Sleep Medicine Reviews, 56, 101409. 10.1016/j.smrv.2020.101409 [DOI] [PubMed] [Google Scholar]
- Nieto, F. J. , Peppard, P. E. , Young, T. , Finn, L. , Hla, K. M. , & Farre, R. (2012). Sleep‐disordered breathing and cancer mortality: Results from the Wisconsin sleep cohort study. American Journal of Respiratory and Critical Care Medicine, 186(2), 190–194. 10.1164/rccm.201201-0130OC [DOI] [PMC free article] [PubMed] [Google Scholar]
- Palesh, O. , Aldridge‐Gerry, A. , Ulusakarya, A. , Ortiz‐Tudela, E. , Capuron, L. , & Innominato, P. F. (2013). Sleep disruption in breast cancer patients and survivors. Journal of the National Comprehensive Cancer Network, 11(12), 1523–1530. [DOI] [PubMed] [Google Scholar]
- Phipps, A. I. , Bhatti, P. , Neuhouser, M. L. , Chen, C. , Crane, T. E. , Kroenke, C. H. , … Watson, N. F. (2016). Pre‐diagnostic sleep duration and sleep quality in relation to subsequent cancer survival. Journal of Clinical Sleep Medicine, 12(4), 495–503. 10.5664/jcsm.5674 [DOI] [PMC free article] [PubMed] [Google Scholar]
- Pien, G. W. , Ye, L. , Keenan, B. T. , Maislin, G. , Bjornsdottir, E. , Arnardottir, E. S. , … Pack, A. I. (2018). Changing faces of obstructive sleep apnea: Treatment effects by cluster designation in the Icelandic sleep apnea cohort. Sleep, 41(3), zsx201. 10.1093/sleep/zsx201 [DOI] [PMC free article] [PubMed] [Google Scholar]
- Saaresranta, T. , Hedner, J. , Bonsignore, M. R. , Riha, R. L. , McNicholas, W. T. , Penzel, T. , … Group, E. S . (2016). Clinical phenotypes and comorbidity in European sleep apnea patients. PLoS One, 11(10), e0163439. 10.1371/journal.pone.0163439 [DOI] [PMC free article] [PubMed] [Google Scholar]
- Santamaria‐Martos, F. , Benitez, I. , Giron, C. , Barbe, F. , Martinez‐Garcia, M. A. , Hernandez, L. , … Spanish Sleep, N. (2018). Biomarkers of carcinogenesis and tumour growth in patients with cutaneous melanoma and obstructive sleep apnea. European Respiratory Journal, 51(3), 1701885. 10.1183/13993003.01885-2017 [DOI] [PubMed] [Google Scholar]
- Sung, H. , Ferlay, J. , Siegel, R. L. , Laversanne, M. , Soerjomataram, I. , Jemal, A. , & Bray, F. (2021). Global cancer statistics 2020: GLOBOCAN estimates of incidence and mortality worldwide for 36 cancers in 185 countries. CA: a Cancer Journal for Clinicians, 71(3), 209–249. 10.3322/caac.21660 [DOI] [PubMed] [Google Scholar]
- Szkiela, M. , Kusidel, E. , Makowiec‐Dabrowska, T. , & Kaleta, D. (2020). Night shift work‐a risk factor for breast cancer. International Journal of Environmental Research and Public Health, 17(2), 659. 10.3390/ijerph17020659 [DOI] [PMC free article] [PubMed] [Google Scholar]
- Travis, R. C. , Balkwill, A. , Fensom, G. K. , Appleby, P. N. , Reeves, G. K. , Wang, X. S. , … Beral, V. (2016). Night shift work and breast cancer incidence: Three prospective studies and meta‐analysis of published studies. Journal of the National Cancer Institute, 108(12), djw169. 10.1093/jnci/djw169 [DOI] [PMC free article] [PubMed] [Google Scholar]
- Trivedi, R. , Man, H. , Madut, A. , Elder, E. , Dhillon, H. , Brand, A. , & Kairaitis, K. (2021). Irregular sleep/wake patterns are associated with reduced quality of life in post treatment cancer patients: A study across three cancer cohorts. Frontiers in Neuroscience, 16, 700923. 10.3389/fnins.2021.700923. [DOI] [PMC free article] [PubMed] [Google Scholar]
- Trudel‐Fitzgerald, C. , Zhou, E. S. , Poole, E. M. , Zhang, X. , Michels, K. B. , Eliassen, A. H. , … Schernhammer, E. S. (2017). Sleep and survival among women with breast cancer: 30 years of follow‐up within the nurses' health study. British Journal of Cancer, 116(9), 1239–1246. 10.1038/bjc.2017.85 [DOI] [PMC free article] [PubMed] [Google Scholar]
- Vavougios, G. D. , George, D. G. , Pastaka, C. , Zarogiannis, S. G. , & Gourgoulianis, K. I. (2016). Phenotypes of comorbidity in OSAS patients: Combining categorical principal component analysis with cluster analysis. Journal of Sleep Research, 25(1), 31–38. 10.1111/jsr.12344 [DOI] [PubMed] [Google Scholar]
- Viswanathan, A. N. , Hankinson, S. E. , & Schernhammer, E. S. (2007). Night shift work and the risk of endometrial cancer. Cancer Research, 67(21), 10618–10622. 10.1158/0008-5472.CAN-07-2485 [DOI] [PubMed] [Google Scholar]
- Ye, L. , Pien, G. W. , Ratcliffe, S. J. , Bjornsdottir, E. , Arnardottir, E. S. , Pack, A. I. , … Gislason, T. (2014). The different clinical faces of obstructive sleep apnea: A cluster analysis. The European Respiratory Journal, 44(6), 1600–1607. 10.1183/09031936.00032314 [DOI] [PMC free article] [PubMed] [Google Scholar]
Associated Data
This section collects any data citations, data availability statements, or supplementary materials included in this article.
Supplementary Materials
Appendix S1 Supporting Information.
Data Availability Statement
The data in this study will be available in a freely accessible repository on acceptance of the publication.