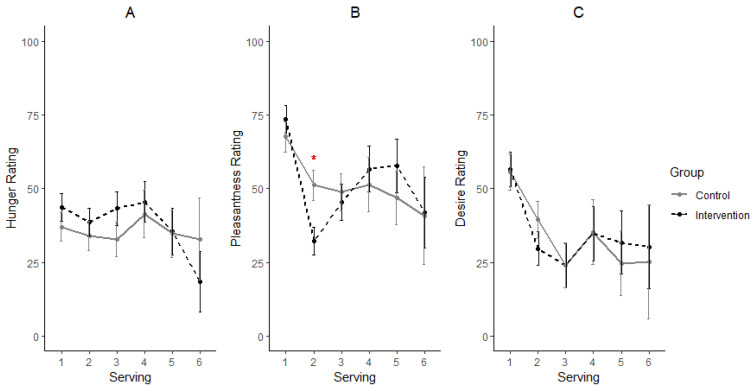
Figure 4.
Participants’ ratings for hunger (A), pleasantness of chocolate (B) and desire for next serving (C) on day 15. Means ± standard error used in the plots represent data from a total of 58, 58, 24, 10, 8 and 3 participants’ ratings at servings 1, 2, 3, 4, 5 and 6, respectively. * Significant differences at a serving (p < 0.05).

