Abstract
Autism Spectrum Disorder (ASD) is a highly heterogeneous set of neurodevelopmental disorders with the global prevalence estimates of 2.20%, according to DSM5 criteria. With the advancements of technology and availability of huge amount of data, assistive tools for diagnosis of ASD are being developed using machine learning techniques. The present study examines the possibility of automating the Autism diagnostic tool using various machine learning techniques on a dataset of 701 samples that contains 10 fields from AQ-10-Adult and 10 from individual characteristics. It takes two scenarios into consideration. First one is ideal case, where there are no missing values in the test cases. In this case Artificial Neural Network (ANN), Support Vector Machine (SVM) and Random Forest (RF) classifiers are trained and tested on the pre-processed dataset. To reduce computational complexity Recursive Feature Elimination (RFE) based feature selection algorithm is applied. To deal with the real-world data, in the second case missing values are introduced in the test dataset for the fields’ ‘age’, ‘gender’, ‘jaundice’, ‘autism’, ‘used_app_before’ and their three combinations. Support Vector Machine, Random Forest, Decision Tree and Logistic Regression based RFE algorithm is introduced to handle this scenario. ANN, SVM and RF classifier based learning models are trained with all the cases. Twelve classification models were generated with RFE, out of which best performing models specific to missing value were evaluated using test cases and suggested for ASD Diagnosis.
Keywords: autism spectrum disorder, machine learning, support vector machine, missing value, ASD diagnosis
Introduction
Autism Spectrum Disorder (ASD) is a type of neurodevelopmental disorder which shows its onset in the early developmental period. Study conducted on a large population of 55,266 children showed 2.20% estimated prevalence of ASD according to DSM5 criteria (Kim et al. 2014). Early diagnosis of ASD is very important as it could help a person with ASD to make key gain in communication abilities in the long run (Fakhoury 2015). The proper training and interaction could help the ASD individual acquiring many core skills required for meaningful social interactions (Russell et al. 2020). There are various methods that have been used to diagnose a case of ASD both clinically or non-clinically. Autism Diagnostic Observation Schedule–revised (ADOS-R) and Autism Diagnostic Interview (ADI) are used as clinical diagnostic method (Lord et al. 2000). For nonclinical diagnosis, self-administered or parent-based tools like Autism Quotient Trait (AQ) and Social Communication Questionnaire (SCQ) are widely used (Auyeung et al. 2008).Technological advancements in the biomedical signal processing have led to the analysis of a number of brain signals of people with autism. Magnetic resonance imaging (MRI) is used to evaluate the change in volumes of autistic brains (Pagnozzi et al. 2018). Functional MRI (fMRI) is used for mapping the brain activity of autistic people (Plitt et al. 2015). Auditory event linked fMRI technique is also used in brain function related research in autism (Gomot et al. 2006). dMRI, fNIRS, rsfMRI and EEG etc are also being used widely in autism diagnosis research (Doi and Shinohara. 2017, Xu et al. 2020). Although a number of studies have highlighted the causative agents vividly, yet diagnosing ASD by assessing behavioral domain is still preferred. These behavioral based diagnostic tools have shown ideal results in various experimental research studies in terms of ASD diagnosis performance measure. However, the handcrafted rules of diagnostic tools need to be interpreted by an expert clinician for the appropriate interpretation of these tools. Another important factor is the time required for mathematical calculation and the process of interpretation. To overcome such limitations, the researchers in this field have started to apply various machine learning techniques on the existing diagnostic tools to automate the diagnostic process with reduced computational complexity, which will eventually cut down in the workload and time required (Radwan et al. 2017). Meanwhile, availability of large scale data has provided enough opportunity to the machine learning researchers to work in this domain. A study on Autism Genetic Resource Exchange (AGRE) dataset was conducted with ADTree, BFTree, Decision Stump, Functional trees, C4.5 algorithm, grafted C4.5 decision tree, Jrip, LADTree, Logistic model trees, Nearest neighbor algorithms, OneR, PART, Random Tree, REPTree, Ridor and Simple Cart classifier to automate the ADOS diagnostic module with reduced itemset. ADTree algorithm outperformed the rest with sensitivity of 99.7% and specificity of 94%, while 8 itemset were identified to be most relevant out of 29 items in module-I of ADOS (Wall et al. 2012a). In a similar experiment 7 features of ADI-R were recognized out of 93 which could correctly diagnose ASD (Wall et al. 2012b). Observation-based classifier (OBC) with 72% featureset reduction of ADOS-G showed accuracy of higher than 97% (Duda et al. 2014). Measure of severity was also another aspect considered in this OBC based research. In a large-scale study to differentiate between ASD and ADHD on the basis of Social Responsiveness Scale (SRS), data collected from Simons Simplex Collection (SSC v15), Boston Autism Consortium and AGRE datasets, 5 features selected from 65 features showed good accuracy. While tree based classifiers underperformed; SVM, LDA, Lasso and Logistic Regression (LR) performed well with 92% item set reduction (Duda et al. 2017). Similar study of ASD diagnosis feature minimization, on 4540 individuals with ADOS tool was performed with ADTree, Functional tree, LibSVM, LR, Naive Bayes, NBTree and Random forest (RF). Approximately 98% accuracy was achieved with reduced set items, where ADOS-2 was minimized to 9 from 28 and ADOS-3 was reduced to 12 from 28 (Kosmicki et al. 2015). Automated diagnosis using traditional questionnaire based methods are investigated vastly in literature. AQ is one of such quick, self-administered and simple ASD screening tool which includes 50 questions to test social skills, nature of attention, level of imagination, communication skill etc. Minimizing the number of questions in screening tools is an important aspect. Discriminant index (DI) based method can trim down the questions to 10 from 50 of this AQ tool (Allison et al. 2012). Identifying the most significant features is a challenging task. Variable Analysis (Va) based technique that works on feature-to-class correlations can select only 8, 8, and 6 features from the AQ-Child, AQ-Adolescent and AQ-Adult datasets respectively (Thabtah 2019). Childhood Autism rating scale (CARS) based assessment using unsupervised learning methods like K-means, FCM, SOM and LVQ displayed accuracies of 93.33%, 96.66%, 100% and 93.33% respectively (Pratap et al. 2014). SVM, RF and Naïve Bayes classifiers showed similar performance when trained with Multilayer Fuzzy Cognitive Maps (MFCM) with ADOS and ADI-R based knowledge (Puerto et al. 2019). Diagnosis of ASD based on the face scanning pattern using machine learning classifier is a potential method. Eye tracking device can collect huge amount of data related to eye movement patterns. This data when trained with SVM classifier demonstrated accuracy of 88.51% in diagnosing ASD of Chinese children (Li et al. 2020) Their study also identified the most discriminative areas of the face where gaze pattern varies mostly and using which differentiation can be made with 79.31% of accuracy between ASD and the typically developed (TD) groups. Learning algorithms when trained with ADI-R, ADOS questionnaires in combination with the video data of the subject; leads to noteworthy enhancement in ASD diagnostic performance (Allison et al. 2012). Speech processing technology can also play a major role in diagnosis of ASD. Abnormal prosody is commonly observed in the voice of ASD child. A study on a group of 81 children was conducted to collect sample with 1,026 times utterance by ASD and 1,965 times utterance by TD of each of the 30 or more words. SVM classifier outperformed speech therapists in detecting ASD children from single word utterances. SVM classification accuracy was 76% while that of 10 speech therapists were 69% (Nakai et al. 2017). Internet of things (IoT) based assistive technology plays a significant role for real time monitoring of sensory inputs in ASD subjects (Christine et al. 2020). Virtual reality technology is also helping children with ASD (Shriram et al. 2019). Personal characteristic data (PCD) like age, sex, handedness, and IQ of Autism Brain Imaging Data Exchange (ABIDE) dataset was used for ASD diagnosis by researchers in recent time (Parikh et al. 2019, Russell et al. 2020). Nine machine learning models which include, k-nearest neighbor, linear and nonlinear SVM, DT, LR, Stacked Sparse Auto-encoder (SSAE)-based neural network, random forest, and majority voting and weighted average ensemble models are used for ASD classification on this PCD features.
The prime focus of this article is to apply machine learning models to the ASD dataset prepared by Fadi Thaptah and investigate the performance of various machine learning models on this dataset (Thabtah 2017). Preprocessing of the dataset is performed to bring all the variables in quantified format. From the pre-processed dataset, 75% of the data are used for training the machine learning models viz. Artificial Neural Network (ANN), Support Vector Machine (SVM) and Random Forest (RF) while the rest 25% is used for testing. Recursive feature elimination (RFE) method is also applied to reduce the computational complexity and enhance efficiency. In the later section, to handle missing fields in the test cases, the article introduces missing value in the test dataset for the fields’ age, gender, jaundice, autism, used_app_before and their three combinations and performance of various models are evaluated on them. Finally appropriate learning models are suggested which could give best results based on the fields missing in the test case.
Materials and methods
Dataset
Present study considers the dataset ‘Autistic Spectrum Disorder Screening Data’ for Adult that contains ‘AQ-10-Adult’ and 10 characteristics of individuals (Thabtah 2019). Table 1 gives an overview of the fields included in the dataset. It includes 20 input fields, one serial number field and one output field. The dataset contains 704 samples out of which three are removed because of the missing values and outliers.
Table 1.
Dataset details.
| Attribute | Data type | Description | |
|---|---|---|---|
| Input features | Age | Number | Age of the participant in years |
| Gender | String | Gender of the participant | |
| Ethnicity | String | List of common ethnicities in text format | |
| Jaundice | Boolean | Whether the case was born with jaundice | |
| Autism | Boolean | Whether any immediate family member has a PDD | |
| Relation | String | Parent, self, caregiver, medical staff, clinician, etc. | |
| country_of_res | String | List of countries in text format | |
| used_app_before | Boolean | Whether the user has used a screening app | |
| Screening Method Type | Integer | The type of screening methods chosen based on age category | |
| A1 to A10 | Binary | Answer to the ten questions of AQ | |
| Result | Integer | Addition of the answer values of question 1–10 | |
| Output variable | Class/ASD | Binary | Case is ASD or not |
| Serial number | Id | integer | Case serial number |
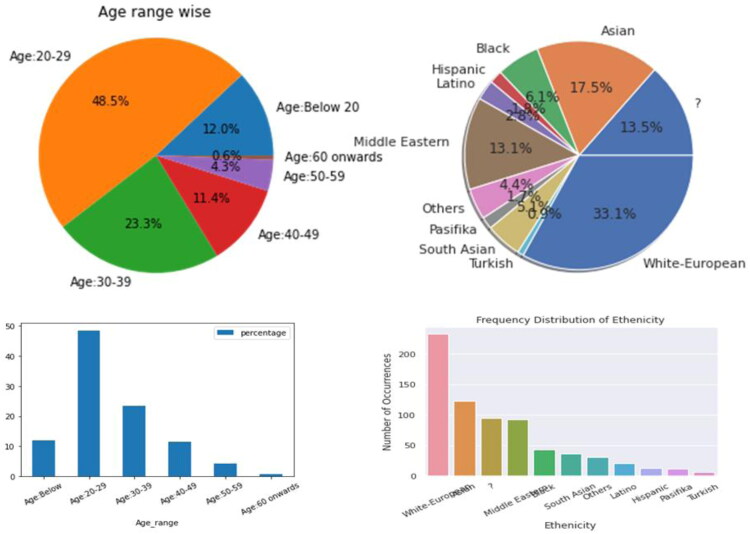
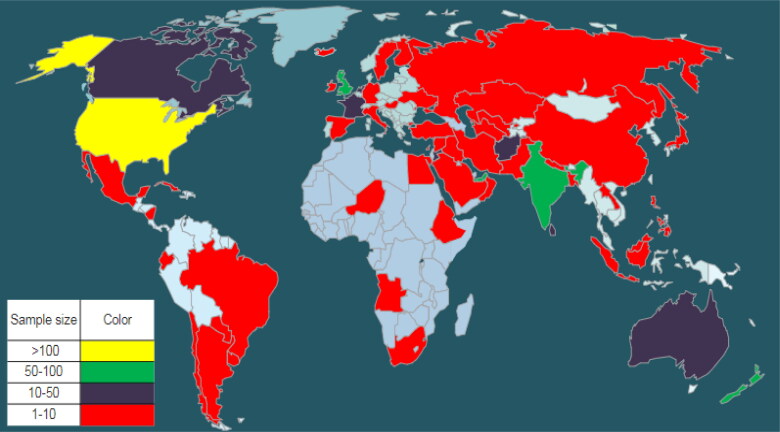
From the rest of 701 samples 512 are negative and 189 are positive cases. A good combination of males (366) and females (335) are considered in the dataset. Out of the 701 samples considered, 91 cases were found with history of autism in the family. Only few of them had experience of using the ASD diagnostic app. The dataset comprised of samples from 67 different countries, however, countries like United States, United Arab Emirates, New Zealand, India, United Kingdom contributed good number of samples (113,82,81,81,77 respectively) while Finland, Lebanon, Aruba, China, Turkey etc. contributed 1 sample each. So, the data distribution country-wise is highly non uniform. Ten different ethnic groups and one ‘other group’ which includes all other ethnicity were considered. Figure1 displays global picture of sample distribution countrywise. Figure 2 gives a diagrammatic representation of frequencies of age and ethnicity of this dataset.
Figure 2.
Dataset description of (a) age, (b) ethnicity.
Figure 1.
Global picture of sample distribution. Created using https://smartdraw.com.
Data pre-processing
The dataset considered in this article contains descriptive information (String, Boolean etc.) which required to be converted to quantified format. Algorithm 1 is designed to convert the dataset into quantified feature vector which is used with machine learning models. The algorithm converts data of categorical fields like ‘ethnicity’, ‘contry_of_res’, ‘relation’ into numerical by applying one-hot encoding method. Boolean values (Yes/No) are converted to binary values (1/0) by mapping in case of variables autism, jaundice, gender, used_app_before and Class/ASD. Feature vector of all the variables is encoded in data frame ‘X’ and class label is encoded as ‘Y’.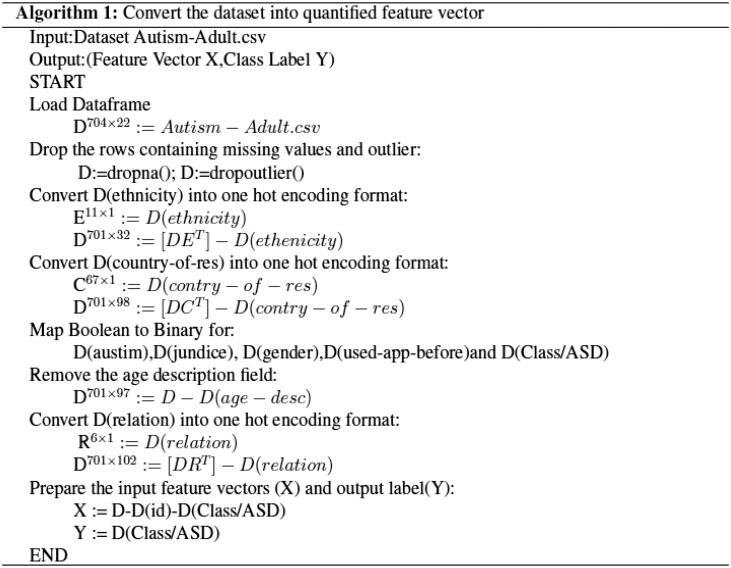
Machine learning models: ANN, SVM and RF
In the current study, Artificial Neural Network (ANN), Support Vector Machine (SVM) and Random Forest (RF) Classifier are used as machine learning models.The ANN model used here is of three hidden layers (Layer1∈ R100, Layer2∈ R50, Layer3∈ R25) . The activation function used in hidden layers is ReLU and the activation function used in output layer is sigmoid. ANN Model is compiled with loss function 'binary_crossentropy', Adam optimizers and Early Stopping strategy is used with 1000 epochs. SVM which is a binary linear classifier is also used for this experiment with support vector classifier kernel ‘linear’.
Feature selection method: recursive feature elimination (RFE)
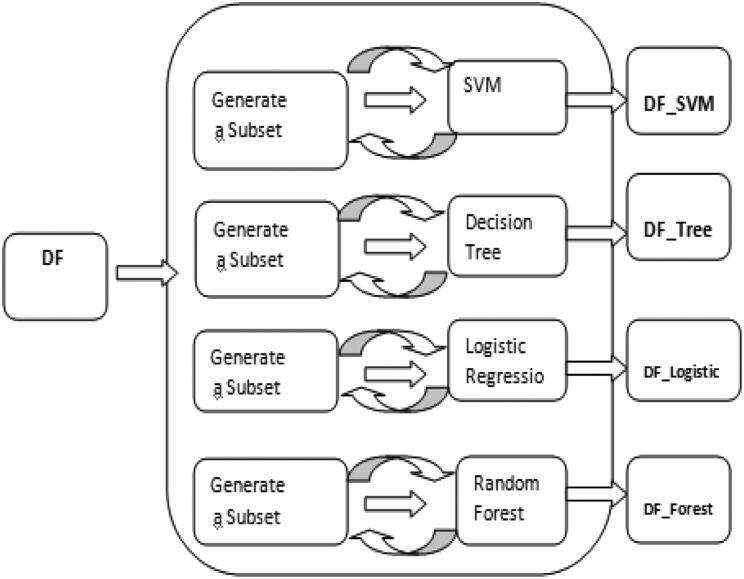
The Recursive Feature Elimination (RFE) algorithm has intrinsic function to evaluate the significance of a variable in classifying the data frame. However, the RFE algorithm based selection of variables depends upon the classification model involved (Kuhn and Johnson 2019).This greedy algorithm tries to find out the optimal variable subset by repeatedly selecting the best variables. This RFE algorithm is used in combination with machine learning models on which importance of predictors are evaluated. The study considers SVM, LR, Decision tree (DT) and RF as classification model to be used for running RFE algorithm. Feature set will be ranked by this RFE algorithm. Figure 3 shows the RFE framework for generating four sets of significant features by four different combinations (SVM + RFE, LR + RFE, DT + RFE and RF + RFE). Candidates of all these four sets are different (SVM + RFE, LR + RFE, DT + RFE and RF + RFE) as RFE is a model dependent algorithm. These four sets of features generated can be evaluated by various machine learning models. ANN, SVM and RF are used as learning models to evaluate performance of reduced feature sets for this experiment.
Figure 3.
RFE framework.
Evaluation metrics
Once the training of the classifier with training dataset is over, test data are provided to it to assess the classification performance. For ASD diagnosis the positive samples are those which have the value of ‘1’ corresponding to the field ‘Class/ASD’ and negative samples are those with the value of ‘0’ corresponding to the same. This article considers accuracy as the performance measure that represents correctly classified percentage of samples.
Where, TP = true positive, TN = true negative, FP = false positive, FN = false negative.
Methodology
Automating ASD diagnosis
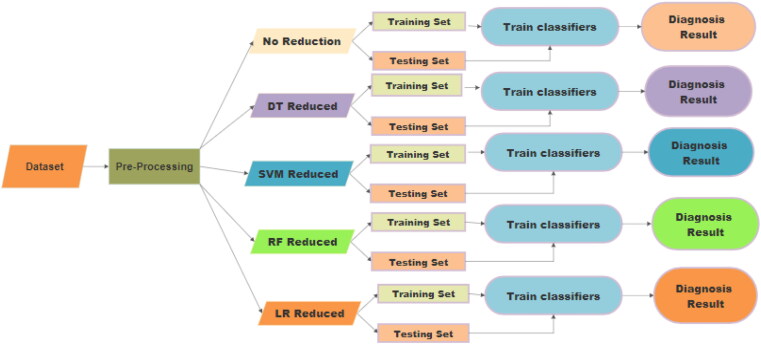
In this study, dataset ‘Autistic Spectrum Disorder Screening Data for Adult’ that contains ‘AQ-10-Adult and 10 characteristics of individuals’ is considered and the experiment is carried out to automate the ASD diagnostic tool based on this dataset. Preprocessing of the dataset is performed by Algorithm1 that converts the dataset into a data frame with all the variables in quantified format. Figure 4 shows the work flow diagram of the proposed ASD Diagnosis model. Five different types of data will be generated from the pre-processed data. First category is with no feature reduction. In the second category, Decision tree based RFE algorithm is used to generate dataset with reduced feature set. Similarly, SVM based, RF and LR based RFE algorithm is applied to generate other three minimized datasets. For all these five categories of dataset, 75% of the data are used for training the machine learning models while the rest 25% is used for testing.
Figure 4.
Work flow diagram of ASD Diagnosis model.
Handling test data with missing values
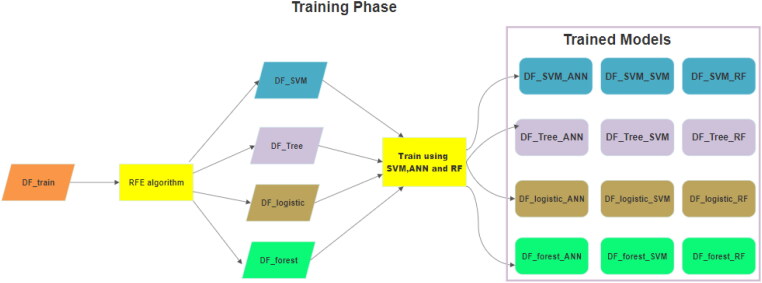
Real world data contain a lot of missing values, which may impact the performance of the diagnostic tool drastically. The dataset contains 20 fields out of which 10 are questions which are needed to be answered and 10 are personal characteristics. Questionnaire values (A1–A10) are in total decides the score of the tool, which is stored in the result field, so ‘result’ field is not possible to consider in missing values. Fields like ‘country’ and ‘ethnicity’ are ignored as the data distribution is very unequal in these fields. Hence, our assumption is that they are only included to increase the variation in the dataset. So, this study considers ‘age’, ‘jaundice’, ‘autism’, ‘gender’ and ‘used_app_before’ as the fields which may be missing from the data. Conventional way of dealing with missing values (mean, median etc) would not be of very helpful as most of the data are Boolean. To deal with this situation the article proposes four models of feature selection (RFE with SVM, LR, DT and RF respectively). For all these models’ different features are of importance. Classification models are trained with the reduced feature sets. Hence, four different training sets (DF_Tree, DT_SVM,DF_logistic and DF_Forest) are used for training the classifiers (SVM,ANN and RF) which produces twelve learning models. After the models are trained, based on the missing field the appropriate class of models may be selected for diagnosing a new test case. As the selected model is trained on reduced feature that does not contain the missing field, it should produce better classification performance. Figure 5 shows a diagrammatic representation of training phase of the proposed method. Here, DF_SVM_ANN, DF_SVM_SVM and DF_SVM_RF are three learning models trained with reduced feature set DF_SVM. Similarly, DF_Tree_ANN, DF_Tree_SVM and DF_Tree_RF are three learning models trained with reduced feature set DF_Tree. In the similar manner trained models like DF_logistic_ANN, DF_logistic_SVM and DF_logistic_RF are generated using DF_logistic data. Finally learning models DF_forest_ANN, DF_forest_SVM and DF_forest_RF are generated using DF_forest data.
Figure 5.
Training phase of the Proposed Model.
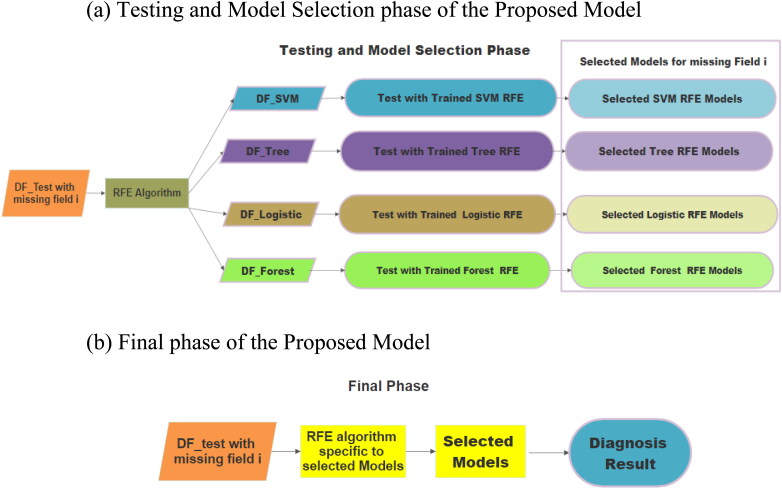
Once the training is over, we are left with 12 different trained model spaces with three different classifier bases, which can work with 4 different categories of data. So, the next task is to test these models and to pull out the best models which can perform the classification with good accuracy. Figure 6(a) shows the testing and selection of learning models which can outperform the rest. To carry out this step, test datasets are prepared by removing various fields from the main dataset. For a test data with missing field ‘i’, four categories of test data are generated using four variation of RFE algorithm. All these four categories are tested with their corresponding SVM, ANN and RF based trained models and accuracies are observed. Worst performing learning models to be discarded and best performing models should have to be retained. This process is carried out for all test data containing various missing fields. Once the best model for a particular missing field is found, RFE specific to the best performing model will be applied to all the future test cases and the test case will be handled with these trained models as shown in Figure 6(b).
Figure 6.
(a) Testing and model selection phase of the proposed model. (b) Final phase of the proposed model.
Results and discussion
Performance of machine learning models on the original dataset
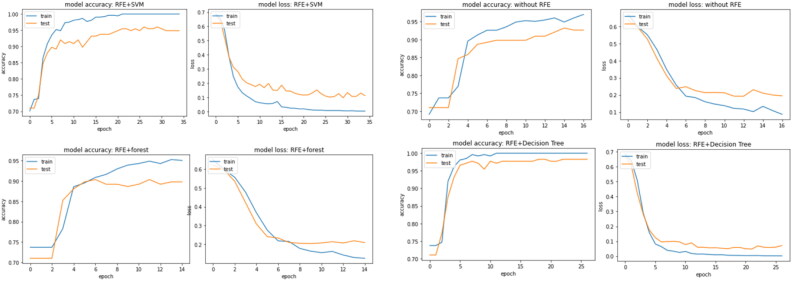
The dataset considered in this study recorded 20 features for diagnosing ASD in individuals, which results into 100 dimensional feature vectors when quantified using Algorithm 1. RFE algorithm is used in combination with SVM, LR, DT and RF to explore the possibility of further reducing the data frame and to figure out if any fields from the dataset can be removed. Table 2 shows the results of classification applied on the data without reduction and after reduction using RFE algorithm. Figure 7 shows how ANN accuracy enhances with each epoch. The results show that the RFE based reduced feature set improves the classification accuracy in most of the cases. However, there is a decrease in classification accuracy is observed in two cases, first in feature set generated DT based RFE in case of RF classifier and secondly in RF based RFE in case of ANN classifier. Henceforth, these two models may be dropped and rest may be considered for diagnosing ASD.
Table 2.
Comparison of accuracy rate of various classification models with and without RFE in case 1.
| Without feature selection | RFE based feature selection using |
||||
|---|---|---|---|---|---|
| DT | SVM | RF | LR | ||
| ANN | 0.9034 | 0.9886 | 0.9489 | 0.8977 | 0.9318 |
| RF | 0.9572 | 0.8859 | 0.9772 | 0.9743 | 0.9829 |
| SVM | 1 | 1 | 1 | 1 | 1 |
Abbreviations: DT, decision tree; SVM, support vector machine; RF, random forest; LR, logistic regression; ANN, artificial neural network; RFE, recursive feature elimination.
Figure 7.
ANN accuracy with epoch.
Performance of machine learning models on missing value induced test data
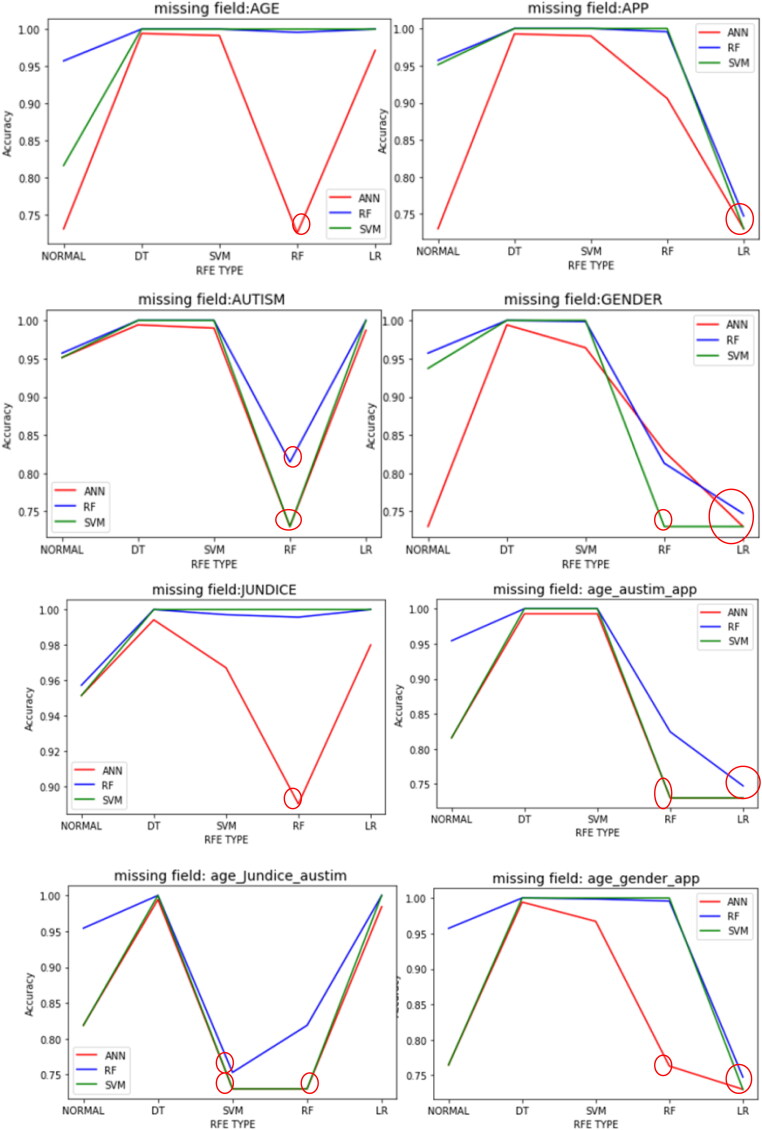
The given dataset contains 701 samples with 100 input variables. To evaluate the impact of missing values on performance of RFE based models, missing value in the test dataset for the fields’ ‘age’, ‘gender’, ‘jaundice’, ‘autism’, ‘used_app_before’ and their three combinations are introduced. In each set of newly generated data, results are evaluated in five different scenarios viz. no feature reduction, DT based RFE, SVM based RFE, RF based RFE and LR based RFE. Classification accuracies of the learning models are depicted in Table 3. From results it can be seen that in case of the missing field ‘age’, the performance of feature reduced models are better in almost all the cases. Only exception is random forest based reduction in case of ANN classifier. So, this model (RF + ANN) should not be used for diagnosing ASD if ‘age’ field is missing in the test case. Similarly, if the missing field is ‘gender’, the performance of random forest based RFE with classifiers SVM and RF shows poor performance. Logistic regression based RFE shows poor performance with all the classifiers. So, (RF + SVM), (RF + RF), (LR + ANN), (LR + SVM) and (LR + RF) models should not be used if ‘gender’ field is missing in the test case. In the similar way, if missing field is ‘jaundice’, ANN with Random forest based RFE shows less accurate result. In case of missing field ‘autism’, random forest based reduced model shows poor performance with all the three classifiers. So, (RF + SVM), (RF + RF) and (RF + ANN) models should not be used if test case is missing ‘autism’ field. Similarly in case of ‘used_app_before’ field logistic regression based reduced model shows poor performance with all the three classifiers. Hence, (LR + SVM), (LR + RF) and (LR + ANN) models should not be used if test case is missing ‘used_app_before’ field. In case the missing field is of Type1 i.e. ‘age, autism and used_app_ before’, random forest based RFE and logistic regression based RFE both shows poor performance with all the three classifiers. Hence, in this case (LR + SVM), (LR + RF), (LR + ANN), (RF + SVM), (RF + RF) and (RF + ANN) models should not be used. In the similar manner if the missing field is of Type2 i.e. ‘age, jaundice and autism’, SVM and random forest based RFE both underperformed with all the three classifiers. Finally, if the missing field is of Type3 i.e. ‘age, gender and used_app_before’, in that scenario, LR with all classifiers and RF with ANN shows poor classification accuracy. Therefore, (LR + ANN), (LR + SVM), (LR + RF) and (RF + ANN) should not be used if test case does not contain ‘age, gender and used_app_before’ information. Figure 8 shows classification accuracy of all the models. Models which should not be used because of poor performance are highlighted with red circles in the diagram.
Table 3.
Comparison of accuracy rate of various classification models with and without RFE in case 2.
| Missing field | Classifier | Without feature selection | Feature selection method |
|||
|---|---|---|---|---|---|---|
| DT | SVM | RF | LR | |||
| Age | ANN | 0.7303 | 0.9942 | 0.9914 | 0.7246 | 0.9714 |
| RF | 0.9572 | 1 | 1 | 0.9957 | 1 | |
| SVM | 0.8159 | 1 | 1 | 1 | 1 | |
| Gender | ANN | 0.7303 | 0.9942 | 0.9643 | 0.8288 | 0.7303 |
| RF | 0.9572 | 1 | 0.9986 | 0.8131 | 0.7475 | |
| SVM | 0.9372 | 1 | 1 | 0.7303 | 0.7303 | |
| Jaundice | ANN | 0.9514 | 0.9942 | 0.9671 | 0.8901 | 0.98 |
| RF | 0.9572 | 1 | 0.9971 | 0.9957 | 1 | |
| SVM | 0.9514 | 1 | 1 | 1 | 1 | |
| Autism | ANN | 0.9514 | 0.9942 | 0.99 | 0.7303 | 0.9871 |
| RF | 0.9572 | 1 | 1 | 0.8146 | 1 | |
| SVM | 0.9514 | 1 | 1 | 0.7303 | 1 | |
| used_app_before | ANN | 0.7303 | 0.9928 | 0.99 | 0.9058 | 0.7303 |
| RF | 0.9572 | 1 | 1 | 0.9957 | 0.7475 | |
| SVM | 0.9514 | 1 | 1 | 1 | 0.7303 | |
| Type 1 | ANN | 0.8159 | 0.9928 | 0.9928 | 0.7303 | 0.7303 |
| RF | 0.9543 | 1 | 1 | 0.8245 | 0.7475 | |
| SVM | 0.8159 | 1 | 1 | 0.7303 | 0.7303 | |
| Type 2 | ANN | 0.8188 | 0.9942 | 0.7303 | 0.7303 | 0.9843 |
| RF | 0.9543 | 1 | 0.7532 | 0.8188 | 1 | |
| SVM | 0.8188 | 1 | 0.7303 | 0.7303 | 1 | |
| Type 3 | ANN | 0.7646 | 0.9942 | 0.9671 | 0.7631 | 0.7303 |
| RF | 0.9572 | 1 | 0.9986 | 0.9957 | 0.7475 | |
| SVM | 0.7646 | 1 | 1 | 1 | 0.7303 | |
Abbreviations: DT, decision tree; SVM, support vector machine; RF, random forest; LR, logistic regression; ANN, artificial neural network; RFE, recursive feature elimination.
Figure 8.
Classification accuracy of various models; Models to be discarded are marked with the circles.
Conclusion
This study presents the automation of autism diagnostic tool with the help of ANN, SVM and RF learning models. The experiment was carried out on a dataset of sample size 701 with two different situations; first one was with the original data while in the second case missing values were introduced in various fields. RFE based feature selection that reduce the feature dimension by half was applied on both the cases. In the first case it is observed that out of 12 feature reduced models 6 outperformed the classification models without RFE, while 4 performed equally and 2 underperformed. In the second case,missing values were introduced in the test dataset for the fields’ ‘age’, ‘gender’, ‘Jaundice’, ‘autism’, ‘used_app_before’ and their three combinations (Type 1, Type 2 and Type 3). For missing field ‘age’ 11 models, for ‘gender’ 7 models, for ‘Jaundice’ 11 models, for ‘autism’ 9 models, for ‘used_app_before’ 9 models, for ‘Type1’ 6 models, for ‘Type2’ 6 models and for ‘Type3’ 9 models outperformed the classification models without RFE. Thereby, specific RFE linked classification models were suggested for particular missing values which could classify with an accuracy of 1. Thus, significant classification accuracies evidence the integrity and reliability of proposed method in ASD diagnosis using behavioral based data.
The present study has a limitation of considering only behavioral based diagnostic data which are effectively worked out with classical machine learning techniques. However, similar work can be done with the neuroimaging data as well. sMRI, fMRI, rsfMRI, fNIRS and dMRI based neuroimaging dataset may be used for diagnosing ASD with the help of Convolutional Neural Network and Long short term memory based advanced deep learning techniques. Moreover, this work can be further extended by considering datasets which contains both behavioral and neuroimaging based data, more machine learning models and other feature selection algorithms.
Disclosure statement
No potential conflict of interest was reported by the author.
References
- Allison, C., Auyeung, B. and Baron-Cohen, S.. 2012. Toward brief “red flags” for autism screening: The short Autism Spectrum Quotient and the short quantitative checklist for autism in toddlers in 1,000 cases and 3,000 control. Journal of the American Academy of Child & Adolescent Psychiatry, 51, 202–212. [DOI] [PubMed] [Google Scholar]
- Auyeung, B., Baron-Cohen, S., Wheelwright, S. and Allison, C.. 2008. The Autism Spectrum Quotient: Children’s Version (AQ-Child). Journal of Autism and Developmental Disorders, 38, 1230–1240. [DOI] [PubMed] [Google Scholar]
- Christine, K., Delli, S. and Gkiolnta, E.. 2020. Review of assistive technology in the training of children with autism spectrum disorders. International Journal of Developmental Disabilities, 1–16. doi: 10.1080/20473869.2019.1706333 [DOI] [PMC free article] [PubMed] [Google Scholar]
- Doi, H. and Shinohara, K.. 2017. fNIRS studies on hemispheric asymmetry in atypical neural function in developmental disorders. Frontiers in Human Neuroscience, 11, 1–16. [DOI] [PMC free article] [PubMed] [Google Scholar]
- Duda, M., Haber, N., Daniels, J. and Wall, D. P.. 2017. Crowd sourced validation of a machine-learning classification system for autism and ADHD. Translational Psychiatry, 7, e1133–e1133. [DOI] [PMC free article] [PubMed] [Google Scholar]
- Duda, M., Kosmicki, J. and Wall, D.. 2014. Testing the accuracy of an observation-based classifier for rapid detection of autism risk. Translational Psychiatry, 4, e424. [DOI] [PMC free article] [PubMed] [Google Scholar]
- Fakhoury, M. 2015. Autistic spectrum disorders: A review of clinical features, theories and diagnosis. International Journal of Developmental Neuroscience, 43, 70–77. [DOI] [PubMed] [Google Scholar]
- Gomot, M., Bernard, F. A., Davis, M. H., Belmonte, M. K., Ashwin, C., Bullmore, E. T. and Baron-Cohen, S.. 2006. Change detection in children with autism: An auditory even-t-related fMRI study. Neuroimage, 29, 475–484. [DOI] [PubMed] [Google Scholar]
- Kim, Y. S., Fombonne, E., Koh, Y. J., Kim, S. J., Cheon, K. A. and Leventhal, B. L.. 2014. A comparison of DSM-IV pervasive developmental disorder and DSM-5 autism spectrum disorder prevalence in an epidemiologic sample. Journal of the American Academy of Child & Adolescent Psychiatry, 53, 500–508. [DOI] [PMC free article] [PubMed] [Google Scholar]
- Kosmicki, J. A., Sochat, V., Duda, M. and Wall, D. P.. 2015. Searching for a minimal set of behaviors for autism detection through feature selection-based machine learning. Translational Psychiatry, 5, e514. [DOI] [PMC free article] [PubMed] [Google Scholar]
- Kuhn, M. and Johnson, K.. 2019. Feature engineering and selection: A practical approach for predictive models. Boca Raton: Chapman & Hall/CRC Press. [Google Scholar]
- Li, J., Zhong, Y., Han, J., Ouyang, G., Li, X. and Liu, H.. 2020. Classifying ASD children with LSTM based on raw videos. Neurocomputing, 390, 226–238. [Google Scholar]
- Lord, C., Risi, S., Lambrecht, L., Cook, E. H., Leventhal, B. L., DiLavore, P. C., Pickles, A. and Rutter, M.. 2000. The Autism diagnostic observation schedule—Generic: A standard measure of social and communication deficits associated with the spectrum of autism. Journal of Autism and Developmental Disorders, 30, 205–223. [PubMed] [Google Scholar]
- Nakai, Y., Takiguchi, T., Matsui, G., Yamaoka, N. and Takada, S.. 2017. Detecting abnormal voice prosody through single-word utterances in children with autism spectrum disorders: Machine-learning-based voice analysis versus speech therapists. Perceptual and Motor Skills, 124, 961–973. [DOI] [PubMed] [Google Scholar]
- Pagnozzi, A. M., Conti, E., Calderoni, S., Fripp, J. and Rose, S. E.. 2018. A systematic review of structural MRI biomarkers in autism spectrum disorder: A machine learning perspective. International Journal of Developmental Neuroscience, 71, 68–82. [DOI] [PubMed] [Google Scholar]
- Parikh, M. N., Li, H. and Lili, H.. 2019. Enhancing diagnosis of autism with optimized machine learning models and personal characteristic data. Frontiers in Computational Neuroscice, 13, 1–5. [DOI] [PMC free article] [PubMed] [Google Scholar]
- Pratap, A., Kanimozhiselvi, C. S., Vijayakumar, R. and Pramod, K. V.. 2014. Predictive assessment of autism using unsupervised machine learning models. InternationalJournal of Advanced Intelligence Paradigms, 6, 13–21. [Google Scholar]
- Plitt, M., Barnes, K. A. and Martin, A.. 2015. Functional connectivity classification of autism identifies highly predictive brain features but falls short of biomarker standards. Neuroimage: Clinical, 7, 359–366. [DOI] [PMC free article] [PubMed] [Google Scholar]
- Puerto, E., Aguilar, J., López, C. and Chávez, D.. 2019. Using multilayer fuzzy cognitive maps to diagnose. Applied Soft Computing, 75, 58–71. [Google Scholar]
- Radwan, A. M., Birkan, B., Hania, F. and Cataltepe, Z.. 2017. Active machine learning framework for teaching object recognition skills to children with autism. International Journal of Developmental Disabilities, 63, 158–169. [Google Scholar]
- Russell, S. M., Casey, M. B. and Gilbert, A. L.. 2020. Theuse of the performance diagnostic checklist-human services in development of interventionsto increase fidelity. International Journal of Developmental Disabilities, 66, 381–389. [DOI] [PMC free article] [PubMed] [Google Scholar]
- Shriram, K., Vasudevan, S. N., Abhishek, S. S., Lakshmi, A. and Anandaram, S.. 2019. Learn quest - A virtual reality based system for training autistic kids. International Journal of Medical Engineering and Informatics, 11, 103–115. [Google Scholar]
- Thabtah, F. 2017. Autism spectrum disorder screening: Machine learning adaptation and DSM-5 fulfillment. In Proceedings of the 1st International Conference on Medical and Health Informatics. Taichung City, 20–22 May 2017,Taiwan Association for Computing Machinery, New York, NY, USA, 1–6 [Google Scholar]
- Thabtah, F. 2019. Machine learning in autistic spectrum disorder behavioral research: A review and ways forward. Informatics for Health and Social Care, 44, 278–297. [DOI] [PubMed] [Google Scholar]
- Wall, D. P., Dally, R., Luyster, R., Jung, J. Y. and Deluca, T. F.. 2012b. Use of artificial intelligence to shorten the behavioural diagnosis of autism. PLoS One, 7, e43855. [DOI] [PMC free article] [PubMed] [Google Scholar]
- Wall, D. P., Kosmiscki, J., Deluca, T. F., Harstad, L. and Fusaro, V. A.. 2012a. Use of machine learning to shorten observation-based screening and diagnosis of Autism. Translational Psychiatry, 2, e100. [DOI] [PMC free article] [PubMed] [Google Scholar]
- Xu, L., Hua, Q., Yu, J. and Li, J.. 2020. Classification of autism spectrum disorder based on sample entropy of spontaneous functional near infra-red spectroscopy signal. Clinical Neurophysiology, 131, 1365–1374. [DOI] [PubMed] [Google Scholar]


