

Abstract
Understanding postoperative recovery is critical for guiding efforts to improve post-acute phase care. How recovery evolves during the first 30 days after cardiac surgery is not well-understood. A digital platform may enable granular quantification of recovery by frequently capturing patient-reported outcome measures (PROM) that can be clinically implemented to support recovery. We conduct a prospective cohort study using a digital platform to measure recovery after cardiac surgery using a PROM sent every 3 days for 30 days after surgery to characterize recovery in multiple domains (e.g., pain, sleep, activities of daily living, anxiety) and to identify factors related to the patient’s perception of overall recovery. We enroll patients who underwent cardiac surgery at a tertiary center between January 2019 and March 2020 and automatically deliver PROMs and reminders electronically. Of the 10 surveys delivered per patient, 8 (IQR 6–10) are completed. Patients who experienced postoperative complications more commonly belong to the worst overall recovery trajectory. Of the 12 domains modeled, only the worst anxiety trajectory is associated with the worse overall recovery trajectory membership, suggesting that even when patients struggle in the recovery of other domains, the patient may still feel progress in their recovery. We demonstrate that using a digital platform, automated PROM data collection, and characterization of multi-domain recovery trajectories is feasible and likely implementable in clinical practice. Overall recovery may be impacted by complications, while slow progress in constituent domains may still allow for the perception of overall recovery progression.
Subject terms: Outcomes research, Cardiovascular diseases
Introduction
Understanding how patients recover from cardiac surgery is important for preoperative patient counseling1, resource allocation2, and post-acute strategies3. However, few studies have evaluated the recovery after cardiac surgery from the patient perspective, using patient-reported outcome measures (PROMs) administered at a high frequency after hospital discharge4–6. Frequent PROM data collection in the early period after discharge can capture the recovery trajectory but can burden the participants and may be resource-intensive. Digital platforms leveraging smartphones and tablets may facilitate frequent data collection, reducing personnel time and effort and increasing patient engagement7. Assessing the feasibility of a less resource-intensive way of PROM data collection has important implications in informing a larger-scale implementation of such an approach to propel the field of postoperative recovery research and develop applications in routine clinical practice.
Recovery is a complex phenomenon with an interplay of physiologic, physical, and mental responses to surgery. A comprehensive understanding of postoperative recovery requires measuring PROMs across various domains, including pain, ability to complete activities of daily living (ADL), and mental well-being8. While the recovery in each domain likely contributes to the patient’s perception of overall recovery, this interplay and factors associated with the patient’s perception of overall recovery progress are not well-understood.
We conducted a study to evaluate the feasibility of using a digital platform to collect data, aiming to include diverse patients by simplifying enrollment and automating data collection9. We demonstrate that using a digital platform, automated PROM data collection, and characterization of multi-domain recovery trajectories is feasible and likely implementable in clinical practice. In the first 30 days after cardiac surgery, overall recovery may be impacted by complications, while slow progress in constituent domains may still allow for the perception of overall recovery progression.
Results
Patient characteristics
The median age (IQR) of the 80 patients analyzed was 64 (57, 70) years, of which 20 (25%) were women and 72 (90%) were of the Caucasian race, which are comparable demographics distribution to our center’s consecutive CABG patients10. Forty (50%) patients underwent CABG, 18 (22%) underwent AVR, and 27 (33%) underwent mitral valve surgery. There were 7 (9%) redo sternotomy cases, and 24 (30%) were operated on urgent bases (Table 1).
Table 1.
Patient characteristics by the overall recovery trajectories.
| Characteristics | Good recovery (N = 68) | Poor recovery (N = 12) | P |
|---|---|---|---|
| Age | 65 (58, 71) | 60 (54, 62) | 0.08 |
| Woman | 18 (26%) | 2 (17%) | 0.7 |
| Race | 0.7 | ||
| Black | 4 (5.9%) | 0 (0%) | |
| White | 61 (90%) | 11 (92%) | |
| Other | 3 (4.4%) | 1 (8.3%) | |
| Diabetes | 24 (35%) | 2 (17%) | 0.3 |
| Hypertension | 50 (74%) | 6 (50%) | 0.2 |
| Liver disease | 6 (8.8%) | 0 (0%) | 0.6 |
| Creatinine (mg/dL) | 0.96 (0.84, 1.19) | 0.97 (0.84, 1.08) | 0.9 |
| Cerebrovascular disease | 9 (13%) | 0 (0%) | 0.3 |
| Prior myocardial infarction | 18 (26%) | 5 (42%) | 0.3 |
| Heart failure | 22 (32%) | 3 (25%) | 0.7 |
| Ejection fraction (%) | 60 (55, 63) | 59 (43, 63) | 0.5 |
| Status | >0.9 | ||
| Elective | 47 (69%) | 9 (75%) | |
| Urgent | 21 (31%) | 3 (25%) | |
| Re-do operation | 6 (8.8%) | 1 (8.3%) | >0.9 |
| CABG | 34 (50%) | 6 (50%) | >0.9 |
| Aortic surgery | 4 (5.9%) | 0 (0%) | >0.9 |
| AVR | 15 (22%) | 3 (25%) | >0.9 |
| MV surgery | 23 (34%) | 4 (34%) | >0.9 |
| Robotic approach | 15 (22%) | 2 (17%) | >0.9 |
| Postoperative length of stay (days) | 5 (4, 6) | 6.5 (4, 7.75) | 0.06 |
| Any complications | 24 (35%) | 9 (75%) | 0.023 |
| Surgical site infection | 2 (2.9%) | 1 (8.3%) | 0.4 |
| Reoperation for bleeding | 0 (0%) | 2 (17%) | 0.021 |
| Sepsis | 0 (0%) | 0 (0%) | |
| Stroke | 0 (0%) | 0 (0%) | |
| TIA | 0 (0%) | 0 (0%) | |
| Prolonged ventilatory support | 0 (0%) | 2 (17%) | 0.021 |
| Pneumonia | 0 (0%) | 1 (8.3%) | 0.15 |
| VTE | 0 (0%) | 1 (8.3%) | 0.15 |
| Renal failure | 0 (0%) | 0 (0%) | >0.9 |
| Readmission | 4 (5.9%) | 2 (17%) | 0.2 |
| 30-day survival | 68 (100%) | 12 (100%) | >0.9 |
P values in bold indicate p < 0.05. For significance testing, chi-squared test and Wilcoxon rank-sum test were used for categorical and continuous variables, respectively. CABG coronary artery bypass graft surgery, AVR surgical aortic valve replacement, MV mitral valve, TIA transient ischemic attack, VTE venous thromboembolism.
Response rate and reasons for difficulty responding
Of the 10 surveys delivered, the median number of responses was 8 (IQR: 6,10). There were 47 patients (59%) who responded to 8 or more surveys, 18 (23%) who responded to between 5 and 8 surveys, and 15 (19%) who responded to 4 or fewer surveys. Including the 12 patients who responded to only one survey (excluded from the analysis), we attempted to contact 27 patients who responded to 4 or fewer surveys, 19 of whom we could reach. Of the 19, the most common patient-reported reason for low response rate had other priorities (n = 7), challenge responding due to clinical conditions (n = 5), the survey being too long or too frequent (n = 3), survey software issue (n = 2), and having difficulty finding the survey in the inbox (n = 2). Patient characteristics did not differ significantly between those who responded <80% versus ≥80% (Supplemental Table 1). The average time spent on survey completion was 5.2 ± 1.5 min.
Group-based trajectory model
For the patient perception of overall recovery, the group-based trajectory model with four trajectories yielded the best fit based on the Bayesian information criterion (BIC) value (Fig. 1). There were 11 patients who were classified into the best recovery trajectory (Fig. 1, yellow curve), depicting a high percentage of perceived overall recovery since the first measurement and a persistent increase in the perceived overall recovery throughout the 30-day period. There were 12 patients who were classified into the worst recovery trajectory (Fig. 1, red curve), depicting low perceived overall recovery throughout the first 30 days.
Fig. 1. Trajectories of patient perception of overall recovery.
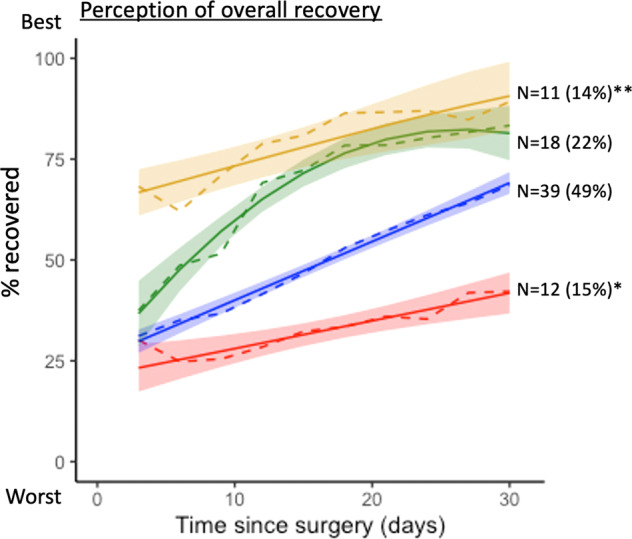
The figure shows four trajectories of overall recovery on the patient-reported scale of 0 to 100%. The trajectory groups were identified by fitting the group-based trajectory model. The yellow curve depicts the best recovery trajectory, including 11 patients, and the red curve depicts the worst recovery trajectory, including 12 patients. Trajectory with a single asterisk (*) denotes the worst recovery trajectory and the trajectory with double asterisks (**) denotes the best trajectory.
Group-based trajectory models for 12 questionnaire responses yielded trajectories shown in Figs. 2 and 3. The best-fit models classified patients into 3 groups for all questionnaires, except for surgical site pain and sleep, which yielded 4 trajectory groups, and hygiene and nausea, which yielded 2 trajectory groups. All the trajectory groups had a mean posterior probability of assignment of 0.80 or higher, indicating a good separation of trajectory class.
Fig. 2. Trajectories of recovery by emotive and cognitive domains.

The figure shows trajectories of recovery in cognitive and emotive domains. All questionnaire responses in these domains yielded three dominant trajectories. Trajectories with single asterisk (*) denotes the best recovery trajectory and those with double asterisks (**) denote the worst trajectory. Colors are used for visualization purposes and do not correspond to better or worse trajectories. Patients’ level of anxiety (a), restless feeling (b), depressed feeling (c), rested feeling (d), being able to remember things (e), and being able to make decision quickly (f) are displayed.
Fig. 3. Trajectories of recovery by sleep, food, activities of daily living, and nociception.

The figure shows trajectories of recovery in sleep, ability to enjoy food, activities of daily living, nausea, and pain. All questionnaire responses in these domains yielded three dominant trajectory groups, except for nausea and hygiene, which yielded 2 trajectory groups, and pain and sleep, which yielded four trajectory groups. Trajectories with single asterisk (*) denotes the best recovery trajectory and those with double asterisks (**) denote the worst trajectory. Colors are used for visualization purposes and do not correspond to better or worse trajectories. Patients’ ability to sleep (a), ability to enjoy food (b), ability to dress (c), ability to take care of hygiene (d), feeling of nausea (e), and surgical site pain (f) are displayed.
Patient characteristics by the overall perception of recovery trajectories
Comparing patients who were classified into the worst overall recovery trajectory group (n = 11) versus the remainder who were classified into one of the three better trajectory groups (n = 69), there were no statistically significant differences across preoperative patient characteristics and surgical characteristics. Patients in the worst trajectory group had a higher incidence of postoperative complications: 24 patients (35%) experienced at least one complication in the better overall recovery groups, whereas 9 (75%) had complications among those in the worst overall recovery trajectory (p = 0.023 by chi-squared test). Postoperative length of stay was not significantly different. Among the complications, prolonged ventilatory support and reoperation for bleeding were statistically significantly higher in the worst overall recovery trajectory group (Table 1).
Relationship between the overall recovery and other domains
From the trajectory groups identified in the 12 questionnaire responses in the other recovery domains, we graphically identified the worst trajectory in each of the 12 questionnaire responses (Figs. 2 and 3). Comparing the frequencies of belonging to the worst trajectories in each of the 12 items, only the worst anxiety trajectory was significantly more frequent in those belonging to the worst overall recovery trajectory (Table 2).
Table 2.
Associations between belonging to the worst overall recovery trajectory vs. worst trajectories in other domains.
| Worst trajectories in each domain | Good recovery (N = 68) | Worst recovery (N = 12) | P |
|---|---|---|---|
| Pain | 7 (10%) | 0 (0%) | 0.6 |
| Anxiety | 6 (8.8%) | 4 (33%) | 0.038 |
| Able to make decision | 5 (7.4%) | 2 (17%) | 0.3 |
| Depression | 14 (21%) | 4 (33%) | 0.5 |
| Able to dress | 16 (24%) | 4 (33%) | 0.5 |
| Able to enjoy food | 19 (28%) | 6 (50%) | 0.2 |
| Able to manage hygiene | 30 (44%) | 8 (67%) | 0.15 |
| Nausea | 24 (35%) | 5 (42%) | 0.7 |
| Able to remember | 9 (13%) | 2 (17%) | 0.7 |
| Feeling rested | 31 (46%) | 6 (50%) | 0.8 |
| Feeling restless | 28 (41%) | 5 (42%) | >0.9 |
| Sleep | 7 (10%) | 3 (25%) | 0.2 |
The table shows bivariate comparisons of the frequencies belonging to the worst trajectory in each of the displayed recovery domains, comparing the frequencies among those belonging to the worst overall recovery trajectory versus any of the better overall trajectory groups. The bolded value indicates p < 0.05. For significance testing, the chi-squared test and Wilcoxon rank-sum test were used for categorical and continuous variables, respectively.
Discussion
In this descriptive study, we demonstrated that measurement of PROM as frequently as every 3 days yielded a good response rate using a digital platform, and the resulting data separated into distinct trajectory groups across various recovery domains based on latent class trajectory models. We also demonstrated that a patient’s sense of overall recovery may be associated with complications, but did not observe an association between the patient’s overall sense of recovery and any component domain of recovery, such as pain or ADLs. Although the evaluated associations may be limited by the sample size, this information may be used to set expectations and alleviate the worries of patients and families at preoperative counseling. Such recovery trajectory data may serve as indicators that could guide efforts to improve the post-acute recovery.
This study extends the literature in several ways. Although there are extensive data and models to predict mortality and complications in the first 30 days after cardiac surgery11, we have minimal understanding of the experience of patient recovery during this period4. While surgical and anesthesia societies recommend patients ask their doctors about the expected recovery course after surgery12,13, data to guide answering this question are lacking. For example, a systematic review on the postoperative recovery after cardiac surgery identified that studies evaluating short-term postoperative recovery at a high measurement frequency are rare and that the reporting methodology did not account for underlying heterogeneous trajectories4. Our study shows the feasibility of quantifying recovery via multi-domain measurement of PROM and reporting in a small number of trajectory groups to facilitate interpretation. Our analysis also demonstrated that even in a cohort of patients with low complication rates and no operative mortality, the recovery course, as experienced by the patients and measured by PROMs, varied substantially. This highlights the potential utility of PROMs to characterize the patient’s recovery course beyond conventional, observer-reported outcomes of mortality and postoperative complications. The findings suggest that digital collection and transmission of recovery data could play a vital role in the evaluation and management of recovery and in the pursuit of research to develop management strategies that improve outcomes.
To assess the feasibility of broader clinical implementation of frequent PROM data collection, our enrollment and follow-up protocols were designed to minimize the time and effort to enroll the patients and collect the PROM data. Leveraging a digital platform for survey delivery, reminder, and data collection and organization, we reduced the direct encounter between the investigator and participants to a single encounter for enrollment. In clinical practice, this enrollment may be performed by a clinician as part of the initial transfer assessment out of the intensive care unit (ICU). Future studies could explore the possibility of fully digital enrollment without direct patient-clinician encounters, as some trials have done. Expanding this approach to other surgical and interventional fields may offer further insights into a variable recovery based on the magnitude of the procedure.
Symptom monitoring alone has been shown to improve QoL in patients undergoing cancer treatment14. Our work provides a step towards broader implementation of PROM data collection and evaluating the impact of interventions on postoperative recovery. We used this method to identify a group of patients belonging to a particular postoperative pain trajectory that may benefit from earlier postoperative follow-up15. It is plausible that such information could be an early indicator of recovery and identify people who would respond to more intensive postoperative care.
We demonstrated that complications, specifically prolonged ventilatory support and return to the operating room for bleeding, were associated with a worse overall perception of postoperative recovery. While both complications are known to increase the length of stay16, how they may relate to the patient’s perception of recovery has been unknown. The Society of Thoracic Surgeons’ risk calculators provide predictions for the risk of both bleeding and prolonged mechanical ventilatory support based on variables that are available preoperatively. Therefore, such risks may be extrapolated to provide patients with the expectation for overall recovery from the patient’s perspective during preoperative counseling.
Our study identified a potential association between anxiety trajectory and overall recovery trajectory but did not find a clear association between the overall recovery trajectory and recovery in other domains, including pain, ADL, or sleep. Therefore, although patients may have persistent pain, limited ability to perform ADL, or poor sleep, the patient may still feel progression in their overall recovery. This also highlights the complexity of the perception of patient recovery and the importance of understanding and evaluating these using PROMs.
The single-center design of our study may limit the generalizability of our findings, although the variation in the phenotype of pain trajectories may be a finding applicable to practices in care settings different from ours. The sample size was limited due to the premature termination of the study related to the COVID-19 pandemic, restricting our ability for split-sample testing of trajectories and to make a more robust inference for characteristics associated with specific recovery trajectory, including multivariable analysis and evaluation of the recovery specific to the type of operations the patient underwent. The small sample size also likely increased the chance of type II errors. Post-hoc power analysis was not performed as the utility of such analysis to inform the chance of type II error is limited17–19. As expected, many patients did not complete all 10 delivered surveys. We delivered a high number of surveys to capture at least 3 responses for the trajectory to be modeled in the latent class analysis and demonstrated a reasonable response rate. We did not perform statistical corrections for multiple testing. Therefore, there may be an elevated chance that the statistically significant association observed is due to a Type I error, although there is a counterargument to routinely performing such corrections for multiple testing20. External validation of the trajectories could not be performed for the lack of a separate dataset.
Patient-reported information related to postoperative recovery after cardiac surgery can be measured using a digital platform with PROM questionnaires delivered at high frequency in a short postoperative interval. Perception of recovery varies even among a group of patients with low complication rates and no mortality.
Methods
Patient selection criteria and data source
We studied a convenience sample of patients who underwent cardiac surgery at Yale New Haven Hospital between January 2019 and March 2020. Yale New Haven Hospital is a tertiary center in the United States, where over 1100 cardiac surgeries are performed annually. Postoperative, as opposed to preoperative, enrollment allowed us to enroll patients undergoing non-elective surgery to reduce selection bias. Inclusion criteria were patients undergoing isolated or concomitant coronary artery bypass graft (CABG), aortic valve replacement, mitral valve replacement, mitral valve repair, or aortic operation who were discharged from the ICU within 5 days of the operation. This 5-day threshold ensured that the time of initiation of QoL assessments would be standardized since patients could not be enrolled in the ICU due to logistical challenges. A research assistant (RA) visited the patient and after confirming the patient was eligible to participate and following the description of the study procedure, obtained written informed consent from all study participants. Patients provided signed informed consent. We excluded patients who could not complete enrollment, did not own a smartphone or a tablet, and those who did not speak or read English because the electronic platform for PROM data collection relied on patients responding to surveys received via email or text and which opened on a web browser. We screened 168 patients, of which 92 (54.8%) met the eligibility criteria and were enrolled. We excluded 12 patients who responded only once, resulting in 80 who were analyzed for this study (Fig. 4).
Fig. 4. CONSORT-style enrollment flow chart.

This figure outlines the enrollment flow. Of the 92 patients enrolled, 12 were excluded due to the low response rate precluding the trajectory analysis, resulting in 80 patients analyzed for this study. There was no mortality during the follow-up period.
Details of the protocol have been published9. The cardiac surgery service did not have a formalized Enhanced Recovery After Surgery (ERAS) pathway at the time of the study. Pain regimens were individualized to the patient’s needs during the hospitalization and at discharge. The Yale Institutional Review Board approved the study (IRB # 2000025689).
Questionnaire and data collected
Quality of Recovery (QoR-24), a 24-item questionnaire assessing postoperative recovery21–23 adapted from the original QoR-4024, was delivered every 3 days for 30 days. The questionnaire for each item asked patients about the frequency of symptoms, ranging from 0 to 10, with 0 being ‘none of the time’ and 10 being ‘all of the time.’ For example, the questionnaire for pain read, ‘During the last 24 h, I have been having pain in the surgical wound:’ with possible responses ranging from 0 to 10 (Supplemental Figs. 1 and 2). Other domains of recovery assessed were: sleep, ADLs, nausea, feeling of depression, anxiety, feeling rested, feeling restless, ability to enjoy food, ability to make a decision quickly, being able to remember things, and patient perception of overall recovery (scored 0–100%, with 0% being not recovered at all and 100% being fully recovered).
Patient characteristics, intraoperative, and postoperative variables were prespecified9 and collected via the institutional Society of Thoracic Surgeons (STS) Adult Cardiac Surgery Database using the data version 2.91 definitions25.
Digital platform characteristics
A patient-specific survey account was made during enrollment using the patient’s email address. We used HugoHealth, a digital health platform that integrates patients’ healthcare records, customization of survey deliveries, and organization of survey response data. The questionnaire was not integrated into the electronic health record system, which ensured the survey response did not elicit changes in treatment. Mobile devices used to respond to the questionnaires were patients’ own devices. The author (H.K.) is a co-founder of HugoHealth.
Electronic survey delivery via email, reminder, and response collection were all automated. Therefore, investigators directly contacted each patient only once during the study period, at the time of enrollment. To reflect the possible clinical implementation of survey delivery, we tested automated survey delivery and reminders instead of researchers contacting the patient to deliver the survey to ensure participation. After all the surveys were delivered, we asked patients with a low response rate (<5/10 surveys returned) and categorized the reasons they provided.
Statistical analysis
We applied a group-based trajectory model, a family of latent class analyses, which estimated the probability of belonging to a specific QoL trajectory26,27. This is a semiparametric finite mixture model for longitudinal data using a maximum likelihood method fitting the survey response values with a censored normal distribution. We fitted the model from one to five trajectories with polynomial order of up to a cubic term. Attrition from the study was not modeled together, as there was no mortality during the study period.
We determined the optimal number of trajectory classes based on the BIC and average posterior probability of assignment (>0.9 indicated excellent fit and <0.7 indicated poor fit) among the models with one to five trajectory classes and incrementally increasing the polynomial order28.
To facilitate clinical interpretation of trajectories in each domain, trajectory groups identified via the latent class models were further dichotomized into one trajectory that distinctively indicates worse recovery than the rest. The worst trajectory class was identified graphically. We defined patients belonging to the worst overall recovery trajectory as the exposure of interest and compared patient characteristics and surgical and postoperative characteristics between those belonging to the worst overall recovery trajectory and all remaining patients belonging to better overall recovery trajectories.
For comparing patient characteristics between patients belonging to the worst versus the remaining overall recovery trajectory groups, we used Wilcoxon rank-sum test for continuous variables and the chi-square test for categorical variables. We also evaluated the association between belonging to the worst overall recovery trajectory groups and belonging to the worst recovery trajectories in other domains using chi-squared analysis. This analysis was performed to identify other recovery domains associated with the overall perception of recovery. We defined p = 0.05 as the threshold for statistical significance. We used the Traj package for a group-based trajectory model in SAS 9.4 (SAS Institute, Inc Cary, NC). The analysis was conducted by the first author (M.M).
Missing data
We did not impute questionnaire responses. With ≥2 responses, the group-based trajectory model’s full information maximum likelihood estimation allowed for integrating all available information based on missing-at-random assumption29. Missing data for the STS data occurred in <2% of participants, and missing values were conditionally estimated as described by Shahian et al.30 in the STS risk model development, classifying missing values to those in the lowest risk category for categorical variables and using age and sex-specific means for continuous variables.
Reporting summary
Further information on research design is available in the Nature Research Reporting Summary linked to this article.
Supplementary information
Acknowledgements
Makoto Mori was funded by the Investigative Medicine Program at Yale, which is supported by CTSA Grant Number UL1 TR001863 from the National Center for Advancing Translational Science (NCATS), a component of the National Institutes of Health (NIH). Its contents are solely the responsibility of the authors and do not necessarily represent the official view of NIH.
Author contributions
M.M. designed and conducted the study, analyzed the data, and written and revised the manuscript. S.S.D. designed the study and revised the manuscript. A.G. helped to conduct the study, provided research support, and revised the manuscript. H.M.K. designed and supervised the study, written and revised the manuscript.
Data availability
The data that support the findings of this study are not openly available due to participant privacy. De-identified data are available from the first author upon reasonable request.
Code availability
The code used for the analysis is available at 10.5281/zenodo.7316275.
Competing interests
The authors report the following financial and non-financial competing interest: In the past three years, Harlan Krumholz received expenses and/or personal fees from UnitedHealth, Element Science, Aetna, Reality Labs, Tesseract/4Catalyst, F-Prime, the Siegfried and Jensen Law Firm, Arnold and Porter Law Firm, and Martin/Baughman Law Firm. He is a co-founder of Refactor Health and HugoHealth, and is associated with contracts, through Yale New Haven Hospital, from the Centers for Medicare & Medicaid Services and through Yale University from Johnson & Johnson. In the past three years, Sanket Dhruva reports research funding from the Medical Device Innovation Consortium (MDIC), Food and Drug Administration, Greenwall Foundation, Arnold Ventures, National Institute for Health Care Management, and Department of Veterans Affairs. In the past three years, Arnar Geirsson received consulting fee for being a member of Medtronic Strategic Surgical Advisory Board. Makoto Mori declares no financial or non-financial competing interests.
Footnotes
Publisher’s note Springer Nature remains neutral with regard to jurisdictional claims in published maps and institutional affiliations.
Supplementary information
The online version contains supplementary material available at 10.1038/s41746-022-00736-0.
References
- 1.McNair AGK, et al. What surgeons tell patients and what patients want to know before major cancer surgery: a qualitative study. BMC Cancer. 2016;16:258. doi: 10.1186/s12885-016-2292-3. [DOI] [PMC free article] [PubMed] [Google Scholar]
- 2.Altman AD, et al. Enhanced recovery after surgery: implementing a new standard of surgical care. CMAJ. 2019;191:E469–E475. doi: 10.1503/cmaj.180635. [DOI] [PMC free article] [PubMed] [Google Scholar]
- 3.NQF: building a roadmap from patient-reported outcome measures to patient-reported outcome performance measures - interim report. Accessed July 4, 2022. https://www.qualityforum.org/Publications/2021/08/Building_a_Roadmap_From_Patient-Reported_Outcome_Measures_to_Patient-Reported_Outcome_Performance_Measures_-_Interim_Report.aspx.
- 4.Mori M, et al. Characterizing patient-centered postoperative recovery after adult cardiac surgery: a systematic review. J. Am. Heart Assoc. 2019;8:e013546. doi: 10.1161/JAHA.119.013546. [DOI] [PMC free article] [PubMed] [Google Scholar]
- 5.Diab MS, et al. The influence of prolonged intensive care stay on quality of life, recovery, and clinical outcomes following cardiac surgery: a prospective cohort study. J. Thorac. Cardiovasc Surg. 2018;156:1906–1915.e3. doi: 10.1016/j.jtcvs.2018.05.076. [DOI] [PubMed] [Google Scholar]
- 6.Myles PS, et al. Relation between quality of recovery in hospital and quality of life at 3 months after cardiac surgery. Anesthesiology. 2001;95:862–867. doi: 10.1097/00000542-200110000-00013. [DOI] [PubMed] [Google Scholar]
- 7.Dhruva SS, et al. Aggregating multiple real-world data sources using a patient-centered health-data-sharing platform. NPJ Digit. Med. 2020;3:60. doi: 10.1038/s41746-020-0265-z. [DOI] [PMC free article] [PubMed] [Google Scholar]
- 8.Lee L, Tran T, Mayo NE, Carli F, Feldman LS. What does it really mean to “recover” from an operation? Surgery. 2014;155:211–216. doi: 10.1016/j.surg.2013.10.002. [DOI] [PubMed] [Google Scholar]
- 9.Mori M, et al. Protocol for project recovery after cardiac surgery: a single-center cohort study leveraging digital platform to characterise longitudinal patient-reported postoperative recovery patterns. BMJ Open. 2020;10:e036959. doi: 10.1136/bmjopen-2020-036959. [DOI] [PMC free article] [PubMed] [Google Scholar]
- 10.Bin Mahmood SU, et al. Clinical significance of presenting syndromes on outcome after coronary artery bypass grafting. Interact. Cardiovasc. Thorac. Surg. 2020;30:243–248. doi: 10.1093/icvts/ivz259. [DOI] [PubMed] [Google Scholar]
- 11.Shahian DM, et al. The Society of Thoracic Surgeons 2018 adult cardiac surgery risk models: part 1-background, design considerations, and model development. Ann. Thorac. Surg. 2018;105:1411–1418. doi: 10.1016/j.athoracsur.2018.03.002. [DOI] [PubMed] [Google Scholar]
- 12.Preparing for surgery: checklist. Made for this moment | anesthesia, pain management & surgery. Accessed July 6, 2022. https://www.asahq.org/madeforthismoment/preparing-for-surgery/prep/preparing-for-surgery-checklist/.
- 13.10 Questions to Ask Before Having an Operation. ACS. Accessed July 6, 2022. https://www.facs.org/for-patients/preparing-for-your-surgery/10-questions/.
- 14.Basch E, et al. Symptom monitoring with patient-reported outcomes during routine cancer treatment: a randomized controlled trial. JCO. 2016;34:557–565. doi: 10.1200/JCO.2015.63.0830. [DOI] [PMC free article] [PubMed] [Google Scholar]
- 15.Mori M, et al. Trajectories of pain after cardiac surgery: implications for measurement, reporting, and individualized treatment. Circ. Cardiovasc. Qual. Outcomes. 2021;14:e007781. doi: 10.1161/CIRCOUTCOMES.120.007781. [DOI] [PMC free article] [PubMed] [Google Scholar]
- 16.Al-Attar N, et al. Impact of bleeding complications on length of stay and critical care utilization in cardiac surgery patients in England. J. Cardiothorac. Surg. 2019;14:64. doi: 10.1186/s13019-019-0881-3. [DOI] [PMC free article] [PubMed] [Google Scholar]
- 17.Zhang Y, et al. Post hoc power analysis: is it an informative and meaningful analysis? Gen. Psych. 2019;32:e100069. doi: 10.1136/gpsych-2019-100069. [DOI] [PMC free article] [PubMed] [Google Scholar]
- 18.Goodman SN, Berlin JA. The use of predicted confidence intervals when planning experiments and the misuse of power when interpreting results. Ann. Intern. Med. 1994;121:200–206. doi: 10.7326/0003-4819-121-3-199408010-00008. [DOI] [PubMed] [Google Scholar]
- 19.Dziak JJ, Dierker LC, Abar B. The interpretation of statistical power after the data have been gathered. Curr. Psychol. 2020;39:870–877. doi: 10.1007/s12144-018-0018-1. [DOI] [PMC free article] [PubMed] [Google Scholar]
- 20.Rothman KJ. No adjustments are needed for multiple comparisons. Epidemiology. 1990;1:43–46. doi: 10.1097/00001648-199001000-00010. [DOI] [PubMed] [Google Scholar]
- 21.Jaensson M, Dahlberg K, Eriksson M, Nilsson U. Evaluation of postoperative recovery in day surgery patients using a mobile phone application: a multicentre randomized trial. Br. J. Anaesth. 2017;119:1030–1038. doi: 10.1093/bja/aex331. [DOI] [PubMed] [Google Scholar]
- 22.Halleberg Nyman M, Nilsson U, Dahlberg K, Jaensson M. Association between functional health literacy and postoperative recovery, health care contacts, and health-related quality of life among patients undergoing day surgery: secondary analysis of a randomized clinical trial. JAMA Surg. 2018;153:738–745. doi: 10.1001/jamasurg.2018.0672. [DOI] [PMC free article] [PubMed] [Google Scholar]
- 23.Dahlberg K, Jaensson M, Eriksson M, Nilsson U. Evaluation of the Swedish Web-Version of Quality of Recovery (SwQoR): secondary step in the development of a mobile phone app to measure postoperative recovery. JMIR Res. Protoc. 2016;5:e192. doi: 10.2196/resprot.5881. [DOI] [PMC free article] [PubMed] [Google Scholar]
- 24.Myles PS, Weitkamp B, Jones K, Melick J, Hensen S. Validity and reliability of a postoperative quality of recovery score: the QoR-40. Br. J. Anaesth. 2000;84:11–15. doi: 10.1093/oxfordjournals.bja.a013366. [DOI] [PubMed] [Google Scholar]
- 25.Surgeons TS of T. Adult Cardiac Surgery Database Data Collection. Published online 2018. https://www.sts.org/registries-research-center/sts-national-database/adult-cardiac-surgery-database/data-collection.
- 26.Haviland AM, Jones BL, Nagin DS. Group-based trajectory modeling extended to account for nonrandom participant attrition. Sociol. Methods Res. 2011;40:367–390. doi: 10.1177/0049124111400041. [DOI] [Google Scholar]
- 27.Mori M, Krumholz HM, Allore HG. Using latent class analysis to identify hidden clinical phenotypes. JAMA. 2020;324:700–701. doi: 10.1001/jama.2020.2278. [DOI] [PubMed] [Google Scholar]
- 28.Nagin D. Group-based modeling of development. Published online 2005.
- 29.Nagin DS, Odgers CL. Group-based trajectory modeling in clinical research. Annu Rev. Clin. Psychol. 2010;6:109–138. doi: 10.1146/annurev.clinpsy.121208.131413. [DOI] [PubMed] [Google Scholar]
- 30.Shahian DM, et al. The society of thoracic surgeons 2008 cardiac surgery risk models: part 1-coronary artery bypass grafting surgery. Ann. Thorac. Surg. 2009;88:S2–S22. doi: 10.1016/j.athoracsur.2009.05.053. [DOI] [PubMed] [Google Scholar]
Associated Data
This section collects any data citations, data availability statements, or supplementary materials included in this article.
Supplementary Materials
Data Availability Statement
The data that support the findings of this study are not openly available due to participant privacy. De-identified data are available from the first author upon reasonable request.
The code used for the analysis is available at 10.5281/zenodo.7316275.