

Abstract
Eating disorder symptoms are associated with ovarian hormones and fluctuate predicably across the menstrual cycle. However, the specific symptoms that underlie these associations remain unclear. The current study aims to examine which specific eating disorder and premenstrual symptoms confer risk and maintain comorbidity using network analysis. Eating disorder and premenstrual symptoms were measured using the Eating Pathology Symptoms Inventory and the Daily Record of Severity of Problems, respectively, in a large sample of young adult females. Network analysis was used to explicate the structure of eating and premenstrual symptom networks separately and together. Eating disorder networks replicated previous literature and identified body dissatisfaction as a core feature, but was unique in identifying monitoring calories as an additional core feature. Central symptoms identified in the premenstrual symptom network were symptoms interference with daily life and activities and negative emotions brought on by hormone changes. Bridge symptoms between networks were identified as relating to eating behaviors, interference with daily activities, joint and muscle pain, and negative emotions brought on by hormone changes. This study suggests that the links between eating disorder and premenstrual symptoms extend past their individual effects on eating behavior and are indicative of a shared underlying mechanism.
Keywords: Network analysis, Eating disorders, Premenstrual symptoms
1. Introduction
Eating disorders (EDs) are serious mental health conditions with a lifetime prevalence of approximately 13.1% (Stice, Marti, & Rohde, 2013; Udo & Grilo, 2018). EDs are associated with high mortality (Chesney, Goodwin, & Fazel, 2014; Keshaviah et al., 2014), morbidity (Deter & Herzog, 1994; Herpertz-Dahlmann, 2009; Kessler et al., 2013), and relapse (Schaumberg et al., 2017). Although etiology is not fully understood, ED symptomatology has been shown to fluctuate in a predictable manner across the menstrual cycle and show specific associations with ovarian hormones (e.g., estrogens) (Baker, Girdler, & Bulik, 2012; Racine et al., 2012). Binge-type EDs (i.e., bulimia nervosa and binge-eating disorder) specifically, are also commonly comorbid with premenstrual dysphoric disorder (PMDD; Nobles et al., 2016) and show significant associations with premenstrual symptoms (PMS) (e.g., appetite changes, depressed mood, and fatigue; Hardin, Thornton, Munn-Chernoff, & Baker, 2019). Despite the significant associations observed between various aspects of menstrual cycle changes and ED symptoms, the specific symptoms underlying this association are unclear. To further understand the association between EDs and menstrual cycle changes, we examined the association between specific ED symptoms and specific PMS using network analysis.
There has been recent interest in the psychological literature in clarifying the association between EDs and comorbidities through a network analysis framework (Levinson, Vanzhula, Brosof, & Forbush, 2018). Network analysis is a statistical method arising from network theory, a theory which conceptualizes psychopathology as a network of interconnected nodes (symptoms) and edges (associations between symptoms) (Borsboom, 2017). Network analysis can elucidate which symptoms within a specific disorder most influence the rest of the network (central symptoms) and, thus, not only improve our understanding of etiology, but has potential for identifying effective treatment targets. When applied to comorbidity, network analysis directly examines how specific symptoms of one network of symptoms (e.g., PMS) may contribute to the symptoms of another network (e.g., EDs). This provides insight into the specific symptoms that may serve to maintain comorbidity and the pathway (bridge symptoms) that connects symptoms from one condition to another. For example, one study found that difficulty drinking beverages and eating in public served as bridge symptoms between EDs and social anxiety disorder (Levinson et al., 2018).
A significant yet understudied ED comorbidity is PMDD. PMDD is the experience of chronic and debilitating PMS, which leads to impairment in social and occupational activities (Lanza di Scalea & Pearlstein, 2019). Among those diagnosed with bulimia nervosa, prevalence of PMDD is 17.4% and among those diagnosed with binge-eating disorder, prevalence is 10.7% (Nobles et al., 2016), which is higher than the general population prevalence of PMDD which ranges from 3 to 8% (Halbreich, Borenstein, Pearlstein, & Kahn, 2003). The reverse is also true: women with PMDD are seven times more likely to have comorbid bulimia nervosa and two times more likely to have comorbid binge-eating disorder (Nobles et al., 2016). Binge eating may be elevated in those with PMDD given the negative influence of PMDD on appetite for calorie-dense foods (Ko et al., 2015), which could propagate binge-eating behavior.
Indeed, we have previously shown using a stepwise regression model that PMS, defined from the 11 symptom domains of PMDD, are differentially associated with ED symptomology (Hardin et al., 2019). The majority of PMDD domains (e.g., depressed mood, anxiety, and fatigue) were associated with binge eating, body dissatisfaction, and restriction (Hardin et al., 2019), yet differences across symptoms emerged. Body dissatisfaction was most strongly associated with PMS appetite changes and depressed mood; binge eating with PMS appetite changes and concentration problems; restriction with PMS anxiety, feeling overwhelmed, and difficulties with sleep; and purging with PMS feeling overwhelmed and depressed mood (Hardin et al., 2019). However, given this previous study focused on cumulative PMDD and ED symptom domains, it is still unclear which specific symptom-type may be facilitating comorbidity.
Taken together, the aim of the current study was to extend our previous research by investigating which specific ED and PMS symptoms may confer the most risk and maintain ED and PMS symptom comorbidity using network analysis framework. Using the network analysis statistical model will provide insight into the pathway that connects PMS and ED symptoms. Secondarily, the network structure of PMS have not yet been examined. This paper will also provide important information on the interconnections between various symptoms of PMS, which comprise a PMDD diagnosis. As the focus of the paper was to investigate the network structure of PMS and the bridge network between PMS and ED symptoms, which have been limitedly examined in the literature, we did not make any specific a priori hypotheses.
2. Methods
2.1. Participants
Participants (n=666) were self-reported biological females at least 18 years of age from an American southeastern university who answered online questionnaires as part of a research study examining emotional health and the menstrual cycle in biological females. Participants completed informed consent prior to completing the online survey and received course credit for participating in the study. The Univeristy of North Carolina Biomedical Institutional Review Board (IRB #19–0557) approved the study.
2.2. Measures
2.2.1. Eating Disorder Symptoms
The Eating Pathology Symptoms Inventory (EPSI; Forbush et al., 2013) is a 5-point likert-scale self-report survey which was used to examine ED-related behaviors and cognitive patterns over the past 4 weeks. Forty items, which correspond to seven subscales, were included in the network analysis: (1) body dissatisfaction (i.e., dissatisfaction with one’s body shape or weight), (2) binge eating (i.e., eating an objectively large amount of food and loss of control over eating), (3) cognitive restraint (i.e., intentional avoidance of food, in particular calorie dense or “unhealthy” foods), (4) purging behaviors (i.e., compensatory behaviors such as vomiting or laxative use, to manage weight or shape), (5) excessive exercise (i.e., feeling compelled to exercise and/or exercising to the point of exhaustion), (6) restricting (i.e., eating unusually small amounts of food and/or skipping meals), (7) muscle building (i.e., desiring more muscular body shape and/or composition). Although we do not use subscale scores here, the EPSI subscales have demonstrated strong reliability and stability in community samples and in college samples specifically (Coniglio et al., 2018; Forbush, Wildes, & Hunt, 2014; Forbush et al., 2013). Specific items from the EPSI used in the network analysis were selected to facilitate comparison between the results of the current study and previous studies. If a different set of items were used, we would not be able to directly compare results as any differences observed could be due to item selection differences.
2.2.2. Premenstrual Symptoms
The Daily Record of Severity of Problems (DRSP; Endicott, Nee, & Harrison, 2006) is a 6-point likert-scale which was used to examine PMS (Table 1). The DRSP includes 24 items that query 11 specific domains of PMDD and an item measuring severity of symptoms as outlined in the DSM-IV (American Psychiatric Association, 2000): (1) depressed mood; (2) anxiety (i.e., feelings of tension or being on edge); (3) affective lability (i.e., feeling abruptly sad or having an increased sensitivity to rejection); (4) anger; (5) decreased interest in usual activities; (6) concentration problems; (7) fatigue; (8) appetite change (i.e., food cravings, overeating, or appetite change); (9) sleep problems (i.e., hypersomnia/insomnia); (10) feeling overwhelmed; and (11) physical symptoms (e.g., breast tenderness, headaches, bloating); and (12) how such symptoms interfere with daily activities. The DRSP has demonstrated strong reliability and stability (Endicott et al., 2006). It is intended for daily use; in the current cross-sectional study, the instructions were modified to ask participants to report the experience of PMS in the week prior to the onset of their menses (Hardin et al., 2019). Because this is the first study we are aware of examining PMS from a network analysis perspective, we included all DRSP items in the analysis.
Table 1.
Abbreviations Used for EPSI and DRSP Items in Network Models
| EPSI | |
|---|---|
| Abbreviation | Item |
| Clothes | 1. I did not like how clothes fit the shape of my body |
| Unhealthy | 2. I tried to exclude “unhealthy” foods from my diet |
| Not_hungry | 3. I ate when I was not hungry |
| Notmuch | 4. People told me that I do not eat very much |
| Ex_everyday | 5. I felt that I needed to exercise nearly every day |
| Surprise | 6. People would be surprised if they knew how little I ate |
| Suppl_use | 7. I used muscle building supplements |
| Ex_hard | 8. I pushed myself extremely hard when I exercised |
| Snack | 9. I snacked throughout the evening without realizing it |
| Full_easy | 10. I got full more easily than most people |
| Diur_consider | 11. I considered taking diuretics to lose weight |
| Outfit | 12. I tried on different outfits, because I did not like how I looked |
| Laxative | 13. I thought laxatives are a good way to lose weight |
| Steroids | 15. I thought about taking steroids as a way to get more muscular |
| Diet_tea | 16. I used diet teas or cleansing teas to lose weight |
| Diet_pills | 17. I used diet pills |
| Body | 18. I did not like how my body looked |
| Uncomf_full | 19. I ate until I was uncomfortably full |
| Cal_count | 21. I counted the calories of foods I ate |
| Ex_plan | 22. I planned my days around exercising |
| Butt | 23. I thought my butt was too big |
| Thighs | 24. I did not like the size of my thighs |
| Shape | 25. I wished the shape of my body was different |
| Vomit | 27. I made myself vomit in order to lose weight |
| Notice | 28. I did not notice how much I ate until after I had finished eating |
| Suppl_consider | 29. I considered taking a muscle building supplement |
| Ex_strenuous | 31. I engaged in strenuous exercise at least five days per week |
| Muscle | 32. I thought my muscles were too small |
| Full_small | 33. I got full after eating what most people would consider a small amount of food |
| Hips | 34. I was not satisfied with the size of my hips |
| Suppl_used_p | 35. I used protein supplements |
| Eatmore | 36. People encouraged me to eat more |
| Offer_food | 37. If someone offered me food, I felt that I could not resist eating it |
| Stuffed | 39. I stuffed myself with food to the point of feeling sick |
| Cal_avoid | 40. I tried to avoid foods with high calorie content |
| Ex_exhaust | 41. I exercised to the point of exhaustion |
| Diur_use | 42. I used diuretics in order to lose weight |
| Skip | 43. I skipped two meals in a row |
| Auto_pilot | 44. I ate as if I was on auto-pilot |
| Ate_large | 45. I ate a very large amount of food in a short period of time (e.g., within 2 hours) |
| DRSP | |
| Abbreviation | Item |
| Depress | 1a. Felt depressed, sad, “down,” or “blue” |
| Hopeless | 1b. Felt hopeless |
| Worthless | 1c. Felt worthless, or guilty |
| anxious | 2. Felt anxious, tense, “keyed up” or “on edge” |
| Moodswing | 3a. Had mood swings (e.g., suddenly felt sad or tearful) |
| Sensitive | 3b. Was more sensitive to rejection or my feelings were easily hurt |
| Angry | 4a. Felt angry, irritable |
| Conflict | 4b. Had conflicts or problems with people |
| Lessinterest | 5. Had less interest in usual activities (e.g., work, school, friends, hobbies) |
| Difficultconc | 6. Had difficulty concentrating |
| Tired | 7. Felt lethargic, tired, fatigued, or had a lack of energy |
| Overeat | 8a. Had increased appetite or overate |
| Craving | 8b. Had cravings for specific foods |
| Sleepmore | 9a. Slept more, took naps, found it hard to get up when intended |
| Troublesleep | 9b. Had trouble getting to sleep or staying asleep |
| Overwhelm | 10a. Felt overwhelmed or that I could not cope |
| Outofcontrol | 10b. Felt out of control |
| Breasttender | 11a. Had breast tenderness |
| Breastswell | 11b. Had breast swelling, felt “bloated”, or had weight gain |
| Headache | 11c. Had headache |
| Jointmuscle | 11d. Had joint or muscle pain |
| Inefficiency | At work, at school, at home, or in daily routine, at least one of the problems noted above caused reduction of productivity or inefficiency |
| Hobby | At least one of the problems noted above interfered with hobbies or social activities (e.g., avoid or do less) |
| Relationship | At least one of the problems noted above interfered with relationships with others |
2.3. Network Analyses
We completed a series of psychological network models to establish associations among 40 EPSI items and 24 DRSP items. R (Version 4.0.0; R Core Team, 2020) and R Studio (Version 1.3.959; RStudio Team, 2020) were used to construct these networks based on a publicly available network analysis R script (Levinson et al., 2018). We built three separate network models: (1) EPSI, (2) DRSP, and (3) bridges between the EPSI and DRSP. Similar to our previous study (Hardin et al., 2019), because the DRSP contains a specific item about overeating, which is also assessed by the EPSI, we ran a secondary bridge network (network 4) without the DRSP overeating item to investigate whether the network bridges changed with the removal of this overlapping item.
2.3.1. Network Graphs
We estimated networks with the EBICglasso function in the qgraph package to minimize network sizes by eliminating spurious correlations (Epskamp, Cramer, Waldorp, Schmittmann, & Borsboom, 2012). Specifically, the EBICglasso function computes partial correlation networks with each correlation accounting for all other items in the network. Within the networks, nodes represent EPSI or DRSP items and are shown as circles in network graphs. Network edges represent the partial correlations between items and are shown as lines connecting nodes in network graphs. Blue edges represent positive correlations whereas red edges represent negative correlations. Edge thickness indicates the strength of a correlation.
2.3.2. Network Centrality
The qgraph package in R (Epskamp et al., 2012) was used to calculate network centralities. Network centrality measures how likely activation of a certain symptom will be followed by activation of other symptoms that comprise the network (McNally, 2016). Similar to prior studies (Christian et al., 2020; Vanzhula, Calebs, Fewell, & Levinson, 2019) and following recommendations (McNally, 2016; Newman, 2010; Opsahl, Agneessens, & Skvoretz, 2010), we use strength centrality to estimate the importance of each network node. Strength is calculated as the sum of absolute weights of all edges connected to a target node. Using the package bootnet (Epskamp, Borsboom, & Fried, 2018), we also performed centrality difference tests to determine if the central nodes had significantly different strength centralities from other nodes. This analysis determines if the central nodes are significantly more central than others.
2.3.3. Network Stability
Stability of strength centrality was examined as a measure of network accuracy. Stability indicates the proportion of data that can be dropped to retain a correlation of 0.7 between the network with reduced data and the network with full data (Epskamp et al., 2018). A minimum stability of 0.25 is recommended to interpret networks (Epskamp & Fried, 2018).
2.3.4. Network Bridges and Comorbidity
For network 3 (and network 4), which examined bridges between ED symptoms and PMS, we analyzed bridges connecting these communities (i.e., EPSI and DRSP). Bridges are nodes from one community (i.e., EPSI) which are highly connected to nodes in another community (i.e., DRSP). Using the networktools package, we estimated bridge strength as an indicator of each bridge’s statistical importance (Jones & Jones, 2018). Bridge strength is calculated as the sum of absolute edge weights from one node to all nodes not in the same community. Some previous studies of psychological comorbidity networks have used visual inspection on bridge strength plots to identify important bridges (Forrest, Sarfan, Ortiz, Brown, & Smith, 2019; Levinson et al., 2017; Vanzhula et al., 2019). However, more recently (Jones et al., 2019) it is recommended to use an 80% cutoff: retaining only the top 20% bridges with the strongest centrality. Here, potential bridges were first assessed through visual inspection of the network graphs, and then the statistical importance of the bridges between the EPSI and DRSP were determined by strength centrality.
3. Results
3.1. Participant Characteristics
Participants were self-reported biological females (N=666) with a mean age of 18.7 (SD = 1.1). The majority of participants were Caucasian (67%, N=446), followed by Asian (13%, N=85), African American (12%, N=77), Mixed Race (5%, N=30), Other (4%, N=27), and Pacific Islander (<1%, N=1). The majority (91%, N=607) of the sample self-reported being non-Hispanic. In general, the demographics of the current sample match the university at the time of assessment. Confirming our previous study, a majority of the DRSP dimension scores were significantly correlated with the EPSI subscale scores (Table 2). Mean subscale scores for EPSI and DRSP subscales are reported in Table 3.
Table 2.
Pearson Correlation Analysis Between EPSI Subscales and DRSP Subscales
| BD | BE | Cognitive Constraint | Purging | Restrict | Exercise | Muscle | |
|---|---|---|---|---|---|---|---|
| Depression | 0.3 | 0.3 | 0.2 | 0.3 | 0.3 | 0.1 | 0.2 |
| Anxiety | 0.3 | 0.2 | 0.2 | 0.2 | 0.3 | 0.1 | 0.1 |
| Affective Lability | 0.3 | 0.3 | 0.2 | 0.2 | 0.2 | 0.1 | 0.1 |
| Interest | 0.2 | 0.2 | 0.1 | 0.2 | 0.3 | 0.0 | 0.1 |
| Concentrate | 0.2 | 0.2 | 0.1 | 0.2 | 0.2 | 0.1 | 0.1 |
| Appetite | 0.3 | 0.4 | 0.2 | 0.2 | 0.1 | 0.2 | 0.1 |
| Anger | 0.2 | 0.2 | 0.1 | 0.2 | 0.3 | 0.1 | 0.1 |
| Insomnia | 0.3 | 0.3 | 0.2 | 0.2 | 0.3 | 0.1 | 0.1 |
| Overwhelm | 0.2 | 0.3 | 0.2 | 0.3 | 0.3 | 0.2 | 0.2 |
| Physical | 0.3 | 0.2 | 0.2 | 0.3 | 0.3 | 0.2 | 0.1 |
| Inefficiency | 0.3 | 0.3 | 0.1 | 0.2 | 0.3 | 0.1 | 0.1 |
| Relationship | 0.2 | 0.3 | 0.2 | 0.3 | 0.3 | 0.1 | 0.2 |
| Hobby | 0.3 | 0.3 | 0.2 | 0.3 | 0.3 | 0.2 | 0.2 |
Bolded: p < .05
Table 3.
EPSI and DRSP Mean Subscale Scores
| EPSI (N = 658) | Mean | SD | |
|---|---|---|---|
| Body Dissatisfaciton | 12.43 | 6.89 | |
| Binge Eating | 5.17 | 3.44 | |
| Cognitive Restraint | 3.36 | 2.04 | |
| Purging | 1.1 | 2.67 | |
| Restricting | 4.95 | 4.94 | |
| Excessive Exercise | 4.68 | 4.51 | |
| Muscle Building | 1.74 | 2.72 | |
| DRSP (N = 663) | |||
| Affective Liability | 6.82 | 2.58 | |
| Irritability/ Anger or Interpersonal Conflicts | 5.79 | 2.4 | |
| Depressed Mood/Hopelessness | 7.73 | 3.71 | |
| Anxiety/ Tension | 3.11 | 1.44 | |
| Decreased Interest in Usual Activities | 2.53 | 1.35 | |
| Difficulty Concentrating | 2.37 | 1.36 | |
| Lethargy/ Fatigue | 3.25 | 1.48 | |
| Appetite Changes | 5.97 | 2.77 | |
| Hypersomnia/Insomnia | 5.22 | 2.57 | |
| Overwhelmed/ Out of Control | 4.24 | 2.61 | |
| Physical Symptoms | 7.9 | 3.66 |
3.2. Network Analyses
EPSI and DRSP network abbreviations are provided in Table 1.
3.2.1. EPSI network
After removing participants missing all the EPSI items (i.e., participants who did not complete the survey), N=660 females remained for the EPSI network. Visually inspecting the EPSI network showed what appears to be 7 clusters: (1) 7 body dissatisfaction subscale items, (2) 6 restricting subscale items, (3) 8 binge eating subscale, (4) 5 excessive exercise subscale items, (5) 3 cognitive constraint subscale items, (6) 6 purging subscale items plus 1 muscle building item on thinking about steroids (node steroids), and (7) 3 muscle building items (Figure 1). The item thinking about muscles being too small did not fit into any of the visual clusters. As indicated by edge thickness, there were strong positive correlations among items within the same subscale.
Figure 1.
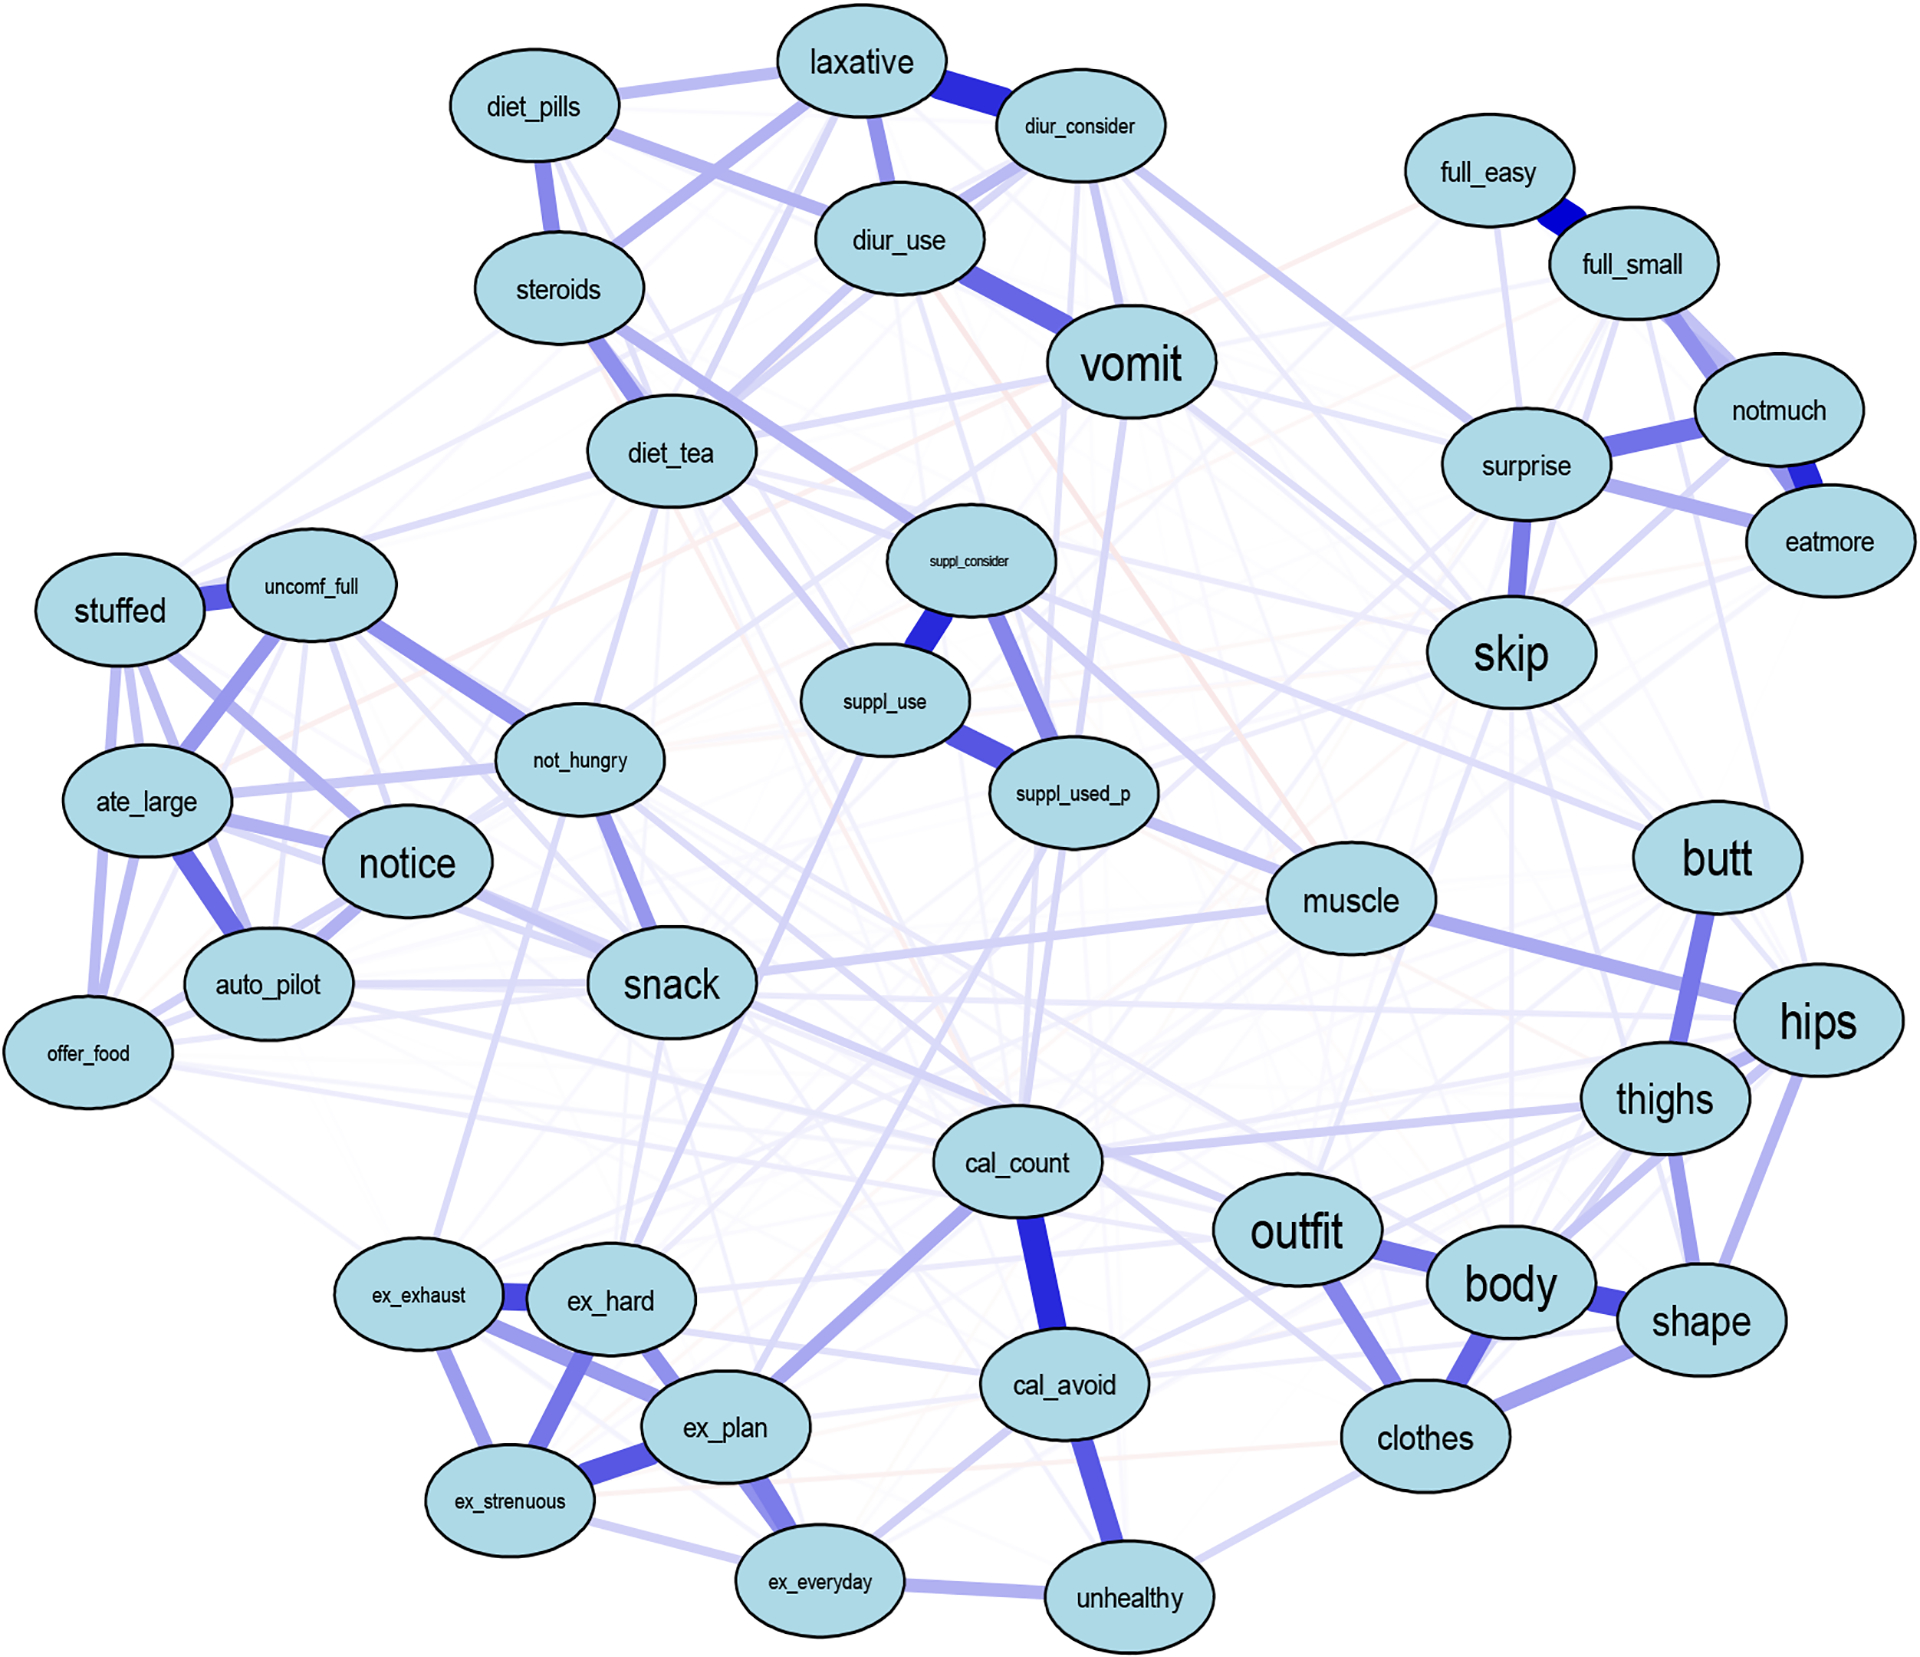
EPSI Eating Disorder Symptom Network
Note. Abbreviations of nodes available in Table 1.
We obtained central EPSI items by strength (Figure 2), which were similar to previous studies (Forbush et al., 2016; Christian et al., 2020). Items with highest strength centrality included disliking how one’s own body looked (node body, S=2.18), counting the calories of food being eaten (node cal_count, S=1.33), eating a large amount of food in a small amount of time (node ate_large, S=1.03), and pushing oneself extremely hard when exercising (node ex_hard, S=0.98). These EPSI items were significantly more central than 95%,43%, 38%, and 39% of the other items with smaller strength centralities (p<0.05), respectively. Stability strength was 0.60, indicating that the EPSI network was interpretable.
Figure 2.
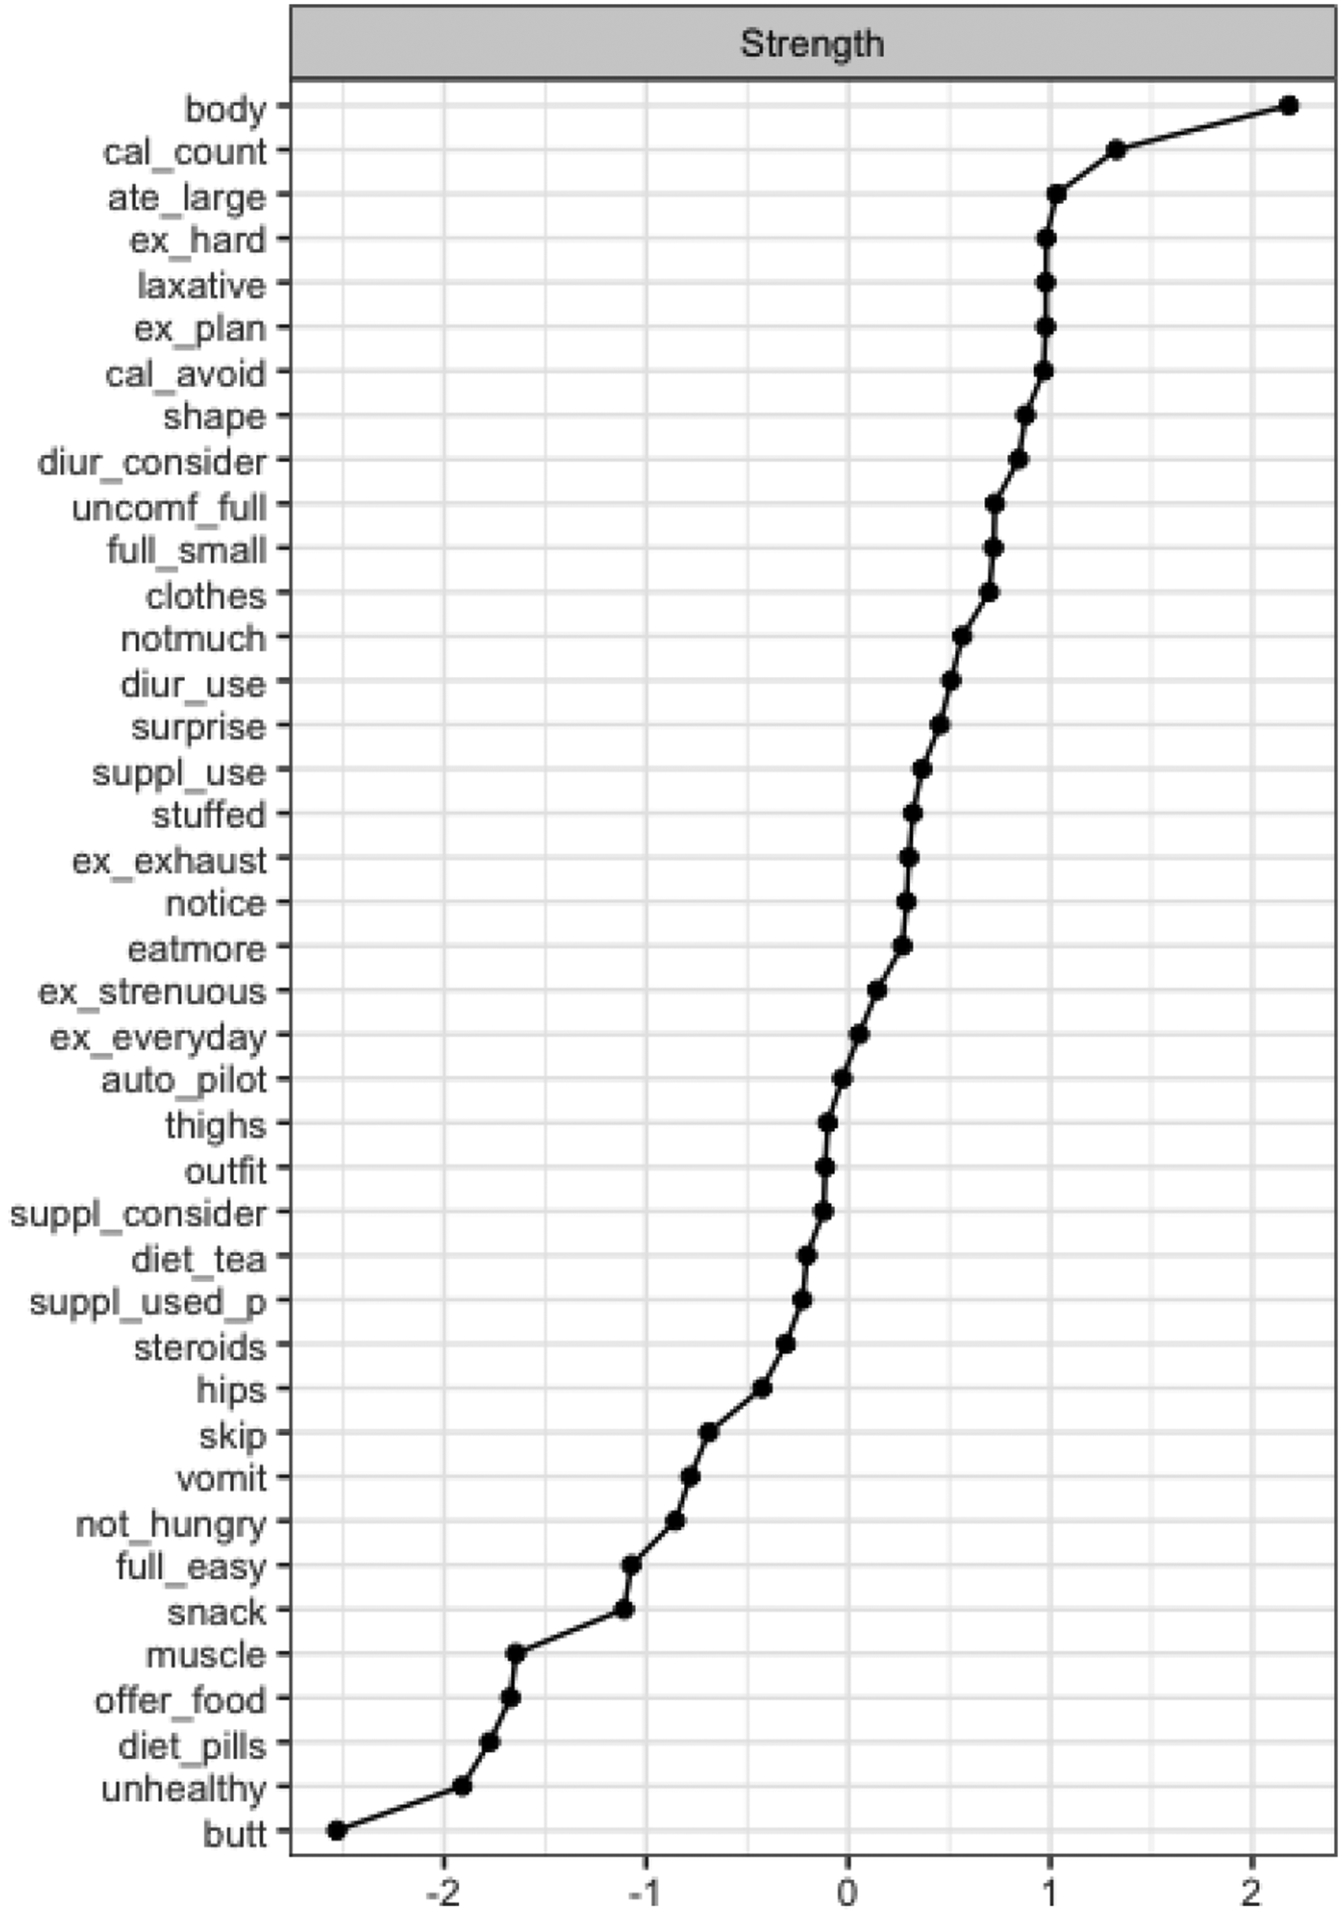
Strength Centrality of EPSI Network Items
Note. Items are sorted in a decreasing order by the respective centrality measure. Abbreviations used in the centrality graphs are available in Table 1.
3.2.2. DRSP network
After removing participants missing all the DRSP items (i.e., did not complete the questionnaire), n=663 females remained for the DRSP network. As shown in Figure 3, clusters in the DRSP network were not visually obvious, which could be due to the fact the DRSP does not have distinct subscales comprising multiple questions as does the EPSI, for example. Instead, the DRSP contains groupings of 1–3 items for each PMDD domain. However, as indicated by edge thickness, there were strong positive correlations between items of the same domain.
Figure 3.
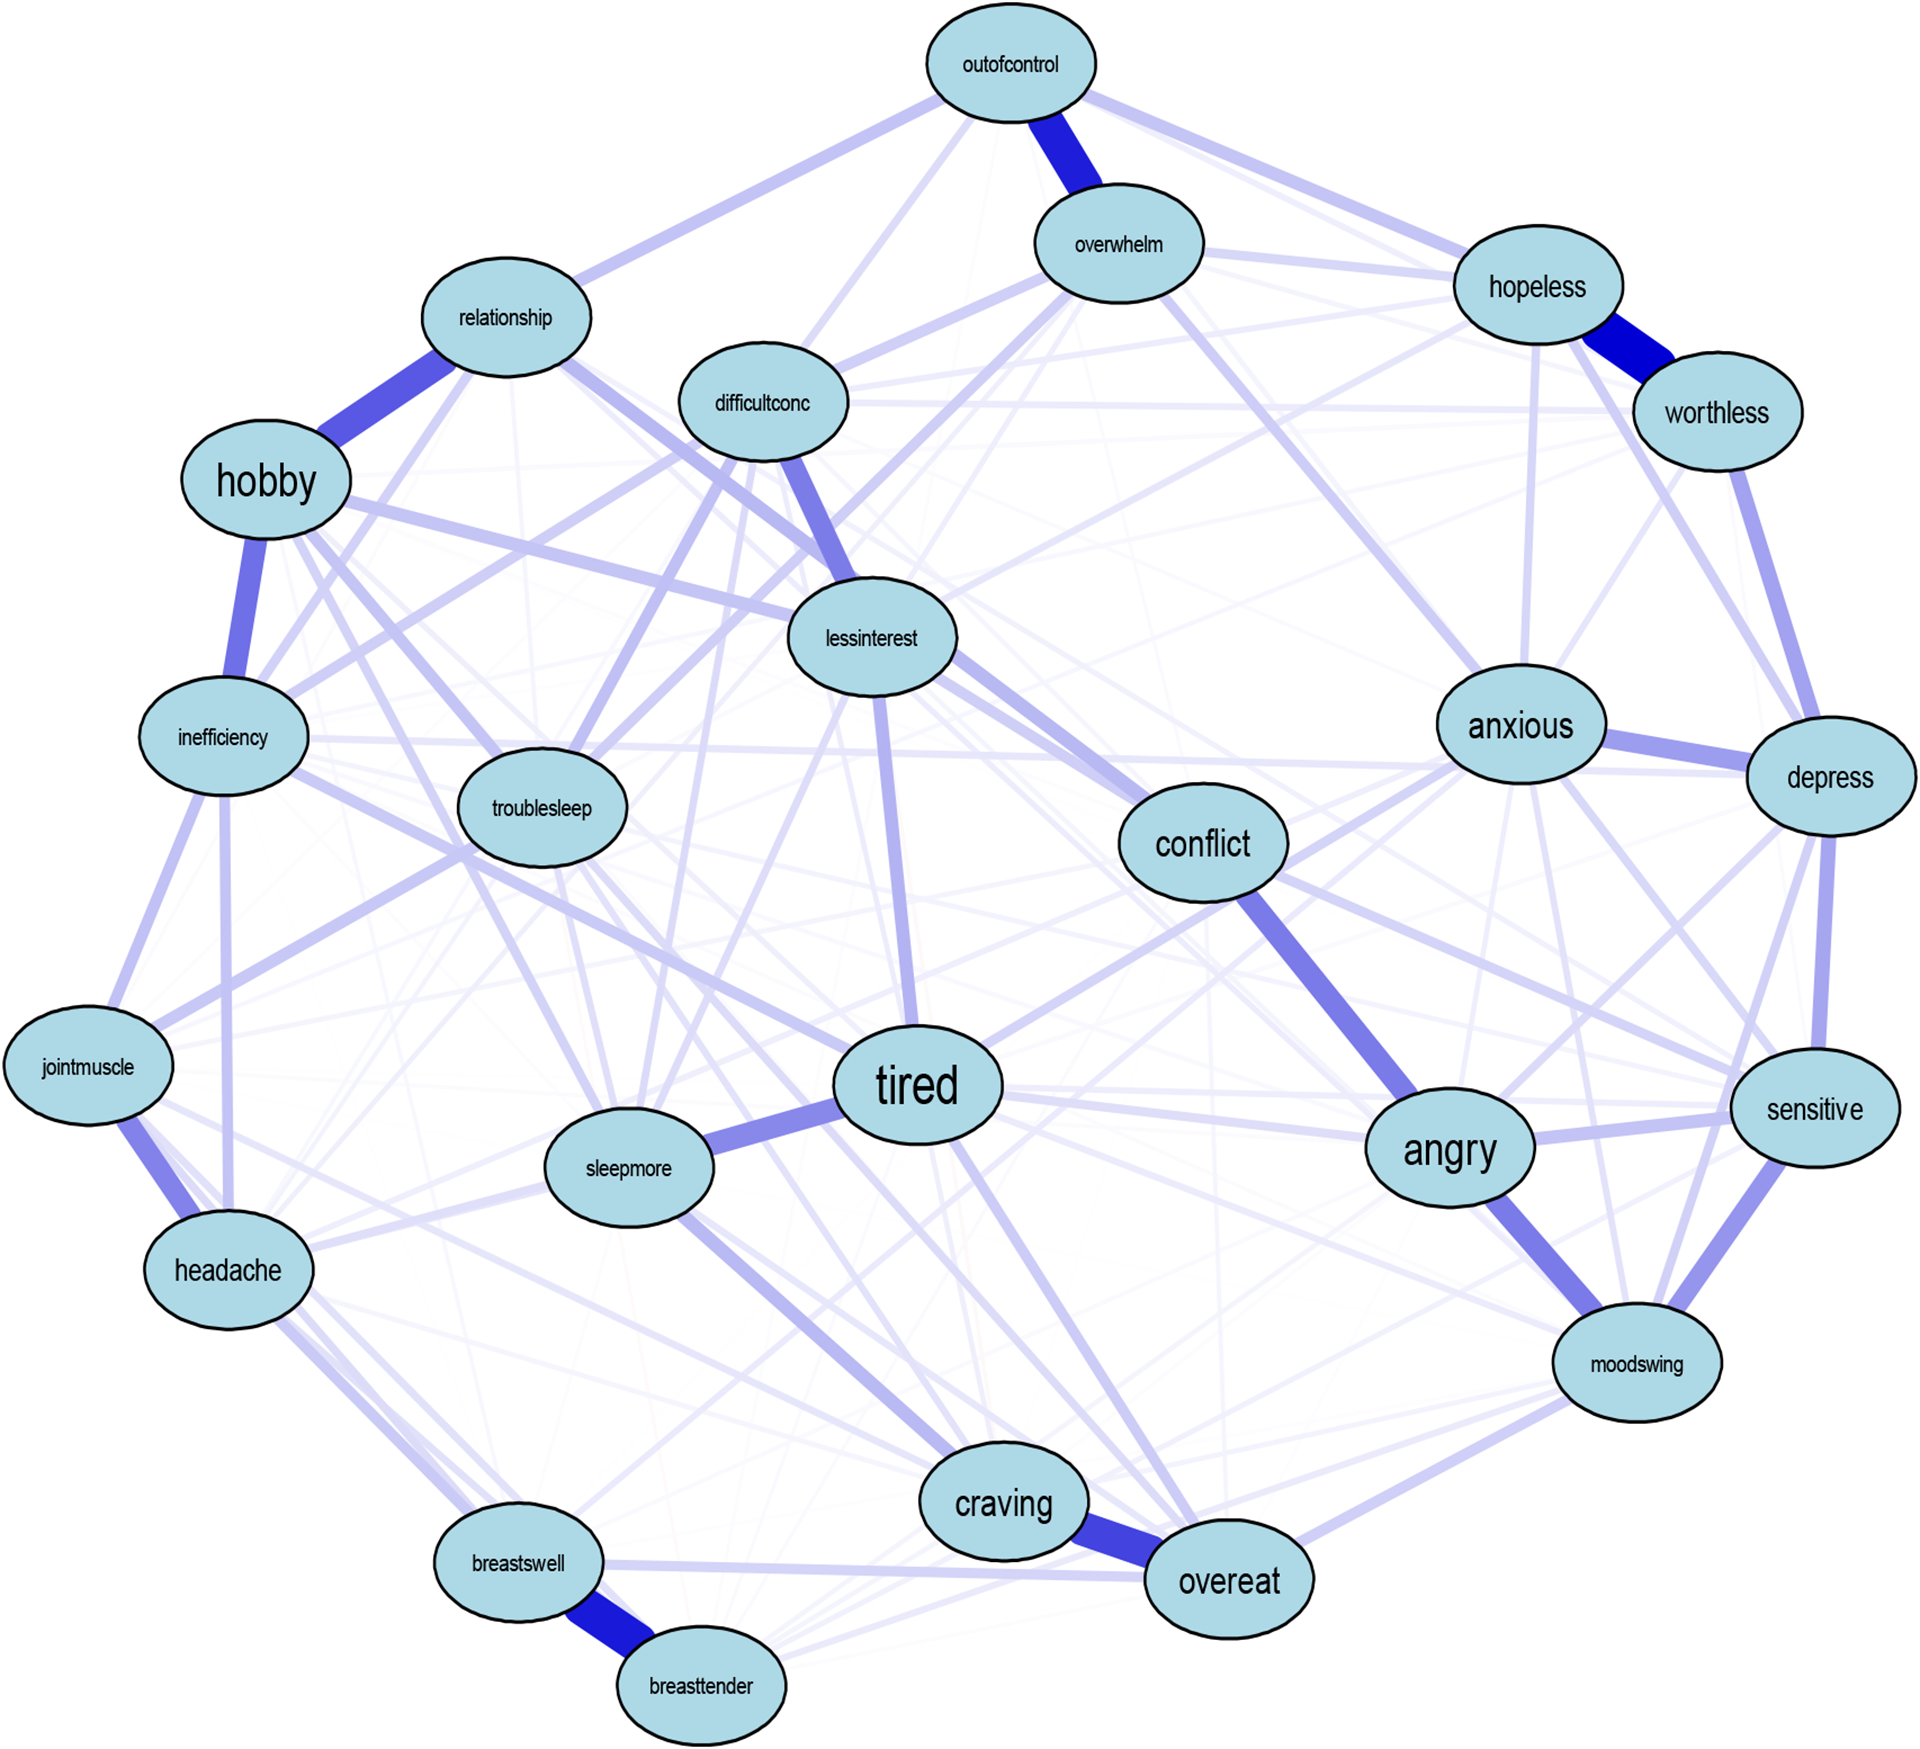
DRSP PMS Symptom Network
Note. Abbreviations of nodes can be found in Table 1
Central items included the extent to which PMS interfere with hobbies and social activities (node hobby, S=1.91), feeling lethargic, tired, fatigued, or had a lack of energy (node tired, S=1.83), feeling hopeless (node hopeless, S=1.43), and the extent to which PMS interfere with productivity at work, school, or home (node inefficiency, S=1.14) (Figure 4). These items were significantly more central than 61%, 60%, 58%, and 55% (p<0.05) of the other items with smaller strength centralities in the DRSP network, respectively. Stability strength was 0.60, indicating that the DRSP network was interpretable.
Figure 4.
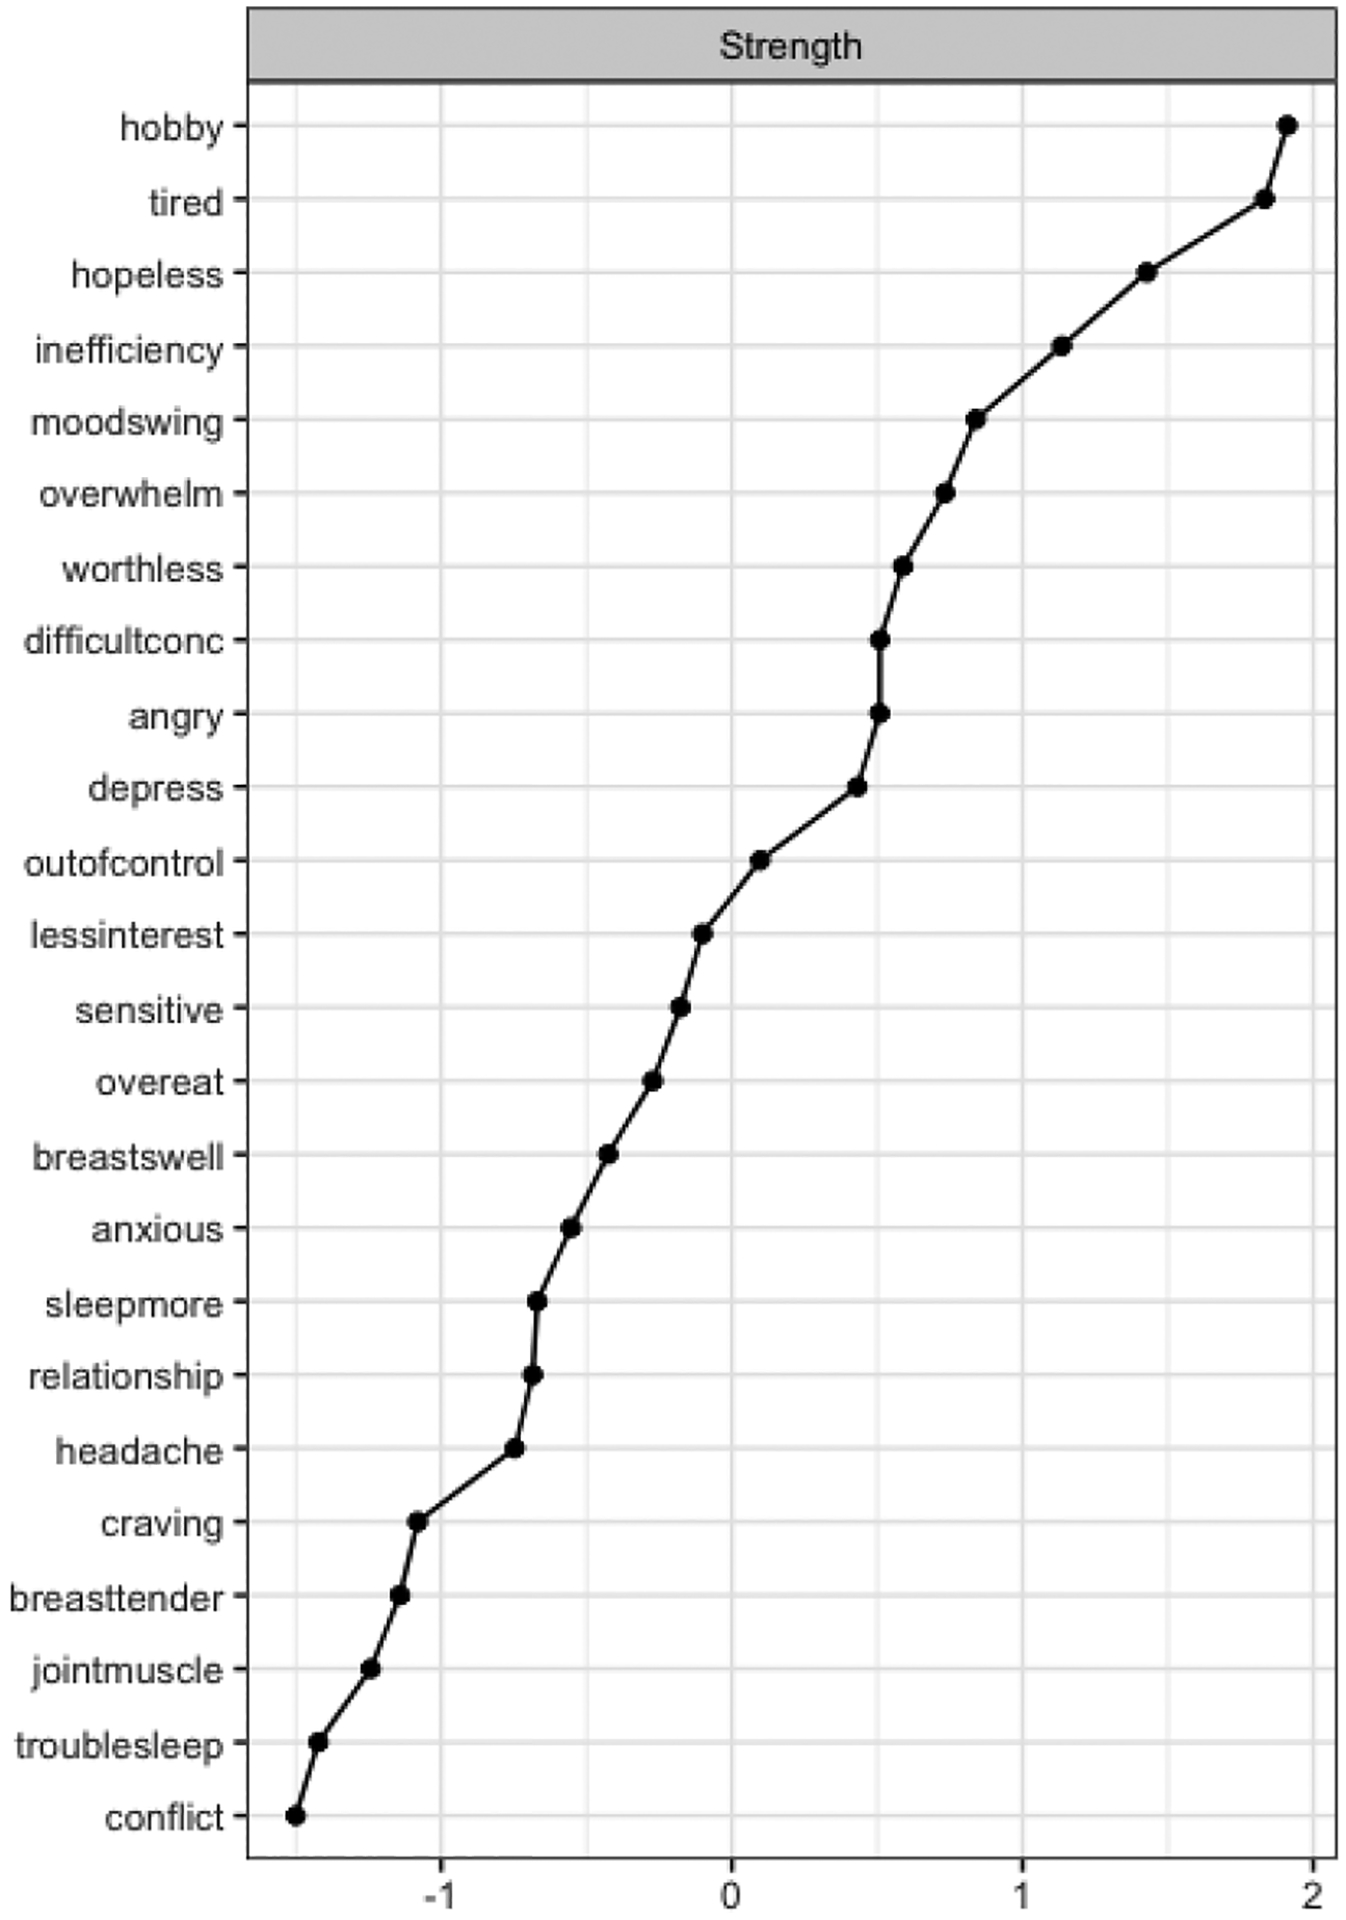
Strength Centrality of the DRSP Network
Note. Nodes are sorted in a decreasing order by the respective centrality measure. Abbreviations used in the centrality graphs are available in Table 1.
3.2.3. EPSI and DRSP
After removing participants completely missing for both the DRSP and the EPSI questionnaires, N=663 females remained for the network analysis. Visually inspecting the network with both the DRSP and EPSI items showed that snacking throughout the evening without realizing may be a potential bridge connecting the two communities; however, both communities were visually relatively distinct (Figure 5). As shown in Figure 6, using a 20% cutoff (Jones et al., 2019), 12 items can be identified as potential bridges. EPSI items with high bridge strengths included snacking throughout the evening without realizing (node snack, S=0.192), skipping two meals in a row (node skip, S=0.081), and making oneself vomit in order to lose weight (node vomit, S=0.079). DRSP items with high bridge strengths included overeating (node overeat, S=0.249), PMS interfering with hobbies or social activities (node hobby, S=0.093), having joint or muscle pains (hobby jointmuscle, S=0.099), feeling worthless or guilty (node worthless, S=0.084), and being sensitive to rejections or feelings easily getting hurt (node sensitive, S=0.083). The bridge network has an acceptable strength stability of 0.52.
Figure 5.
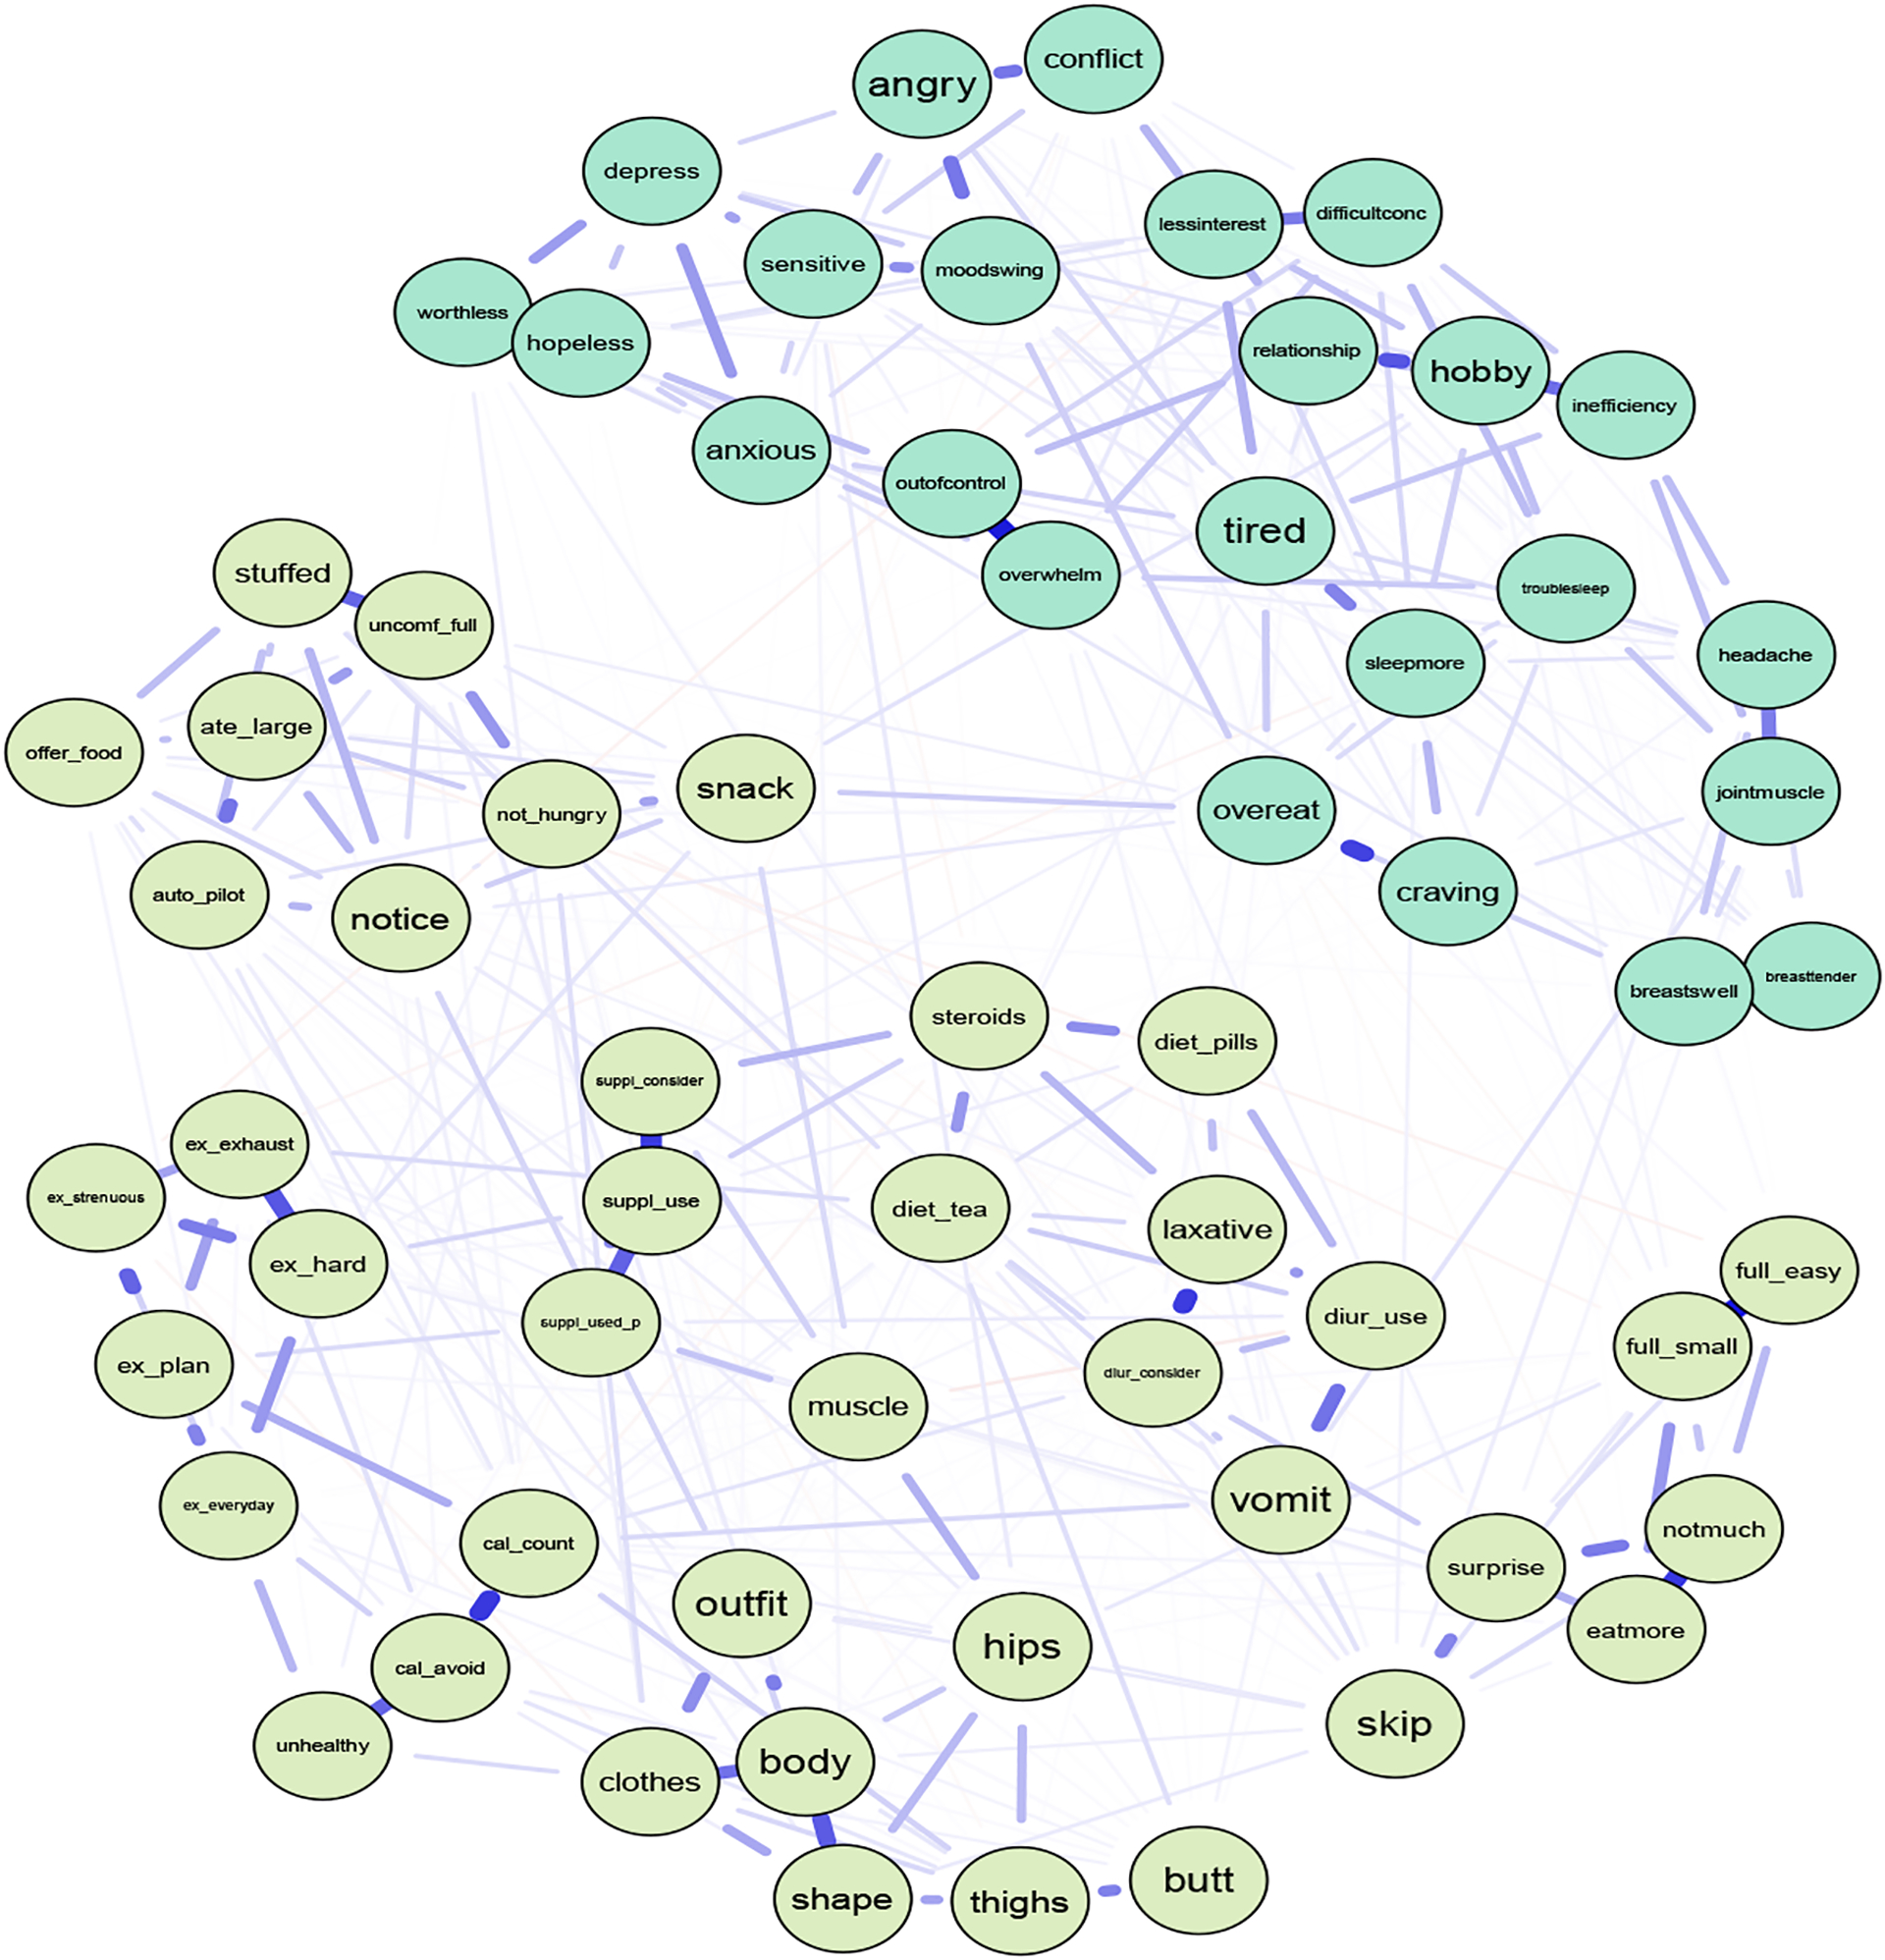
Network with EPSI Items and DRSP Items with DRSP Overeat Item
Note. Abbreviations of nodes available in Table 1. Light blue nodes represent DRSP items and light green nodes represent EPSI items.
Figure 6.
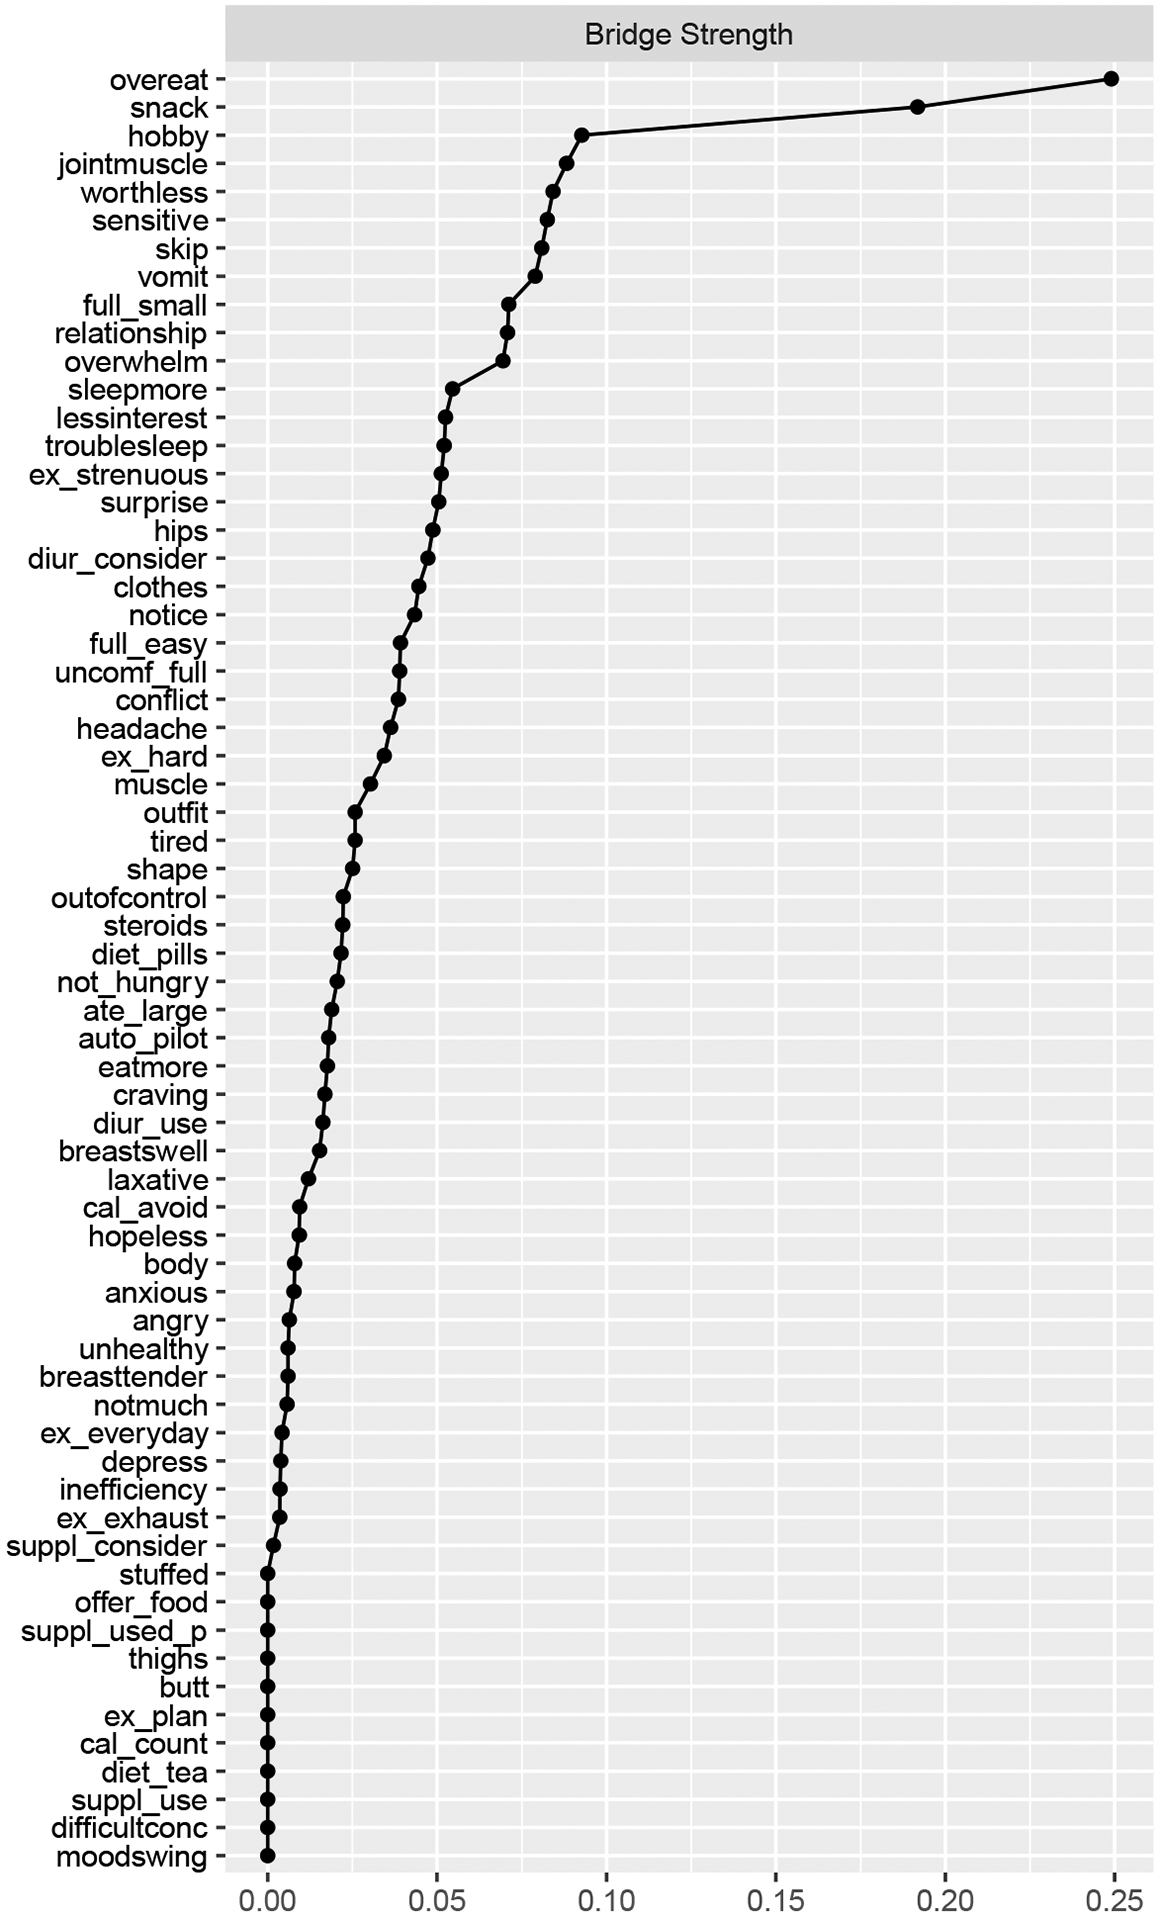
Bridge Strength Centrality EPSI and DRSP Items
Note. Nodes are sorted in a decreasing order by the respective centrality measure. Abbreviations used in the centrality graphs are available in Table 1.
Removing the DRSP overeating item (Figure 7) resulted in bridge strength changes for both the DRSP and EPSI. We again identified 12 bridges with the 20% cutoff (Figure 8, Jones et al., 2019). Top items in the EPSI remained the same with minor changes in the bridge strength centrality statistics, while removing the DRSP overeat item changed DRSP items that are more likely to be bridges. Subsequently, DRSP bridge items included having cravings for specific food (node craving, S=0.108), which was not an item with high bridge strength before. Removing the overeat item did not change the network strength stability.
Figure 7.
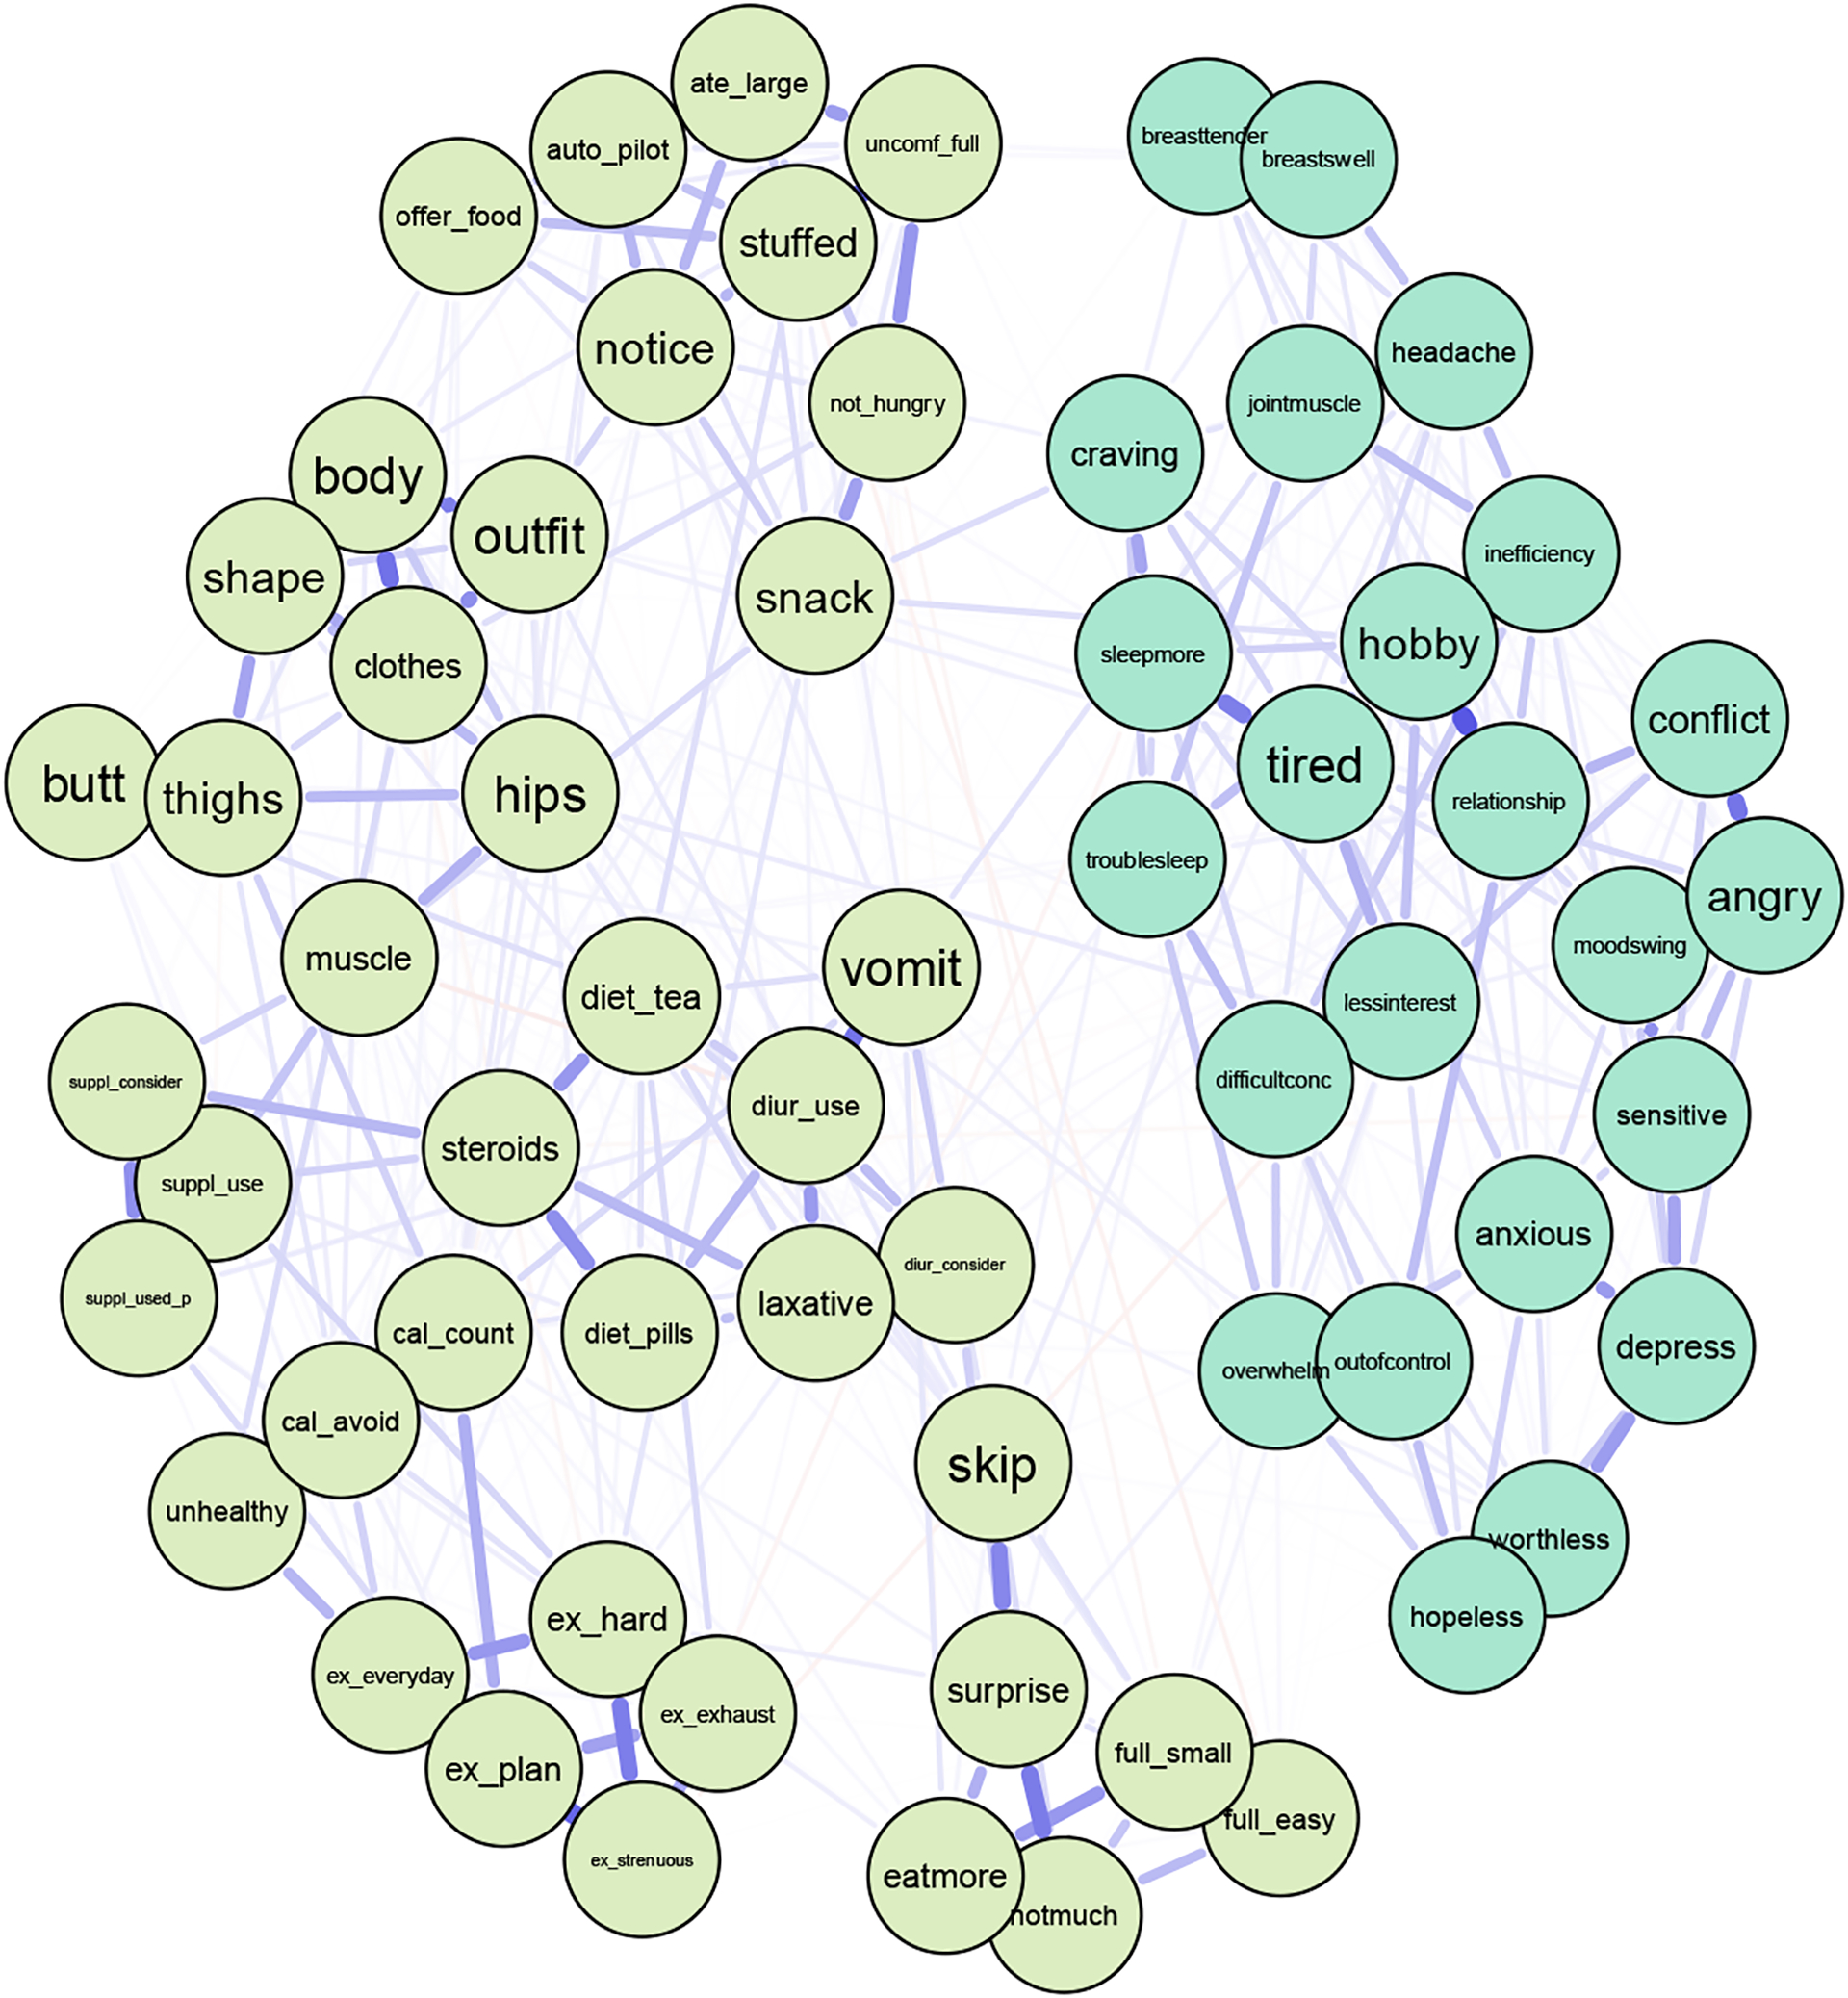
Network with EPSI Items and DRSP Items without DRSP Overeat Item
Note. Abbreviations of nodes can be found in Table 1. Light blue nodes represent DRSP items and light green nodes represent EPSI items.
Figure 8.
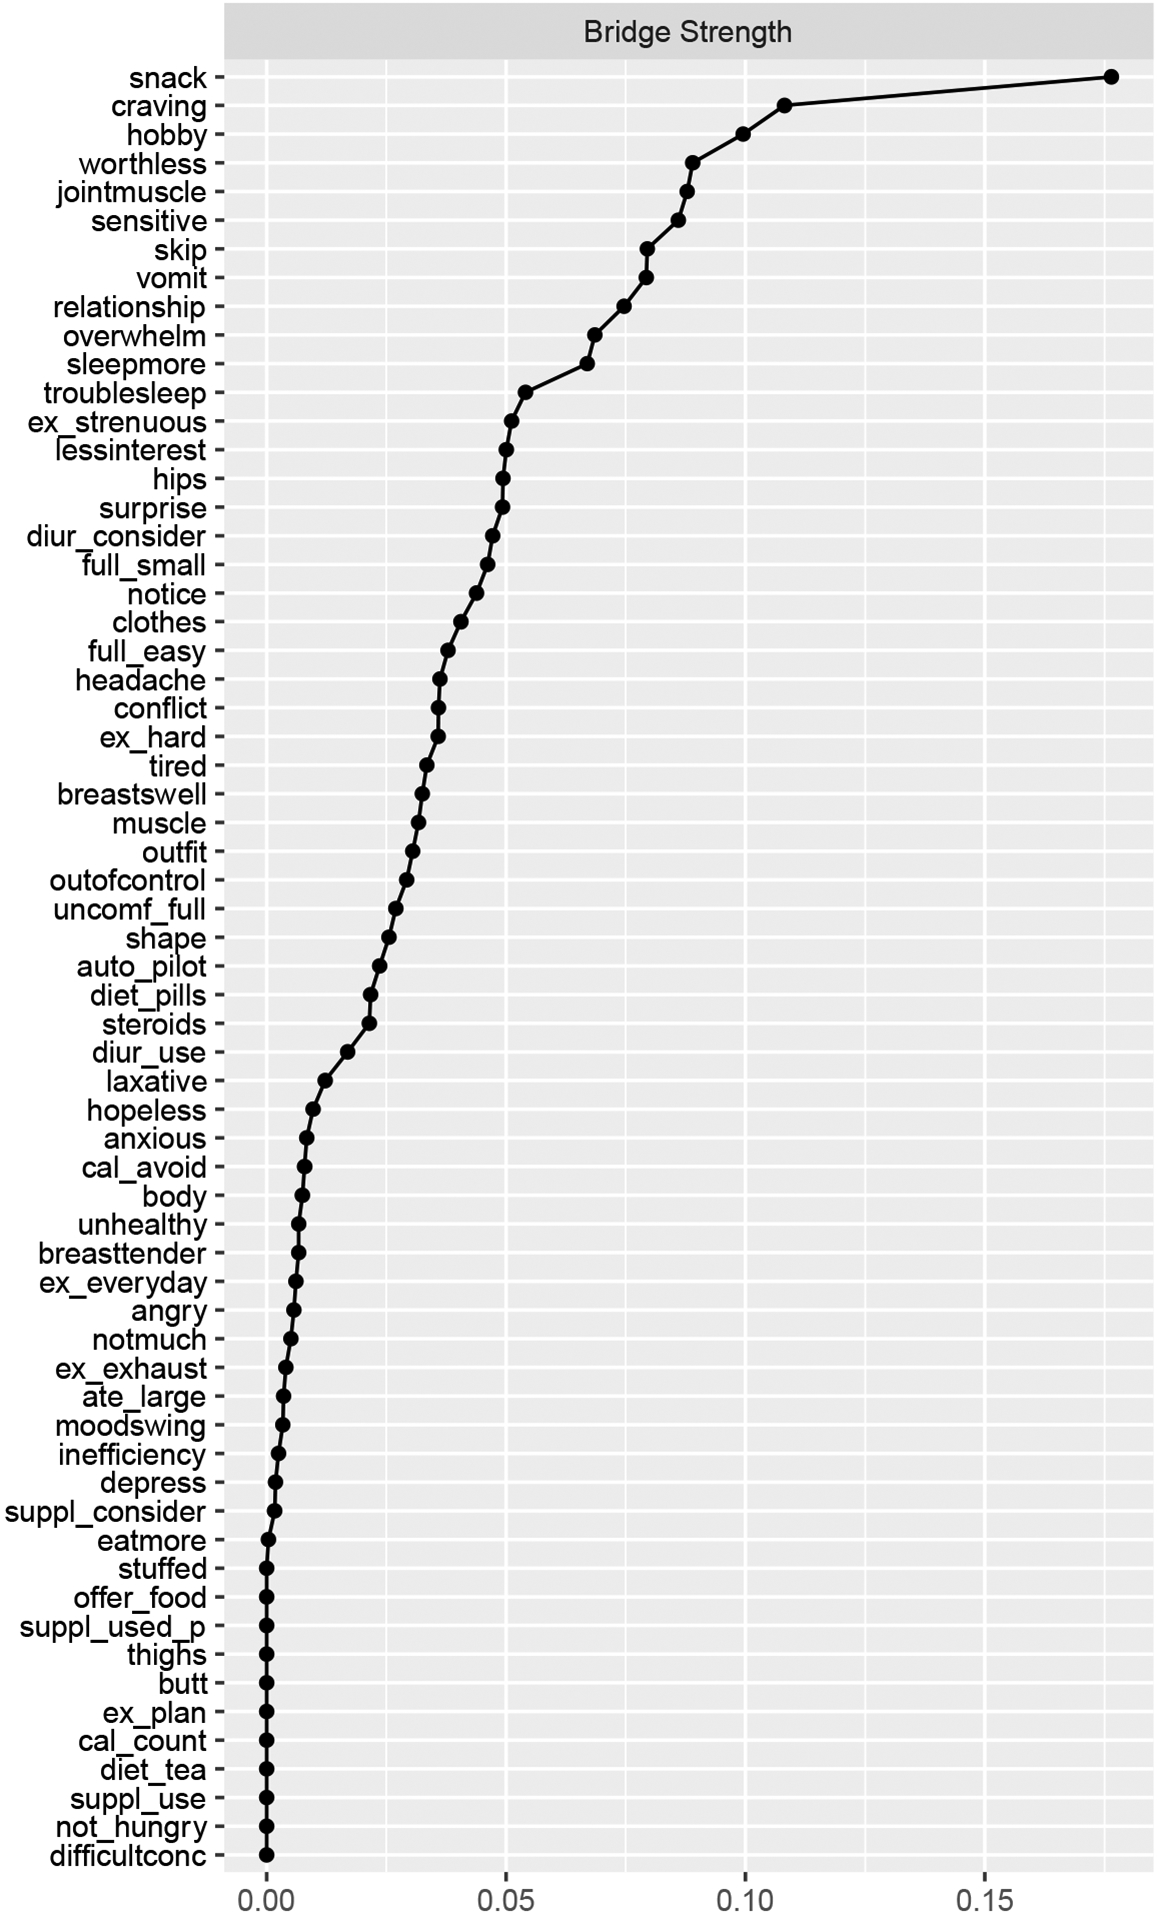
Bridge Strength Centrality of DRSP and EPSI Items After Removing the DRSP Overeat
Note. Nodes are sorted in a decreasing order by the respective centrality measure. Abbreviations used in the centrality graphs are available in Table 1.
4. Discussion
The current study aimed to identify bridge symptoms between ED symptoms and PMS in young adult women. This study was also the first to investigate the network structure of the domains that comprise a diagnosis of PMDD. Overall, we replicated previous networks observed for ED symptomatology, identified specific symptoms to be central to PMS, and defined symptoms between EDs and PMS that may facilitate comorbidity.
Central symptoms identified for ED symptomatology corroborate previous studies (Christian et al., 2020; Forbush, Siew, & Vitevitch, 2016). Similar to previous studies, these findings support that aspects of body dissatisfaction, binge-eating, and excessive exercising behaviors represent a core features of eating pathology and should be prioritized in diagnostic criteria and as treatment targets (DuBois, Rodgers, Franko, Eddy, & Thomas, 2017; Forbush et al., 2016; Levinson et al., 2017). However, unlike previous studies we found monitoring calories to be a central symptom in the EPSI network. Central symptoms identified for PMS via the DRSP suggest that interference with daily life and activities and negative emotions brought on by hormone changes represent core features of PMS/PMDD. This aligns with current PMDD diagnostic criteria that prioritizes and requires the presence of mood symptoms and clinically significant distress or interference for a diagnosis to be made (American Psychiatric Association, 2013). As PMS have been implicated as partly due to postovulatory changes in ovarian hormones (Yonkers & Simoni, 2018), our findings also suggest that symptoms most central to PMS may display a greater sensitivity to changing hormone levels compared with other PMS. Such symptoms should be prioritized in theoretical models and these core features may serve as important treatment targets for PMS interventions in young adult female populations.
When assessing pathways between the ED and PMS networks, ED and PMS bridge symptoms identified were generally related to eating behaviors (vs cognitions/thoughts, for example), interference with daily activities, joint and muscle pain, and negative emotions brought on by hormone changes. In the full EPSI/DRSP network, the strongest bridge symptom across both the EPSI and DRSP was the DRSP overeating item. After the removal of the overeating item on the DRSP, DRSP food cravings became the strongest bridge symptom across the EPSI/DRSP network. Importantly, EPSI bridge symptoms skipping meals and compensatory vomiting were present in both EPSI/DRSP networks. Generally, these findings align with previous research indicating that PMS and PMDD are associated with binge-eating and bulimic type EDs (Nobles et al., 2016) and may be indicative of a shared underlying mechanism contributing to both EDs and PMS. Changes in eating behavior as a bridge symptom between ED and PMS networks is generally expected as both EDs and PMS share this characteristic. Despite this, interference with daily activies, joint and muscle pain, and negative emotions associated with hormone changes were also found to bridge ED and PMS networks, which suggests that the links between EDs and PMS extend past their similar individual effects on eating behavior.
Both before and after the removal of the DRSP overeating item, DRSP items feelings of worthlessness, sensitivity to rejection, and joint and muscle pain were top bridge symptoms in both EPSI/DRSP networks. This demonstrates that PMS related to negative emotions and physical bodily discomfort brought on by hormone changes may serve as additional pathways between EDs and PMS, in addition to binge-eating, and facilitate comorbidity. Importantly, identification of bridge symptoms between ED and PMS networks elucidates symptoms most critical to target in the treatment of comorbid EDs and PMS.
There are limitations to the current study worth noting. First, the DRSP was used retrospectively and we did not define current menstrual cycle phase for each participant. Thus, DRSP symptoms could have been influenced by memory. Secondly, due to the window of DRSP symptom inquiry, we are unable to ascertain if symptoms were only onset premenstrually or were present prior to the premenstrual window assessed but exacerbated during this time. However, we would argue that both new onset or exacerbation of symptoms are important to capture as each would represent change in symptoms based on menstrual cycle phase. Additionally, the sample was comprised of college-aged women which may limit generalizability to the larger population; however, this population is of particular interest because of elevated prevalence to both EDs and PMS symptomology (Harrer et al., 2020; Steiner, Macdougall, & Brown, 2003). The current study did not exclude women on a hormone-based birth control. It is possible that women on birth control would be less likely to report cycle-driven hormone fluctuations and less PMS. However, requiring “regular” menstrual cycles may decrease the generalizability of the sample as estimates of irregular menstruation vary from 5–36% (Nohara, Momoeda, Kubota, & Nakabayashi, 2011; Sakai & Ohashi, 2013; Toffol, Koponen, Luoto, & Partonen, 2014; Zhou et al., 2010). Furthermore, the presence of regular cycles does not indicate the absence of PMS (Park, Shin, Jeon, Cho, & Kim, 2021). Rather than requiring a regular cycle or participants to be in a certain phase, we instructed participants to consider the phase of the cycle we are interested in. As we direct participants to report on the cycle phase that we are interested in for the current study, the regularity of their menses and the determination of participants cycle phase through medical means is not necessary to investigate their experience of PMS. In addition, previous literature has shown that being on birth control does not impact findings on the association between PMS and ED symptoms (Hardin et al., 2019) and is associated with elevated ED symptomology (Bird & Oinonen, 2011) which suggests a possible sensitivity to ovarian hormones is associated with ED symptoms. Finally, due to the cross-sectional nature of the current study, we are unable to make conclusions about causality. Future research should therefore investigate comorbidity between PMS and EDs by addressing these limitations via longitudinal studies in a more diverse sample to determine directionality of symptoms. Additionally, it will be important for future research to investigate sensitivity to changes in ovarian hormones as a possible shared underlying etiological factor to both EDs and PMS. For example, examining how fluctuations in ovarian hormones affect central ED symptoms at different phases of the menstrual cycle, in particular during the pre-menstrual phase when PMS onset. Hormonal change as a plausible mechanism underlying the associations between EDs and PMS, however, is speculative and future research should investigate such mechanisms.
Network analysis is a powerful statistical tool to investigate core features of psychopathology and can further our understanding of the transmechanistic etiological factors of PMS and EDs. The current study replicated previous findings of body dissatisfaction, binge-eating, and excessive exercise as a core symptoms of EDs while presenting new evidence that monitoring calories may be similarly core to EDs. Likewise, negative emotions brought on by hormone changes and interference with daily activities were core symptoms of PMS, which corroborates prioritization of mood and clinically significant distress PMDD diagnostic criteria. Bridge symptom findings suggest that high levels of DRSP bridge symptoms in an individual may elevate risk for ED symptomology (or vice versa given temporal ordering cannot be determined) and that symptoms of body dissatisfaction, negative emotions, and physical bodily discomfort brought on by hormone changes may be illness pathways, along with overeating, between EDs and PMS. Given PMS is caused in part by changes in ovarian hormones (Yonkers & Simoni, 2018) and there are associations between changes in ED symptomology and phases of the menstrual cycle (Baker, Girdler, & Bulik, 2012), sensitivity to fluctuations in ovarian hormones may represent a shared etiological factor between EDs and PMS. Findings advocate for treatment targets with a focus on body dissatisfaction, negative emotions and physical bodily discomfort brought on by hormone changes, and changes in eating behavior in comorbid EDs and PMS. Furthermore, given evidence for illness pathways between EDs and PMS, treatments that show benefit for PMDD may also benefit those with an ED.
Supplementary Material
Funding Sources
Time to analyze data and draft the manuscript was partially funded by the National Institute of Health R21MH121726 (PI: Baker).
Footnotes
Publisher's Disclaimer: This is a PDF file of an unedited manuscript that has been accepted for publication. As a service to our customers we are providing this early version of the manuscript. The manuscript will undergo copyediting, typesetting, and review of the resulting proof before it is published in its final form. Please note that during the production process errors may be discovered which could affect the content, and all legal disclaimers that apply to the journal pertain.
Ethics Statement
The authors assert that research was performed in accordance with the Declaration of Helsinki and was approved by the University of North Carolina Biomedical Institutional Review Board (UNC IRB# 19–0557). Participants gave informed consent before the study was performed.
Conflict of Interest Statement
The authors declare that they have no conflicts of interest to disclose.
Data Code and Avaliability Statement
Data will be provided upon reasonable request.
References
- American Psychiatric Association. (2013). Diagnostic and Statistical Manual of Mental Disorders (5th ed.). Arlington, VA. [Google Scholar]
- Association, A. P. (2000). Diagnostic and statistical manual of mental disorders (4th ed., Text Revision ed.). Washington, DC: American Psychiatric Press. [Google Scholar]
- Baker JH, Girdler SS, & Bulik CM (2012). The role of reproductive hormones in the development and maintenance of eating disorders. Expert Review of Obstetrics & Gynecology, 7, 573–583. [DOI] [PMC free article] [PubMed] [Google Scholar]
- Bird JL, & Oinonen KA (2011). Elevated eating disorder symptoms in women with a history of oral contraceptive side effects. Archives of Women’s Mental Health, 14, 345–353. [DOI] [PubMed] [Google Scholar]
- Borsboom D (2017). A network theory of mental disorders. World Psychiatry, 16, 5–13. [DOI] [PMC free article] [PubMed] [Google Scholar]
- Chesney E, Goodwin GM, & Fazel S (2014). Risks of all-cause and suicide mortality in mental disorders: a meta-review. World Psychiatry, 13, 153–160. [DOI] [PMC free article] [PubMed] [Google Scholar]
- Christian C, Williams BM, Hunt RA, Wong VZ, Ernst SE, Spoor SP, Vanzhula IA, Tregarthen JP, Forbush KT, & Levinson CA (2020). A network investigation of core symptoms and pathways across duration of illness using a comprehensive cognitive-behavioral model of eating-disorder symptoms. Psychological Medicine, 1–10. [DOI] [PubMed] [Google Scholar]
- Coniglio KA, Becker KR, Tabri N, Keshishian AC, Miller JD, Eddy KT, & Thomas JJ (2018). Factorial integrity and validation of the Eating Pathology Symptoms Inventory (EPSI). Eating Behaviors, 31, 1–7. [DOI] [PubMed] [Google Scholar]
- Deter HC, & Herzog W (1994). Anorexia nervosa in a long-term perspective: Results of the Heidelberg-Mannheim study. Psychosomatic Medicine, 56, 20–27. [DOI] [PubMed] [Google Scholar]
- DuBois RH, Rodgers RF, Franko DL, Eddy KT, & Thomas JJ (2017). A network analysis investigation of the cognitive-behavioral theory of eating disorders. Behaviour Research and Therapy, 97, 213–221. [DOI] [PubMed] [Google Scholar]
- Endicott J, Nee J, & Harrison W (2006). Daily Record of Severity of Problems (DRSP): reliability and validity. Archives of Women’s Mental Health, 9, 41–49. [DOI] [PubMed] [Google Scholar]
- Epskamp S, Borsboom D, & Fried EI (2018). Estimating psychological networks and their accuracy: A tutorial paper. Behavior Research Methods, 50, 195–212. [DOI] [PMC free article] [PubMed] [Google Scholar]
- Epskamp S, Cramer AO, Waldorp LJ, Schmittmann VD, & Borsboom D (2012). qgraph: Network visualizations of relationships in psychometric data. Journal of Statistical Software, 48, 1–18. [Google Scholar]
- Epskamp S, & Fried EI (2018). A tutorial on regularized partial correlation networks. Psychological Methods, 23, 617–634. [DOI] [PubMed] [Google Scholar]
- Forbush KT, Siew CSQ, & Vitevitch MS (2016). Application of network analysis to identify interactive systems of eating disorder psychopathology. Psychological Medicine, 46, 2667. [DOI] [PubMed] [Google Scholar]
- Forbush KT, Wildes JE, & Hunt TK (2014). Gender norms, psychometric properties, and validity for the Eating Pathology Symptoms Inventory. International Journal of Eating Disorders, 47, 85–91. [DOI] [PubMed] [Google Scholar]
- Forbush KT, Wildes JE, Pollack LO, Dunbar D, Luo J, Patterson K, Petruzzi L, Pollpeter M, Miller H, Stone A, Bright A, & Watson D (2013). Development and validation of the Eating Pathology Symptoms Inventory (EPSI). Psychological Assessment, 25, 859. [DOI] [PubMed] [Google Scholar]
- Forrest LN, Sarfan LD, Ortiz SN, Brown TA, & Smith AR (2019). Bridging eating disorder symptoms and trait anxiety in patients with eating disorders: A network approach. International Journal of Eating Disorders, 52, 701–711. [DOI] [PubMed] [Google Scholar]
- Halbreich U, Borenstein J, Pearlstein T, & Kahn LS (2003). The prevalence, impairment, impact, and burden of premenstraul dysphoric disorder (PMS/PMDD). Psychoneuroendocrinology, 28, 1–23. [DOI] [PubMed] [Google Scholar]
- Hardin SL, Thornton LM, Munn-Chernoff MA, & Baker JH (2019). Premenstrual symptoms as a marker of ovarian hormone sensitivity in eating disorders. International Journal of Eating Disorders, 53, 296–301. [DOI] [PMC free article] [PubMed] [Google Scholar]
- Harrer M, Adam SH, Messner E-M, Baumeister H, Cuijpers P, Bruffaerts R, Auerbach RP, Kessler RC, Jacobi C, Taylor CB, & Ebert DD (2020). Prevention of eating disorders at universities: A systematic review and meta-analysis. International Journal of Eating Disorders, 53, 813–833. [DOI] [PubMed] [Google Scholar]
- Herpertz-Dahlmann B (2009). Adolescent Eating Disorders: Definitions, Symptomatology, Epidemiology and Comorbidity. Child and Adolescent Psychiatric Clinics of North America, 18, 31–47. [DOI] [PubMed] [Google Scholar]
- Jones PJ, & Jones MP (2018). Package ‘network tools’. In (Vol. 2018). [Google Scholar]
- Jones PJ, Ma R, & McNally RJ (2019). Bridge centrality: A network approach to understanding comorbidity. Multivariate Behavioral Research, 56, 353–367. [DOI] [PubMed] [Google Scholar]
- Keshaviah A, Edkins K, Hastings ER, Krishna M, Franko DL, Herzog DB, Thomas JJ, Murray HB, & Eddy KT (2014). Re-examining premature mortality in anorexia nervosa: a meta-analysis redux. Comprehensive Psychiatry, 55, 1773–1783. [DOI] [PubMed] [Google Scholar]
- Kessler RC, Berglund PA, Chiu WT, Deitz AC, Hudson JI, Shahly V, Aguilar-Gaxiola S, Alonso J, Angermeyer MC, Benjet C, Bruffaerts R, de Girolamo G, de Graaf R, Maria Haro J, Kovess-Masfety V, O’Neill S, Posada-Villa J, Sasu C, Scott K, …, & Xavier M (2013). The prevalence and correlates of binge eating disorder in the World Health Organization World Mental Health Surveys. Biological Psychiatry, 73, 904–914. [DOI] [PMC free article] [PubMed] [Google Scholar]
- Ko CH, Yen CF, Long CY, Kuo YT, Chen CS, & Yen JY (2015). The late-luteal leptin level, caloric intake and eating behaviors among women with premenstrual dysphoric disorder. Psychoneuroendocrinology, 56, 52–61. [DOI] [PubMed] [Google Scholar]
- Lanza di Scalea T, & Pearlstein T (2019). Premenstrual Dysphoric Disorder. The Medical Clinics of North America, 103, 613–628. [DOI] [PubMed] [Google Scholar]
- Levinson CA, Brosof LC, Vanzhula I, Christian C, Jones P, Rodebaugh TL, Langer JK, White EK, Warren C, Weeks JW, Menatti A, Lim MH, & Fernandez KC (2018). Social anxiety and eating disorder comorbidity and underlying vulnerabilities: Using network analysis to conceptualize comorbidity. International Journal of Eating Disorders, 51, 693–709. [DOI] [PubMed] [Google Scholar]
- Levinson CA, Vanzhula IA, Brosof LC, & Forbush K (2018). Network Analysis as an Alternative Approach to Conceptualizing Eating Disorders: Implications for Research and Treatment. Current Psychiatry Reports, 20, 67. [DOI] [PubMed] [Google Scholar]
- Levinson CA, Zerwas S, Calebs B, Forbush K, Kordy H, Watson H, Hofmeier S, Levine M, Crosby RD, Peat C, Runfola CD, Zimmer B, Moesner M, Marcus MD, & Bulik CM (2017). The core symptoms of bulimia nervosa, anxiety, and depression: A network analysis. Journal of Abnormal Psychology, 126, 340. [DOI] [PMC free article] [PubMed] [Google Scholar]
- McNally RJ (2016). Can network analysis transform psychopathology? . Behaviour Research and Therapy, 86, 95–104. [DOI] [PubMed] [Google Scholar]
- Newman M (2010). Networks: An introduction. Oxford, England: Oxford University Press. [Google Scholar]
- Nobles CJ, Thomas JJ, Valentine SE, Gerber MW, Vaewsorn AS, & Marques L (2016). Association of premenstrual syndrome and premenstrual dysphoric disorder with bulimia nervosa and binge-eating disorder in a nationally representative epidemiological sample. International Journal of Eating Disorders, 49, 641–650. [DOI] [PMC free article] [PubMed] [Google Scholar]
- Nohara M, Momoeda M, Kubota T, & Nakabayashi M (2011). Menstrual cycle and menstrual pain problems and related risk factors among Japanese female workers. Industrial Health, 49, 228–234. [DOI] [PubMed] [Google Scholar]
- Opsahl T, Agneessens F, & Skvoretz J (2010). Node centrality in weighted networks: Generalizing degree and shortest paths. Social Networks, 32, 245–251. [Google Scholar]
- Park Y-J, Shin H, Jeon S, Cho I, & Kim Y-J (2021). Menstrual Cycle Patterns and the Prevalence of Premenstrual Syndrome and Polycystic Ovary Syndrome in Korean Young Adult Women. Healthcare, 9, 56. [DOI] [PMC free article] [PubMed] [Google Scholar]
- Racine SE, Culbert KM, Keel PK, Sisk CL, Burt SA, & Klump KL (2012). Differential associations between ovarian hormones and disordered eating symptoms across the menstrual cycle in women. The International Journal of Eating Disorders, 45(3) 333–334. [DOI] [PMC free article] [PubMed] [Google Scholar]
- Sakai H, & Ohashi K (2013). Association of menstrual phase with smoking behavior, mood and menstrual phase-associated symptoms among young Japanese women smokers. BMC Womens Health, 13, 10. [DOI] [PMC free article] [PubMed] [Google Scholar]
- Schaumberg K, Welch E, Breithaupt L, Hübel C, Baker JH, Munn-Chernoff MA, Yilmaz Z, Ehrlich S, Mustelin L, Ghaderi A, Hardaway AJ, Bulik-Sullivan EC, Hedman AM, Jangmo A, Nilsson IAK, Wiklund C, Yao S, Seidel M, & Bulik CM (2017). The science behind the academy for eating disorders’ nine truths about eating disorders. European Eating Disorders Review, 25, 432–450. [DOI] [PMC free article] [PubMed] [Google Scholar]
- Steiner M, Macdougall M, & Brown E (2003). The premenstrual symptoms screening tool (PSST) for clinicians. Archives of Women’s Mental Health, 6, 203–209. [DOI] [PubMed] [Google Scholar]
- Stice E, Marti CN, & Rohde P (2013). Prevalence, incidence, impairment, and course of the proposed DSM-5 eating disorder diagnoses in an 8-year prospective community study of young women. Journal of Abnormal Psychology, 122, 445–457. [DOI] [PMC free article] [PubMed] [Google Scholar]
- Team, R. (2020). RStudio: Integrated development environment for R. In (1.3.959 ed.). Boston, MA: RStudio, PBC. [Google Scholar]
- Team, R. C. (2020). R: A language and environment for statistical computing. In (4.0.0 ed.). Vienna, Austria: R Foundation for Statistical Computing. [Google Scholar]
- Toffol E, Koponen P, Luoto R, & Partonen T (2014). Pubertal timing, menstrual irregularity, and mental health: results of a population-based study. Archives of Women’s Mental Health, 17, 127–135. [DOI] [PubMed] [Google Scholar]
- Udo T, & Grilo CM (2018). Prevalence and correlates of DSM-5 defined eating disorders in a nationally representative sample of U.S. adults. Biological Psychiatry, 84, 345–354. [DOI] [PMC free article] [PubMed] [Google Scholar]
- Vanzhula IA, Calebs B, Fewell L, & Levinson CA (2019). Illness pathways between eating disorder and post-traumatic stress disorder symptoms: Understanding comorbidity with network analysis. European Eating Disorders Review, 27, 147–160. [DOI] [PMC free article] [PubMed] [Google Scholar]
- Yonkers KA, & Simoni MK (2018). Premenstrual disorders. American Journal of Obstetrics and Gynecology, 218, 68–74. [DOI] [PubMed] [Google Scholar]
- Zhou M, Wege N, Gu H, Shang L, Li J, & Siegrist J (2010). Work and family stress is associated with menstrual disorders but not with fibrocystic changes: cross-sectional findings in Chinese working women. Journal of Occupational Health, 52, 361–366. [DOI] [PubMed] [Google Scholar]
Associated Data
This section collects any data citations, data availability statements, or supplementary materials included in this article.
Supplementary Materials
Data Availability Statement
Data will be provided upon reasonable request.