Abstract
The clinical success of osteochondral implants depends significantly on their surface properties. In vivo, an implant may roughen over time which can decrease its performance. The present study investigates whether changes in the surface texture of metal and two types of polycarbonate urethane (PCU) focal knee resurfacing implants (FKRIs) occurred after 6 and 12 months of in vivo articulation with native goat cartilage. PCU implants which differed in stem stiffness were compared to investigate whether the stem fixating the implant in the bone influences surface topography. Using optical profilometry, 19 surface texture parameters were evaluated, including spatial distribution and functional parameters obtained from the material ratio curve. For metal implants, wear during in vivo articulation occurred mainly via material removal, as shown by the significant decrease of the core‐valley transition from 91.5% in unused implants to 90% and 89.6% after 6 and 12 months, respectively. Conversely, for PCU implants, the wear mechanism consisted in either filling of the valleys or flattening of the surface by dulling of sharp peaks. This was illustrated in the change in roughness skewness from negative to positive values over 12 months of in vivo articulation. Implants with a softer stem experienced the most deformation, shown by the largest change in material ratio curve parameters. We therefore showed, using a detailed surface profilometry analysis, that the surface texture of metal and two different PCU FKRIs changes in a different way after articulation against cartilage, revealing distinct wear mechanisms of different implant materials.
Keywords: articular cartilage, FKRI, osteoarthritis, profilometry, surface texture
1. INTRODUCTION
Cartilage defects commonly occur in middle‐aged patients and may progress into osteoarthritis if left untreated. 1 , 2 Early intervention osteochondral therapies in the form of metal focal knee resurfacing implants (FKRIs) are currently one of the treatment options used to repair cartilage defects in these patients. 3 , 4 , 5 However, as the biomechanical properties of metal implants do not match those of cartilage, these implants can cause a gradual increase in the amount of cartilage damage in the surrounding and opposing tissue. 6 , 7 , 8 , 9 , 10 In addition to this, MRI diagnostics can no longer be used to visualize and monitor future or recurrent complaints when metal FKRIs are used.
To overcome this problem, a nonresorbable, polycarbonate urethane (PCU)‐based implant for the treatment of cartilage defects has recently been developed. The biomechanical properties of the implant are tailored to mimic those of native cartilage and bone tissues. Furthermore, the stem of this implant has an adjustable elastic modulus to improve osseointegration. Earlier studies have shown promising results when using PCU as FKRI or meniscus replacement in 3 and 6 months in vivo animal studies, respectively. 11 , 12 , 13
The clinical success of osteochondral implants depends significantly on the properties of the artificial bearing material, including surface chemistry and roughness. 7 Limiting friction between the implant and the opposing cartilage prevents wear, deformation, and damage to both the implant and the cartilage. Roughening of the implant surface over time can decrease its performance as a counterpart, resulting in progressive wear of the opposing cartilage at an increasing rate. 7
Implant surfaces contain valuable information on the wear history after articulation. These surfaces can be characterized by profilometry, a validated and well‐recognized application in the engineering field, which has been gaining increasing attention as a technique to study the surface roughness of orthopedic implants. 14 Contact profilometry methods use a stylus to detect surface irregularities, while noncontact methods such as optical profilometry use light. An advantage of the latter method is that it does not damage the evaluated surface and further evaluations are still possible. Both contact and noncontact profilometry have been used to evaluate changes in surface roughness after in vitro or in vivo testing of newly proposed materials for use in total knee arthroplasty (TKA). 15 , 16 For instance, surface analysis of explanted TKA prostheses showed significant measurable changes in implant surface roughness after in vivo articulation. 14 , 17 , 18 , 19 Additionally, Bülhoff et al. 20 showed that the metallic articulating surface of retrieved shoulder hemiarthroplasties changed over time in vivo, and that deformation occurred. Therefore, surface analysis may provide insight into implant in vivo performance and serve as a tool to select appropriate implant material and design. Nevertheless, little is known about the changes in the surface texture of FKRIs made of different materials with varying stiffness and hardness after articulation against cartilage in vivo.
The arithmetical mean roughness, or (respectively 2D or 3D), is the most widely used parameter for surface texture analysis. 21 , 22 Nevertheless, assessing alone does not allow for conclusive insight into the wear process, as it does not contain unique information regarding the spatial distribution of a given surface 17 , 23 . Therefore, it is necessary to consider additional amplitude‐based parameters such as the skewness ( or ), a measure of the symmetry of a profile. Moreover, from the material ratio curve, which expresses the cumulative height distribution of the surface topology, functional surface parameters can be calculated. 24 These parameters, used to evaluate the behavior of a surface that comes into strong mechanical contact, can give more insight into the tribological properties of implant surfaces like lubricant retention properties, load‐carrying capacity, and wear resistance. 24 , 25
The objective of the present study is to assess if the surface texture of FKRIs changes with time in vivo and if these changes differ between implants made of different material types. To this end, this study analyzed a total of 19 surface texture parameters of three groups of implants (two different types of PCU‐based FKRIs and one type of metal FKRIs) after 6 and 12 months of in vivo articulation with native cartilage in goat knee joints. The surface texture was compared with unused implants. This thorough surface analysis based on a combination of spatial and functional parameters rather than the standard assessment of or alone is expected to offer more detailed insight into the implant wear process.
2. MATERIALS AND METHODS
2.1. Implant fabrication
Implants in all three groups analyzed had a mushroom shape measuring 10.5 mm in height, with a 10 mm diameter top surface and a 6 mm diameter stem (Figure 1A,B). The articulating top layer had a biconvex curvature with radii of 18 and 11 mm to match, respectively, the approximate sagittal and coronal curvatures of the goat knee. The first group of implants was composed of two different grades of nondegradable thermoplastic polycarbonate‐urethane: a Bionate® II Shore hardness 80A top layer and a Bionate® Shore hardness 75D bottom layer, and is referred to as polymer stem PCU implants. The second group of implants also contained a Bionate® II Shore hardness 80A top layer, but the bottom layer was made of a composite material consisting of Bionate® Shore hardness 75D (40 wt%) and zirconium oxide ceramic particles (60 wt%). This group of implants is referred to as composite stem PCU implants.
Figure 1.
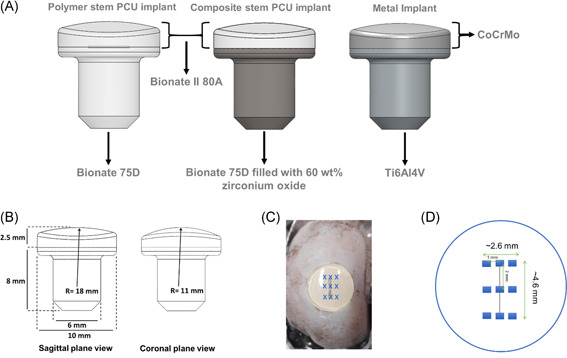
(A) Implant designs; (B) critical dimensions of the implants; (C) image, and (D) schematic representation of the localization of the nine individual measurements performed on each implant [Color figure can be viewed at wileyonlinelibrary.com]
Both polymer implant groups were produced with a two‐step injection molding procedure (DSM Biomedical). The last group was metal implants, consisting of a titanium (Ti6Al4V) stem and a polished ( < 0.05 µm) cobalt chromium molybdenum (CoCrMo) articulating surface produced by machining (OHST Medizintechnik AG).
2.2. Surgical procedure
Approvals from the central commission for animal testing and the local animal welfare committee of Maastricht University were obtained before the present study, which was part of a larger study (Approval Number: AVD107002016514). Medial femoral condyles of 32 skeletally mature Dutch milk goats (2–3 years old, 60–80 kg) were bilaterally operated, resulting in a total of 64 condyles. The goat animal model was selected due to the similarities in joint anatomy and similar the ratio of cartilage to subchondral bone between the goat stifle and the human knee joint. 26 , 27 , 28 Using block randomization, goats either received an implant (polymer stem PCU, composite stem PCU, or metal, n = 16 medial condyles each) or sham surgery (n = 16). The implants were press‐fit implanted after predrilling an undersized osteochondral defect 0.1–0.2 mm in diameter in the medial femoral condyle using an optimized medial para‐patellar approach as described by van Hugten et al. 29 Goats were allowed direct load bearing after surgery and they were sacrificed 6 or 12 months after surgery (16 goats/32 condyles at each time point). The femoral condyles with and without implants were harvested, fixed in formalin, and stored at 4°C. Before optical profiling, the condyles with implants were transferred to a container filled with phosphate‐buffered saline (PBS) solution at room temperature. An example of an explanted condyle with a composite stem PCU implant is shown in Figure 1C. All surgical procedures were successfully concluded without the occurrence of intraoperative complications and all animals regained their normal gait and behavior.
2.3. Optical profiling
Before measurements, the implant surface was blotted with low lint wipes to remove excess PBS from the surface. Femoral condyles were clamped in a vise to minimize tilting and surface measurements were performed on all retrieved osteochondral implants. Each implant (n = 8 per implant type and time point) was measured at nine equally spaced locations using an optical surface profiler (Sensofar Plµ 2300) with a 20× objective covering an area of 640 × 480 µm2. The measurement locations, shown in Figure 1C,D, are representative for the central portion of the implant, which was most in contact with the opposing cartilage during in vivo articulation. Values of the surface texture parameters from the nine measurements were averaged per implant. Unused, as‐manufactured polymer stem PCU, composite stem PCU, and metal implants were measured in the same way and will from here on be referred to as 0‐month implants (n = 2 each).
2.4. Surface analysis
All measurements were corrected for tilt and surface curvature by applying a third‐order polynomial fit to the data. The images were processed with a Gaussian regression filter with a wavelength of 0.0025 mm to reduce noise, and the roughness and waviness profiles were separated from each other by using a standard cutoff wavelength of 0.08 mm. 30
Before calculating surface parameters, outlier measurements possibly caused by small droplets of PBS solution or dirt remaining on the surface after blotting were removed with the interquartile range method. A total of 2.75% of the 3×10⁵ data points were excluded during this operation.
Nineteen different parameters (amplitude‐based and functional) were determined for both the roughness and waviness profile, shown in Table 1.
Table 1.
Surface texture parameters included in the implant surface texture analysis
| Parameter | Description |
|---|---|
| / (µm) | Arithmetical mean height |
| / (µm) | Root mean square height |
| / (µm) | Peak to valley height |
| / (−) | Skewness |
| / (−) | Kurtosis |
| / (µm) | Third maximum peak to valley height |
| (µm) | Core roughness depth |
| (µm) | Reduced peak height |
| (µm) | Reduced valley depth |
| (%) | Peak material portion |
| (%) | Valley material portion |
| P peak volume (mm3) | Peak material volume |
| P valley volume (mm3) | Valley material volume |
As many of these parameters were shown to be correlated with one another, only a few independent parameters were analyzed more in depth. 21 , 31 , 32 , 33 These were the average surface roughness and surface waviness , the surface polarity skewness and , and the waviness peak to valley height, . These parameters are explained in more detail in the Appendix A. Briefly, and are the arithmetical means of the profiles with a certain length. and are measures of the (a)symmetry of the peaks and valleys about the mean line. A negative skewness represents a height distribution skewed above the mean plane, a skewness of 0 a symmetric profile around the mean plane, and a positive skewness a height distribution which is skewed below the mean plane. is the total height of the profile, that is, the sum of the largest peak height value and the largest valley depth value within the defined area.
Additionally, the areal material ratio curve was determined for each measurement to obtain functional roughness parameters, according to ISO 25178‐2:2012. 34 Figure 2 illustrates 3D and 2D surface profiles showing the core (gray), valley (red), and peak (blue) regions identified from the corresponding material ratio curve. These regions were determined by fitting a straight line with the least steep secant between 30% and 70% material ratios and later extending this line towards the 0% and 100% points. 34 The locations in the profile which are higher than the intersection of the extension with 0% were identified as peak regions (blue area in Figure 2A), while the locations which were lower than the intersection of the extension with 100% were identified as valleys (red area in Figure 2A). The region left in between was classified as the core (gray area in Figure 2A). This provided the functional parameters core roughness depth , which is the peak‐to‐valley height without abundant peaks and valleys; and the reduced peak height and valley depth, respectively and . Additionally, and were determined, representing, respectively, the material ratios at the peak‐core and core‐valley transition. The 50% material ratio was used as the height reference of the surfaces.
Figure 2.
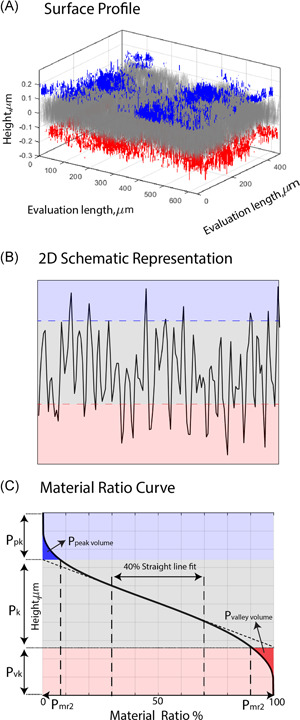
Schematic representation of surface profiles (3D, 2D), material ratio curve, and corresponding zones of core (gray), valley (red), and peak (blue) regions. (A) 3D surface profile, (B) 2D surface profile, (C) material ratio curve showing the parameters , , , , and . 2D and 3D, two‐ and three‐dimensional, respectively [Color figure can be viewed at wileyonlinelibrary.com]
2.5. Statistical analyses
Pearson's correlation coefficient was used to determine the correlation between surface texture parameters. Correlations were classified as strong , medium ( or weak ( to identify independent parameters, which were analyzed in more detail. Statistical analyses were performed with GraphPad Prism 8.02, using average values of surface texture parameters from the nine measurements performed per implant. Results were analyzed using an unbalanced two‐way analysis of variance, and a post hoc test with Tukey's multiple comparison correction was used to identify significant differences between implant type and time point. p values lower than 0.05 were considered significant.
3. RESULTS
Correlations found between the 19 surface texture parameters analyzed are shown in Figure 3. The surface texture parameters chosen for more detailed analysis in the following sections (, , , , , and ) were independent from each other, while all others had a strong positive or negative correlation with these parameters of at least 0.82.
Figure 3.
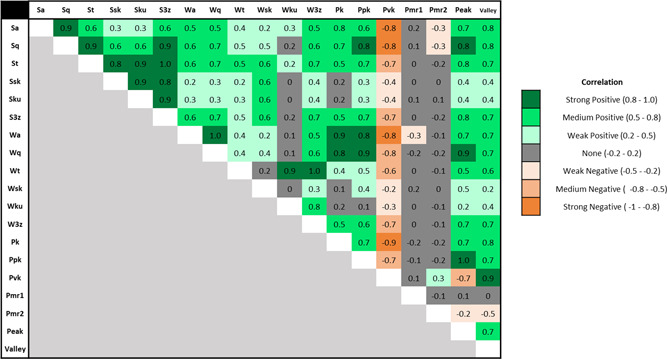
Correlation matrix between the surface texture parameters analyzed in the present study [Color figure can be viewed at wileyonlinelibrary.com]
Examples of 3D surface topographies of polymer stem PCU and metal implants at 0 and 12 months from one out of nine measurement locations on the respective sample are shown in Figure 4A, with the roughness profile along the central gray plane depicted in Figure 4B. Differences in the surface texture are visible between the two implant types at both time points, as well as between time points for the same implant type in Figure 4. No visible differences between composite stem and polymer stem PCU implants were observed in the topography images.
Figure 4.
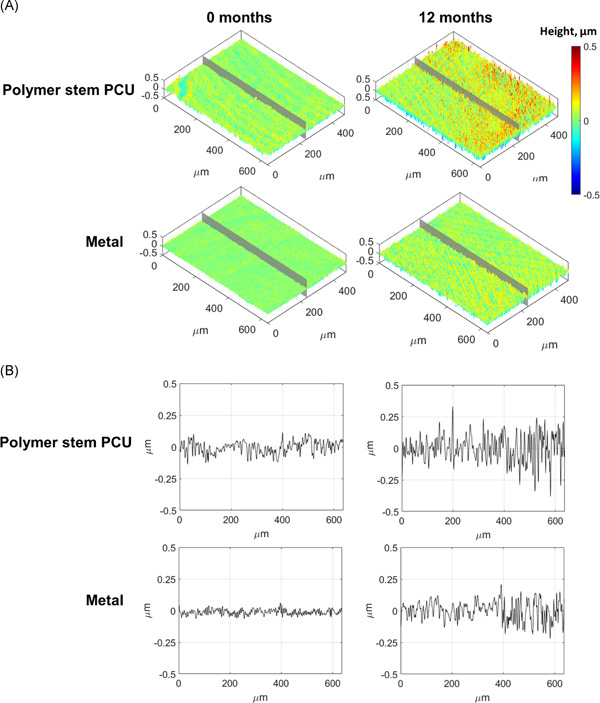
Representative surface topographies from one measurement location of the nine performed on a polymer stem PCU and metal implants at 0 (unused implants) and 12 months after in vivo use: (A) 3D surface (isometric view); (B) surface roughness obtained from the 1D profile along the central gray line in A. 1D and 3D, one‐ and three‐dimensional, respectively; PCU, polycarbonate urethane [Color figure can be viewed at wileyonlinelibrary.com]
No significant type‐by‐time interactions were observed, and all results presented in the following were based on significant main effects (implant type or time).
The average surface roughness did not change significantly over time for any of the implant types (Figure 5A). The only significant difference found for this parameter was a lower average surface roughness for the metal implants in comparison to the polymer stem PCU implants after 6 months (p = 0.046).
Figure 5.
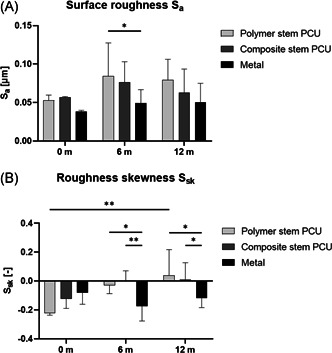
(A) Average surface roughness ; (B) roughness skewness per implant type and time in vivo; n = 2 for each implant type at 0 month, n = 8 for each implant type at 6 and 12 months (*p< 0.05, **p< 0.01)
For metal implants, the roughness skewness remained negative throughout the 12 months in vivo, while for PCU implants it became positive after 6 (composite stem PCU) and 12 months (polymer stem PCU; Figure 5B). The skewness of the metal implants retrieved after 6 and 12 months was significantly lower than that of PCU implants retrieved at the same time point (6 months: metal vs. polymer stem p = 0.02, metal vs. composite stem p = 0.004; 12 months: metal vs. polymer stem p = 0.011, metal vs. composite stem p = 0.047). The skewness changed significantly over time for the polymer stem PCU (0–12 months p = 0.007) but not for the composite stem and metal implants.
No significant difference on average surface waviness over time or between implant groups was found (Figure 6A).
Figure 6.
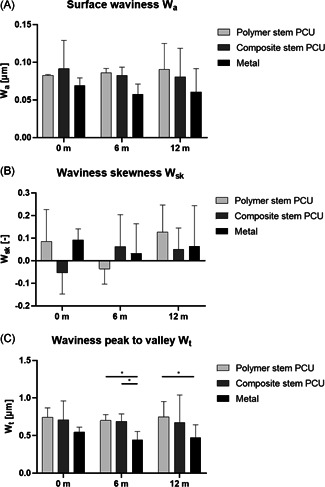
(A) Surface waviness ; (B) waviness skewness ; and (C) waviness peak to valley height per implant type and time in vivo; n = 2 for each implant type at 0 month, n = 8 for each implant type at 6 and 12 months (*p< 0.05)
For metal implants, the waviness skewness remained positive throughout the 12 months in vivo, while the 0 month composite stem PCU implants and the 6 months polymer stem PCU implants had a negative waviness skewness (Figure 6B).
The waviness peak to valley height was significantly lower for the retrieved metal implants than both the retrieved composite stem (p = 0.04) and polymer stem (p = 0.03) PCU implants at 6 months (Figure 6C). The of metal implants retrieved at 12 months was significantly lower than the polymer stem PCU implants (p = 0.02).
The average material ratio curves for the three implant types at the three time points are shown in Figure 7 with corresponding average values for core roughness depth , reduced peak height and reduced valley depth . Both the reduced peak height and reduced valley depth were significantly lower for metal implants compared to polymer stem PCU implants at 6 months (p = 0.0247 and p = 0.0388, respectively). The core roughness depth was significantly lower for metal implants compared to polymer stem and composite stem PCU implants at 6 months (p = 0.0085 and p = 0.025, respectively). The implants retrieved at 12 months showed a significant lower in the metal group compared to the polymer stem PCU implants (p = 0.024).
Figure 7.
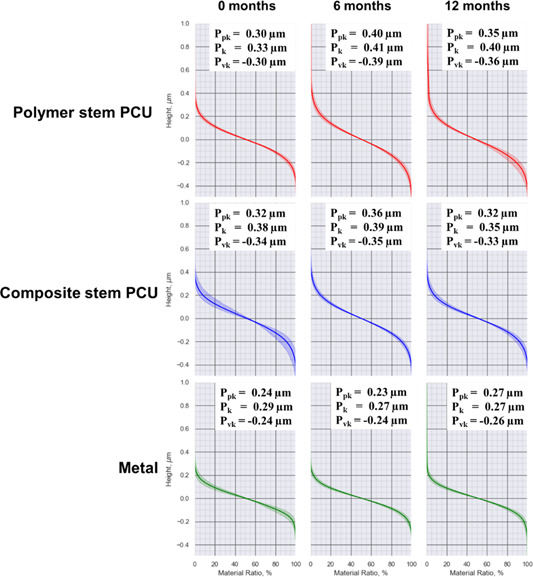
Average material ratio curves and standard deviation for PCU and metal implants at 0, 6, and 12 months; n = 2 for each implant type at 0 month, n = 8 for each implant type at 6 and 12 months. PCU, polycarbonate urethane [Color figure can be viewed at wileyonlinelibrary.com]
For the metal implants, and of the 0 month (unused) implants were comparable to implants retrieved at 6 months and an increase in and decrease in was shown for implants retrieved at 12 months compared to those retrieved at 6 months. Both types of PCU implants had an increased and decreased when the 0‐month implants were compared to the implants retrieved at 6 months. For both types of PCU implants, the decreased and increased when the 6 months retrievals were compared to the 12 months retrievals.
was lower in metal implants than PCU implants at all time points, with a significant difference between metal and polymer stem PCU at 12 months (p = 0.009) (Figure 8A). was significantly higher in 0 month metal than 0 month PCU implants (polymer stem: p = 0.012; composite stem: p = 0.032) and decreased significantly over time for the metal group (0 vs. 6 months, p = 0.0178; 0 vs. 12 months, p = 0.0016) (Figure 8B).
Figure 8.
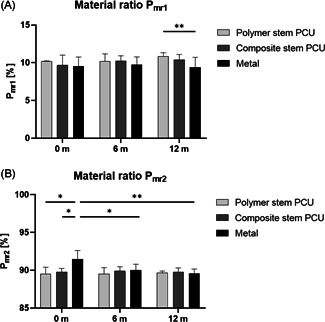
Material ratios (A) and (B) per implant type and time in vivo. n = 2 for each implant type at 0 month, n = 8 for each implant type at 6 and 12 months (*p< 0.05, **p< 0.01). PCU, polycarbonate urethane
4. DISCUSSION
This study showed that surface texture parameters of metal and two types of PCU implants change differently with time in vivo, indicating distinct wear processes. To investigate whether the stem stiffness has an effect on the surface texture of the contact layer, the two types of PCU implants had stems with different stiffness. Surface texture changes were found both between and within implant material types over time, suggesting that deformation occurred in the FKRIs obtained after in vivo articulation. A remarkable finding was that not only the hardness (or stiffness) of the contact layer but also the stiffness of the stem has an influence on changes of the surface texture parameters of an FKRI over time, suggesting there is an effect of implant stability on surface wear.
The present study analyzed the surface roughness of PCU implants in direct comparison with metal implants before and after in vivo articulation. The mean values for the as‐manufactured, unused metal (CoCrMo surface) implants were comparable to mean values reported in the literature (Figure 5A). 18 , 35 Because the surfaces of the PCU implants with polymer and composite stems were made of the same material, as expected, no significant differences for any of the analyzed parameters were found between these implants at 0 month. The only parameter that showed a significant difference between the metal and PCU groups for unused implants was (Figure 7B). This indicates that the measured surface area of the metal implants consists of a lower percentage of valleys, which may have an influence on the implant lubricating properties. Interestingly, this difference was not present anymore between the different implant types retrieved after 6 and 12 months.
After 6 months of in vivo articulation, a significantly lower waviness peak to valley height and core roughness depth were found for the metal implants compared to both types of PCU implants. As PCU is softer than metal, an explanation for this may be that the surface geometry adapts to the mechanical loads experienced in the knee. Interestingly, a significantly lower average roughness , reduced peak height , and reduced valley height were found for the 6 months retrieved metal implants compared to polymer stem PCU implants but not compared to composite stem PCU implants.
After 12 months of in vivo articulation, the waviness peak to valley height , core roughness depth and were significantly lower for the metal implants compared to the polymer stem PCU implants. The retrieved polymer stem PCU implants showed a much wider spread in height of the material ratio curve compared to the other implant types, which indicates that higher peaks and deeper valleys in the roughness profile were present in retrieved PCU implants with a softer stem. Since the articulating top layer of both types of PCU implants was made of the same material (Bionate® II 80A), and the above mentioned changes did not occur in the composite stem PCU implants, this indicates that the stiffness of the underlying stem influences the wear of the implant surfaces. As the polymer stem is more compliant, it deforms with excessive loading, while the implants with a stiff stem (composite stem PCU and metal) deform less. Alternatively, implant osseointegration may have been insufficient for implants with a polymer stem, which could possibly lead to migration of the implant below the articulating surface. Investigating such migration was beyond the scope of the present study, but will be part of another study in which implant performance is explored in more detail.
From previous research in the field of TKAs, it is known that not only the softer implant materials such as ultrahigh molecular weight polyethylene become damaged due to in vivo articulation, but damage and changes over time are also detectable on the harder, metal surfaces after soft‐against‐hard material articulation. 18 , 36 , 37 Comparable to an earlier study which found an increase in surface roughness () between new and retrieved metal shoulder hemiarthroplasties after a mean in situ time of approximately 20 months of articulation against the softer cartilage, the present study found changes over time for both metallic and PCU implants after 6 and 12 months in a load‐carrying knee joint. 20 The average roughness was generally higher for all implant types retrieved at 6 and 12 months in comparison to unused implants, but the differences did not reach statistical significance. The lack of significant differences in is in line with previous in vitro studies investigating changes in surface roughness of different implant materials against (porcine) cartilage. 7 However, the present study found that assessing other parameters than the standard surface texture parameters or alone, such as roughness skewness and functional parameters obtained from the material ratio curve, provides greater insight into the subtle differences in in vivo implant wear.
For both types of PCU implants, the roughness surface profile changed after 12 months of in vivo articulation from a profile dominated by valleys in the unused implants (composite stem: mean = −0.12, polymer stem: mean = −0.22) to positive values, that is, a profile dominated by peaks (Figure 5B). A significant difference in was found between unused polymer stem PCU implants and implants retrieved after 12 months. This suggests that valleys already present after manufacturing were either filled or the surface was worn off or flattened due to articulation against the opposing cartilage. Conversely, the significant differences in roughness skewness between the metal and both types of PCU implants retrieved after 6 and 12 months show that the roughness profile of retrieved metal implants remained dominated by valleys. Furthermore, decreased significantly over time for the metal implants. A lower transition point between the core and the valley portion is indicative for material removal and an increased valley volume. The negative roughness together with a sharper gradient at the end of the material ratio curve can indicate that the topological characteristics of the metal implants allow for better lubricant retention capability than the polymer implants. 17 , 25 However, the chemical characteristics of the polymer have better lubricant retention than metal and PCU is able to absorb synovial fluid components to the surface, which likely makes the polymer implants more lubricated than the metal ones in a synovial joint. 38 , 39
All shown material ratio curves have an S‐shape, indicating a Gaussian‐like height distribution (Figure 7). Pawlus et al. 24 suggested that the change in the material ratio curve after in vivo articulation, also seen in the present study, is the result of plastic deformation. When analyzing the implant surfaces using the material ratio curves, it becomes apparent that the core roughness () is slightly lower for the composite stem PCU and metal 12 months retrieved implants compared to the unused, 0‐month implants. This indicates that the bearing contact area increased over time for the implants with a stiff stem. The polymer stem PCU implants with the softest stem showed the largest absolute difference in , , and between unused and retrieved implants, suggesting once more that mechanical stability of the implant is important for surface wear.
Before the present study, repeatability of the measurements was confirmed. All nine measurements on each implant were taken close to each other and near the center of the implant at consistently spaced areas, to represent the behavior of the portion that is most in contact with the opposing cartilage during articulation. A subset analysis showed no differences between measurement locations according to their position in the femoral joint. Although the implant surface might also be damaged during implantation, no macroscopic marks were visible on the implants that could have been caused by the surgical procedure.
Only two unused (0 month) implants were compared to eight retrieved implants for each implant type group per time point, as the unused implants are anticipated to be much more homogeneous than the used ones. The analyses of the 6 and 12 months groups were performed on different samples due to the invasive nature of the measurement. Additional valuable information on the performance of the implants will be obtained when evaluating all outcomes of the present animal study, including the opposing and surrounding cartilage and implant osteointegration, but this was beyond the scope of the present study. Finally, future research should also examine the synovial fluid to analyze the presence of wear particles and determine the wear rate volumetrically/gravimetrically, together with the influence of the different biological reactions to PCU or CoCrMo particles.
5. CONCLUSION
The present study demonstrated, using a detailed surface profilometry analysis, that the surface texture of FKRIs changes with time after in vivo implantation, and that these changes differ between implants made of PCU and metal. Although the composite stem and polymer stem PCU implants have the same contact surface, they differ in wear behavior over time, indicating that changes in surface texture parameters due to in vivo articulation are caused not only by the contacting surface but also by the underlying stem fixating the implant in the bone. From an implant surface wear perspective, results show that polymer surfaces are promising for use in cartilage implants if implant stem fixation is appropriate. This encourages the development and use of these FKRIs in the future if other characteristics such as osseointegration and cartilage wear at least equal those of metal implants.
CONFLICT OF INTERESTS
Emin E. Aşık, Alex K. Roth, Jens C. Thies, Pieter J. Emans, Corrinus C. van Donkelaar are the inventors of the patent PCT/EP2021/064318. Alex K. Roth and Pieter J. Emans are shareholders of Avalanche Medical BV, the private entity which owns a license to commercially exploit the herein described implant technology. Jens C. Thies is employed by DSM Biomedical.
AUTHOR CONTRIBUTIONS
Emin E. Aşık, Alicia H. A. Damen, Maria Pastrama, and Corrinus C. van Donkelaar designed the study. Emin E. Aşık and Maria Pastrama acquired the data. Pieter P. W. van Hugten and Alex K. Roth performed the animal study. Emin E. Aşık, Alicia H. A.Damen, and Maria Pastrama analyzed the data and drafted the paper. Jens C. Thies, Pieter J. Emans, Keita Ito and Corrinus C. van Donkelaar critically revised the paper. All authors have read and approved the submitted paper version.
ACKNOWLEDGEMENTS
This study was performed under the framework of Chemelot InSciTe.
APPENDIX A.
Surface amplitude for roughness (S) and waviness (W) profiles were calculated by using the mathematical definitions below, where is the surface roughness profile, is the surface waviness profile and is the number of data points on the profile.
Arithmetical mean height (/ [µm])
Root mean square height (/ [µm])
Peak to valley height (/ [µm])
Skewness (/ [−])
Kurtosis (/ [−])
Third maximum peak to valley height (/ [µm])
Figure A1 shows the changein roughness parameters with variations in the surface profile. Figure A1A shows the increase in R a, R q and R t with increased range of profile height. Figure A1B shows the change in R sk by distortion of the symmetry of the surface profile. Figure A1C shows how R ku is affected from the presence of extreme values.
Figure A1.
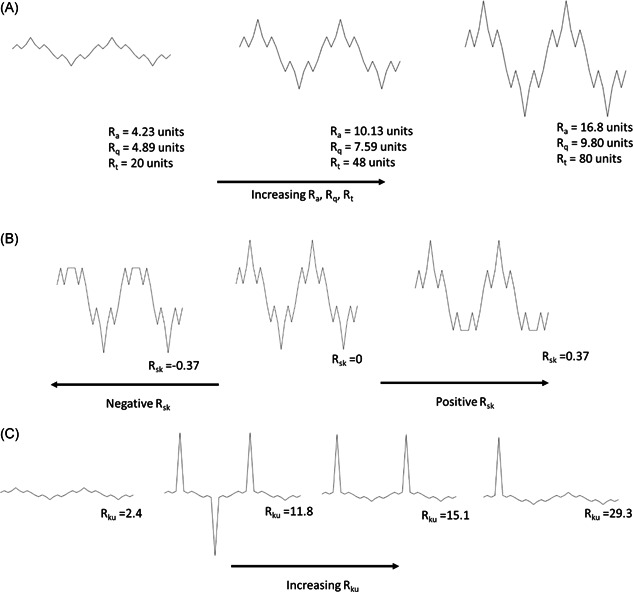
(A) Variation of and with profile. (B) Variation of skewness with profile. (C) Variation of kurtosis with profile
Aşık EE, Damen AHA, van Hugten PPW, et al. Surface texture analysis of different focal knee resurfacing implants after 6 and 12 months in vivo in a goat model. J Orthop Res. 2022;40:2402‐2413. 10.1002/jor.25274
Emin E.Aşık and Alicia H. A.Damen contributed equally to this study.
REFERENCES
- 1. Hjelle K, Solheim E, Strand T, Muri R, Brittberg M. Articular cartilage defects in 1,000 knee arthroscopies. Arthroscopy. 2002;18:730‐734. [DOI] [PubMed] [Google Scholar]
- 2. Widuchowski W, Widuchowski J, Trzaska T. Articular cartilage defects: study of 25,124 knee arthroscopies. Knee. 2007;14:177‐182. [DOI] [PubMed] [Google Scholar]
- 3. Brennan SA, Devitt BM, O'Neill CJ, Nicholson P. Focal femoral condyle resurfacing. Bone Joint J. 2013;95‐B:301‐304. [DOI] [PubMed] [Google Scholar]
- 4. Fuchs A, Eberbach H, Izadpanah K, Bode G, Südkamp NP, Feucht MJ. Focal metallic inlay resurfacing prosthesis for the treatment of localized cartilage defects of the femoral condyles: a systematic review of clinical studies. Knee Surg Sports Traumatol Arthrosc. 2018;26:2722‐2732. [DOI] [PubMed] [Google Scholar]
- 5. Malahias MA, Chytas D, Thorey F. The clinical outcome of the different hemiCAP and uniCAP knee implants: a systematic and comprehensive review. Orthop Rev. 2018;10:58‐64. [DOI] [PMC free article] [PubMed] [Google Scholar]
- 6. Oungoulian SR, Durney KM, Jones BK, Ahmad CS, Hung CT, Ateshian GA. Articulation of native cartilage against different femoral component materials. Oxidized zirconium damages cartilage less than cobalt‐chrome. J Arthroplasty. 2017;32:256‐262. [DOI] [PubMed] [Google Scholar]
- 7. Damen AHA, Nickien M, Ito K, van Donkelaar CC. Wear and damage of articular cartilage with friction against orthopedic implant materials. J Biomech. 2015;48:1050521957. [DOI] [PMC free article] [PubMed] [Google Scholar]
- 8. Damen AHA, Nickien M, Ito K, van Donkelaar CC. The performance of resurfacing implants for focal cartilage defects depends on the degenerative condition of the opposing cartilage. Clin Biomech. 2020;79:105052. [DOI] [PubMed] [Google Scholar]
- 9. Custers RJH, Dhert WJA, Saris DBF, et al. Cartilage degeneration in the goat knee caused by treating localized cartilage defects with metal implants. Osteoarthritis Cartilage. 2010;18:377‐388. [DOI] [PubMed] [Google Scholar]
- 10. Martinez‐Carranza N, Hultenby K, Lagerstedt AS, Schupbach P, Berg HE. Cartilage health in knees treated with metal resurfacing implants or untreated focal cartilage lesions: a preclinical study in sheep. Cartilage. 2019;10:120‐128. [DOI] [PMC free article] [PubMed] [Google Scholar]
- 11. Zur G, Linder‐Ganz E, Elsner JJ, et al. Short term evaluation of an anatomically shaped polycarbonate urethane total meniscus replacement in a goat model. PLoS One. 2015;10:e0133138. [DOI] [PMC free article] [PubMed] [Google Scholar]
- 12. Jeuken RM, Roth AK, Peters MJM, et al. Chondroprotective effects of a polycarbonate‐urethane meniscal implant: histopathological results in a sheep model. Knee Surg Sport Traumatol Arthrosc. 2011;19:255‐263. [DOI] [PubMed] [Google Scholar]
- 13. Holleyman RJ, Scholes SC, Weir D, et al. In vitro and in vivo study on the osseointegration of BCP‐coated versus uncoated nondegradable thermoplastic polyurethane focal knee resurfacing implants. J Biomed Mater Res B. 2020;108:3370‐3382. [DOI] [PMC free article] [PubMed] [Google Scholar]
- 14. Holleyman RJ, Scholes SC, Weir D, et al. Changes in surface topography at the TKA backside articulation following in vivo service: a retrieval analysis. Knee Surg Sport Traumatol Arthrosc. 2015;23:3523‐3531. [DOI] [PubMed] [Google Scholar]
- 15. Cowie RM, Briscoe A, Fisher J, Jennings LM. PEEK‐OPTIMA™ as an alternative to cobalt chrome in the femoral component of total knee replacement: a preliminary study. Proc Inst Mech Eng Part H J Eng Med. 2016;230:1008‐1015. [DOI] [PMC free article] [PubMed] [Google Scholar]
- 16. Roy ME, Whiteside LA, Tilden DS, Noel OF. Reduced UHMWPE wear using magnesia‐stabilized zirconia instead of CoCr femoral components in a knee simulator. J Arthroplasty. 2015;30:468‐474. [DOI] [PubMed] [Google Scholar]
- 17. Kennard E, Scholes SC, Sidaginamale R, et al. Performance assessment of femoral knee components made from cobalt‐chromium alloy and oxidized zirconium. Knee. 2013;20:388‐396. [DOI] [PubMed] [Google Scholar]
- 18. Affatato S, Ruzzi S, Milosevic M, Ruggiero A. A comparative surface topographical analysis of explanted total knee replacement prostheses: oxidised zirconium vs cobalt chromium femoral components. Med Eng Phys. 2017;50:59‐64. [DOI] [PubMed] [Google Scholar]
- 19. Affatato S, Ruzzi S, Milosevic M, Ruggiero A. Wear characterization and contact surfaces analysis of menisci and femoral retrieved components in bi‐condylar knee prostheses. J Mech Behav Biomed Mater. 2020;110:103959. [DOI] [PubMed] [Google Scholar]
- 20. Bülhoff M, Reinders J, Zeifang F, Raiss P, Müller U, Kretzer JP. Surface and form alterations in retrieved shoulder hemiarthroplasty. J Shoulder Elb Surg. 2017;26:521‐528. [DOI] [PubMed] [Google Scholar]
- 21. Baena JC, Peng Z. 3D quantitative characterization of degraded surfaces of human knee cartilages affected by osteoarthritis. Wear. 2014;319:1‐11. [Google Scholar]
- 22. Ghosh S, Bowen J, Jiang K, Espino DM, Shepherd DET. Investigation of techniques for the measurement of articular cartilage surface roughness. Micron. 2013;44:179‐184. [DOI] [PubMed] [Google Scholar]
- 23. Affatato S, Bersaglia G, Junqiang Y, Traina F, Toni A, Viceconti M. The predictive power of surface profile parameters on the amount of wear measured in vitro on metal‐on‐polyethylene artificial hip joints. Proc Inst Mech Eng H. 2006;220:457‐464. [DOI] [PubMed] [Google Scholar]
- 24. Pawlus P, Reizer R, Wieczorowski M, Krolczyk G. Material ratio curve as information on the state of surface topography—a review. Precis Eng. 2020;65:240‐258. [Google Scholar]
- 25. Zeng Q, Qin Y, Chang W, Luo X. Correlating and evaluating the functionality‐related properties with surface texture parameters and specific characteristics of machined components. Int J Mech Sci. 2018;149:137‐152. [Google Scholar]
- 26. Hurtig MB, Buschmann MD, Fortier LA, et al. Preclinical studies for cartilage repair: recommendations from the International Cartilage Repair Society. Cartilage. 2011;2(2):137‐152. [DOI] [PMC free article] [PubMed] [Google Scholar]
- 27. Ahern B. J., Parvizi J., Boston R. & Schaer T. P. Preclinical animal models in single site cartilage defect testing: a systematic review. Osteoarthr Cartil. 2009. 17, 705–713. [DOI] [PubMed] [Google Scholar]
- 28. Chu CR, Szczodry M, Bruno S. Animal models for cartilage regeneration and repair. Tissue Eng Part B Rev. 2010;16:105‐115. [DOI] [PMC free article] [PubMed] [Google Scholar]
- 29. van Hugten PPW, van, Jeuken RM, Roth AK, Seeldrayers S, Emans PJ. An optimized medial parapatellar approach to the goat medial femoral condyle. Animal Model Exp. Med. 2021;4:54‐58. [DOI] [PMC free article] [PubMed] [Google Scholar]
- 30. Bhushan B. Surface roughness analysis and measurement techniques. Modern Tribology Handbook. Vol 1. CRC Press; 2000:49‐119. 10.1201/9780849377877-10 [DOI] [Google Scholar]
- 31. Draganovská D, Ižaríková G, Brezinová J, Guzanová A. The study of parameters of surface roughness by the correlation analysis. Mater Sci Forum. 2015;818:15‐18. [Google Scholar]
- 32. Muralikrishnan B, Raja J. Computational surface and roundness metrology. Comput Surf Roundness Metrol. 2009:1‐263. 10.1007/978-1-84800-297-5 [DOI] [Google Scholar]
- 33. Gadelmawla ES, Koura MM, Maksoud TMA, Elewa IM, Soliman HH. Roughness parameters. J Mater Process Technol. 2002;123:133‐145. [Google Scholar]
- 34.ISO ‐ ISO 25178‐2:2012—Geometrical product specifications (GPS)—surface texture: Areal—Part 2: terms, definitions and surface texture parameters.
- 35. Scholes SC, Kennard E, Gangadharan R, et al. Rotational wear and friction of Ti‐6Al‐4V and CoCrMo against polyethylene and polycarbonate urethane. Biotribology. 2021;26:100167. [Google Scholar]
- 36. Scholes SC, Kennard E, Gangadharan R, et al. Topographical analysis of the femoral components of ex vivo total knee replacements. J Mater Sci Mater Med. 2013;24:547‐554. [DOI] [PubMed] [Google Scholar]
- 37. Heyse TJ, Elpers ME, Nawabi DH, Wright TM, Haas SB. Oxidized zirconium versus cobalt‐chromium in TKA: Profilometry of retrieved femoral components knee. Clin Orthop Relat Res. 2014;472:277‐283. [DOI] [PMC free article] [PubMed] [Google Scholar]
- 38. Kanca Y, Milner P, Dini D, Amis AA. Tribological properties of PVA/PVP blend hydrogels against articular cartilage. J Mech Behav Biomed Mater. 2018;78:36‐45. [DOI] [PubMed] [Google Scholar]
- 39. Majd SE, Kuijer R, Schmidt TA, Sharma PK. Role of hydrophobicity on the adsorption of synovial fluid proteins and biolubrication of polycarbonate urethanes: materials for permanent meniscus implants. Mater Des. 2015;83:514‐521. [Google Scholar]


