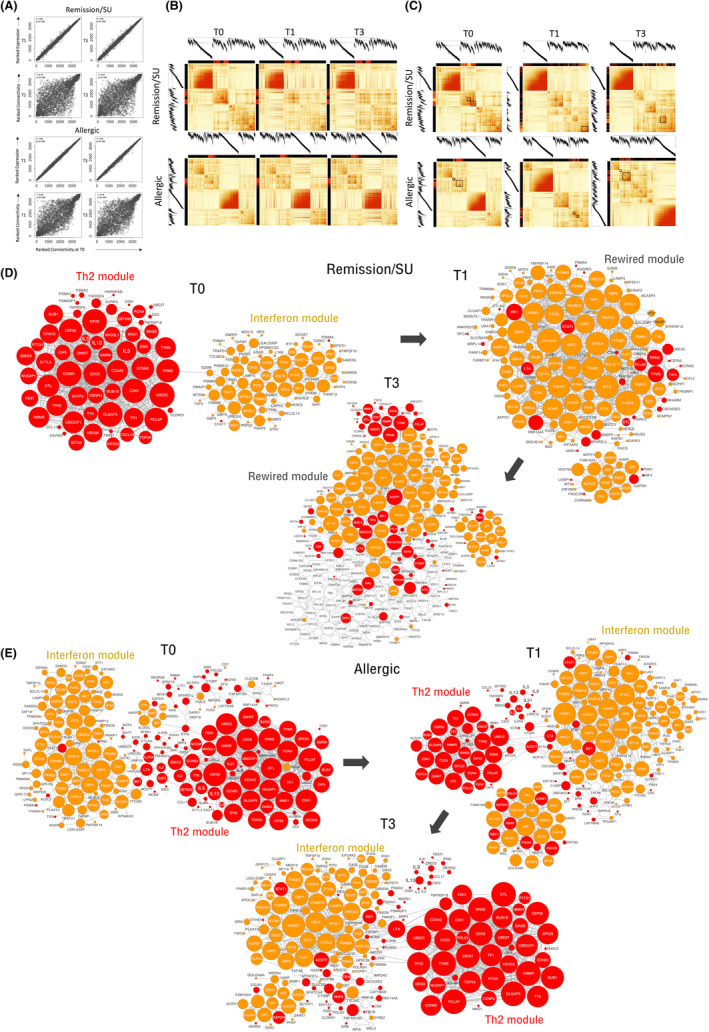
FIGURE 3.

Correlation of CD4+ T cell gene networks at T0/T1 and T0/T3 in subjects who develop remission/SU and subjects who remain allergic. Co‐expression networks were constructed separately for subjects with remission/SU and allergic subjects. (A) Ranked expression levels and ranked connectivity in the remission/SU (upper panel) and allergic groups (lower panel), presented as correlation plots at T0/T1 and T0/T3, (B) Network correlation patterns at T1 and T3 were superimposed over the network structure from T0 in remission/SU and allergic subjects. The Th2‐associated module is highlighted with a red colour band, (C) network connectivity patterns in remission/SU highlighting Th2 (red colour bands) and IFN modules (yellow colour bands) showing discrete bands at T0 and merged/integrated bands at T1 and T3 (black box), network connectivity patterns in allergic subjects are shown in the second panel below, network wiring were reconstructed employing WGCNA and visualized in Cytoscape in (D) remission/SU and (E) allergic subjects; The top 800 edges/pairwise connections were used for network reconstruction. The node size reflects the number of connections. Red colour denotes Th2 community genes, and gold colour denotes interferon community genes
