

Abstract
Aim
This study aims at understanding mammographic density profile in China by comparing the density between women in China and Australia.
Methods
Data of 3250 women aged 45–69 were obtained from the Cancer Screening Program in Urban China and data of 1384 Australian counterparts at same age range were gathered from the Lifepool project. Demographic and reproductive details and mammograms for each cohort were collected. Mammographic density was assessed using AutoDensity, and two metrics, percentage density (PD) and dense area (DA), were applied. T‐tests were used to compare the means of mammographic density between two populations of all, premenopausal, and postmenopausal women. Two‐way ANOVA was conducted to examine interactions of population (Chinese/Australian) and each variable of interest upon mammographic density.
Results
Chinese women had 9.61%, 8.20%, and 9.28% higher PD than their Australian counterparts in all, premenopausal, and postmenopausal women, respectively (all p < 0.001). The mean differences in DA between two population were 1.81 cm2 (p < 0.001), 0.55 cm2 (p = 0.472), and 1.76 cm2 (p = 0.003) for all, premenopausal, and postmenopausal women, respectively. There were significant interactions between population and age (F[4, 4624] = 4.12, p = 0.003), BMI (F[2, 4628] = 3.92, p = 0.020), age at first birth (F[1, 4250] = 11.69, p < 0.001), breastfeeding history (F[1, 4479] = 17.79, p < 0.001), and breastfeeding duration (F[1, 3526] = 66.90, p < 0.001) upon PD. Interaction was only found for breastfeeding history (F[1, 4479] = 4.79, p = 0.029) and breastfeeding duration (F[1, 3526] = 17.72, p < 0.001) for DA.
Conclusions
Both PD and DA were found to be higher in Chinese women compared to Australian women. The density difference by menopause status was shown and breastfeeding history affected breast density differently in both populations.
Keywords: breast cancer, breast density, breastfeeding, mammography, menopause
Interaction effects between population and age, and between population and BMI, on mammographic density were found, meaning the ways in which age group and BMI category impact upon breast density in Australian women may not be the same as Chinese women, which suggested population heterogeneity in breast density variation.
1. INTRODUCTION
Breast cancer is the most common neoplasm diagnosed among females in China. 1 The latest report from National Central Cancer Registry in China reported that the age‐standardized incidence rate of breast cancer was 28 per 100,000 women in 2014 and this number was higher at 33 per 100,000 women in Chinese urban areas. 2 The incidence rate of breast cancer has increased by 20%–30% over the past three decades and it is predicted to keep growing. 1 As the geographically closest Westernized country to China, Australia was recorded as having one of the highest incidence and prevalence rates of breast cancer, approximately five times of that in China. 1 , 3 Given that reduced morbidity and mortality is highly reliant on early detection, understanding risk factors for breast cancer is important for establishing enhanced health outcomes.
As a well‐established risk factor of breast cancer, mammographic density describes the amount of fibroglandular tissue within a breast represented by the radio‐opaque areas in mammograms. The strong relationship between breast cancer and mammographic density has been demonstrated in Western populations and studies have shown that women with high mammographic density had four to six times greater risk for breast cancer compared to women with low density. 4 , 5 , 6 High mammographic density can also mask the appearances of cancer lesions in breasts, thereby reducing the likelihood of cancer detection at routine screening and increasing the likelihood of poorer prognosis interval cancers. 7 Previous studies suggested that age, BMI, age at menarche, parity, breastfeeding, and menopause status were commonly associated with mammographic density. 8 , 9
It has been argued in several countries that mammographic density should be routinely assessed and reported to women who participate in breast screening programs. To date, there are a total of 36 states in the United States adopting mammographic density reporting legislation 10 and one state in Australia (i.e., Western Australia) informs women with high density. 11 But whether this argument is suitable to breast screening in China depends on a comprehensive understanding of Chinese mammographic density.
Mammographic density profiles are understudied in China. 12 Few studies have focused on mammographic density in Chinese women across the world and even fewer have been China‐based. Therefore, this study aims to provide a better understanding of mammographic density for women in China by comparing it with women in Australia to examine (a) the difference of density distribution between the two populations, and (b) the simple associations between the other density‐associated factors and the mean mammographic densities of the two populations.
2. MATERIALS AND METHODS
2.1. Data sources
Data of the Chinese participants were gathered from the National Cancer Screening Program in Urban China (defined as cities with a population of more than 1,000,000) (CanSPUC) that started from December 2013. 13 This program targets people who are 40–69 years old and live in residential communities for more than 3 years, and each participant provides a written consent for their data to be used in the program. The program has two phases: (a) A free cancer risk assessment where personal risk for specific cancer is calculated by applying a locally modified version of the Harvard Cancer Risk Index (HCRI) 14 using risk factors and relative risks in the Chinese population. 13 This risk assessment tool is overseen by the Multidisciplinary Steering Committee of the screening program; (b) Inviting individuals identified as high risk in the previous phase for further screening. For breast cancer, women aged 45–69 years undergo both mammography and ultrasound, whereas women younger than 45‐year‐old have an ultrasound examination alone and mammography is only performed for participants whose American College of Radiology Breast Imaging Reporting and Data System (BI‐RADS) assessment category is greater than 2.
Data of the Australian cohort was collected from the National Breast Cancer Foundation BreastScreen Victoria Cohort Demonstration Project (The Lifepool Project). The Lifepool recruits women across Australia and has more than 54,000 participants, the majority of whom coming from the national breast cancer screening program BreastScreen Australia. Any woman around 40 years of age or older who has had, or intends to have, a mammogram with BreastScreen can join the Lifepool, and each participant provides a written consent.
2.2. Study design
This was a retrospective comparative study using existing datasets. This study was approved by the Human Research Ethics Committee of the University of Sydney (Project number 2014/768) and the Ethics Committee of Cancer Institute and Hospital, Chinese Academy of Medical Sciences (Project number 15–062/989). Informed consent was waived because we used existing datasets and all data were de‐identified.
Chinese data were collected from the CanSPUC database, using consecutive sampling, for women who attended CanSPUC program between December 2013 and September 2015. All available women who were aged 45–69 and diagnosed as normal or having benign lesions by expert radiologists using the American College of Radiology Breast Imaging Reporting and Data System (BI‐RADS) assessment classification and had no record of any cancer diagnoses were eligible. 15 Data on women's age, height, weight, age at menarche, parity history, age at first birth, breastfeeding history, breastfeeding duration, menopause status, and age at menopause were obtained from the Risk Assessment Questionnaire completed by all women involved in phase 1 of the screening procedure, and Body Mass Index (BMI) was calculated using height and weight. Corresponding mammograms of these screened women were gathered along with their details and craniocaudal projection of both sides of the breasts was collected for each woman.
Data from the Australian counterparts who underwent a mammographic screening between January 2015 and April 2016 were collected from the Lifepool database. All available women who were aged at 45–69 years old and were diagnosed as breast cancer free at the screening and had no record of any cancer diagnoses were eligible. Demographic and reproductive details and corresponding mammograms as described in the previous paragraph were gathered for the Australian women from the Lifepool Baseline Questionnaire.
2.3. Mammographic density assessment
Mammographic density was assessed by a fully automatic algorithm AutoDensity (version 2.0) that provides both percentage density (in %) and dense area (in number of pixels). In order to segment the projected area of dense tissue within the breast and separate the total area of breast from the rest of the mammogram, AutoDensity automatically catches a threshold for each image and produces total breast area (Figure S1A) and dense area (Figure S1B) using number of pixels. Percentage density is then calculated automatically by dividing dense area by total breast area and multiplying by 100%. This algorithm has been validated and used in previous papers that studied both Chinese and Australian populations. 9 , 16 , 17 The algorithm details have been published previously. 9 , 17
In this study, we converted dense area using number of pixels into dense area using square centimeters. To do so, we extracted the pixel spacing attribute from the DICOM meta‐header. We multiplied the area calculated by AutoDensity in pixels by the horizontal and vertical pixel spacing to produce the area of dense tissue in cm2 using MATLAB and Statistics Toolbox Release 2018b (The MathWorks, Inc.). As mammograms were acquired from different machines built by various manufacturer, images had different pixel spacing attribute, ranging from 0.0004375 cm to 0.001 cm.
2.4. Statistical analysis
Age, BMI, age at menarche, age at first birth, breastfeeding duration, and age at menopause were gathered in continuous format and then recoded into categorical factors. Age was categorized into age groups with 5 years per each age group and BMI was recoded into BMI categories based on the World Health Organization BMI classification. 18 Other continuous variables were categorized into dichotomous variables using optimal cutoff points obtained from receiver operating characteristic curves. Descriptive analysis (frequency and percentage) summarized the characteristics of the two screened populations. This preliminary analysis described the intercountry differences on demographic variables, to summarize the characteristics of the two screened populations. No attempt was made in subsequent analyses to statistically “control” intercountry differences, because to do so would remove from the analysis variance we expected to examine. Also, the sample size did not allow simultaneous “control” of all variables of interest—there would be too many cells with small or zero number.
Student's t‐tests were performed to compare percentage density (PD) and dense area (DA) between all women in both populations. Left and right sides of the breasts and the average value of the two sides were all applied for each metric. A series of t‐tests were also conducted to compare the density discrepancy after separating women into pre‐ and postmenopause status. The differences between the two populations in every age group and every BMI category were also examined using t‐tests.
A series of two‐factor analyses of variance (ANOVA) were conducted to examine if there was an interaction between population (Chinese/Australian) and each variable of interest upon mammographic density, and only average values of PD and DA metrics were applied. The variables of interest were not “controlled” statistically because we were interested in the direct interactions of each variable with population, separately for PD and DA. “Controlling” for a variable removes its variance from the analysis instead of making it the focus of a statistical test.
For all statistical analyses, SPSS (version 24.0, SPSS Inc.) statistical package for Windows was used and two‐tailed tests of significance were employed using a significance level of 0.05.
3. RESULTS
3.1. Differences of mammographic density between the two populations
Data for a total of 3250 Chinese and 1384 Australian women were collected and included in the analysis. The characteristics of the two sample populations were presented in Table S1. The chi‐square tests show variations in these characteristics, and as noted in Section 2.4, no statistical adjustments were made in subsequent analyses for interpopulation differences because the research questions sought to examine rather than explain interpopulation differences.
The differences in means of percentage density and dense area for both left and right breasts and the average value of both sides are shown in Table 1. The percentage density (95% confidence interval [CI]) in Chinese women were 9.51% (8.69%, 10.34%), 9.70% (8.87%, 10.54%), and 9.61% (8.84%, 10.37%) higher than their Australian counterparts for left and right breasts and the average, respectively. Chinese women also had significantly higher dense area compared to Australian females. The mean differences in dense area were 1.75 (0.84, 2.66) cm2, 1.87 (0.98, 2.76) cm2, and 1.81 (1.00, 2.62) cm2 for left and right sides and average values, respectively.
TABLE 1.
Comparison of percentage density (%) and dense area (cm2) for women in China and Australia (means ± standard deviation)
| All | Premenopause | Postmenopause | |||||||
|---|---|---|---|---|---|---|---|---|---|
| Left | Right | Average | Left | Right | Average | Left | Right | Average | |
| Percentage density (%) | |||||||||
| China | 24.75 ± 13.46 | 25.22 ± 13.42 | 24.98 ± 12.45 | 28.01 ± 13.36 | 27.93 ± 13.64 | 27.97 ± 12.35 | 23.06 ± 13.20 | 23.83 ± 13.09 | 23.44 ± 12.22 |
| Australia | 15.23 ± 12.33 | 15.51 ± 12.73 | 15.37 ± 11.48 | 18.97 ± 12.64 | 20.58 ± 15.16 | 19.78 ± 12.76 | 14.14 ± 11.95 | 14.17 ± 11.62 | 14.16 ± 10.79 |
| p‐values | <0.001 | <0.001 | <0.001 | <0.001 | <0.001 | <0.001 | <0.001 | <0.001 | <0.001 |
| Dense area (cm2) | |||||||||
| China | 23.76 ± 12.21 | 24.06 ± 11.67 | 23.91 ± 10.84 | 26.91 ± 12.01 | 26.54 ± 11.44 | 26.73 ± 10.55 | 22.14 ± 12.00 | 22.79 ± 11.59 | 22.69 ± 14.94 |
| Australia | 22.01 ± 18.72 | 22.19 ± 18.80 | 22.10 ± 16.53 | 25.31 ± 15.63 | 27.04 ± 20.55 | 26.18 ± 15.42 | 20.96 ± 19.20 | 20.90 ± 18.11 | 20.93 ± 16.61 |
| p‐values | <0.001 | <0.001 | <0.001 | 0.057 | 0.587 | 0.472 | 0.033 | <0.001 | <0.001 |
In premenopausal women, the percentage differences and 95% CIs were 9.04% (7.34%, 10.74%), 7.35% (5.56%, 9.15%), and 8.20% (6.60%, 9.79%) for left and right sides and the average, respectively, and the differences of dense area between Chinese and Australian populations were not statistically significant. The percentage differences and 95% CI between the two populations changed to 8.92% (7.98%, 9.86%), 9.65% (8.72%, 10.58%), and 9.28% (8.42%, 10.15%) for left, right, and average values in postmenopausal females, and the differences for dense area were 1.18 (0.10, 2.27) cm2, 1.90 (0.86, 2.93) cm2, and 1.76 (0.62, 2.90) cm2, respectively.
3.2. Differences of mammographic density by age group and BMI category between the two populations
Figures 1 displays the means and standard errors of mammographic density across age groups for left, right, and the average values in the two groups of women. The percentage mammographic density in Chinese women was statistically significantly higher (p < 0.001) in each age group than that in Australian females and the mean difference between these two populations generally became smaller with increased age group (Table S2). No statistical difference was found in dense area.
FIGURE 1.

Means of mammographic density across age groups between women in China and Australia (error bars: ± SE). (A) Means of percentage density of left breasts. (B) Means of percentage density of right breasts. (C) Means of percentage density of average values of both breasts. (D) Means of dense area of left breasts. (E) Means of dense area of right breasts. (F) Means of dense area of average values of both breasts
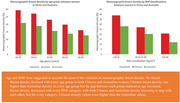
Figures 2 shows the means and standard errors of mammographic density across BMI categories for left, right, and the average values. Except for the left PD in BMI < 18.50 kg/m2 (p = 0.06), the percentage density in each BMI category was statistically significant (p < 0.02) between two populations (Table S3). Percentage density differences in underweight and overweight women were greater than that in women who were in normal range. The statistically significant difference in dense area was only found in women who had BMI ≥ 25.00 kg/m2.
FIGURE 2.
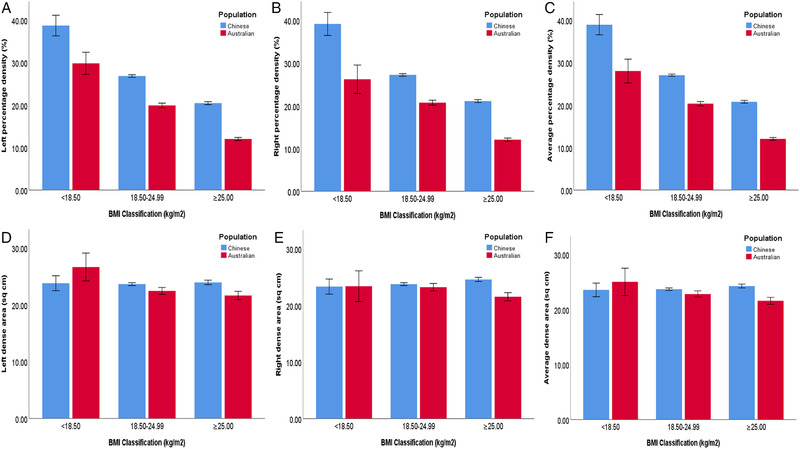
Means of mammographic density across BMI classifications between women in China and Australia (error bars: ± SE). (A) Means of percentage density of left breasts. (B) Means of percentage density of right breasts. (C) Means of percentage density of average values of both breasts. (D) Means of dense area of left breasts. (E) Means of dense area of right breasts. (F) Means of dense area of average values of both breasts
3.3. Interactions between population and factors upon the mammographic density
Figure 3 shows the interactions of population (Chinese/Australian) and each variable of interest upon percentage density. The difference between the mean PD of the Chinese and Australian populations reduced as age group increased (F[4, 4624] = 4.12, p = 0.003). The mean percentage density difference in women in the normal weight range was smaller than that in women who were underweight or overweight (F[2, 4628] = 3.92, p = 0.019). Women who had first birth when less than 25 years old had a larger mean difference in PD compared to women who had their first birth at age of 25 years and above (F[1, 4250] = 11.69, p < 0.001).
FIGURE 3.

Means of average percentage density (%) in Chinese and Australian women. (A) Age group, (B) BMI category, (C) age at menarche, (D) menopause status, (E) age at menopause, (F) parity history, (G) age at first birth, (H) breastfeeding history, and (I) breastfeeding duration
The effects of breastfeeding on PD were completely different in Chinese and Australian women (Figure 3). PD was lower in women who had breastfeeding history compared to those who did not in Chinese women; in contrast, PD was higher in Australian women who had breastfed compared to those had not (F[1, 4479] = 17.79, p < 0.001). Also, the difference between Chinese and Australian women without breastfeeding history was greater than the difference for women who breastfed. In addition, breastfeeding duration had similar opposite effects on mean PD in the Chinese and Australian populations. Chinese women who breastfed for more than 12 months had lower mean PD than those who breastfed for equal to 12 months or fewer, but in Australian women, longer breastfeeding duration was associated with higher mean PD (F[1, 3526] = 66.90, p < 0.001).
No interactions were found between population and parity history (F[1, 4624] = 0.01, p = 0.912), age at menarche (F[1, 4630] = 0.72, p = 0.398), menopause status (F[1, 4605] = 1.45, p = 0.229), and age at menopause (F[1, 3172] = 3.04, p = 0.081) (Figure 3), showing the effects of parity history, age at menarche, menopause status, and age at menopause upon PD of Chinese women were the same for PD of Australian females.
Figure 4 displays the interaction of population and each variable on DA. Interactions were only found for breastfeeding history (F[1, 4479] = 4.79, p = 0.029) and breastfeeding duration (F[1, 3526] = 17.72, p < 0.001) for DA with similar directions as those for PD. There were no interaction effects between population and age group (F[4, 4623] = 1.02, p = 0.394), BMI category (F[2, 4627] = 2.72, p = 0.066), parity history (F[1, 4624] = 0.01, p = 0.912), age at menarche (F[1, 4630] = 0.28, p = 0.594), age at first birth (F[1, 4250] = 3.50, p = 0.062), menopause status (F[1, 4605] = 1.22, p = 0.270), and age at menopause (F[1, 3172] = 1.42, p = 0.233).
FIGURE 4.

Means of average dense area (cm2) in Chinese and Australian women. (A) Age group, (B) BMI category, (C) age at menarche, (D) menopause status (E) age at menopause, (F) parity history, (G) age at first birth, (H) breastfeeding history, and (I) breastfeeding duration
4. DISCUSSION
This work, for the very first time, compared the mammographic density profile for women in China and Australia. Percentage density in Chinese women was found to be approximately 10% higher than that in Australian females and the difference in the dense area between the two populations was around 2 cm2. Each side of the breast also showed density discrepancies between the two populations in both metrics of percentage density and dense area. Menopause has been reported to be a density‐related factor and higher density has been reported for pre‐ compared with postmenopausal women in Chinese and Western populations. 8 , 19 Therefore, we compared the mammographic density between two countries by menopause status and found the density differences were around 8% and 9% in pre‐ and postmenopausal women. We then performed a two‐way ANOVA to examine if the effect of menopause on mammographic density was influenced by population (Chinese or Australian) but no statistically significant interaction was shown, suggesting that menopause has the same impact on mammographic density in both Chinese and Australian females.
Considering that age and BMI accounted for the majority of the variation in percentage density or dense area, 20 , 21 density discrepancies between two populations by age and by BMI were further investigated. Percentage density declined with every age group in both the Chinese and Australian populations. Chinese PD was higher than Australian PD in every age group but the gap between each group lessened as age increased. Likewise, PD reduced with almost every BMI category, with both Chinese and Australian density reducing in step with each other, but for every category, Chinese PDs were higher than the Australian values. Interaction effects between population and age, and between population and BMI, on percentage mammographic density were also found, suggesting ethnic heterogeneity in density variation in relation to age and BMI. However, even though the mean difference of PD between the Chinese and Australian populations reduced as age category increased, the nature of the interaction for BMI is not completely clear and requires further studies.
Other interaction effects with population upon PD were also seen with the age at first birth, breastfeeding history, and duration. Among these factors, the interactions with breastfeeding history and duration were also shown for dense area. All these interactions suggest that the ways in which age, BMI, age at first birth, and breastfeeding impact upon mammographic density in Australian women may not be the same as Chinese women. In particular, breastfeeding had diametrically opposite effects upon PD in the two populations with breastfeeding history and longer duration being protective factors of PD in Chinese women but being risk factors in their Australian counterparts. The evidence from previous studies about the association of breastfeeding and PD is also inconsistent. 22 , 23 , 24 , 25 , 26 , 27 , 28 , 29 In a relatively large study on high‐risk Chinese women, no associations were observed for premenopause women, whereas a protective effect was observed for postmenopausal women. 25 Because in our study a large proportion of the recruited Chinese women was postmenopausal, our finding seems to be in line with the findings reported by Sung et al. 25 Among Australian women, a relatively larger proportion of women with longer breastfeeding duration could have contributed to the observed opposite effect. However, two previous studies conducted in the United States reported findings consistent with our results. One study found a positive association of breastfeeding with absolute dense area in premenopausal women and no associations in postmenopausal women. 24 Another study showed a positive association between duration of breastfeeding and fibroglandular volume among parous women. 26 It should also be noted, however, that recall bias among older women about the duration of the breastfeeding might affect the estimated relationships. Additionally, it should be noted that this opposite effect is a relative effect between two cohorts and our results merely showed breastfeeding duration interacted differently in two populations. Therefore, the “risk factor” effect may not be the real risk factor to Australian women and it might be the case that less breastfeeding duration in Australian women led to a lesser effect on breast density measures compared to Chinese women. However, the real underlying causes of the association will need further research to be clarified.
Even though we used both PD and DA metrics to represent mammographic density in this study, it was very clear that not all the findings were consistent for both metrics. This may be attributed to the substantial dissimilarity in body size and breast composition by ethnicity, with breast sizes being smaller in Chinese compared with Caucasian females. 30 In our study, compared to DA, PD demonstrated additional interactions between population and the factors of interest upon the mammographic density. The usage of PD in our study is similar to those results that previously described that percentage density is an applicable and feasible prognostic (or nonetiological) indicator of breast cancer risk associated to a certain parenchymal pattern. 9 , 31
Even though there are many studies of mammographic density of Chinese women, majority of these works explored Chinese women living in Western countries 32 , 33 , 34 , 35 , 36 , 37 , 38 , 39 , 40 , 41 , 42 , 43 or in Southeast Asia. 29 , 44 , 45 , 46 , 47 , 48 , 49 , 50 , 51 , 52 To the best of our knowledge, only five papers were China‐based work, 13 , 22 , 53 , 54 including one from Hong Kong Special Administrative Region. 55 Almost all of these five studies used women from local/city‐level screening program or hospital‐based data, three studies showed that age was negatively correlated with mammographic density, 13 , 22 , 53 and two of them reported a negative relationship for BMI. 13 , 22 There is only one study that compared mammographic density in women in China to women in Western countries, including Caucasian, Asian, and African American, which found Chinese women had the lowest density compared to all other groups of women aged 50 years old or over, and for women less than 50 years, Chinese density was highest compared to others. 54 However, this finding 54 was both consistent and inconsistent with other studies which reported Chinese women (living in Western nations) having greater mammographic density compared to other ethnicities. 42 , 56 The inconsistency may have resulted from the limited age range applied to the Caucasian group in order to match the Chinese participants (predominately aged less than 50 years old) in the earlier work. 54 In contrast, due to our large dataset we were able to stratify age into 5‐year groups, thus aligning with guidelines from World Health Organization.
There are limitations in this study. We do acknowledge that the Chinese women involved in this study were identified as “women at risk” by the screening program cancer risk assessment using prevalence of risk factors and relative risks in Chinese females. Many of these factors, for example, age at menarche, nulliparity, history of benign breast disease, family history of breast cancer, and previous surgeries of the reproductive system, have been shown to be associated with high breast density. 57 We have estimated that approximately 31% of the total enrolled women in the CanSPUC program were identified at high risk and around 10% women were finally offered mammography examinations, according to the statistics from the CanSPUC 2013–2014. 25 Therefore, despite the large sample size, this work might not fully represent the density profile in a general population. However, given the fact that this national screening program is designed to be risk based because of the large population in China, the findings from our study are likely to be of more benefit to policy makers in China compared to studies focusing on a general Chinese population. Second, we acknowledged that the characteristics of the two populations are different because these samples came from read‐life screening programs. We conducted a descriptive analysis summarizing characteristics on demographic and reproductive variables of the two screened populations. We did not perform any analyses to adjust for any intersample demographic differences, because that would remove the variance we expected to examine as part of the research aims and performing the tests that compared the characteristics of the two samples might divert attention from the study's true focus. It is also noted that our sample size did not allow simultaneous control of all variables of interest because there would be too many cells with small or zero numbers.
In conclusion, this study's comparison of mammographic density between women in China and in Australia explored density distinction by menopause status, age group, and BMI category, providing an insight into the population dependence of mammographic density, as well as other factors related to this variation. As mammographic density has been a long‐established, independent risk factor of breast cancer and if density could become a potential influencer of how screening services are delivered, our findings will provide a better understanding of optimum breast cancer screening approaches and challenge the “one‐size‐fits‐all” strategy. The current breast screening guideline (2019) updated by Chinese Anti‐Cancer Association has limited information on mammographic density. Also as mentioned earlier in the introduction, there has been debate regarding whether mammographic density should be routinely assessed and reported to women in clinical practice, and breast density has gained increased attention since the introduction of density legislation in the United States. Such discussion of density legislation in China, however, should be based on a comprehensive and timely understanding of Chinese mammographic density. Therefore, the findings of this study should be considered by scientists involved in planning of further density‐related research and by policy makers involved in breast screening programs, and may be used to inform the research and policy discussions regarding the implementation, notification, and legislation of mammographic density in risk‐stratified breast screening or personalized screening.
CONFLICT OF INTERESTS
Patrick Brennan declares that he is CEO of DetectED‐X company. Other authors declare no conflict of interest.
ETHICS APPROVAL
This study was approved by the Human Research Ethics Committee of the University of Sydney (Project number 2014/768) and the Ethics Committee of Cancer Institute and Hospital, Chinese Academy of Medical Sciences (Project number 15‐062/989). Informed consent was waived because we used existing datasets and all data were de‐identified.
Supporting information
Figure S1: AutoDensity generated mammographic density. (A) Area of breast within the mammogram. (B) Area of dense tissue within the breast.
Table S1: Descriptive characteristics of women in China and Australia
Table S2: The difference in means and standard error for breast density comparison between Chinese and Australian women by age group.
Table S3: The difference in means and standard error for breast density comparison between Chinese and Australian women by BMI category.
ACKNOWLEDGMENTS
We acknowledge that Lifepool project is funded by National Breast Cancer Foundation grant IF‐15‐004 and we acknowledge the contribution of Lifepool participants and the assistance of Dr. Cameron Wellard, Mr. Grant Lee, and Ms. Lisa Devereux for assistance with data provision of Australian cohort. We acknowledge that Cancer Screening Program in Urban China (CanSPUC) program is funded by Ministry of Finance and National Health Commission, the People's Republic of China.
Open Access Funding provided by The University of Sydney.
[Correction added on 14 May 2022, after first online publication: CAUL funding statement has been added.]
Li T, Li J, Heard R, et al. Understanding mammographic breast density profile in China: A Sino‐Australian comparative study of breast density using real‐world data from cancer screening programs. Asia-Pac J Clin Oncol. 2022;18:696–705. 10.1111/ajco.13763
Tong Li and Jing Li share the joint first authorship.
Min Dai and Patrick Brennan share the joint last authorship.
Present address
Tong Li, School of Public health, Faculty of Medicine and Health, The University of Sydney, Edward Ford Building, Fisher Road, Camperdown NSW 2006, Australia.
Contributor Information
Tong Li, Email: t.li@sydney.edu.au.
Min Dai, Email: daimin2002@hotmail.com.
DATA AVAILABILITY STATEMENT
The data that support the findings of this study are available from National Cancer Screening Program in Urban China (CanSPUC) in China and the Lifepool Project in Australia but restrictions apply to the availability of these data, which were used under license for the current study, and so are not publicly available. Requests to access these datasets should be directed to Professor Min Dai (daimin2002@hotmail.com) for CanSPUC data and Ms. Lisa Devereux (lisa.devereux@petermac.org) for Lifepool data.
REFERENCES
- 1. Li T, Mello‐Thoms C, Brennan PC. Descriptive epidemiology of breast cancer in China: incidence, mortality, survival and prevalence. Breast Cancer Res Treat. 2016;159(3):395‐406. [DOI] [PubMed] [Google Scholar]
- 2. Chen W, Sun K, Zheng R, et al. Cancer incidence and mortality in China, 2014. Chin J Cancer Res. 2018;30(1):1‐12. [DOI] [PMC free article] [PubMed] [Google Scholar]
- 3. Fan L, Strasser‐Weippl K, Li J‐J, et al. Breast cancer in China. Lancet Oncol. 2014;15(7):e279‐e289. [DOI] [PubMed] [Google Scholar]
- 4. McCormack VA, Dos Santos Silva I. Breast density and parenchymal patterns as markers of breast cancer risk: a meta‐analysis. Cancer Epidemiol Biomarkers Prev. 2006;15(6):1159‐1169. [DOI] [PubMed] [Google Scholar]
- 5. Boyd NF, Guo H, Martin LJ, et al. Mammographic density and the risk and detection of breast cancer. N Engl J Med. 2007;356(3):227‐236. [DOI] [PubMed] [Google Scholar]
- 6. Huo CW, Chew GL, Britt KL, et al. Mammographic density—a review on the current understanding of its association with breast cancer. Breast Cancer Res Treat. 2014;144(3):479‐502. [DOI] [PubMed] [Google Scholar]
- 7. Holland K, van Gils CH , Mann RM, et al. Quantification of masking risk in screening mammography with volumetric breast density maps. Breast Cancer Res Treat. 2017;162(3):541‐548. [DOI] [PMC free article] [PubMed] [Google Scholar]
- 8. Li T, Li J, Dai M, et al. Mammographic density and associated predictive factors for Chinese women. Breast J. 2018;24(3):444‐445. [DOI] [PubMed] [Google Scholar]
- 9. Li T, Tang L, Gandomkar Z, et al. Characteristics of mammographic breast density and associated factors for Chinese women: results from an automated measurement. J Oncol. 2019;2019:4910854. [DOI] [PMC free article] [PubMed] [Google Scholar]
- 10. Cappello NM, Richetelli D, Lee CI. The impact of breast density reporting laws on Women's awareness of density‐associated risks and conversations regarding supplemental screening with providers. J Am Coll Radiol. 2019;16(2):139‐146. [DOI] [PubMed] [Google Scholar]
- 11. BreastScreen WA. BreastScreen WA information for women dense breasts. Australian Department of Health; 2016. [Google Scholar]
- 12. McCormack VA, Burton A, Dos‐Santos‐Silva I, et al. International Consortium on Mammographic Density: methodology and population diversity captured across 22 countries. Cancer Epidemiol. 2016;40:141‐151. [DOI] [PMC free article] [PubMed] [Google Scholar]
- 13. Sung H, Ren J, Li J, et al. Breast cancer risk factors and mammographic density among high‐risk women in urban China. NPJ Breast Cancer. 2018;4(1):3‐3. [DOI] [PMC free article] [PubMed] [Google Scholar]
- 14. Colditz G, Atwood K, Emmons K, et al. Harvard report on cancer prevention volume 4: Harvard cancer risk index. Cancer Causes Control. 2000;11(6):477‐488. [DOI] [PubMed] [Google Scholar]
- 15. Sickles EA, D'Orsi CJ, Bassett LW, et al. ACR BI‐RADS Mammography. In: ACR BI‐RADS Atlas, Breast Imaging Reporting and Data System. Reston, VA, American College of Radiology; 2013. [Google Scholar]
- 16. Li T, Tang L, Gandomkar Z, et al. Mammographic density and other risk factors for breast cancer among women in China. Breast J. 2018;24(3):426‐428. [DOI] [PubMed] [Google Scholar]
- 17. Nickson C, Arzhaeva Y, Aitken Z, et al. AutoDensity: an automated method to measure mammographic breast density that predicts breast cancer risk and screening outcomes. Breast Cancer Res. 2013;15(5):R80. [DOI] [PMC free article] [PubMed] [Google Scholar]
- 18. World Health Organization . 2017. BMI classification. Accessed March 5, 2019. http://apps.who.int/bmi/index.jsp
- 19. Boyd N, Martin L, Stone J, Little L, Minkin S, Yaffe M. A longitudinal study of the effects of menopause on mammographic features. Cancer Epidemiol Biomarkers Prev. 2002;11(10):1048‐1053. [PubMed] [Google Scholar]
- 20. Stone J, Warren RML, Pinney E, Warwick J, Cuzick J. Determinants of percentage and area measures of mammographic density. Am J Epidemiol. 2009;170(12):1571‐1578. [DOI] [PubMed] [Google Scholar]
- 21. Stone J, Ding J, Warren RMI, Duffy SW, Hopper JL. Using mammographic density to predict breast cancer risk: dense area or percentage dense area. Breast Cancer Res. 2010;12(6):R97. [DOI] [PMC free article] [PubMed] [Google Scholar]
- 22. Yang Y, Liu J, Gu R, et al. Influence of factors on mammographic density in premenopausal Chinese women. Eur J Cancer Prev. 2016;25(4):306‐311. [DOI] [PubMed] [Google Scholar]
- 23. Ishihara S, Taira N, Kawasaki K, et al. Association between mammographic breast density and lifestyle in Japanese women. Acta Med Okayama. 2013;67(3):145‐151. [DOI] [PubMed] [Google Scholar]
- 24. Prebil LA, Ereman RR, Powell MJ, et al. First pregnancy events and future breast density: modification by age at first pregnancy and specific VEGF and IGF1R gene variants. Cancer Causes Control. 2014;25(7):859‐868. [DOI] [PMC free article] [PubMed] [Google Scholar]
- 25. Sung H, Ren J, Li J, et al. Breast cancer risk factors and mammographic density among high‐risk women in urban China. NPJ Breast Cancer. 2018;4(1):3‐12. [DOI] [PMC free article] [PubMed] [Google Scholar]
- 26. Yaghjyan L, Colditz GA, Rosner B, Bertrand KA, Tamimi RM. Reproductive factors related to childbearing and mammographic breast density. Breast Cancer Res Treat. 2016;158(2):351‐359. [DOI] [PMC free article] [PubMed] [Google Scholar]
- 27. Riza E, Dos Santos Silva I, De Stavola B, et al. Correlates of high‐density mammographic parenchymal patterns by menopausal status in a rural population in Northern Greece. Eur J Cancer. 2005;41(4):590‐600. [DOI] [PubMed] [Google Scholar]
- 28. Sung J, Song Y‐M, Stone J, Lee K, Lee D. Reproductive factors associated with mammographic density: a Korean co‐twin control study. Breast Cancer Res Treat. 2011;128:567‐572. [DOI] [PubMed] [Google Scholar]
- 29. Ursin G, Sun C‐L, Koh W‐P, et al. Associations between soy, diet, reproductive factors, and mammographic density in Singapore Chinese women. Nutr Cancer. 2006;56(2):128‐135. [DOI] [PubMed] [Google Scholar]
- 30. Lim L, Ho PJ, Liu J, et al. Determinants of breast size in Asian women. Sci Rep. 2018;8(1):1201‐1201. [DOI] [PMC free article] [PubMed] [Google Scholar]
- 31. Haars G, Van Noord PAH, Van Gils CH, Grobbee DE, Peeters PHM. Measurements of breast density: no ratio for a ratio. Cancer Epidemiol Biomarkers Prev. 2005;14(11):2634‐2640. [DOI] [PubMed] [Google Scholar]
- 32. Heller SL, Hudson S, Wilkinson LS. Breast density across a regional screening population: effects of age, ethnicity and deprivation. Br J Radiol. 2015;88(1055):20150242. [DOI] [PMC free article] [PubMed] [Google Scholar]
- 33. Tseng M, Byrne C, Kurzer MS, Fang CY. Equol‐producing status, isoflavone intake, and breast density in a sample of U.S. Chinese women. Cancer Epidemiol Biomarkers Prev. 2013;22(11):1975‐1983. [DOI] [PMC free article] [PubMed] [Google Scholar]
- 34. Tseng M, Olufade TO, Evers KA, Byrne C. Adolescent lifestyle factors and adult breast density in U.S. Chinese immigrant women. Nutr Cancer. 2011;63(3):342‐349. [DOI] [PMC free article] [PubMed] [Google Scholar]
- 35. Tseng M, Byrne C. Adiposity, adult weight gain and mammographic breast density in US Chinese women. Int J Cancer. 2011;128(2):418‐425. [DOI] [PMC free article] [PubMed] [Google Scholar]
- 36. Crandall CJ, Sehl ME, Crawford SL, et al. Sex steroid metabolism polymorphisms and mammographic density in pre‐ and early perimenopausal women. Breast Cancer Res. 2009;11(4):R51. [DOI] [PMC free article] [PubMed] [Google Scholar]
- 37. Reeves KW, Stone RA, Modugno F, et al. Longitudinal association of anthropometry with mammographic breast density in the Study of Women's Health Across the Nation. Int J Cancer. 2009;124(5):1169‐1177. [DOI] [PMC free article] [PubMed] [Google Scholar]
- 38. Oestreicher N, Capra A, Bromberger J, et al. Physical activity and mammographic density in a cohort of midlife women. Med Sci Sports Exerc. 2008;40(3):451–456. [DOI] [PubMed] [Google Scholar]
- 39. Crandall CJ, Zheng Y, Karlamangla A, et al. The association between mammographic breast density and bone mineral density in the study of Women's Health Across the Nation. Ann Epidemiol. 2007;17(8):575‐583. [DOI] [PubMed] [Google Scholar]
- 40. Habel AL, Capra AM, Oestreicher N, et al. Mammographic density in a multiethnic cohort. Menopause. 2007;14(5):891‐899. [DOI] [PubMed] [Google Scholar]
- 41. Tseng M, Byrne C, Evers KA, Thomas London W, Daly MB. Acculturation and breast density in foreign‐born, U.S. Chinese women. Cancer Epidemiol Biomarkers Prev. 2006;15(7):1301–1305. [DOI] [PubMed] [Google Scholar]
- 42. Maskarinec G, Meng L, Ursin G. Ethnic differences in mammographic densities. Int J Epidemiol. 2001;30(5):959‐965. [DOI] [PubMed] [Google Scholar]
- 43. Maskarinec G, Meng L. A case‐control study of mammographic densities in Hawaii. Breast Cancer Res Treat. 2000;63(2):153‐161. [DOI] [PubMed] [Google Scholar]
- 44. Mariapun S, Ho WK, Kang PCE, et al. Variants in 6q25.1 are associated with mammographic density in Malaysian Chinese Women. Cancer Epidemiol Biomarkers Prev. 2016;25(2):327–333. [DOI] [PubMed] [Google Scholar]
- 45. Mariapun S, Li J, Yip CH, Taib NAM, Teo S‐H. Ethnic differences in mammographic densities: an Asian cross‐sectional study. PLoS ONE. 2015;10(2):e0117568. [DOI] [PMC free article] [PubMed] [Google Scholar]
- 46. Ozhand A, Lee E, Wu AH, et al. Variation in inflammatory cytokine/growth‐factor genes and mammographic density in premenopausal women aged 50–55. PLoS ONE. 2013;8(6):e65313. [DOI] [PMC free article] [PubMed] [Google Scholar]
- 47. Lee E, Su Y‐C, Lewinger JP, et al. Hormone metabolism genes and mammographic density in Singapore Chinese women. Cancer Epidemiol Biomarkers Prev. 2013;22(5):984–986. [DOI] [PMC free article] [PubMed] [Google Scholar]
- 48. Lee E, Van Den Berg D, Hsu C, et al. Genetic variation in transforming growth factor beta 1 and mammographic density in Singapore Chinese women. Cancer Res. 2013;73(6):1876‐1882. [DOI] [PMC free article] [PubMed] [Google Scholar]
- 49. Lee E, Hsu C, Van Den Berg D, et al. Genetic variation in peroxisome proliferator‐activated receptor gamma, soy, and mammographic density in Singapore Chinese women. Cancer Epidemiol Biomarkers Prev. 2012;21(4):635‐644. [DOI] [PMC free article] [PubMed] [Google Scholar]
- 50. Wu AH, Ursin G, Koh W‐P, et al. Green tea, soy, and mammographic density in Singapore Chinese women. Cancer Epidemiol Biomarkers Prev. 2008;17(12):3358‐3365. [DOI] [PMC free article] [PubMed] [Google Scholar]
- 51. Heng D, Gao F, Jong R, et al. Risk factors for breast cancer associated with mammographic features in Singaporean Chinese women. Cancer Epidemiol Biomarkers Prev. 2004;13(11):1751‐1758. [PubMed] [Google Scholar]
- 52. Duffy SW, Jakes R, Ng FCHI, Gao F. Interaction of dense breast patterns with other breast cancer risk factors in a case‐control study. Br J Cancer. 2004;91(2):233‐236. [DOI] [PMC free article] [PubMed] [Google Scholar]
- 53. Liu J, Liu P‐F, Li J‐N, et al. Analysis of mammographic breast density in a group of screening Chinese women and breast cancer patients. Asian Pac J Cancer Prev. 2014;15(15):6411‐6414. [DOI] [PubMed] [Google Scholar]
- 54. Dai H, Yan Y, Wang P, et al. Distribution of mammographic density and its influential factors among Chinese women. Int J Epidemiol. 2014;43(4):1240‐1251. [DOI] [PMC free article] [PubMed] [Google Scholar]
- 55. Lai CWK, Law HKW. Mammographic breast density in Chinese women: spatial distribution and autocorrelation patterns. PLoS ONE. 2015;10:e0136881. [DOI] [PMC free article] [PubMed] [Google Scholar]
- 56. Heller SL, Hudson S, Wilkinson LS. Breast density across a regional screening population: effects of age, ethnicity and deprivation. Br J Radiol. 2015;88:20150242. [DOI] [PMC free article] [PubMed] [Google Scholar]
- 57. Boyd NF, Martin LJ, Yaffe MJ, Minkin S. Mammographic density and breast cancer risk: current understanding and future prospects. Breast Cancer Res. 2011;13(6):223‐223. [DOI] [PMC free article] [PubMed] [Google Scholar]
Associated Data
This section collects any data citations, data availability statements, or supplementary materials included in this article.
Supplementary Materials
Figure S1: AutoDensity generated mammographic density. (A) Area of breast within the mammogram. (B) Area of dense tissue within the breast.
Table S1: Descriptive characteristics of women in China and Australia
Table S2: The difference in means and standard error for breast density comparison between Chinese and Australian women by age group.
Table S3: The difference in means and standard error for breast density comparison between Chinese and Australian women by BMI category.
Data Availability Statement
The data that support the findings of this study are available from National Cancer Screening Program in Urban China (CanSPUC) in China and the Lifepool Project in Australia but restrictions apply to the availability of these data, which were used under license for the current study, and so are not publicly available. Requests to access these datasets should be directed to Professor Min Dai (daimin2002@hotmail.com) for CanSPUC data and Ms. Lisa Devereux (lisa.devereux@petermac.org) for Lifepool data.