

Abstract
Background and Aims
Liver regeneration (LR) is vital for the recovery of liver function after hepatectomy. Limited regeneration capacity, together with insufficient remnant liver volume, is a risk factor for posthepatectomy liver failure (PHLF) resulting from small‐for‐size syndrome. Although inflammation plays an important role in controlling LR, the underlying mechanisms still remain obscure.
Approach and Results
We identified C‐C motif chemokine ligand (CCL) 5 as an important negative regulator for LR. CCL5 levels were elevated after partial hepatectomy (PHx), both in healthy donors of living donor liver transplantation (LT) and PHx mouse models. Ccl5 knockout mice displayed improved survival after 90% PHx and enhanced LR 36 h after 70% PHx. However, primary hepatocytes from Ccl5−/− mice exposed to growth factors in vitro showed no proliferation advantage compared to those from wild‐type (WT) mice. Flow cytometry analysis showed that proportions of Ly6Clo macrophages were significantly increased in Ccl5−/− mice after 70% PHx. RNA‐sequencing analysis revealed that sorted macrophages (CD11b+Ly6Clo&hi) manifested enhanced expression of reparative genes in Ccl5−/− mice compared to WT mice. Mechanistically, CCL5 induced macrophages toward proinflammatory Ly6Chi phenotype, thereby inhibiting the production of hepatocyte growth factor (HGF) through the C‐C motif chemokine receptor (CCR) 1– and CCR5‐mediated forkhead box O (FoxO) 3a pathways. Finally, blockade of CCL5 greatly optimized survival and boosted LR in the mouse PHx model.
Conclusions
Our findings suggest that inhibition of CCL5 is a promising strategy to improve regeneration restoration by enhancing HGF secretion from reparative macrophages through the FoxO3a pathway, which may potentially reduce the mortality of PHLF.
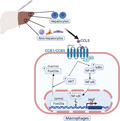
Schematic diagram of CCL5 downregulating reparative macrophage‐derived HGF in a FoxO3a dependent manner after PHx. Increased CCL5 secretion from either hepatocytes or non‐hepatocytes may impede Hgf transcription in reparative macrophages via CCR1‐ and CCR5‐mediated FoxO3a signaling instead of NF‐κB at the proliferation phase when subjected to PHx.
Abbreviations
- AKT
protein kinase B
- ALT
alanine aminotransferase
- APAP
acetaminophen
- AST
aspartate aminotransferase
- CCL
C‐C motif chemokine ligand
- Ccnb1
cyclin B1
- CCR
C‐C motif chemokine receptor
- ChIP
chromatin immunoprecipitation
- CXCL2
C‐X‐C motif chemokine ligand 2
- EGF
epidermal growth factor
- Ep300
E1A‐binding protein P300
- FoxO
forkhead box O
- Gadd45a
growth arrest and DNA damage‐inducible alpha
- HGF
hepatocyte growth factor
- HNF4α
hepatocyte nuclear factor 4 alpha
- IF
immunofluorescence
- IHC
immunohistochemical
- KC
Kupffer cell
- KEGG
Kyoto Encyclopedia of Genes and Genomes
- KO
knockout
- LDLT
living donor liver transplantation
- LPS
lipopolysaccharide
- LR
liver regeneration
- LSEC
liver sinusoidal endothelial cell
- LT
liver transplantation
- Ly6Chi
classically activated macrophage
- Ly6Clo
alternatively activated macrophage
- MoMF
monocyte‐derived macrophage
- Mrc1
mannose receptor C‐type 1
- Nos2
nitric oxide synthase 2
- p‐AKT
phosphorylated AKT
- PCNA
proliferating cell nuclear antigen
- p‐FoxO1/4
phosphorylated FoxO1/4
- p‐FoxO3a
phosphorylated FoxO3a
- PHLF
posthepatectomy liver failure
- PHx
partial hepatectomy
- p‐IκBα
phosphorylated nuclear factor of kappa light polypeptide gene enhancer in B‐cells inhibitor, alpha
- p‐NF‐κB
phosphorylated NF‐κB
- Ptgs2
prostaglandin‐endoperoxide synthase 2
- Retnla
resistin‐like alpha protein
- rmCCL5
recombinant mouse CCL5
- RNA‐seq
RNA‐sequencing
- S1pr1
sphingosine‐1‐phosphate receptor 1
- STAT3
signal transducer and transducer 3
- WT
wild type
- Zap70
zeta chain of T‐cell receptor‐associated protein kinase 70
INTRODUCTION
Primary liver cancer is one of the most common malignant tumors worldwide, accounting for >800,000 cancer‐associated deaths per year.[ 1 ] Partial hepatectomy (PHx) is currently the main clinical treatment for liver cancer[ 2 ]; however, the incidence of perioperative liver failure, which is the most serious complication and main cause of death, is 1.2%–11.0% and is closely related to “small‐for‐size” syndrome following major hepatectomy.[ 3 , 4 ] Living donor liver transplantation (LDLT) also requires that PHx be conducted, but in healthy persons, and hence it is of utmost importance to ensure donors’ safety.[ 5 ] Unfortunately, morbidity and mortality rates are 10%–21% and 0.18%–0.50%, respectively, partly attributable to insufficient remnant functional liver volume.[ 6 , 7 , 8 ] Recovery of patients following a hepatectomy relies on the remarkable regenerative capacity of the liver, which is one of the few organs with this property.[ 9 ] Therefore, an improved understanding of the molecular and cellular mechanisms underlying liver regeneration (LR) after PHx is urgently required.
Macrophages are critical components of the innate immune system, and their activation is essential for the initiation of LR.[ 9 ] Infiltrated macrophages can differentiate into two subtypes in response to environmental signals, namely classically activated proinflammatory macrophages (Ly6Chi) and alternatively activated reparative macrophages (Ly6Clo).[ 10 ] The former exacerbates tissue injury by secreting TNF‐α, IL‐1β, IL‐6, and IL‐12, whereas the latter can resist inflammation and facilitate wound repair through immune‐modulatory mediators, such as IL‐10, TGF‐β1, IL‐4, IL‐13, and VEGF‐α.[ 11 , 12 ] Recent studies have shown that the cytokines produced by polarized macrophages may regulate liver repair and regeneration after hepatectomy.[ 13 , 14 ] However, the specific roles of Ly6Clo and Ly6Chi macrophages and their secreted cytokines in LR remain unclear.
C‐C motif chemokine ligand (CCL) 5, also known as regulated upon activation, normal T cell expressed and presumably secreted, induces the migration of leukocytes to sites of inflammation by binding the transmembrane G‐protein‐coupled receptors, C‐C motif chemokine receptor (CCR) 1, CCR3, and CCR5.[ 15 , 16 ] CCL5 is expressed by various cell types, including platelets, macrophages, eosinophils, fibroblasts, endothelial cells, epithelial cells, and endometrial cells, and has been implicated in liver diseases such as acute liver failure, viral hepatitis, fibrosis, cirrhosis, HCC, and NAFLD.[ 15 , 17 ] Previously, we reported that CCL5 inhibition can significantly accelerate liver repair by promoting hepatocyte proliferation in a mouse model of acetaminophen (APAP)‐induced liver injury.[ 18 ] Unfortunately, few studies have investigated the role of CCL5 in LR after PHx.
Here, we examined the effect and underlying mechanism of Ccl5 deficiency regulating hepatocyte proliferation, inflammation resolution, and posthepatectomy survival through macrophage plasticity in a mouse model of PHx. Together, our findings suggest that CCL5 inhibition could be a promising strategy to balance inflammation and restoration during hepatic regeneration by regulating macrophage polarization.
MATERIALS AND METHODS
Patient samples
All blood samples used in this study were collected from Xinhua Hospital Affiliated to Shanghai Jiao Tong University School of Medicine (Shanghai, China). Blood was obtained from healthy donors of LDLT 24 h before PHx and both 24 and 48 h after PHx. All donors provided written informed consent. All experiments using human samples were approved by the Ethics Committee of Xinhua Hospital.
Mice
Ccl5 knockout (KO) mice were obtained from The Jackson Laboratory (Bar Harbor, ME). Experimental Ccl5−/− and wild‐type (WT) littermate controls were generated by crossing Ccl5+/− mice. All mouse strains had a C57BL/6J background and were housed under specific pathogen‐free conditions with controlled temperature and humidity. All animal procedures were conducted according to the Guide for the Care and Use of Laboratory Animals and were approved by the Animal Care and Use Committee of Shuguang Hospital Affiliated to Shanghai University of Traditional Chinese Medicine (Shanghai, China).
Chromatin immunoprecipitation assay
Chromatin immunoprecipitation (ChIP) assays were conducted using the ChIP kit (Beyotime, Shanghai, China). RAW264.7 cells (a mouse macrophage cell line) were treated with or without recombinant mouse CCL5 (rmCCL5; 100 ng/ml) for 30 minutes. The reaction was terminated with glycine for 5 minutes at 20°C, and cells were washed twice by cold PBS with 1 mM of phenylmethylsulfonyl fluoride. The precipitated DNA fragments were extracted and analyzed by PCR.
RNA‐sequencing analysis
Macrophages sorted were treated with TRIzol (Invitrogen, Carlsbad, CA), and total RNA was extracted using the RNeasy Plus Mini Kit (Qiagen, Hilden, Germany). Libraries were constructed using a TruSeq Stranded mRNA LT Sample Prep Kit (Illumina, San Diego, CA), according to the manufacturer’s instructions. After RNA integrity had been assessed using an Agilent 2100 Bioanalyzer (Agilent Technologies, Santa Clara, CA), it was sequenced using an Illumina HiSeqTM 2500 platform.
Statistical analysis
All data are presented as the mean ± SEM of at least three biological replicates per group. Data were analyzed using Student t tests for only two groups and one‐way ANOVA tests for multiple groups. p values <0.05 were considered statistically significant.
Detailed materials and methods are provided in the Supporting Information.
RESULTS
CCL5 level increases significantly after PHx
To investigate the potential role of CCL5 in LR, we initially measured CCL5 levels in the serum of healthy donors of LDLT before and after PHx. Notably, CCL5 expression was significantly higher 24 and 48 h after PHx than before PHx (n = 10; Figure 1A). To confirm that CCL5 was up‐regulated in the PHx model, we examined CCL5 expression in mouse liver tissues and serum by qPCR and ELISA. CCL5 expression was significantly up‐regulated in both liver tissues and serum samples at 3 h and peaked at 24 and 36 h, respectively (Figure 1B,C). Immunohistochemical (IHC) staining further revealed that CCL5 expression was significantly increased in hepatocytes and nonhepatocytes after PHx (Figure 1D).
FIGURE 1.
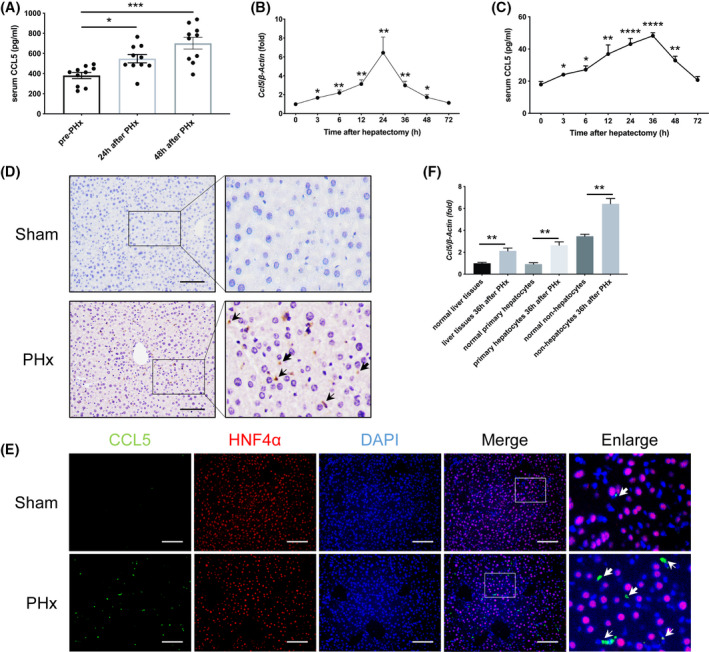
CCL5 levels are significantly increased in healthy donors of LDLT and the mouse model after PHx. (A) ELISA analysis of serum CCL5 levels in healthy donors of LDLT before and after PHx (n = 10 per group). Serum CCL5 levels were significantly elevated 24 and 48 h after PHx. (B,C) CCL5 mRNA and protein levels in mice at different time points after PHx (n = 4–6 per group). CCL5 expression peaked 24–36 h after PHx. (D) Representative IHC images of hepatic CCL5 expression in mice 36 h after PHx and in the sham group. CCL5 protein was distributed in the cytoplasm of hepatocytes and nonhepatocytes, and levels were significantly higher after PHx. Thick arrows represent hepatocyte‐secreted CCL5. Thin arrows represent non‐hepatocyte‐derived CCL5. (E) Representative IF costaining images of CCL5 (green), HNF4α (red), and DAPI (blue) in mice 36 h after PHx and in the sham group. CCL5 was expressed in both hepatocytes (HNF4α positive) and nonhepatocytes (HNF4α negative). Thick arrows represent hepatocyte‐secreted CCL5. Thin arrows represent non‐hepatocyte‐derived CCL5. (F) Relative Ccl5 mRNA expression in liver tissues, primary hepatocytes, and nonhepatocytes 36 h after PHx (n = 4 per group). Ccl5 expression was significantly higher in liver tissues, hepatocytes, and nonhepatocytes after PHx compared to the sham group. Data represent the mean ± SEM. *p < 0.05; **p < 0.01; ***p < 0.001; ****p < 0.0001. Scale bar = 100 μm
To determine the origin of CCL5, we performed double immunofluorescence (IF) staining with anti‐CCL5 and anti–hepatocyte nuclear factor 4 alpha (HNF4α) antibodies, finding that CCL5 was expressed in both HNF4α‐positive and ‐negative cells (Figure 1E). Therefore, we explored changes in Ccl5 mRNA expression in hepatocytes and nonhepatocytes. qPCR analysis revealed that Ccl5 transcription was enhanced in both hepatocytes and nonhepatocytes after PHx compared to the sham group (Figure 1F). Together, these data indicate that CCL5 expression is significantly elevated after PHx and that Ccl5 has distinct cellular origins in the PHx model.
Ccl5 deletion advances the peak of hepatocyte proliferation after PHx
To explore the possible role of CCL5 in LR, we performed PHx in WT and Ccl5−/− mice. Average body weight, liver weight, and liver‐to‐body weight ratio were comparable between two groups of mice before PHx (Figure S1A); however, Ccl5−/− mice subjected to 90% PHx achieved improved survival compared to WT mice (Figure 2A). In the 70% PHx model, no obvious tissue damage was observed under the microscope in either WT or Ccl5−/− mice at the indicated time points (Figure S1B), and all mice survived until euthanization. Interestingly, Ccl5−/− mice displayed better liver function with lower alanine aminotransferase (ALT) and aspartate aminotransferase (AST) 36 h after PHx (Figure S1C,D) as well as a higher liver‐to‐body weight ratio than WT mice, yet this difference became comparable after 48 h (Figure 2B).
FIGURE 2.
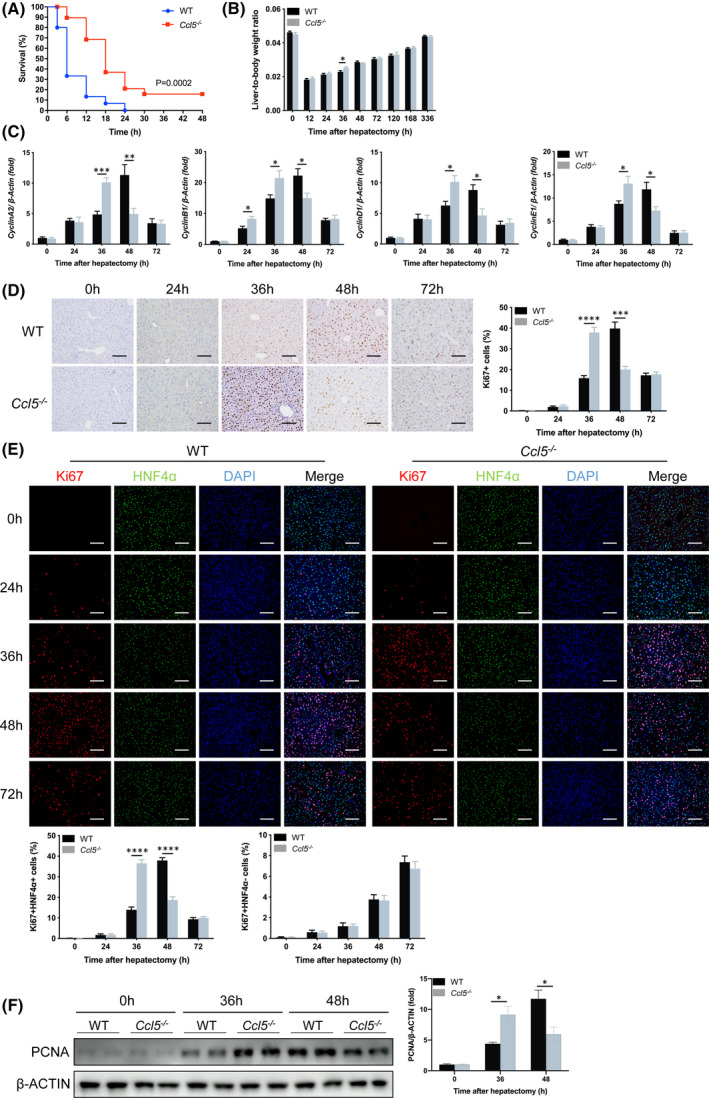
Ccl5 deletion advances maximum hepatocyte proliferation during LR. (A) Survival curve of WT and Ccl5−/− mice in response to lethal 90% PHx (n = 15–19 per group). The overall survival rate of Ccl5−/− mice was significantly higher than that of WT mice, starting 3 h after 90% PHx. (B) Liver‐to‐body weight ratio at the indicated time points after 70% PHx (n = 4–6 per group). Liver‐to‐body weight ratio of Ccl5−/− mice was significantly higher 36 h after PHx than in WT mice. (C) CyclinA2, CyclinB1, CyclinD1, and CyclinE1 mRNA expressions were increased in Ccl5−/− mice 36 h after PHx (n = 4–6 per group). (D) Representative IHC staining images of Ki67 and the quantification of Ki67‐positive cells in liver sections (n = 4–6 per group). Peak LR in Ccl5−/− mice was around 12 h earlier than in WT mice. (E) Representative IF costaining of Ki67 (red), HNF4α (green), and DAPI (blue) and the quantification of Ki67‐positive cells (n = 4–6 per group). There were significantly more HNF4α and Ki67 double‐positive cells in Ccl5−/− mice than in WT mice 36 h after PHx; however, the hepatocyte proliferation rate was higher in WT mice than in Ccl5−/− mice at 48 h. No difference in nonhepatocyte proliferation was observed between the two groups at any time point from 0 to 72 h. (F) Western blotting analysis of PCNA expression in WT and Ccl5−/− mice 36 and 48 h after PHx (n = 4 per group). PCNA expression was significantly higher in liver tissues of Ccl5−/− mice 36 h after PHx than in WT mice. Data represent the mean ± SEM. *p < 0.05; ***p < 0.001; ****p < 0.0001. Scale bar = 100 μm
CyclinA2, CyclinB1, CyclinD1, and CyclinE1 gene expression was significantly higher in Ccl5−/− mice than in WT mice 36 h after PHx, suggesting enhanced G1 to S transition (Figure 2C). Consistently, similar results were obtained by IHC staining for Ki67 in Ccl5−/− mice (Figure 2D). To clarify hepatocyte‐specific proliferation levels, we performed IF costaining for HNF4α and Ki67, which was consistent with these results (Figure 2E). Proliferating cell nuclear antigen (PCNA) protein levels were also significantly higher 36 h after PHx, as measured by western blotting (Figure 2F). Collectively, these findings indicate that Ccl5 may delay the maximum proliferative activity of hepatocytes after PHx.
Ccl5 deficiency does not influence the initiation of LR after PHx
To determine whether CCL5 participates in the initiation of LR, we measured the gene expression of CyclinA2, CyclinB1, CyclinD1, and CyclinE1, as well as PCNA levels in liver tissues, finding no observable differences between WT and Ccl5−/− mice (Figure 3A,B). Similarly, there were no significant differences in percentages of neutrophils, monocyte‐derived macrophages (MoMFs), and Kupffer cells (KCs) in WT and Ccl5−/− mice during the priming phase of LR (Figure 3C,D).
FIGURE 3.
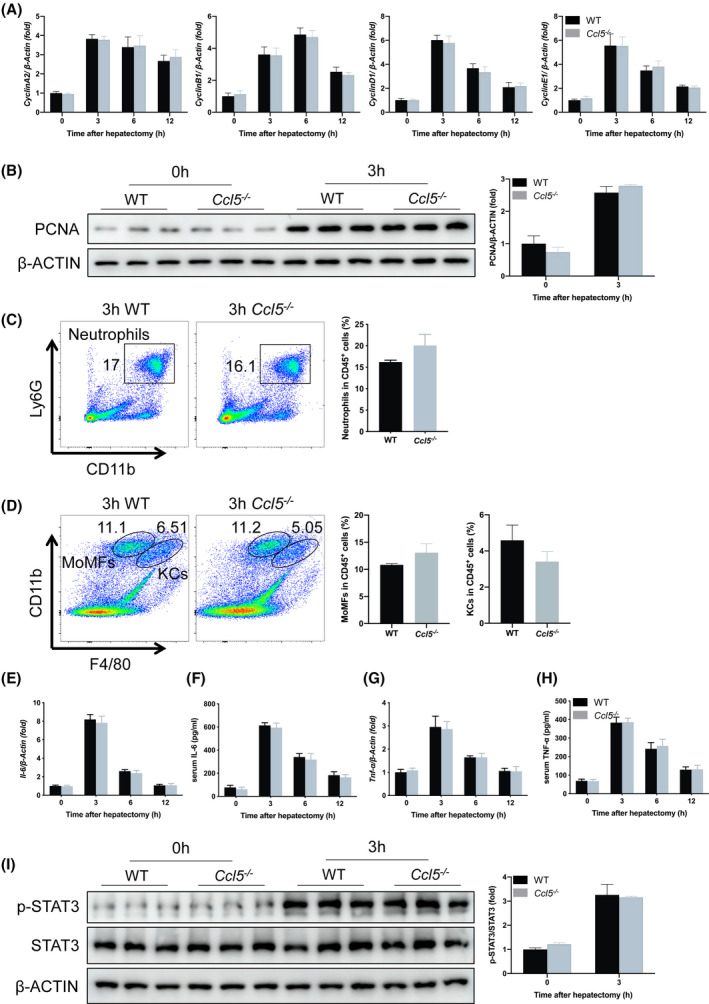
Ccl5 deficiency does not alter the initiation of LR after PHx. (A) CyclinA2, CyclinB1, CyclinD1, and CyclinE1 mRNA expression in WT and Ccl5−/− mice 0–12 h after PHx (n = 4 per group). Gene expression was comparable between the two groups. (B) PCNA protein expression 3 h after PHx (n = 3 per group). Liver tissue PCNA expression did not differ between WT and Ccl5−/− mice. (C) Representative FACS plots and neutrophil quantification in liver 3 h after PHx (n = 4 per group). The proportion of neutrophils did not differ significantly between WT and Ccl5−/− mice. (D) Representative FACS plots and the quantification of MoMFs and KCs in liver 3 h after PHx (n = 4 per group). There were similar proportions of MoMFs and KCs in Ccl5−/− and WT mice. (E,F) IL‐6 mRNA and protein expression at the indicated time points after 70% PHx (n = 4 per group). IL‐6 expression was similar in WT mice and Ccl5−/− mice 3, 6, and 12 h after PHx. (G,H) TNF‐α mRNA and protein expression after 70% PHx (n = 4 per group). No difference was observed at the indicated time points. (I) STAT3 phosphorylation in regenerating liver 3 h after PHx (n = 3 per group). p‐STAT3 expression was significantly higher 3 h after PHx, but did not differ between WT and Ccl5−/− mice. Data represent the mean ± SEM. FACS, fluorescence‐activated cell sorting; p‐STAT3, phosphorylated STAT3
Given that macrophage‐derived cytokines, such as IL‐6 and TNF‐α, play critical roles in the initiation of LR after PHx,[ 9 ] we next evaluated the relationship between these cytokines and CCL5. Interestingly, IL‐6 and TNF‐α mRNA levels in liver tissues and protein levels in serum samples were comparable between WT and Ccl5−/− mice soon after PHx (3, 6, and 12 h; Figure 3E‐H). Previous studies have shown that signal transducer and transducer 3 (STAT3), a key mediator of hepatocyte proliferation, is activated early after PHx[ 19 , 20 ]; therefore, we examined STAT3 phosphorylation in liver samples 3 h after PHx, finding no difference between WT and Ccl5−/− mice (Figure 3I). Taken together, these results imply that Ccl5 is not directly involved in the initiation of LR after PHx.
CCL5 does not alter the proliferative activity of hepatocytes in vitro
To determine whether CCL5 directly affects hepatocyte proliferation, we stimulated primary hepatocytes isolated from WT and Ccl5−/− mice with epidermal growth factor (EGF)/hepatocyte growth factor (HGF) recombinant proteins with or without exogenous rmCCL5 in vitro. PCNA mRNA and protein expression levels were similar in WT and Ccl5−/− mouse hepatocytes, consistent with the results of IF staining for Ki67 (Figure 4A–C). To determine the specific effects of exogenous or endogenous CCL5 on hepatocyte proliferation in vitro, rmCCL5 was added to the culture medium of primary hepatocytes. No significant differences were observed in PCNA or Ki67 expression between WT and Ccl5−/− mouse hepatocytes treated with EGF/HGF (Figure 4D–F), suggesting that CCL5 may not hamper the proliferation of hepatocytes stimulated by EGF/HGF in the absence of immune cells.
FIGURE 4.
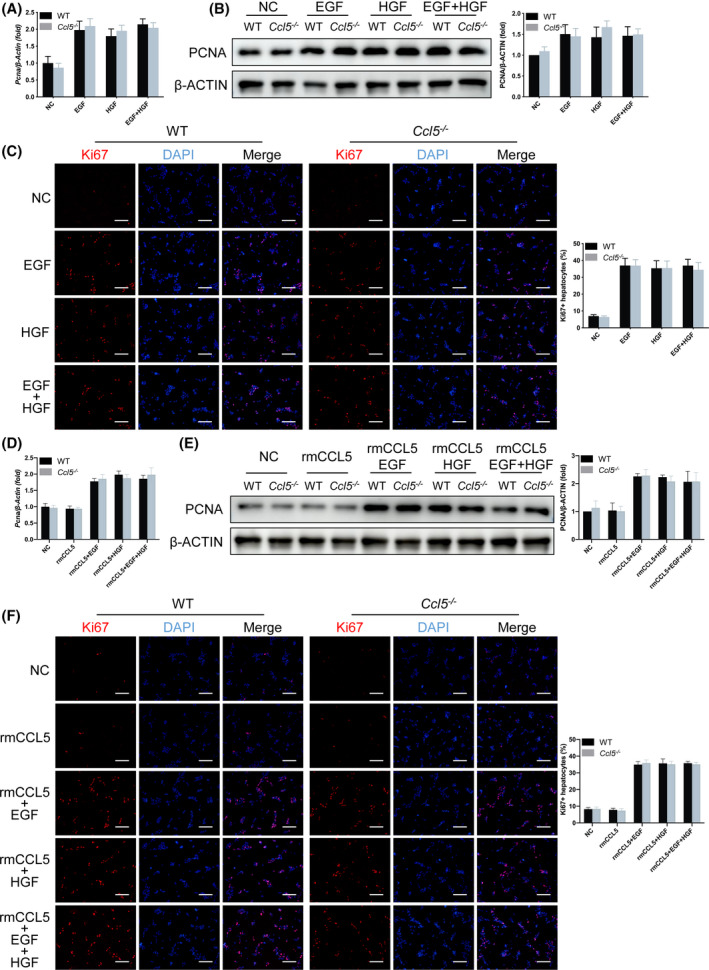
CCL5 does not affect the proliferative activity of hepatocytes in vitro. Primary hepatocytes isolated from WT and Ccl5−/− mice were cultured in supplemented DMEM for 3 h, followed by 100 ng/ml of rmCCL5, 20 ng/ml of EGF, or 100 ng/ml of HGF treatment for 48 h. (A,B) PCNA mRNA and protein expression in lysates of EGF‐ or HGF‐treated hepatocytes. PCNA expression was higher in primary hepatocytes treated with EGF or HGF, but with no significant difference between WT and Ccl5−/− mice. (C) IF staining of Ki67 in EGF‐ and HGF‐treated primary hepatocytes. Ki67 expression was significantly higher in primary hepatocytes after treatment, but with no difference between the two groups of mice. (D‐F) PCNA mRNA and protein expression and Ki67 IF distribution in hepatocytes treated with rmCCL5, EGF, or HGF. Proliferation of primary hepatocytes treated with rmCCL5 was similar to that of untreated controls. Primary hepatocytes stimulated by rmCCL5 as well as growth factor (EGF/HGF) displayed more significantly proliferative activity than those treated with rmCCL5 alone, but with no difference between the two groups of mice. All data represent the mean ± SEM of at least three independent experiments. Scale bar = 200 μm. NC, nontarget control
Ccl5 deficiency promotes reparative macrophage polarization after PHx
Given that CCL5 acts as a chemokine for various inflammatory cells,[ 18 ] we examined immune cell infiltration in Ccl5−/− mice after PHx. Flow cytometry analysis revealed no significant differences in proportions of neutrophils (CD11b+Ly6G+), MoMFs (CD11bhiF4/80int), KCs (CD11bintF4/80hi), natural killer (NK1.1hiCD3−), natural killer T (NK1.1intCD3int), B (CD19+CD3−), CD4+T (CD3+CD4+), and CD8+T (CD3+CD8+) cells in livers of WT and Ccl5−/− mice 36 h after PHx (Figure S3A–C). Previously, we found that CCL5 exacerbates liver injury by activating M1 and impeding M2 macrophage polarization in an APAP‐induced liver injury model[ 18 ]; however, Ly6Clo and Ly6Chi have recently been used as simple and practical markers to distinguish between recruited reparative (M2‐like) and proinflammatory (M1‐like) macrophage subsets.[ 10 , 21 ] Here, we showed that WT and Ccl5−/− mice had similar proportions of Ly6Clo or Ly6Chi macrophages 3 h after PHx (Figure S3D). Interestingly, the proportion of hepatic Ly6Clo macrophages 36 h after PHx was significantly higher in Ccl5−/− mice than in WT mice, whereas the proportion of Ly6Chi macrophages was significantly lower (Figure 5A).
FIGURE 5.
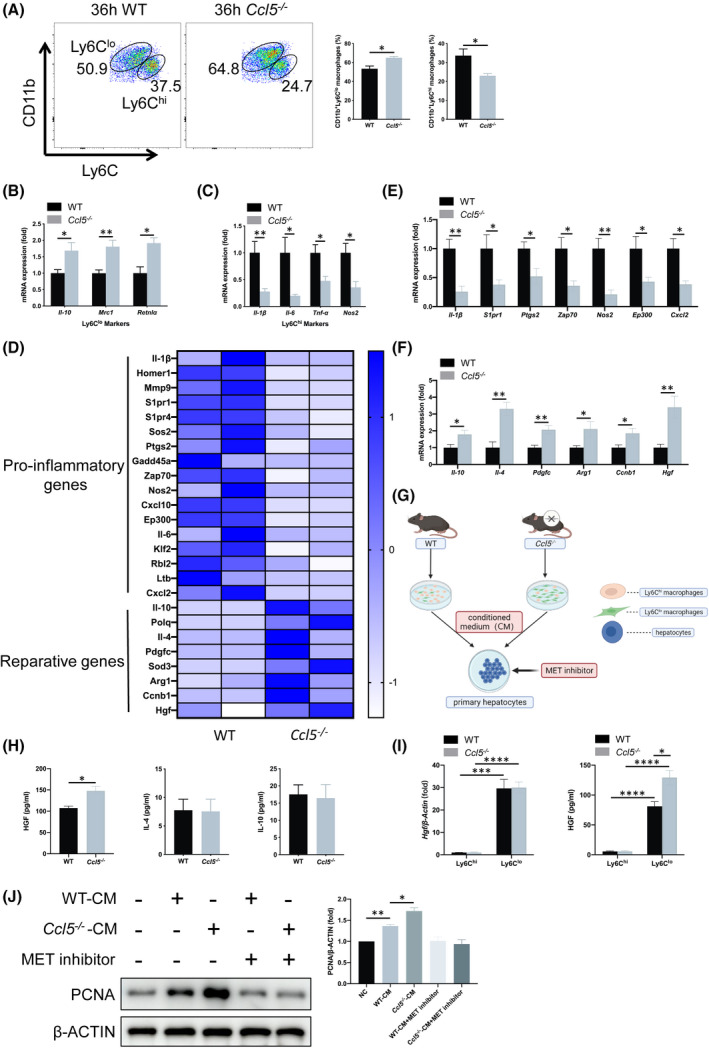
Ccl5 deficiency promotes reparative Ly6Clo macrophage polarization and HGF production after PHx. (A) Representative FACS plots and the quantification of Ly6Clo or Ly6Chi hepatic macrophages 36 h after 70% PHx (n = 4 per group). There was a significantly higher proportion of Ly6Clo macrophages in Ccl5−/− mice than in WT mice, with a significantly lower proportion of Ly6Chi macrophages. (B,C) mRNA expression of Ly6Clo (Il‐10, Mrc1, and Retnlα) and Ly6Chi macrophage markers (Il‐1β, Il‐6, Tnf‐α, and Nos2) in sorted hepatic macrophages (n = 4–5 per group). Gene expression of Ly6Clo macrophage markers was significantly up‐regulated in Ccl5−/− mice compared to WT mice, whereas Ly6Chi macrophage markers were down‐regulated. (D) RNA‐seq analysis of hepatic macrophages from WT and Ccl5−/− mice after 70% PHx (n = 3 per group). Heatmap showed proinflammatory and reparative gene expression profiles in WT and Ccl5−/− mice. (E,F) mRNA expression of proinflammatory and reparative genes in CD11b+Ly6Clo&hi macrophages (n = 4–5 per group). Expression of proinflammatory genes, including Il‐1β, S1pr1, Ptgs2, Zap70, Nos2, Ep300, and Cxcl2, was generally decreased, whereas that of reparative genes, such as Il‐10, Il‐4, Pdgfc, Arg1, Ccnb1, and Hgf, was increased significantly. (G) Schematic diagram of in vitro coculture of primary hepatocytes with CM from sorted macrophages in WT and Ccl5−/− mice, with or without the addition of HGF receptor inhibitor. (H) ELISA analysis of cytokines secreted by sorted macrophages. Macrophages from Ccl5−/− mice produced significantly more HGF than those from WT mice, whereas IL‐4 or IL‐10 levels did not differ (n = 4 per group). (I) qPCR and ELISA analysis of HGF from Ly6Chi and Ly6Clo macrophages. HGF was secreted mainly from Ly6Clo reparative macrophages instead of Ly6Chi proinflammatory macrophages (n = 4 per group). (J) PCNA expression in primary hepatocytes cultured in the supernatant of WT and Ccl5−/− mouse‐derived macrophages for 48 h. PCNA expression was significantly higher after culture with sorted macrophage supernatant. MET (HGF receptor) inhibitor addition to the culture medium down‐regulated PCNA expression in WT and Ccl5−/− macrophage CM‐treated hepatocytes with at least three independent experiments. Data represent the mean ± SEM. *p < 0.05; **p < 0.01; ***p < 0.001; ****p < 0.0001. Arg1, arginase 1; CM, conditioned medium; Cxcl10, C‐X‐C motif chemokine ligand 10; Mmp9, matrix metallopeptidase 9; Pdgfc, platelet‐derived growth factor C; Polq, DNA polymerase theta; S1pr, sphingosine‐1‐phosphate receptor; Sod3, superoxide dismutase 3
Next, we compared the mRNA expression of Ly6Clo (Il‐10, mannose receptor C‐type 1 [Mrc1], and resistin‐like alpha protein [Retnlα]) and Ly6Chi (Il‐1β, Il‐6, Tnf‐α, and nitric oxide synthase 2 [Nos2]) markers in sorted macrophages using qPCR, revealing similar results to those of the flow cytometry analysis (Figure 5B,C). Given that there is a potential relationship between circulating monocytes and hepatic macrophages, we analyzed peripheral blood mononuclear cells using flow cytometry, observing no significant differences in the Ly6Clo or Ly6Chi monocyte populations between WT and Ccl5−/− mice (Figure S3E). Together, these results suggest that CCL5 may be involved in Ly6Clo to Ly6Chi macrophage polarization.
CCL5 attenuates HGF production from reparative macrophages through CCR1‐ and CCR5‐mediated FoxO3a signaling
To investigate the mechanism of how the increased Ly6Clo macrophage subset affects LR in Ccl5−/− mice, we analyzed the gene expression profiles of hepatic macrophages (CD11b+Ly6Clo&hi) from WT and Ccl5−/− mice 36 h after PHx. RNA‐sequencing (RNA‐seq) analysis showed that expression levels of proinflammatory genes were decreased in Ccl5−/− mice, whereas reparative genes were up‐regulated compared to WT mice (Figure 5D–F). Gene Ontology analysis further revealed that Ccl5 KO might be associated with inhibited inflammatory responses and activated cell proliferation and division (Figure S4C,D). Moreover, we detected a significant increase in HGF levels in supernatant from Ccl5−/− mice compared to other secreted cytokines, such as IL‐4 and IL‐10 (Figure 5H; IL‐1β, IL‐6, and C‐X‐C motif chemokine ligand 2 [CXCL2] undetectable). To further identify the cellular source of increased HGF, Ly6Clo and Ly6Chi macrophages were separately sorted, and we found that HGF was mainly secreted from Ly6Clo instead of Ly6Chi macrophages (Figure 5I). When primary WT mouse hepatocytes were cultured with the conditioned medium of macrophages from WT or Ccl5−/− mice 36 h after PHx, PCNA expression levels were significantly elevated after 48 h of culture, but down‐regulated after HGF receptor had been inhibited, suggesting that HGF production by reparative macrophages may play a key role in hepatocyte proliferation (Figure 5J).
In addition to macrophages, hepatocytes, HSCs, and liver sinusoidal endothelial cells (LSECs) have also been shown to produce HGF after PHx.[ 9 ] To explore whether these cells also contribute to more HGF production in Ccl5−/− mice 36 h after PHx, we examined the HGF expression of these cells isolated from partially hepatectomized WT and Ccl5−/− mice. Hgf expression levels in hepatocytes, HSCs, or LSECs were increased after PHx compared with the sham group, but no significant differences were found between WT and Ccl5−/− mice, suggesting that CCL5 does not alter HGF expression in these cells (Figure S5A‐C). To further confirm the involvement of HGF in accelerating LR in Ccl5−/− mice, we measured HGF expression in liver tissues and serum and found that their levels were markedly elevated in both WT and Ccl5−/− mice, with greater elevation in the latter group (Figure S6A,B). Consistently, the HGF/MET signaling pathway was significantly activated after PHx, with a greater extent of activation in Ccl5−/− mice than in WT mice, as indicated by increased phosphorylated MET expression in Ccl5−/− mice 36 h after PHx (Figure S6C). All the above results suggest that Ly6Clo macrophages, not other types of cells, are responsible for the up‐regulation of HGF in Ccl5−/− mice.
To elucidate the molecular mechanism by which CCL5 triggers the down‐regulation of HGF, we performed Kyoto Encyclopedia of Genes and Genomes (KEGG) pathway analysis and showed that the FoxO and NF‐κB pathways had the most significant p values and count numbers (Figure 6A). In particular, genes, including cyclin B1 (Ccnb1), E1A‐binding protein P300 (Ep300), growth arrest and DNA damage‐inducible alpha (Gadd45a), homer scaffold protein 1 (Homer1), Kruppel‐like factor 2 (Klf2), RB transcriptional corepressor‐like 2 (Rbl2), sphingosine‐1‐phosphate receptor 1 (S1pr1), and SOS Ras/Rho guanine nucleotide exchange factor 2 (Sos2), were enriched in the FoxO pathway, whereas Cxcl2, Gadd45a, Il‐1β, lymphotoxin‐beta (Ltb), prostaglandin‐endoperoxide synthase 2 (Ptgs2), TNF receptor‐associated factor 1, and zeta chain of T‐cell receptor‐associated protein kinase 70 (Zap70) were enriched in the NF‐κB pathway (Figure S4E,F). We verified the FoxO and NF‐κB pathways in Ccl5−/− mouse macrophages by western blotting, with increased phosphorylated protein kinase B (p‐AKT) and phosphorylated FoxO3a (p‐FoxO3a; phosphorylated FoxO1/4 [p‐FoxO1/4] undetectable) and decreased phosphorylated nuclear factor of kappa light polypeptide gene enhancer in B‐cells inhibitor, alpha (p‐IκBα) and phosphorylated NF‐κB (p‐NF‐κB) expression levels (Figure 6B). In addition, we further confirmed that the FoxO3a (p‐FoxO1/4 undetectable) and NF‐κB signaling pathways may be involved in the inhibition of HGF synthesis by CCR1 and CCR5 in vitro (Figure S7A and Figure 6C–E). Carbenoxolone disodium (FoxO3a inhibitor) and JSH‐23 (NF‐κB inhibitor) were separately added into the culture medium of macrophages, and we found that the mRNA and protein expression of HGF increased significantly after FoxO3a inhibition, but not NF‐κB (Figure 6F,G), suggesting that FoxO3a, rather than the NF‐κB signaling pathway, may be the central regulator of HGF synthesis. To avoid the mutual influence between the FoxO3a and NF‐κB pathways, we detected the phosphorylated levels of both signaling pathways in the presence of one pathway inhibitor, and found that these two pathways could not regulate each other in rmCCL5‐treated macrophages (Figure S7B,C). Next, ChIP analysis was carried out to further determine whether CCL5 would directly regulate Hgf transcription by the binding of FoxO3a to its promoter. Through the Promo website, the FoxO3a or NF‐κB potential binding element was predicted in the promoter of the mouse Hgf gene (Figure 6H). We found that rmCCL5 induced a marked binding of FoxO3a to the Hgf promoter rather than NF‐κB (Figure 6I,J).
FIGURE 6.
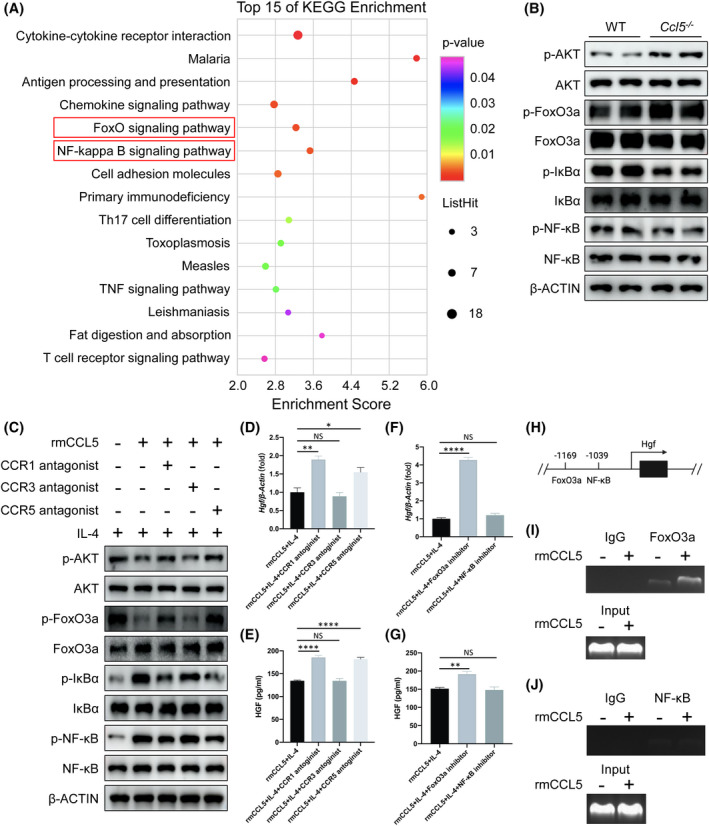
CCL5 attenuates HGF production from reparative macrophages by CCR1‐ and CCR5‐mediated FoxO3a signaling. (A) RNA‐seq analysis of hepatic macrophages sorted by flow cytometry from mice 36 h after PHx. Bubble chart showing the top 15 of KEGG enrichment of the significant genes. The FoxO‐ and NF‐κB‐signaling pathways ranked at the top for their p values and count numbers. (B) Western blotting analysis of the FoxO‐ and NF‐κB‐signaling pathways in macrophages sorted from WT and Ccl5−/− mice. AKT and FoxO3a phosphorylation (p‐FoxO1/4 undetectable) levels were up‐regulated in Ccl5−/− mice 36 h after PHx compared to WT mice, whereas NF‐κB and IκBα phosphorylation levels were significantly decreased. (C) Peritoneal macrophages were pretreated with 10 μM of CCR1/3/5 antagonists and 20 ng/ml of IL‐4 for 1 h, washed three times with PBS, and then were administrated with 100 ng/ml of rmCCL5 for 30 minutes. rmCCL5 decreased p‐AKT and p‐FoxO3a, and increased p‐NF‐κB and p‐IκBα, whereas CCR1/CCR5 blockade exerted the opposite effects. (D,E) qPCR and ELISA analysis of HGF from peritoneal macrophages treated with 100 ng/ml of rmCCL5 with 20 ng/ml of IL‐4 for 24 h, with or without CCR1/3/5 antagonist treatment for 1 h in advance. Blocking CCR1 or CCR5 significantly increased HGF expression in rmCCL5‐treated macrophages. (F,G) mRNA and protein expression of HGF were detected in peritoneal macrophages treated by 100 ng/ml of rmCCL5 and 20 ng/ml of IL‐4 for 24 h with FoxO3a inhibitor (carbenoxolone disodium) or NF‐κB inhibitor (JSH‐23) for 1 h in advance. Expression of HGF was increased when FoxO3a, not NF‐κB, was inhibited. (H) Schematic illustration of predicted FoxO3a/NF‐κB binding elements in the promoter of the mouse Hgf gene. (I,J) ChIP analysis of RAW264.7 cells treated with or without 100 ng/ml of rmCCL5 for 30 minutes. Chromatin was immunoprecipitated with anti‐FoxO3a or anti‐NF‐κB antibodies and then subjected to PCR analysis. FoxO3a, instead of NF‐κB, showed enhanced binding affinity to the Hgf promoter under rmCCL5‐treated conditions. All data represent the mean ± SEM of at least three independent experiments. *p < 0.05; **p < 0.01; ****p < 0.0001. p‐IκBα, phosphorylated nuclear factor of kappa light polypeptide gene enhancer in B‐cells inhibitor, alpha; Th17, T helper 17
It has been well known that intrahepatic macrophages consist of Ly6Clo&hi MoMFs and resident KCs.[ 11 ] To rule out the impact of CCL5 on KCs, expression levels of proinflammatory and reparative genes were investigated, but no significant differences were observed between WT and Ccl5−/− mice (Figure S8A,B). In addition, KC‐secreted HGF was comparable in the supernatant from WT and Ccl5−/− mice (Figure S8C). Next, we examined the effect of CCL5 on FoxO3a and NF‐κB signaling and HGF synthesis in KCs in vitro. Compared with IL‐4 treatment alone, expression levels of p‐AKT, p‐FoxO3a, p‐IκBα, and p‐NF‐κB were not significantly altered in KCs treated with both IL‐4 and rmCCL5 (Figure S8D). Consistently, HGF production was comparable in KCs treated with or without rmCCL5 by qPCR and ELISA analysis (Figure S8E,F).
CCL5 receptor blockade promotes LR in vivo after PHx
To evaluate the therapeutic potential of CCL5 inhibition in PHx, CCL5 was blocked by i.p. injecting mice with Met‐CCL5 at a dose of 10 μg/kg 0, 12, and 24 h after PHx (Figure 7A). Compared to PBS‐treated mice, Met‐CCL5 treatment significantly improved mouse survival after lethal 90% PHx (Figure 7B). Although Met‐CCL5 did not affect tissue injury morphologically after 70% PHx (Figure S9A), it did significantly improve liver function (Figure S9B,C). In addition, Met‐CCL5 administration increased the liver‐to‐body weight ratio, PCNA expression, and number of Ki67‐positive cells in the 70% PHx model (Figure 7C–E). Met‐CCL5 also significantly increased the proportion of Ly6Clo reparative macrophages (Figure 7F), but did not alter the proportions of neutrophils, MoMFs, or KCs, compared to PBS‐treated mice (Figure S9D,E). In sorted CD11b+Ly6Clo&hi macrophages, Met‐CCL5 up‐regulated HGF mRNA and protein expression levels (Figure 7G). Furthermore, Met‐CCL5 increased HGF mRNA expression in liver tissues and protein abundance in serum 36 h after PHx (Figure 7H). Together, these results suggest that CCL5 could be an effective target for enhancing LR after PHx.
FIGURE 7.
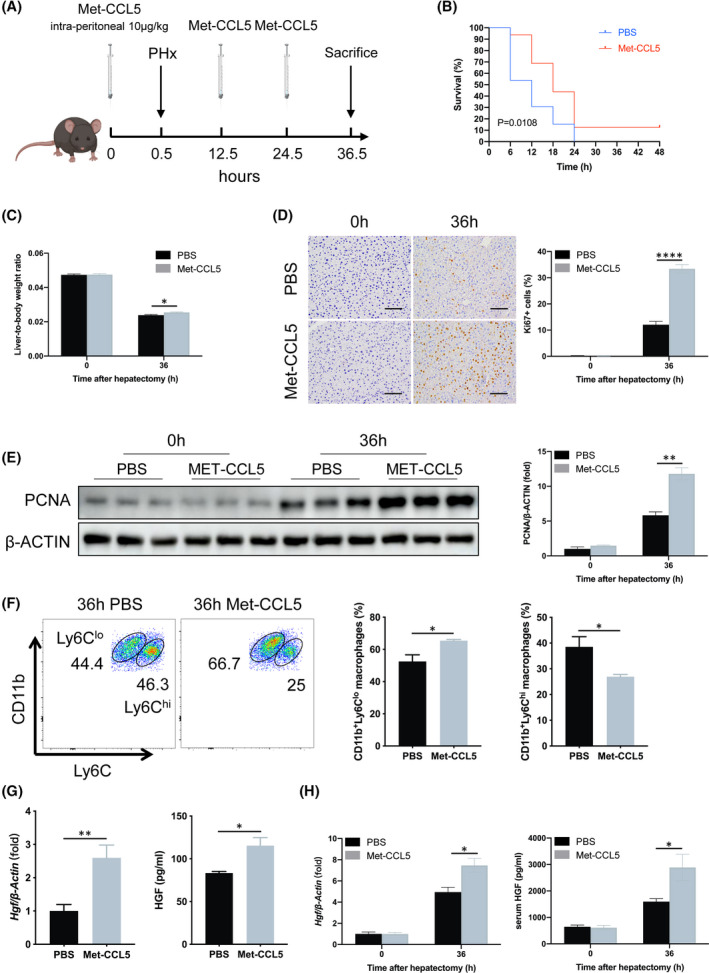
CCL5 receptor blockade promotes LR in vivo after PHx. (A) Schematic flowchart of sustained CCL5 receptor blockade by intermittent Met‐CCL5 injection in vivo in the PHx mouse model. Met‐CCL5 (10 μg/kg) was i.p. injected into WT mice 0, 12, and 24 h after 90% or 70% PHx. (B) Survival curve of PHx mice after CCR1/5 blockade (n = 13–16 per group). Met‐CCL5–treated mice achieved a significantly higher survival rate than PBS‐treated mice in the lethal 90% PHx model. (C) Liver‐to‐body weight ratio 36 h after 70% PHx in mice (n = 4–5 per group). Liver‐to‐body weight ratio was significantly higher after Met‐CCL5 treatment. (D) IHC staining of Ki67 36 h after PHx (n = 4–5 per group). Met‐CCL5 significantly increased the number of Ki67‐positive cells. (E) PCNA protein expression in liver tissue of PBS‐ or Met‐CCL5–treated mice (n = 3 per group). PCNA expression was higher in Met‐CCL5–treated mice than in PBS‐treated mice. (F) Representative FACS plots and the quantification of Ly6Clo and Ly6Chi hepatic macrophages following Met‐CCL5 treatment (n = 4 per group). Met‐CCL5 administration increased reparative Ly6Clo macrophages and decreased proinflammatory Ly6Chi macrophages. (G) qPCR and ELISA analysis of HGF in macrophages sorted from PBS‐ or Met‐CCL5–treated mice 36 h after PHx (n = 4 per group). HGF was up‐regulated in mice treated with Met‐CCL5 compared to PBS. (H) Liver‐tissue mRNA and serum protein levels of HGF in PBS‐ or Met‐CCL5–treated mice (n = 4–5 per group). Met‐CCL5 significantly increased HGF expression 36 h after PHx. Data represent the mean ± SEM. *p < 0.05; **p < 0.01; ****p < 0.0001. Scale bar = 100 μm. FACS, fluorescence‐activated cell sorting
DISCUSSION
LDLT and surgical treatment of liver cancer pose a challenge to the LR capacity of donors and patients, particularly after a major hepatectomy; therefore, an improved understanding of the molecular basis of LR after hepatectomy could help to reduce the risk of postoperative liver failure. Here, we confirmed that CCL5 up‐regulation after hepatectomy plays an important role in proinflammatory macrophage polarization. Furthermore, we revealed that the CCR1‐ and CCR5‐mediated FoxO3a/HGF axis is responsible for CCL5‐induced impaired LR, and targeting CCL5 receptors yields proregenerative effects after PHx by increasing reparative macrophage‐derived HGF. Therefore, CCL5 blockade may assist in the recovery from liver injury and LR after hepatectomy in clinical practice.
LR after major hepatectomy is a complex process that comprises of the priming, proliferation, and termination phases.[ 22 ] The priming phase refers to a sequence of orderly events inside and outside of hepatocytes, which contribute to the entry of quiescent hepatocytes into the cell cycle (G0 to G1 transition) during the postoperative period of 0–24 h.[ 19 , 23 ] Various immune cells residing in the liver are involved in the initiation of LR, either through interactions with hepatocytes directly or indirectly by secreting inflammatory cytokines, among which the macrophage is of vital importance.[ 24 ] Macrophage‐derived IL‐6 and TNF‐α are responsible for the activation of ~40% of immediate early genes, and macrophage depletion could greatly compromise the LR rate.[ 25 ] Although the priming phase of LR has been intensively studied, the mechanism underlying the proliferation phase has not been fully understood. During the proliferation phase, which lasts for 48 h, hepatocytes progress into the S phase of the cell cycle to synthesize DNA, followed by a profound proliferation of hepatocytes.[ 23 ] It has been reported that HGF plays a central role in the restoration of remnant liver volume, particularly in the proliferation phase.[ 25 ] Evidence showed that HGF injection could directly result in liver‐size expansion in normal rodents, regardless of whether or not the liver has undergone PHx.[ 9 , 25 ] Despite that HGF could be secreted by macrophages,[ 26 , 27 ] what roles macrophages play during the proliferation phase have only been discussed.
Hepatic macrophages can switch their phenotypes when exposed to specific molecular signals. It is already known that macrophages could be polarized into the proinflammatory M1 (lipopolysaccharide [LPS] and IFN‐γ driven) or reparative M2 (IL‐4 and IL‐13 induced) subtype in vitro.[ 28 ] However, the polarization status of macrophages in vivo is more complex, and the phenotype of M1 and M2 is not consistent among different species or animal models. To distinguish the proinflammatory and reparative macrophages in a more simple and practical way, Ly6C was introduced into our study. Ly6Chi and Ly6Clo have been recently identified as surrogate markers of proinflammatory and reparative monocyte macrophages, respectively, in the context of injury.[ 10 , 21 ] Ly6Chi proinflammatory macrophages have low C‐X3‐C motif chemokine receptor 1 expression and secrete proinflammatory cytokines, such as IL‐1β, IL‐6, and TNF‐α, thereby worsening liver injury.[ 11 ] Conversely, alternatively activated Ly6Clo reparative macrophages produce anti‐inflammatory mediators, such as IL‐4, IL‐10, and TGF‐β1, which may help to promote liver repair.[ 11 , 12 ] For instance, phosphatase and tensin homologue deleted on chromosome 10, 10q23.3 KO in macrophages has been reported to promote reparative macrophage polarization and exert proregenerative effects after 70% PHx.[ 29 ] In addition, LR and recovery of liver function are accelerated significantly when reparative bone‐marrow–derived macrophages (BMDMs) are infused into hepatectomized mice.[ 13 ] However, the underlying mechanism in which reparative macrophages affected LR were not clearly shown. Our study showed that increased proportion of reparative Ly6Clo and subsequent HGF production may contribute to an advanced proliferation peak after major hepatectomy.
CCL5 is expressed abundantly in various tissues and organs where it regulates different biological functions, such as viral infection, inflammatory response, and tumorigenesis, by binding to its receptors on macrophages.[ 17 , 30 ] Previously, we demonstrated that CCL5 aggravates liver injury by directly activating proinflammatory and impeding reparative macrophage polarization in an APAP‐induced mouse model.[ 18 ] However, CCL5 does not affect macrophage infiltration in injured liver tissues.[ 18 ] Similarly, we observed no differences in the proportions of MoMFs or KCs between WT and Ccl5−/− mice 3 or 36 h after PHx. This may be explained by the fact that monocyte recruitment during liver injury is dominated by CCR2, the receptor for CCL2 and not CCL5.[ 31 , 32 ]
In this study, we found that CCL5 induces proinflammatory macrophage polarization and subsequently down‐regulates the production of HGF at the proliferation phase, which exacerbates liver injury and reduces LR after PHx. Interestingly, the polarization status of macrophages is unaltered during the priming phase of LR, which could be explained that the increase of CCL5 is not high enough to induce phenotypic alterations. Instead, CCL5 expression reaches the peak 36 h after PHx, resulting in an increased proportion of proinflammatory macrophage. It has been reported that HGF is mainly secreted by reparative macrophages in the model of HCC and hair regeneration.[ 33 , 34 ] Consistently, we confirmed HGF synthesis mostly in reparative macrophages rather than in proinflammatory macrophages.
CCL5 is known to regulate different biological processes by transducing signals through CCR1, CCR3, and CCR5, which are differentially expressed among diverse organs and tissues.[ 17 , 35 ] Furthermore, the affinity of CCL5 receptors to their ligand has also been reported to differ in various disease models.[ 17 , 36 ] CCL5 mainly binds to CCR1 and CCR5 to promote hepatic fibrosis in mouse models induced by the injection of carbon tetrachloride or a methionine‐ and choline‐deficient diet, whereas Met‐CCL5 administration promotes fibrosis regression.[ 37 ] Previously, we showed that the mRNA expression of Ccr1, not Ccr3 or Ccr5, is significantly lower in both the liver tissues and hepatocytes of a Ccl5−/− mice in a model of α‐Galcer‐induced hepatitis.[ 15 ] In addition, CCL5 has been shown to reduce the malignancy of HCC or a phyllodes tumor of the breast by binding to CCR5, rather than CCR1 and CCR3.[ 16 , 30 ] In spite of being widely studied in other liver disease models, CCL5 receptors are rarely investigated in LR after PHx. Here, we found that specifically blocking CCR1 and CCR5 inhibits CCL5‐induced down‐regulation of HGF expression level, which is unaltered by CCR3 blockade, confirming that CCL5 mainly regulates HGF synthesis through CCR1 and CCR5. However, signaling pathways downstream to CCL5 receptors, which regulate HGF production, are open for study.
In this study, RNA‐seq identified the FoxO family (FoxO1, FoxO3a, FoxO4, and FoxO6) to be involved in Ccl5 deficiency‐induced LR. Given that FoxO6 is predominantly expressed in the nervous system[ 38 ] and is undetectable by RNA‐seq, it is not investigated in the setting of LR. Meanwhile, we could not detect the phosphorylation of FoxO1/4 after PHx, whether exposed to CCL5 or not. Instead, only FoxO3a phosphorylation was observed and increased after CCL5 blockade, which was therefore further investigated in our study. FoxO3a has been implicated in the regulation of proinflammatory responses and is known to be inactivated and translocated to the cytosol after phosphorylation.[ 38 , 39 ] It has been reported that there is a significant increase of FoxO3a phosphorylation in BMDMs treated with anti‐inflammatory IL‐33,[ 40 ] whereas p‐FoxO3a expression is significantly decreased by TNF‐α in C2C12 myotubes.[ 41 ] It is also noteworthy that nuclear retention of FoxO3a has been shown to be induced by LPS in cardiomyocytes.[ 42 ] FoxO3a could translocate into the nucleus from the cytosol after LPS treatment in BV2 microglia.[ 43 ] In line with these above‐mentioned reports, our study shows that CCL5 could reduce the phosphorylation of FoxO3a, which might also inhibit the translocation of FoxO3a from the nucleus to cytosol. As a transcription factor, FoxO3a could enhance the transcription of C‐X‐C motif chemokine ligand 16 (CXCL16) in cardiac vascular endothelial cells to exert a proinflammatory role, and inhibition of FoxO3a would lead to a pronounced reduction of CXCL16.[ 44 ] Depletion of FoxO3a could significantly increase IL‐13 expression in lung macrophages exposed to IL‐33.[ 40 ] By contrast, FoxO3a could negatively regulate IL‐10 secretion in mycobacteria‐infected macrophages.[ 45 ] Not coincidentally, FoxO3a−/− macrophages have been shown to secrete higher levels of IL‐10 and reduced levels of IL‐12 and TNF‐α following infection with Salmonella typhimurium.[ 39 ] In addition, the enhanced expression of FoxO3a markedly abolishes the release of VEGF mediated by protein kinase B (AKT) in cardiomyocytes.[ 46 ] These reports on FoxO3a indicate that it is closely related to increased synthesis of proinflammatory mediators and decreased production of reparative cytokines. In this study, we found that the alternation of FoxO3a phosphorylation is responsible for CCL5‐induced HGF regulation after PHx. Active nonphosphorylated FoxO3a negatively regulates the transcription of HGF by binding to its promoter region.
Apart from the FoxO family, NF‐κB signaling is also regulated by CCL5, as shown in this study. The difference is that the phosphorylation of NF‐κB is increased by CCL5, which is consistent with our previous report that CCL5 could increase the proinflammatory polarization of macrophages.[ 18 ] However, the production of HGF is not regulated by NF‐κB, and the binding of NF‐κB as a transcription factor to the promoter region of Hgf was also not observed. Although NF‐κB phosphorylation level is up‐regulated in rmCCL5‐treated macrophages, it does not regulate the synthesis of HGF functionally. We speculate that the NF‐κB pathway in macrophages may play an undefined role in the hepatectomy model, which needs further investigation. In addition, we did not observe the mutual influence between the FoxO3a and NF‐κB signaling pathways, which could also be supported by previously published studies. For example, the phosphorylation level of NF‐κB is comparable between WT and FoxO3a−/− macrophages following infection with Salmonella typhimurium.[ 39 ] In addition, total NF‐κB expression is unaltered by FoxO3a knockdown in human colon cancer cells following the treatment of ipatasertib.[ 47 ] Correspondingly, NF‐κB knockdown also could not regulate the expression of FoxO3a.[ 47 ] Therefore, the negative regulation of FoxO3a on HGF production is independent of the NF‐κB signaling pathway.
In summary, the current work reveals that CCL5 is a molecule regulating LR after PHx. Blockade of CCL5 may accelerate the peak of hepatocyte proliferation by prompting the polarization of reparative macrophages and subsequent production of HGF. Our study provides experimental evidence that targeting CCL5 receptors may have the potential therapeutic effects for the improvement of LR after partial hepatectomy for liver cancer patients and healthy donors of LDLT in future clinical practice.
CONFLICT OF INTEREST
Nothing to report.
AUTHOR CONTRIBUTIONS
M. Huang, J. Jiao, H. Cai, Y. Zhang, and Y. Xia: study design, conducting experiments, acquisition of data, analysis, and interpretation of data, and drafting the manuscript. J. Lin and Z. Shang generated mice and performed the mice model. Y. Qian: technical support and collection of patient samples. F. Wang and H. Wu: critical revision of the manuscript for important intellectual content. X. Kong and J. Gu: study concept and design, analysis, and interpretation of data, drafting the manuscript, obtaining funding, and study supervision.
Supporting information
Supplementary Material
ACKNOWLEDGMENTS
We are grateful to Biorender.com for providing diagram support.
Huang M, Jiao J, Cai H, Zhang Y, Xia Y, Lin J, et al. C‐C motif chemokine ligand 5 confines liver regeneration by down‐regulating reparative macrophage‐derived hepatocyte growth factor in a forkhead box O 3a–dependent manner. Hepatology. 2022;76:1706–1722. 10.1002/hep.32458
Miao Huang, Junzhe Jiao, Hao Cai, Yichi Zhang, and Yuhan Xia contributed equally to this work.
Funding information
Supported by the National Natural Science Foundation of China (82130020, 82072646, and 81772507 to J. Gu; 81873582 and 82070633 to X. Kong; and 31870905 to H. Wu); the Clinical Research Plan of SHDC (No. SHDC2020CR3005A); the Shanghai “Rising Stars of Medical Talent” Youth Development Program “Outstanding Youth Medical Talents” (No. SHWSRS (2021) _099); Shanghai Municipal Education Commission–Gaofeng Clinical Medicine Grant Support (No. 20191910 to J. Gu); and the Program of Shanghai Academic/Technology Research Leader (20XD1403700 to X. Kong).
Contributor Information
Xiaoni Kong, Email: xiaoni-kong@126.com.
Jinyang Gu, Email: xiaoni-kong@126.com, Email: gjynyd@126.com.
REFERENCES
- 1. Global Burden of Disease Cancer Collaboration . Global, regional, and national cancer incidence, mortality, years of life lost, years lived with disability, and disability‐adjusted life‐years for 29 cancer groups, 1990 to 2017. JAMA Oncol. 2019;5:1749–68. [DOI] [PMC free article] [PubMed] [Google Scholar]
- 2. Petrowsky H, Fritsch R, Guckenberger M, De Oliveira ML, Dutkowski P, Clavien PA. Modern therapeutic approaches for the treatment of malignant liver tumours. Nat Rev Gastroenterol Hepatol. 2020;17:755–72. [DOI] [PubMed] [Google Scholar]
- 3. Attili A, Sucandy I, Spence J, Bourdeau T, Ross S, Rosemurgy A. Outcomes of extended hepatectomy for hepatobiliary tumors. Initial experience from a non‐university hepatobiliary center. Am J Surg. 2020;219:106–9. [DOI] [PubMed] [Google Scholar]
- 4. Qadan M, Garden OJ, Corvera CU, Visser BC. Management of postoperative hepatic failure. J Am Coll Surg. 2016;222:195–208. [DOI] [PubMed] [Google Scholar]
- 5. Lieber SR, Schiano TD, Rhodes R. Should living donor liver transplantation be an option when deceased donation is not? J Hepatol. 2018;68:1076–82. [DOI] [PMC free article] [PubMed] [Google Scholar]
- 6. Adam R, Karam V, Delvart V, O’Grady J, Mirza D, Klempnauer J, et al. Evolution of indications and results of liver transplantation in Europe. A report from the European Liver Transplant Registry (ELTR). J Hepatol. 2012;57:675–88. [DOI] [PubMed] [Google Scholar]
- 7. Khalil AH, Khattab M, Hosny KA, Elshazly M, Salah Eldin A, Hosny A. Effect of portal venous pressure on liver function of donors in living donor liver transplantation. Ann Transplant. 2019;24:401–6. [DOI] [PMC free article] [PubMed] [Google Scholar]
- 8. Ghobrial RM, Freise CE, Trotter JF, Tong L, Ojo AO, Fair JH, et al. Donor morbidity after living donation for liver transplantation. Gastroenterology. 2008;135:468–76. [DOI] [PMC free article] [PubMed] [Google Scholar]
- 9. Michalopoulos GK, Bhushan B. Liver regeneration: biological and pathological mechanisms and implications. Nat Rev Gastroenterol Hepatol. 2021;18:40–55. [DOI] [PubMed] [Google Scholar]
- 10. Jia D, Jiang H, Weng X, Wu J, Bai P, Yang W, et al. Interleukin‐35 promotes macrophage survival and improves wound healing after myocardial infarction in mice. Circ Res. 2019;124:1323–36. [DOI] [PubMed] [Google Scholar]
- 11. Tacke F, Zimmermann HW. Macrophage heterogeneity in liver injury and fibrosis. J Hepatol. 2014;60:1090–6. [DOI] [PubMed] [Google Scholar]
- 12. Vannella KM, Wynn TA. Mechanisms of organ injury and repair by macrophages. Annu Rev Physiol. 2017;79:593–617. [DOI] [PubMed] [Google Scholar]
- 13. Sun H, Sun S, Chen G, Xie H, Yu S, Lin X, et al. Ceramides and sphingosine‐1‐phosphate mediate the distinct effects of M1/M2‐macrophage infusion on liver recovery after hepatectomy. Cell Death Dis. 2021;12:324. [DOI] [PMC free article] [PubMed] [Google Scholar]
- 14. Wynn TA, Vannella KM. Macrophages in tissue repair, regeneration, and fibrosis. Immunity. 2016;44:450–62. [DOI] [PMC free article] [PubMed] [Google Scholar]
- 15. Chen L, Gu J, Qian Y, Li M, Qian Y, Xu M, et al. Deletion of C‐C Motif chemokine ligand 5 worsens invariant natural killer T‐cell‐mediated hepatitis via compensatory up‐regulation of CXCR2‐related chemokine activity. Cell Mol Gastroenterol Hepatol. 2019;7:623–39. [DOI] [PMC free article] [PubMed] [Google Scholar]
- 16. Mohs A, Kuttkat N, Reißing J, Zimmermann HW, Sonntag R, Proudfoot A, et al. Functional role of CCL5/RANTES for HCC progression during chronic liver disease. J Hepatol. 2017;66:743–53. [DOI] [PubMed] [Google Scholar]
- 17. Marques RE, Guabiraba R, Russo RC, Teixeira MM. Targeting CCL5 in inflammation. Expert Opin Ther Targets. 2013;17:1439–60. [DOI] [PMC free article] [PubMed] [Google Scholar]
- 18. Li M, Sun X, Zhao J, Xia L, Li J, Xu M, et al. CCL5 deficiency promotes liver repair by improving inflammation resolution and liver regeneration through M2 macrophage polarization. Cell Mol Immunol. 2020;17:753–64. [DOI] [PMC free article] [PubMed] [Google Scholar]
- 19. Cressman DE, Greenbaum LE, DeAngelis RA, Ciliberto G, Furth EE, Poli V, et al. Liver failure and defective hepatocyte regeneration in interleukin‐6‐deficient mice. Science. 1996;274:1379–83. [DOI] [PubMed] [Google Scholar]
- 20. Hu Z, Han Y, Liu Y, Zhao Z, Ma F, Cui A, et al. CREBZF as a key regulator of STAT3 pathway in the control of liver regeneration in mICE. Hepatology. 2020;71:1421–36. [DOI] [PubMed] [Google Scholar]
- 21. Kim W, Khan SK, Liu Y, Xu R, Park O, He Y, et al. Hepatic Hippo signaling inhibits protumoural microenvironment to suppress hepatocellular carcinoma. Gut. 2018;67:1692–703. [DOI] [PMC free article] [PubMed] [Google Scholar]
- 22. Michalopoulos GK. Hepatostat: liver regeneration and normal liver tissue maintenance. Hepatology. 2017;65:1384–92. [DOI] [PubMed] [Google Scholar]
- 23. Yang D, Dai Z, Yang T, Balakrishnan A, Yuan Q, Vondran FWR, et al. MicroRNA‐125b‐5p regulates hepatocyte proliferation during the termination phase of liver regeneration. Hepatol Commun. 2020;4:1851–63. [DOI] [PMC free article] [PubMed] [Google Scholar]
- 24. Hu C, Wu Z, Li L. Mesenchymal stromal cells promote liver regeneration through regulation of immune cells. Int J Biol Sci. 2020;16:893–903. [DOI] [PMC free article] [PubMed] [Google Scholar]
- 25. Abu Rmilah A, Zhou W, Nelson E, Lin L, Amiot B, Nyberg SL. Understanding the marvels behind liver regeneration. Wiley Interdiscip Rev Dev Biol. 2019;8:e340. [DOI] [PMC free article] [PubMed] [Google Scholar]
- 26. Zimmermann A. Regulation of liver regeneration. Nephrol Dial Transplant. 2004;19(Suppl. 4):iv6–iv10. [DOI] [PubMed] [Google Scholar]
- 27. Lu J, Zhao YL, Zhang XQ, Li LJ. The vascular endothelial growth factor signaling pathway regulates liver sinusoidal endothelial cells during liver regeneration after partial hepatectomy. Expert Rev Gastroenterol Hepatol. 2021;15:139–47. [DOI] [PubMed] [Google Scholar]
- 28. Nishizawa N, Ito Y, Eshima K, Ohkubo H, Kojo K, Inoue T, et al. Inhibition of microsomal prostaglandin E synthase‐1 facilitates liver repair after hepatic injury in mice. J Hepatol. 2018;69:110–20. [DOI] [PubMed] [Google Scholar]
- 29. Ma WT, Jia YJ, Liu QZ, Yang YQ, Yang JB, Zhao ZB, et al. Modulation of liver regeneration via myeloid PTEN deficiency. Cell Death Dis. 2017;8:e2827. [DOI] [PMC free article] [PubMed] [Google Scholar]
- 30. Nie Y, Huang H, Guo M, Chen J, Wu W, Li W, et al. Breast phyllodes tumors recruit and repolarize tumor‐associated macrophages via secreting CCL5 to promote malignant progression, which can be inhibited by CCR5 inhibition therapy. Clin Cancer Res. 2019;25:3873–86. [DOI] [PubMed] [Google Scholar]
- 31. Mossanen JC, Krenkel O, Ergen C, Govaere O, Liepelt A, Puengel T, et al. Chemokine (C‐C motif) receptor 2‐positive monocytes aggravate the early phase of acetaminophen‐induced acute liver injury. Hepatology. 2016;64:1667–82. [DOI] [PubMed] [Google Scholar]
- 32. Raghu H, Lepus CM, Wang Q, Wong HH, Lingampalli N, Oliviero F, et al. CCL2/CCR2, but not CCL5/CCR5, mediates monocyte recruitment, inflammation and cartilage destruction in osteoarthritis. Ann Rheum Dis. 2017;76:914–22. [DOI] [PMC free article] [PubMed] [Google Scholar]
- 33. Chu SY, Chou CH, Huang HD, Yen MH, Hong HC, Chao PH, et al. Mechanical stretch induces hair regeneration through the alternative activation of macrophages. Nat Commun. 2019;10:1524. [DOI] [PMC free article] [PubMed] [Google Scholar]
- 34. Dong N, Shi X, Wang S, Gao Y, Kuang Z, Xie Q, et al. M2 macrophages mediate sorafenib resistance by secreting HGF in a feed‐forward manner in hepatocellular carcinoma. Br J Cancer. 2019;121:22–33. [DOI] [PMC free article] [PubMed] [Google Scholar]
- 35. Bae H, Lee JY, Song G, Lim W. Function of CCL5 in maternal‐fetal interface of pig during early pregnancy. Dev Comp Immunol. 2020;103:103503. [DOI] [PubMed] [Google Scholar]
- 36. Duncan DS, McLaughlin WM, Vasilakes N, Echevarria FD, Formichella CR, Sappington RM. Constitutive and stress‐induced expression of CCL5 machinery in rodent retina. J Clin Cell Immunol. 2017;8:506. [DOI] [PMC free article] [PubMed] [Google Scholar]
- 37. Berres ML, Koenen RR, Rueland A, Zaldivar MM, Heinrichs D, Sahin H, et al. Antagonism of the chemokine Ccl5 ameliorates experimental liver fibrosis in mice. J Clin Invest. 2010;120:4129–40. [DOI] [PMC free article] [PubMed] [Google Scholar]
- 38. Calissi G, Lam EW, Link W. Therapeutic strategies targeting FOXO transcription factors. Nat Rev Drug Discov. 2021;20:21–38. [DOI] [PubMed] [Google Scholar]
- 39. Joseph J, Ametepe ES, Haribabu N, Agbayani G, Krishnan L, Blais A, et al. Inhibition of ROS and upregulation of inflammatory cytokines by FoxO3a promotes survival against Salmonella typhimurium. Nat Commun. 2016;7:12748. [DOI] [PMC free article] [PubMed] [Google Scholar]
- 40. Nie Y, Sun L, Wu Y, Yang Y, Wang J, He H, et al. AKT2 regulates pulmonary inflammation and fibrosis via modulating macrophage activation. J Immunol. 2017;198:4470–80. [DOI] [PubMed] [Google Scholar]
- 41. Liu L, Hu R, You H, Li J, Liu Y, Li Q, et al. Formononetin ameliorates muscle atrophy by regulating myostatin‐mediated PI3K/Akt/FoxO3a pathway and satellite cell function in chronic kidney disease. J Cell Mol Med. 2021;25:1493–506. [DOI] [PMC free article] [PubMed] [Google Scholar]
- 42. Li Z, Meng Y, Liu C, Liu H, Cao W, Tong C, et al. Kcnh2 mediates FAK/AKT‐FOXO3A pathway to attenuate sepsis‐induced cardiac dysfunction. Cell Prolif. 2021;54:e12962. [DOI] [PMC free article] [PubMed] [Google Scholar]
- 43. Wang Y, Lin Y, Wang L, Zhan H, Luo X, Zeng Y, et al. TREM2 ameliorates neuroinflammatory response and cognitive impairment via PI3K/AKT/FoxO3a signaling pathway in Alzheimer's disease mice. Aging (Albany NY). 2020;12:20862–79. [DOI] [PMC free article] [PubMed] [Google Scholar]
- 44. Zhao G, Zhang H, Zhu S, Wang S, Zhu K, Zhao Y, et al. Interleukin‐18 accelerates cardiac inflammation and dysfunction during ischemia/reperfusion injury by transcriptional activation of CXCL16. Cell Signal. 2021;87:110141. [DOI] [PubMed] [Google Scholar]
- 45. Bouzeyen R, Haoues M, Barbouche MR, Singh R, Essafi M. FOXO3 transcription factor regulates IL‐10 expression in mycobacteria‐infected macrophages, tuning their polarization and the subsequent adaptive immune response. Front Immunol. 2019;10:2922. [DOI] [PMC free article] [PubMed] [Google Scholar]
- 46. Luo B, Wu Y, Liu SL, Li XY, Zhu HR, Zhang L, et al. Vagus nerve stimulation optimized cardiomyocyte phenotype, sarcomere organization and energy metabolism in infarcted heart through FoxO3A‐VEGF signaling. Cell Death Dis. 2020;11:971. [DOI] [PMC free article] [PubMed] [Google Scholar]
- 47. Sun L, Huang Y, Liu Y, Zhao Y, He X, Zhang L, et al. Ipatasertib, a novel Akt inhibitor, induces transcription factor FoxO3a and NF‐kappaB directly regulates PUMA‐dependent apoptosis. Cell Death Dis. 2018;9:911. [DOI] [PMC free article] [PubMed] [Google Scholar]
Associated Data
This section collects any data citations, data availability statements, or supplementary materials included in this article.
Supplementary Materials
Supplementary Material