

Abstract
Optimal selection of high‐risk patients with stage II colon cancer is crucial to ensure clinical benefit of adjuvant chemotherapy. Here, we investigated the prognostic value of genomic intratumor heterogeneity and aneuploidy for disease recurrence. We combined targeted sequencing, SNP arrays, fluorescence in situ hybridization, and immunohistochemistry on a retrospective cohort of 84 untreated stage II colon cancer patients. We assessed the clonality of copy‐number alterations (CNAs) and mutations, CD8+ lymphocyte infiltration, and their association with time to recurrence. Prognostic factors were included in machine learning analysis to evaluate their ability to predict individual relapse risk. Tumors from recurrent patients displayed a greater proportion of CNAs compared with non‐recurrent (mean 31.3% versus 23%, respectively; p = 0.014). Furthermore, patients with elevated tumor CNA load exhibited a higher risk of recurrence compared with those with low levels [p = 0.038; hazard ratio (HR) 2.46], which was confirmed in an independent cohort (p = 0.004; HR 3.82). Candidate chromosome‐specific aberrations frequently observed in recurrent cases included gain of the chromosome arm 13q (p = 0.02; HR 2.67) and loss of heterozygosity at 17q22–q24.3 (p = 0.05; HR 2.69). CNA load positively correlated with intratumor heterogeneity (R = 0.52; p < 0.0001). Consistently, incremental subclonal CNAs were associated with an elevated risk of relapse (p = 0.028; HR 2.20), which we did not observe for subclonal single‐nucleotide variants and small insertions and deletions. The clinico‐genomic model rated an area under the curve of 0.83, achieving a 10% incremental gain compared with clinicopathological markers (p = 0.047). In conclusion, tumor aneuploidy and copy‐number intratumor heterogeneity were predictive of poor outcome and improved discriminative performance in early‐stage colon cancer. © 2022 The Authors. The Journal of Pathology published by John Wiley & Sons Ltd on behalf of The Pathological Society of Great Britain and Ireland.
Keywords: stage II colon cancer, cancer genomics, copy‐number alterations, mutational profiling, intratumor heterogeneity, machine learning
Introduction
Early‐stage colon cancer poses a major therapeutic challenge due to the lack of strong biomarkers to predict disease recurrence [1]. Around 10–15% of patients diagnosed with stage II colon cancer relapse within 5 years after curative intended surgery, which compromises survival rates. Although extensive biomarker‐driven research has succeeded in identifying risk predictors for tumor dissemination, selection of patients for adjuvant chemotherapy is still controversial in stage II colon cancer [2].
To date, the most relevant clinical and pathological factors for discriminating high‐risk stage II individuals are bowel perforation or obstruction, tumor size and high histological grade, lymphovascular or perineural invasion, and serosal invasion, although most of them have a modest individual effect on recurrence risk [3]. Microsatellite instability (MSI) is one of the most solid molecular markers with clinical utility in non‐advanced colon cancer, and along with BRAF V600E mutation, is able to define a subgroup of stage II colon cancer patients (~6%) with improved survival when solely treated with surgery [4]. Tumor budding and the presence of poorly differentiated clusters are pathology‐based markers that also contribute to the prognostication of these patients [5]. Moreover, Immunoscore is a robust immunohistochemistry‐based prognostic index for quantifying tumor‐infiltrating CD8+ T cells that has been thoroughly validated in stages II–III colorectal cancer (CRC) [6, 7]. Notwithstanding, recommendations in clinical guidelines for risk stratification still rely on under‐sensitive clinical and histopathological criteria.
Genomic intratumor heterogeneity has been identified as a prognostic predictor in solid malignancies [8, 9], due to its putative ability of prompting somatic evolutionary processes that can drive cancer progression [10] and therapeutic failure [11, 12]. Much of the genetic heterogeneity observed in solid tumors is triggered by chromosomal instability (CIN) [13], resulting in a pervasive expansion of chromosomal aneuploidies and mutational events that increases tumor subclonality and accelerates cancer evolution [14, 15]. Such instability could be responsible for fueling the tempo‐spatial spread of relapse‐proficient subclones that might influence the eventual metastatic seed [16, 17], potentially explaining mechanisms of disease recurrence, such as those described in chronic lymphocytic leukemia [18]. In this sense, increased subclonal copy‐number alterations (CNAs) have been associated with a greater risk of recurrence or death in non‐small cell lung cancer [19] as well as in hepatocellular carcinoma [20]. Furthermore, ongoing CIN enables cancer cells to rapidly assemble complex karyotypes with inflated burdens of CNAs [21], conferring the tumor a selective advantage towards a more aggressive phenotype [22]. Indeed, the tumor CNA load has been proposed as a biomarker of reduced survival in prostate cancer [23] and in metastatic CRC was also predictive of a diminished response to bevacizumab combinatorial therapy [24]. Nevertheless, genomic complexity and intratumor heterogeneity are yet to materialize as clinically useful tools to monitor cancer progress for therapeutic decision‐making.
Here, we performed an integrative analysis of somatic CNAs and mutational events, their subclonal status, along with the CD8+ immune infiltration and other clinicopathological features in stage II colon cancer. By applying machine learning‐based modeling using data from single nucleotide polymorphism (SNP) arrays, next‐generation sequencing (NGS), fluorescence in situ hybridization (FISH), and immunohistochemistry, we suggest that genomic intratumor heterogeneity and aneuploidy are determinants of tumor dissemination.
Materials and methods
Cohorts of patients and tumor samples
A total of 84 stage II colon adenocarcinomas (pT3‐4N0M0) provided by the Hospital Clínic of Barcelona/IDIBAPS Tumor Biobank were retrospectively analyzed for this study. Patients were diagnosed between 2005 and 2016, and none of them received adjuvant chemotherapy after surgical resection of the primary tumor. Among them, 38 patients (45%) developed disease recurrence and 46 (55%) did not show recurrence after a median follow‐up time of 7.6 years (range from <1 to 14.5 years). The primary endpoint was time to recurrence (TTR), defined as the time from surgery of the primary tumor to disease recurrence, where death without recurrence was censored at the time of death. This study was approved by the institutional ethics committee of the Hospital Clínic of Barcelona (register HCB/2018/0174), and all patients signed an informed consent form in accordance with the Declaration of Helsinki. For analytical validation purposes, an independent cohort of 99 untreated stage II microsatellite‐stable (MSS) colon cancer patients (Colonomics) was included (EGAD00010001253) [25].
SNP arrays and copy‐number analysis
Copy‐number and loss‐of‐heterozygosity (LOH) profiling of tumors was performed using genome‐wide Affymetrix OncoScan SNP arrays on unmatched tumor specimens. All resulting CEL files were loaded onto Nexus Copy Number software version 9.0 (BioDiscovery, El Segundo, CA, USA) for data analysis and visualized using CNApp [26]. Major and minor allele numbers of each segment were inferred utilizing the Allele‐Specific Copy Number Analysis of Tumors (ASCAT) R package version 2.5 [27]. Copy‐number intratumor heterogeneity was inferred from whole‐genome copy‐number profiles derived from bulk tumor SNP‐array data. The proportion of tumor cells, or cancer cell fraction (CCF), carrying each CNA was mathematically derived as a function of its B‐allele frequency and the average major/minor allele numbers estimated by ASCAT, correcting by the sample purity, using the following equation:
where BAF corresponds to the major frequency (>0.5) of the B‐allele, major to the number of copies of the B‐allele, minor to the number of copies of the A‐allele, and p to the sample purity (0 to 1) obtained from ASCAT. The clonality of all detected CNAs was estimated by inferring the CCF of each chromosomal segment from SNP‐array data. CNAs and copy‐number neutral‐LOH (cnLOH) segments were considered subclonal when their CCF was less than 85% and clonal otherwise [28], although more stringent CCF thresholds were also tested. Details on data segmentation and processing are available in Supplementary materials and methods.
Targeted next‐generation sequencing
The full‐coding region of 48 CRC‐related genes (supplementary material, Table S1) was sequenced using a MiSeq platform (Illumina, San Diego, CA, USA) on a subset of 44 unpaired tumor samples to identify single nucleotide variants (SNVs) and small insertions and deletions (indels). Only those mutations detected by two callers, MuTect2 (v2.2) and Illumina Somatic Variant Caller (v2.6), were considered for ulterior analyses. A bioinformatic pipeline was designed to filter low‐quality variants, exclude synonymous and germline SNPs, and to only select mutations with pathogenic functional effects. A detailed description is provided in Supplementary materials and methods.
Predictive modeling by machine learning analysis
Multivariable classification analyses were computed integrating all master co‐variables to predict the probability of relapse for each patient using the caret framework in R. After imputation of missing values using the mice package and LASSO feature selection using glmnet on each training dataset, the gradient boosting machine algorithm from gbm was employed to classify patients with 10‐fold cross‐validation to reduce overfitting of predicted data. Discriminative performance of the model to discern recurrent from non‐recurrent patients was assessed by means of its area under the curve (AUC) (see extended description in Supplementary materials and methods.)
Details for tissue microarrays, FISH, immunohistochemistry, prognostic modeling, and statistical analysis are provided in Supplementary materials and methods.
Results
Clinicopathological characteristics and their prognostic value in the study population
Clinical and tumor‐related histopathological characteristics are listed in Table 1. Median age at diagnosis was 74 years (range 55–91 years) and 54% of the individuals were male. Most tumors were pT3 stage (73%) and had low histological grade (88%). Lymphovascular or perineural invasion and an invasive infiltrating margin were significantly more frequent in patients with disease relapse (p = 0.016 and 0.0008, respectively). Recurrent tumors showed remarkably lower amounts of tumor‐infiltrating CD8+ lymphocytes compared with non‐recurrent (p = 0.0003) (supplementary material, Figure S1A). High tumor budding and poorly differentiated clusters were also associated with disease relapse (p = 0.019 and 0.008, respectively).
Table 1.
Patient and tumor‐related clinicopathological characteristics.
| Variable | Strata | All (N = 84) | Recurrent patients (N = 38) | Non‐recurrent patients (N = 46) | P value | |||
|---|---|---|---|---|---|---|---|---|
| N | % | N | % | N | % | |||
| Age | Median (range), years | 77 (55–91) | 79 (55–87) | 76 (55–91) | 0.24 | |||
| Sex | Male | 45 | 53.57% | 23 | 60.53% | 22 | 47.83% | 0.35 |
| Female | 39 | 46.43% | 15 | 39.47% | 24 | 52.17% | ||
| pT stage | T3 | 61 | 72.62% | 26 | 68.42% | 35 | 76.09% | 0.59 |
| T4 | 23 | 27.38% | 12 | 31.58% | 11 | 23.91% | ||
| Histological grade | High | 10 | 11.90% | 2 | 5.26% | 8 | 17.39% | 0.10 |
| Low | 74 | 88.10% | 36 | 94.74% | 38 | 82.61% | ||
| Microsatellite status | MSS | 74 | 88.10% | 36 | 94.74% | 38 | 82.61% | 0.10 |
| MSI | 10 | 11.90% | 2 | 5.26% | 8 | 17.39% | ||
| Lymphovascular or perineural invasion | Yes | 13 | 15.48% | 10 | 26.32% | 3 | 6.52% | 0.016 |
| No | 71 | 84.52% | 28 | 73.68% | 43 | 93.48% | ||
| Infiltrating margin | Invasive | 49 | 58.33% | 30 | 78.95% | 19 | 41.30% | 0.0008 |
| Pushing | 35 | 41.67% | 8 | 21.05% | 27 | 58.70% | ||
| Tumor budding score | Bd1 | 42 | 50% | 13 | 34.21% | 29 | 63.04% | 0.019 |
| Bd2 | 16 | 19.05% | 8 | 21.05% | 8 | 17.39% | ||
| Bd3 | 26 | 30.95% | 17 | 44.74% | 9 | 19.57% | ||
| Poorly differentiated clusters | G1 | 47 | 55.95% | 15 | 39.47% | 32 | 69.56% | 0.008 |
| G2 | 24 | 28.57% | 17 | 44.74% | 7 | 15.22% | ||
| G3 | 13 | 15.48% | 6 | 15.79% | 7 | 15.22% | ||
| Lymphocytic CD8+ infiltration | High | 50 | 59.52% | 14 | 36.84% | 36 | 78.26% | 0.0003 |
| Low | 34 | 40.48% | 24 | 63.16% | 10 | 21.74% | ||
| PDL1 expression score (≥5%) | High | 21 | 25% | 7 | 18.42% | 14 | 30.43% | 0.31 |
| Low | 63 | 75% | 31 | 81.58% | 32 | 69.57% | ||
| CDX2 expression | Positive | 81 | 96.43% | 36 | 94.74% | 45 | 97.83% | 0.59 |
| Negative | 3 | 3.57% | 2 | 5.26% | 1 | 2.17% | ||
MSI, microsatellite‐instable; MSS, microsatellite‐stable; PD‐L1, programmed death ligand‐1.
P values ≤0.05 are displayed in bold.
To investigate the independent prognostic value of clinicopathological features, Cox proportional hazards models were fitted for TTR (Table 2). The mean time upon relapse in our cohort was 1.7 years (range 0.26–5.9 years). The strongest independent predictors in the multivariable setting were CD8+ lymphocytic infiltration [p = 0.00019; hazard ratio (HR) 0.25; 95% CI 0.12–0.52] (supplementary material, Figure S1B) and lymphovascular or perineural invasion (p = 0.0007; HR 3.70; 95% CI 1.73–7.91) (supplementary material, Figure S1C). Additionally, increased tumor budding was also associated with shorter TTR (p = 0.026; HR 1.56; 95% CI 1.05–2.31) (supplementary material, Figure S1D).
Table 2.
Univariate and multivariable Cox models for TTR, stratified by annotated clinicopathological and tumor‐genomic variables.
| Variable | Strata | Univariate analysis | Multivariable analysis | ||
|---|---|---|---|---|---|
| HR (95% CI) | P value | HR (95% CI) | P value | ||
| Age | – | 1.03 (0.99–1.07) | 0.16 | 1.03 (0.99–1.07) | 0.17 |
| Gender | Female versus male | 0.63 (0.33–1.21) | 0.17 | 0.63 (0.31–1.29) | 0.21 |
| pT stage | T4 versus T3 | 1.29 (0.65–2.56) | 0.46 | 1.05 (0.51–2.16) | 0.89 |
| Histological grade | High versus low | 0.46 (0.11–1.93) | 0.29 | 0.47 (0.11–1.99) | 0.31 |
| Microsatellite status | MSS versus MSI | 2.38 (0.57–9.91) | 0.23 | 1.33 (0.28–6.39) | 0.72 |
| Lymphovascular or perineural invasion | Yes versus no | 2.94 (1.41–6.10) | 0.004 | 3.70 (1.73–7.91) | 0.0007 |
| Infiltrating margin | Invasive versus pushing | 3.76 (1.72–8.23) | 0.0009 | 3.48 (1.54–7.89) | 0.0028 |
| Tumor budding score | Bd2 versus Bd1 | 1.73 (0.72–4.17) | 0.22 | 1.89 (0.73–4.88) | 0.19 |
| Bd3 versus Bd1/2 | 2.34 (1.23–4.47) | 0.009 | 1.97 (0.98–3.98) | 0.057 | |
| Continuous | 1.67 (1.16–4.40) | 0.0056 | 1.56 (1.05–2.31) | 0.026 | |
| Poorly differentiated clusters | G2 versus G1 | 3.06 (1.52–6.15) | 0.002 | 3.23 (1.56–6.71) | 0.002 |
| G3/2 versus G1 | 2.56 (1.33–4.92) | 0.005 | 2.59 (1.32–5.09) | 0.0058 | |
| Continuous | 1.49 (1.01–2.20) | 0.043 | 1.46 (0.99–2.17) | 0.059 | |
| Lymphocytic CD8+ infiltration | High versus low | 0.26 (0.14–0.51) | 0.00009 | 0.25 (0.12–0.52) | 0.00019 |
| PDL1 expression score (≥5%) | High versus low | 0.54 (0.24–1.23) | 0.14 | 0.59 (0.25–1.39) | 0.23 |
| CDX2 expression | Positive versus negative | 0.24 (0.06–0.99) | 0.048 | 0.06 (0.01–0.38) | 0.0028 |
| Chr 13q gain | Gain versus diploid | 2.76 (1.31–5.85) | 0.008 | 2.67 (1.16–6.14) | 0.02 |
| Chr 17q LOH | LOH versus diploid | 2.46 (1.09–5.54) | 0.03 | 2.69 (0.99–7.35) | 0.05 |
| CNA load | High versus low | 2.31 (1.12–4.79) | 0.023 | 2.46 (1.05–5.74) | 0.038 |
| CNA load (Colonomics cohort) | High versus low | 3.70 (1.58–8.68) | 0.003 | 3.82 (1.54–9.52) | 0.004 |
| Subclonal CNAs | High versus low | 2.19 (1.12–4.30) | 0.022 | 2.20 (1.09–4.44) | 0.028 |
| Subclonal SNVs and indels | High versus low | 1.24 (0.51–2.99) | 0.64 | 1.73 (0.65–4.58) | 0.30 |
| KRAS mut | Mut versus wild‐type | 0.74 (0.31–1.73) | 0.49 | 0.76 (0.31–1.87) | 0.55 |
| SOX9 mut | Mut versus wild‐type | 0.15 (0.06–0.41) | 0.03 | 0.20 (0.03–1.55) | 0.12 |
| NOTCH1 mut | Mut versus wild‐type | 3.61 (1.45–8.98) | 0.003 | 4.24 (1.54–11.69) | 0.005 |
| SYNE1 mut | Mut versus wild‐type | 2.90 (1.18–7.16) | 0.02 | 2.62 (0.96–7.15) | 0.06 |
Chr, chromosome; CI, confidence interval; CNA, copy‐number alteration; HR, hazard ratio; LOH, loss of heterozygosity; MSI, microsatellite‐instable; MSS, microsatellite‐stable; PD‐L1, programmed death ligand‐1.
P values ≤0.05 are displayed in bold.
Multivariable Cox models include age, sex, stage pT3/T4, histological grade, and microsatellite status as adjusting co‐variables.
Specific chromosomal aberrations and high CNA load in recurrent tumors
Genome‐wide profiling of CNAs was performed to identify potential chromosomal regions differentially altered in recurrent versus non‐recurrent tumors. The most frequent (>35%) CNAs across all tumors included gains on chromosomes 7, 8q, 13, and 20, and losses (>20%) affecting chromosome arms 5q, 8p, 14q, 15q, 17p, and 18q (Figure 1A). The most commonly altered minimal region (<2 Mb) of gain was located at 20q13.32–20q13.33 (71%), and the most repeatedly minimal peak of loss was 18q21.2–18q21.31 (61%). Of note, the frequencies of genomic imbalances observed in this study are in line with those previously reported [29].
Figure 1.
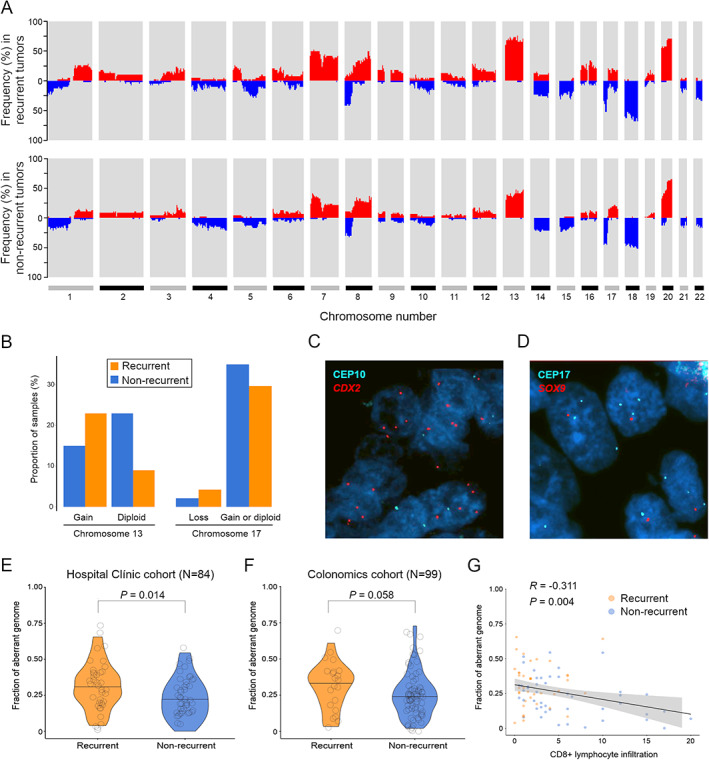
Genome‐wide CNA profiles associated with patient relapse outcome and tumor CD8+ immune infiltration levels. (A) Whole‐genome plot showing the accumulated frequency of copy‐number alterations per chromosome, in recurrent (N = 38) and non‐recurrent (N = 46) patients. (B) Proportion of recurrent and non‐recurrent tumors with different copy‐number status for chromosome arms 13q and 17q detected by FISH. (C, D) Representative FISH images of gain of chromosome arm 13q and loss of 17q utilizing gene locus‐specific probes against CDX2 and SOX9 as a surrogate of each chromosome arm, respectively. (E, F) Violin plots displaying measures of the fraction of aberrant genome, as a proxy of each tumor level of aneuploidy, in the two clinical groups, in both the Hospital Clínic and the Colonomics cohorts. Black lines indicate median values. P value was obtained by a two‐tailed Student's t‐test. (G) Correlation paired analysis between the proportion of aberrant genome and levels of intratumor CD8+ lymphocytes analyzed by immunohistochemistry. Rho and P values were obtained using Spearman's association test.
Several chromosomal regions appeared significantly more altered in tumors from recurrent patients compared with non‐recurrent (supplementary material, Table S2). Genomic imbalances affecting chromosome arm 13q11–q34 showed the most differential frequency between the two clinical groups (65% versus 36% of gains in recurrent and non‐recurrent cases, respectively; p = 0.018, FDR = 0.32). Two focal CNAs were exclusively present in recurrent tumors, namely the loss of 17q22–q24.3 (12% versus 0%; p = 0.029, FDR = 0.51) and 14q gain (14% versus 0%; p = 0.017, FDR = 0.31) (Figure 1A). In addition, cnLOH on 17p13.3–p13.1 was also over‐represented in recurrent tumors (23% versus 5%; p = 0.02, FDR = 0.40). Simple linear regression analyses showed a significantly positive correlation between median FISH signals and log2 ratios from SNP arrays for the two experimentally analyzed aberrations (R = 0.82 and R = 0.80 for chromosome arms 13q and 17q, respectively; p < 0.0001 in both cases) (supplementary material, Figure S2A,B), thus reproducing the frequencies of CNAs previously detected by SNP arrays (Figure 1B–D).
Since aneuploidy often increases during cancer progression, the fraction of aberrant genome (hereafter referred as to CNA load) was derived from each tumor SNP‐array segmented data. The mean CNA load across tumors was 27%, ranging from 0% to 66%. Tumors from patients with relapse exhibited significantly greater CNA loads in comparison to those without relapse, with mean values being 31.3% in recurrent versus 23% in non‐recurrent tumors (p = 0.014) (Figure 1E). When MSI‐positive cases were excluded, the mean values were 32.7% versus 26.8%, respectively (p = 0.075) (supplementary material, Figure S2C). These results were confirmed in the Colonomics cohort, which consisted of 99 MSS stage II colon cancer patients with means of 34.4% in recurrent versus 23% in non‐recurrent tumors (p = 0.058) (Figure 1F). In agreement with previous findings of decreased cytotoxic immune activity by CD8+ T cells in highly aneuploid tumors [30], we also detected a negative correlation between the CNA load and CD8+ lymphocyte infiltration (R = −0.31; p = 0.004) (Figure 1G).
Recurrent tumors exhibit an increased number of subclonal copy‐number alterations
Next, we sought to investigate the association of copy‐number intratumor heterogeneity with disease relapse. We found considerable levels of subclonality amongst tumors, with 53% of total CNAs appearing as subclonal events, ranging from 0% to 100% per sample. Of those CNAs designated as subclonal, median CCF was 56% (9.8–84.9%). Relapsed tumors carried significantly more subclonal CNAs than non‐relapsed, with a median of 10 versus 7 events per group (two‐tailed Mann–Whitney U‐test, p = 0.02) (Figure 2A,B). Statistical significance persisted unchanged when more stringent CCF cut‐offs were tested (supplementary material, Figure S3A). In addition, subclonal CNAs appeared to positively correlate with CNA load (R = 0.52; p < 0.0001) (supplementary material, Figure S3B), suggesting that intratumor heterogeneity might result from increased aneuploidy.
Figure 2.
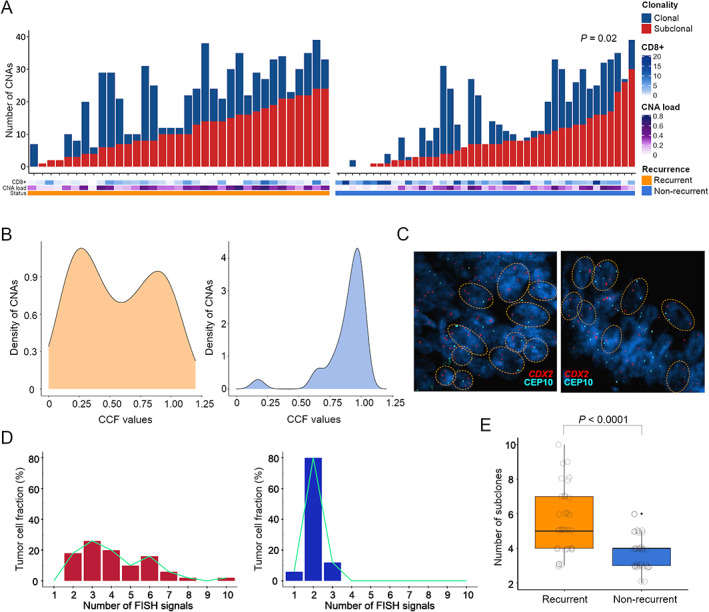
Intratumor heterogeneity of CNAs for untreated patients with stage II colon cancer. (A) Bar charts exhibit the number of CNAs that were found to be clonal or subclonal (<85% of cancer cells) per tumor inferred from SNP arrays, according to each patient recurrence status, CNA load, and CD8+ immune infiltration. (B) Representative density plots showing the distribution of CNAs in a recurrent (left panel) and a non‐recurrent (right panel) tumor. (C) FISH images of a tumor pair with a gained (left) and a diploid (right) 13q, illustrating divergent levels of subclonal heterogeneity. The FISH panel includes fluorescence‐based probes for CDX2 (13q) and the centromeric probe CEP10. (D) Histograms depicting the number of cell populations detected by FISH experimental analysis, from two exemplary tumors with different 13q copy‐number status and disparate recurrence outcome. Each subclonal population is defined as having a different copy number for chromosome arm 13q. (E) Box plot exhibiting the number of FISH subclonal populations for chromosome arm 13q, including all tumors from recurrent (N = 38) and non‐recurrent (N = 46) patients. P value was obtained by a Mann–Whitney U‐test for non‐parametric data.
Multi‐probe FISH was performed to examine the dynamics of subclonal CNAs for chromosome regions 13q12.2, 17q24.3, and 8q24.21. The results indicated that tumors with copy‐number gain on 13q, 17q or 8q exhibited increased subclonal populations compared with those with a diploid status (supplementary material, Figure S3C–E). Remarkably, when quantifying FISH signals for chromosome arm 13q, relapsed carcinomas displayed an increased number of subclonal populations with copy‐number alterations in comparison to non‐relapsed lesions (p < 0.0001) (Figure 2C–E). In contrast, we did not observe this association for chromosome 17q or 8q (supplementary material, Figure S3F–H), further supporting the selective impact of the chromosome 13q gain in fostering copy‐number intratumor heterogeneity and genomic complexity in early‐stage colon tumors.
Subclonal SNV and indel counts are not associated with disease relapse
To determine whether aneuploidy and levels of subclonal CNAs were associated with the status of the most frequently mutated genes in CRC, a targeted capture DNA sequencing approach was performed on a subset of 44 MSS tumors, including 22 from recurrent patients. Sequencing achieved a mean coverage of 96X in targeted exon regions. Overall, 43 out of the 48 cancer‐related genes showed a mutation in at least one patient (Figure 3A). Multi‐gene profiling revealed a total of 198 somatic non‐synonymous mutations falling in protein‐coding regions, accounting for both single nucleotide variants and small insertions/deletions (indels) (supplementary material, Table S3). Three genes showed a frequency of somatic mutation greater than 20%: APC (56.82%), TP53 (54.55%), and KRAS (47.73%) (Figure 3A). As expected, over 85% of mutations affecting APC were nonsense or frameshift, while in TP53 and KRAS the majority were missense changes (75% and 100%, respectively). Consistent with this, 86% of mutations affecting KRAS altered hotspot codon 12 or 13, including variant G35A, which represented 45% of the total RAS mutations. SOX9 also manifested a disproportionately high fraction (87.5%) of truncating events.
Figure 3.
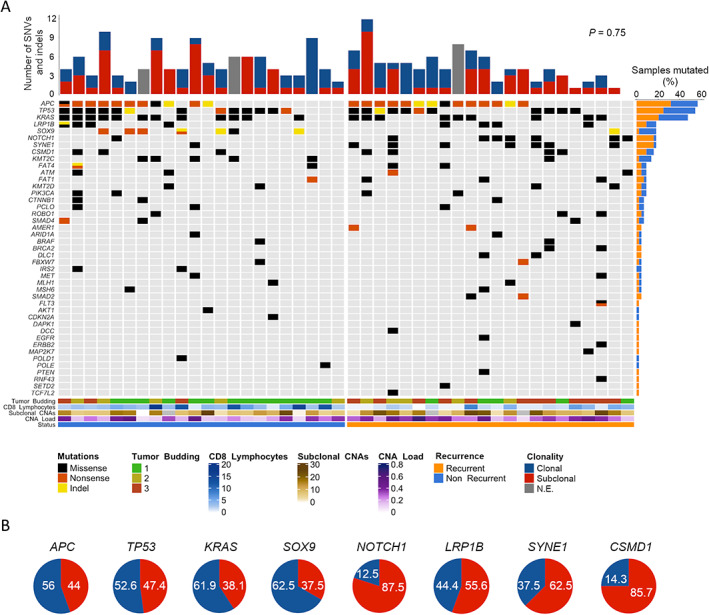
Mutational profiling and subclonal status of MSS tumors from patients with stage II colon cancer. (A) Oncoprint chart illustrates somatic mutation events (i.e. SNVs and indels) of the studied genes detected by targeted NGS, arranging cases in two groups according to patient recurrence status. Each column represents an individual tumor and each row a gene. Red/blue bar plot (top) shows the number of mutations per tumor, elucidating their clonal or subclonal (<85%) status. Orange/blue bar plot (right) represents the incidence (number of times) at which each gene was observed mutated. Genes with no mutations are not shown. Color bar plots (bottom) provide data on the genomic and pathological markers annotated in the legend (right). (B) Proportions of mutations that were identified as clonal (blue) or subclonal (red) for the eight most frequently mutated genes. Values are indicated as percentage (%). These percentages were obtained from the 41 patients included in the targeted sequencing that could also be analyzed by ASCAT for the clonality of SNVs and indels.
No statistically significant differences were observed for APC, TP53, and KRAS mutational status regarding the recurrence condition, nor were other clinical or genomic features (including the CNA load and subclonal CNAs) (Figure 3A and supplementary material, Table S3). In contrast, the mutational frequency of SOX9, SYNE1, and NOTCH1 appeared to correlate significantly with recurrence (p = 0.046, FDR = 0.14), SOX9 being more frequently mutated in non‐recurrent tumors.
To investigate levels of intratumor heterogeneity concerning single nucleotide variants, we estimated the CCF harboring each mutation, allowing for discrimination of subclonal (<85%) from clonal variants. Of the total variants identified, 53% were subclonal, showing a median CCF of 49% (10–84%). In our analysis, recurrent tumors did not exhibit increased subclonal SNVs and indels compared with non‐recurrent ones (p = 0.75) (Figure 3A). Among genes with a mutational frequency above 15%, APC, TP53, and KRAS, as well as SOX9, appeared to be mutated in a clonal state in most cases (62.5%). Conversely, NOTCH1, LRP1B, SYNE1, and CSMD1 were predominantly subclonal (Figure 3B).
Tumor aneuploidy and intratumor heterogeneity are associated with risk of disease relapse
When we assessed the independent prognostic value of the above‐described genomic features for TTR (Table 2 and supplementary material, Table S4 and Figure S4A), patients with gain of chromosome arm 13q exhibited a shorter TTR and a higher risk for recurrence compared with those with a diploid 13q (p = 0.02; HR 2.67; 95% CI 1.16–6.14) in a multivariable analysis correcting for age, sex, pT3/T4, histological grade, and microsatellite status (Figure 4A). TTR was also consistently shorter in those patients with tumors carrying LOH at 17q22–q24.3 (i.e. loss or cnLOH) (p = 0.05; HR 2.69; 95% CI 0.99–7.35) (Figure 4B).
Figure 4.
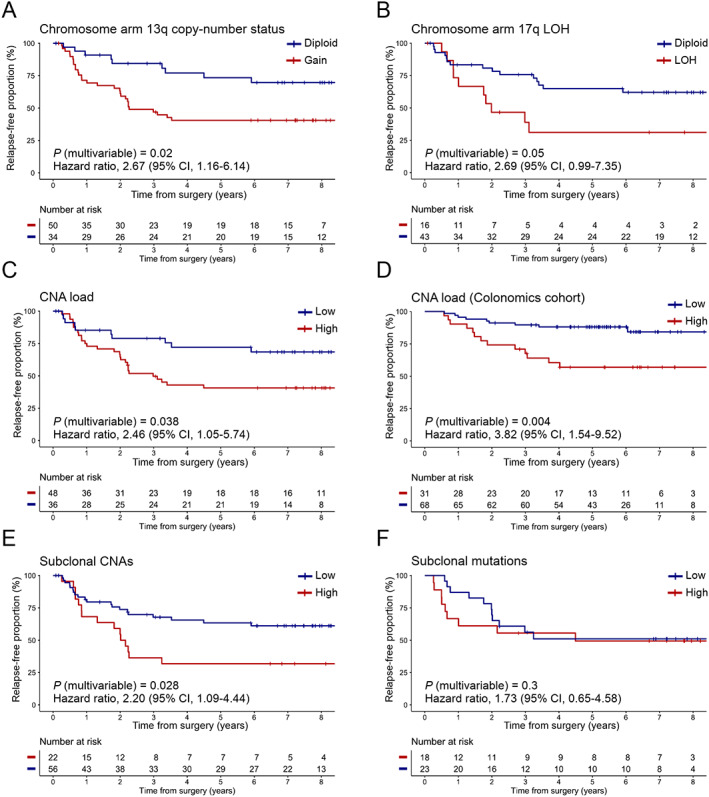
Prognostic value of tumor aneuploidy and genomic heterogeneity for TTR in stage II colon cancer patients. Kaplan–Meier estimates displaying the cumulative proportion (Y axis) of study patients who were relapse‐free over an 8‐year period (X axis), stratifying by (A) the presence or absence of chromosome arm 13q aberration; (B) 17q22–24.3 LOH (comprising loss or somatic cnLOH); (C) a high or low proportion of CNA load in the study population (N = 84), and (D) in an independent cohort of patients (N = 99) diagnosed with MSS tumors; (E) the level of subclonal CNAs identified with SNP arrays; and (F) a high or low level of subclonal SNVs and indels detected by targeted NGS. P values were obtained using the log‐rank test and hazard ratios using a Cox regression model with proportional hazards, correcting by age, sex, stage pT3/T4, histological grade, and microsatellite status. Cut‐off values to categorize numerical variables were as follows: (i) for CNA load (Hospital Clínic cohort), 24.41%; (ii) for CNA load (Colonomics cohort), 32%; (iii) for subclonal CNAs, 13.5; and (iv) for subclonal mutations, 1 (out of an average 4.5 mutations per sample, as derived from the 48‐gene panel sequencing).
We then addressed the association of high levels of tumor aneuploidy and genomic intratumor heterogeneity with adverse clinical outcome. Kaplan–Meier analysis showed that patients with tumors bearing high CNA loads were at a significantly higher risk of relapse compared with those with low aneuploidy, independent of patient clinical status (p = 0.038; HR 2.46; 95% CI 1.05–5.74) (Figure 4C). The median time until relapse was 31.48 months in the higher‐risk group versus 75.28 months in the lower‐risk group. This same association was validated in the independent cohort Colonomics (p = 0.004; HR 3.82; 95% CI 1.54–9.52) (Figure 4D).
Furthermore, elevated copy‐number intratumor heterogeneity was associated with higher risk of recurrence (p = 0.028; HR 2.20; 95% CI 1.09–4.44) (Figure 4E). The median time until relapse was 25.03 months in the high subclonal CNAs group compared with 70.80 months in the lower group. However, there was no significant correlation of the proportion of subclonal SNVs and indels with risk of relapse (p = 0.30; HR 1.73; 95% CI 0.65–4.58) (Figure 4F). Regarding the prognostic value of specific mutated genes, patients with SOX9 mutations exhibited a significantly longer TTR in a univariate analysis (p = 0.028; HR 0.15; 95% CI 0.06–0.41) (supplementary material, Figure S4B). Conversely, NOTCH1 and SYNE1 mutations were associated with an increased risk of disease recurrence (p = 0.003; HR 3.61; 95% CI 1.45–8.98; and p = 0.02; HR 2.90; 95% CI 1.18–7.16, respectively) (Table 2 and supplementary material, Figure S4C,D).
Genomic markers improve the prediction of disease recurrence compared with clinicopathological parameters alone
Predictive modeling was performed to classify patients with the primary endpoint of predicting their individual risk of relapsing. Genomic and mutational features with the highest prognostic values (supplementary material, Figure S5), together with all clinicopathological markers, were included in conventional machine learning analysis to assess their integrated discriminatory power in our cohort of 84 patients. Among the eight classifier algorithms tested (see Supplementary materials and methods), the gradient boosting machine method was selected as it ranked the shortest fraction of misclassified cases (data not shown). Variables included in each fold classification, as determined by LASSO feature selection (see Supplementary materials and methods), are reported in supplementary material, Table S6. The median number of predictor features included for each classification was 12/22 (54.5%) per fold (range 6–17). We constructed 10‐fold cross‐validated models using three different combinations of risk predictors: clinical‐, genomic‐ and clinico‐genomic‐based, each one comprising the annotated variables indicated in supplementary material, Figure S6. For the clinical‐based model, the classifier algorithm correctly predicted 58/84 cases (69% accuracy), achieving 70% sensitivity and 69% specificity; for the genomic‐based, it correctly spotted 52/84 patients (62% accuracy), with 58% sensitivity and 66% specificity; while for the clinico‐genomic model, predictions yielded 64/84 correctly classified patients (76% accuracy), attaining 73% sensitivity and 80% specificity. For instance, false‐positive rates were always inferior to their respective false‐negative counts in the two biomarker models comprising genomic features (Table 3).
Table 3.
Performance metrics of the biomarker models obtained by machine learning to predict relapse.
| Endpoint | AUC | Sensitivity | Specificity | PPV | NPV | Accuracy |
|---|---|---|---|---|---|---|
| (0.95 CI) | (0.95 CI) | (0.95 CI) | (0.95 CI) | (0.95 CI) | (0.95 CI) | |
| Clinico‐genomic‐based model | 0.83 | 0.73 | 0.80 | 0.75 | 0.78 | 0.76 |
| (0.74–0.92) | (0.59–0.84) | (0.67–0.89) | (0.64–0.83) | (0.69–0.84) | (0.74–0.78) | |
| Clinical‐based model | 0.74 | 0.70 | 0.69 | 0.65 | 0.73 | 0.69 |
| (0.63–0.84) | (0.53–0.83) | (0.57–0.79) | (0.56–0.73) | (0.63–0.82) | (0.67–0.71) | |
| Genomic‐based model | 0.66 | 0.58 | 0.66 | 0.58 | 0.65 | 0.62 |
| (0.54–0.78) | (0.43–0.71) | (0.52–0.78) | (0.48–0.68) | (0.57–0.73) | (0.60–0.64) |
CI, confidence interval; NPV, negative predictive value; PPV, positive predictive value.
In terms of discriminatory ability, receiving operating characteristic (ROC) curve analyses revealed that the clinico‐genomic combination achieved an AUC of 0.83 (95% CI 0.74–0.92), as opposed to inferior AUC values of 0.74 (95% CI 0.63–0.84) for the clinical‐based and 0.66 (95% CI 0.54–0.78) for the genomic‐based models, respectively (Figure 5 and Table 3). The addition of the genomic‐related variables to baseline clinicopathological parameters caused a significant 10% incremental gain in the AUC (DeLong's p = 0.047).
Figure 5.
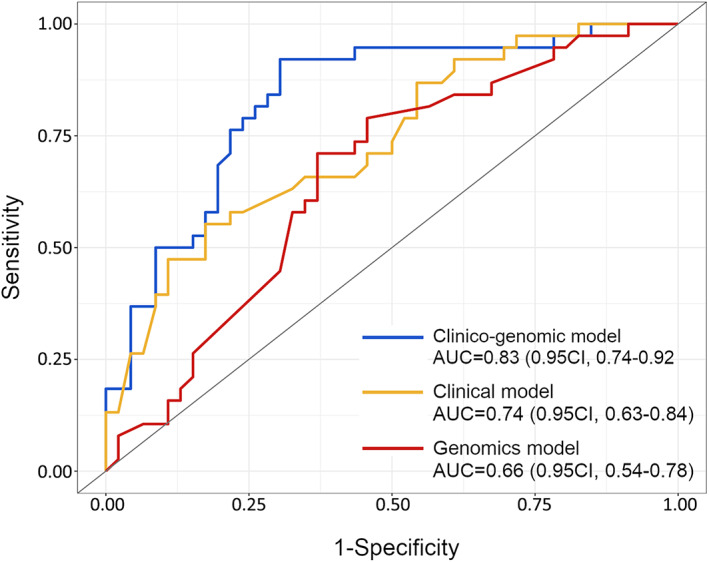
Discriminative ability of the three stage II biomarker models for predicting individual patient probability of recurrence. ROC curves are shown for comparative analysis of the three different combinations of variables. The AUC scores and 0.95 CI for each model are indicated.
Discussion
Intratumor heterogeneity fosters cancer evolution, leading to metastatic progress and therapy resistance [8]. In the present study, we investigated the relative contribution of genomic intratumor heterogeneity involving CNAs and mutational events as a prognostic determinant for disease recurrence in untreated stage II colon cancer patients. Additionally, we constructed a predictive model integrating the levels of genomic complexity along with clinicopathological features, enabling the identification of those patients at high risk of recurrence with notable discriminative ability.
Tumor aneuploidy, or the presence of chromosome imbalances, is a hallmark of human solid malignancies [31] and has been depicted as an unfavorable prognostic factor pan‐cancer [32, 33]. We define the CNA load as a static measurement of the levels of numerical chromosomal alterations genome‐wide. Increased CNA load has already been shown to predict poor outcome in metastatic CRC [24], yet it has not been thoroughly explored in early‐stage disease as a prognostic biomarker. In our cohort of stage II colon cancer, tumors from recurrent patients encompass significantly higher CNA load compared with non‐recurrent. This trend is maintained when excluding MSI cases, which in general exhibit near‐diploid karyotypes and fall in the non‐recurrent group. Importantly, our data support a strong correlation between high CNA load and lower probability of being relapse‐free in two independent cohorts, with the consideration that the validation cohort consisted of MSS tumors exclusively. Therefore, these findings might provide evidence on the prognostic contribution of tumor aneuploidy in early‐stage colon cancer. As regards chromosome‐specific regions with the ability to discriminate recurrent lesions, we found several CNAs including gain of chromosome arm 13q and loss at 17q22–q24.3, although their statistical significance decreased after multiple testing correction. In line with this, a previous study already showed that gains of CDX2, located at 13q12.2, were exclusively seen in primary recurrent adenomas compared with those without recurrence [34]. The analysis of the Colonomics series by Alonso et al [25] revealed several focal CNA regions associated with disease‐free survival, yet showed no broad recurrent CNAs correlated with prognosis in MSS stage II colon cancers. Of note, we identified that sample purities in the Colonomics cohort were ~10% inferior than those from our cohort (median 68%, ranging from 32–100%, in the Hospital Clínic cohort and median 59.5%, ranging from 38–100%, in the Colonomics dataset; Mann–Whitney test, p = 0.007), which probably hampered the copy‐number analysis and consequently, subclonal CNAs might have remained masked.
To capture an approximative measure of the degree of intratumor heterogeneity of each tumor, we determined the subclonal status of CNAs, cnLOH, and mutations. The fact that all patients included in this study were chemotherapy‐untreated avoids the genetic bottleneck caused by cancer therapy, enabling better preservation of the original overall clonal diversity. Increased levels of subclonal CNAs have been associated with poor outcome in non‐small cell lung cancer [19] and hepatocellular carcinoma [20], while mutational multi‐clonality correlated with worse disease‐free survival in stages I–IV CRC [35]. Likewise, our data show that tumors with elevated subclonal CNAs exhibit a significantly shorter TTR, making it plausible that early‐stage tumors with extensive copy‐number intratumor heterogeneity might fall in the high‐risk group likely to benefit from adjuvant chemotherapy. These results are in line with a recent report showing that chromosomal copy number heterogeneity is able to predict poor patient survival pan‐cancer [36]. Besides, we find that tumors with a high CNA load display increased degrees of subclonal CNAs, which reinforces the idea that intratumor heterogeneity predominantly occurs in highly aneuploid tumors through a process governed by ongoing CIN. In contrast, the amount of subclonal SNVs and indels did not appear to be associated with recurrence in our cohort, strengthening the potential prognostic power of CIN over the tumor mutational burden, possibly because a sole CNA can disrupt the transcription of a multitude of genes simultaneously [37, 38]. Of note, our targeted sequencing approach was designed to test the mutational status of a limited panel of 48 driver genes, which makes it difficult to extrapolate these results to the entire genome. Our results are consistent with previous reports showing that gene copy numbers, but not coding mutations, are highly discordant between colorectal primary tumors and their matched metastases [39]. Considering these results, the need to assess CNAs using noninvasive approaches, such as liquid biopsy, urges further attention in the clinical setting.
The mutational landscape of CRC has been well characterized [29]. Our results suggest that tumor levels of subclonal CNAs are independent of the mutational status of the main CRC driver genes (i.e. APC, TP53, and KRAS). We find that none of the previous three mutated genes correlates with risk of relapse, in concordance with reported data in stages II–III colon cancer [4, 40]. It is noteworthy that the mutational status of SOX9, NOTCH1, and SYNE1 displayed prognostic value in our cohort. In CRC, overexpression of NOTCH1 has been shown as a negative predictor of overall survival [41], consistent with our findings for TTR. Conversely, patients with mutations in SOX9 exhibited a longer TTR in our series, but this association appears to weaken in the multivariable setting. This result is in line with a previously reported association of SOX9 mutations with increased overall survival in metastatic CRC [42] and overexpression of SOX9 at the invasive front with significantly higher relapse‐free times in stage II colon cancer [43]. Finally, our observations on SOX9‐mutated and APC‐wild‐type tumors displaying more abundant CD8+ lymphocyte populations than their counterparts suggest a putative role for the WNT/β‐catenin pathway in modulating the tumor‐infiltrating T‐cell compartment [44].
Besides the independent prognostic value of genomic markers, our data reinforce the idea that tumor microenvironment features (e.g. low intratumor CD8+ lymphocytic infiltration) and the presence of lymphovascular or perineural invasion are still the most potent determinants of poor outcome in locally advanced colon cancer. The impact of anti‐cancer immune cytotoxicity as a major determinant for disease recurrence in stages II–III has been widely validated in multiple independent series of patients over the past 5 years [4, 45, 46]. In addition, tumor budding and poorly differentiated clusters might constitute early histological features potentially leading to an ulterior metastatic phenotype [5], which might explain their strong ability to predict risk of relapse in early‐stage colon cancer. Finally, in a large‐cohort study, the lack of CDX2 expression was associated with shorter relapse‐free survival in stage II colon cancer [47]. We observed the same trend regardless of the low number of tumors with CDX2 negative expression.
Despite the plethora of identified prognostic biomarkers, prediction of stage II colon cancer recurrence based on molecular information is still an open problem. Here, we created a machine learning‐based predictive model integrating a range of 22 risk predictors. The best configuration of our clinico‐genomic model achieved significant discriminant capacity, rating an AUC of 83%, comparable with previous reported AUC values in various stage II colon cancer cohorts using molecular‐based signatures [48, 49]. In our predictive model, the addition of genomic‐related markers to the patient clinicopathological information caused a significant increase in the AUC of 9 points, which was also associated with a similar increase in the sensitivity and accuracy. Intriguingly, across the three combination models, specificity values were always higher than their respective sensitivities by 5–10 points, stressing the need to identify more sensitive strategies capable of reducing false‐negative rates. An obvious limitation of the present study is that 22 predictors included in the clinico‐genomic model might be difficult to manage in routine clinical practice. To reduce the number of variables and to address potential multicollinearity, a feature selection step was included in the machine‐learning process, which selected CD8+ lymphocyte infiltration in 100% of folds, SOX9 mutational status in 50% of folds, and both the CNA load and subclonal CNAs in 25% of folds, these latter two appearing as mutually exclusive. Interestingly, the additive predictive power of subclonal CNAs over CD8+ lymphocyte infiltration was the same as SOX9 mutations over CD8+ lymphocyte infiltration (AUC = 71%), suggesting a biological link between SOX9 and the tumor T‐cell infiltration.
To summarize, our results reinforce the potential value of intratumor heterogeneity driven by chromosomal instability as a prognostic factor in early‐stage colon cancer. In this scenario, patients with tumors harboring high levels of aneuploidy and subclonal CNAs might be at risk of relapse and could benefit from early therapeutic intervention during disease monitoring. Given the retrospective design of this study, we advocate for these results to be further validated in randomized, prospective clinical trials incorporating NGS strategies, intending to optimize patient stratification at the adjuvant setting.
Author contributions statement
SL, IA, MC and JC conceptualized the study. SL, IA, EA, QF, SL‐P and JDR. performed experiments. SL, EH‐I, FN and JJL analyzed the data. RS‐P provided the external dataset. AC and MC contributed to accessing clinical samples and patient data. SL, IA, MC and JC wrote the manuscript. MC and JC supervised the study. All the authors read and agreed with the final version of the manuscript.
Supporting information
Supplementary materials and methods
Figure S1. Kaplan–Meier estimates on TTR stratified by the annotated immunohistochemistry‐based variables
Figure S2. Correlation of FISH counts with SNP‐array copy‐number quantification
Figure S3. Extended assessments to validate intratumor heterogeneity analysis
Figure S4. Kaplan–Meier measures of TTR stratified by the mutational status of three genes tested by NGS
Figure S5. Analysis of the prognostic risk of the clinico‐genomic variables included in the predictive model
Figure S6. Flowchart of the machine learning‐based approach to develop our predictive model based on the annotated clinical and genomic variables
Table S1. Summary of the targeted genes and exon regions tested in the NGS analysis
Table S2. Chromosomal regions with a differential frequency of copy‐number or LOH alteration between relapsed and non‐relapsed tumors identified by SNP arrays
Table S3. Differential frequency of single nucleotide variants or indels in relapsed and non‐relapsed tumors for the 48‐gene panel analyzed by targeted sequencing
Table S4. Alternative multivariable Cox models for TTR, stratified by annotated clinico‐pathological and tumor‐genomic variables
Table S5. Train and test AUCs per fold and DeLong's pairwise comparisons between biomarker models
Table S6. Variables selected per fold using LASSO‐based feature selection
Acknowledgements
We would like to thank Dr Joaquim Radua (from IDIBAPS) for statistical assistance, Dr Daniel Aguilar (from CIBEREHD) for bioinformatics support, Dr Thomas Ried (from the National Cancer Institute/National Institutes of Health) for critical reading, and Dr Mireia Aragay (from University of Barcelona) for English editing. We are also grateful to the Biobank‐Tumor Bank and Functional Genomics platforms from IDIBAPS‐Hospital Clínic of Barcelona for preparing and processing samples and for microarrays and next‐generation sequencing procedures. The work was supported by the Xarxa de Bancs de Tumors de Catalunya sponsored by Pla Director d'Oncologia de Catalunya (XBTC). The study has been developed in part in the Centre Esther Koplowitz from IDIBAPS/CERCA Programme/Generalitat de Catalunya. This research was funded by grants from the Instituto de Salud Carlos III and co‐funded by the European Regional Development Fund (ERDF) (CPII18/00026, PI17/01304, PI20/00863), the CIBEREHD and CIBERONC programs from Instituto de Salud Carlos III, the Agència de Gestió d'Ajuts Universitaris i de Recerca, Generalitat de Catalunya (2017 SGR 1035), and Fundación Científica de la Asociación Española Contra el Cáncer (GCB13131592CAST). This article is based on work from COST Action CA17118, supported by COST (European Cooperation in Science and Technology). SL obtained a PFIS grant from Instituto de Salud Carlos III and co‐funded by the European Regional Development Fund (ERDF) (FI18/00221).
No conflicts of interest were declared.
Contributor Information
Miriam Cuatrecasas, Email: mcuatrec@clinic.cat.
Jordi Camps, Email: jcamps@clinic.cat.
Data availability statement
SNP‐array and targeted next‐generation sequencing data have been deposited in the National Center for Biotechnology Information (NCBI) Gene Expression Omnibus and are accessible through GEO Series accession number GSE172191.
References
References 50–53 are cited only in the supplementary material.
- 1. Benson AB, Venook AP, Al‐Hawary MM, et al. NCCN Guidelines Insights: Colon Cancer, Version 2.2018. J Natl Compr Canc Netw 2018; 16: 359–369. [DOI] [PMC free article] [PubMed] [Google Scholar]
- 2. Tournigand C, de Gramont A. Chemotherapy: is adjuvant chemotherapy an option for stage II colon cancer? Nat Rev Clin Oncol 2011; 8: 574–576. [DOI] [PubMed] [Google Scholar]
- 3. Meropol NJ. Ongoing challenge of stage II colon cancer. J Clin Oncol 2011; 29: 3346–3348. [DOI] [PubMed] [Google Scholar]
- 4. Dienstmann R, Villacampa G, Sveen A, et al. Relative contribution of clinicopathological variables, genomic markers, transcriptomic subtyping and microenvironment features for outcome prediction in stage II/III colorectal cancer. Ann Oncol 2019; 30: 1622–1629. [DOI] [PMC free article] [PubMed] [Google Scholar]
- 5. Ueno H, Ishiguro M, Nakatani E, et al. Prospective multicenter study on the prognostic and predictive impact of tumor budding in stage II colon cancer: results from the SACURA trial. J Clin Oncol 2019; 37: 1886–1894. [DOI] [PMC free article] [PubMed] [Google Scholar]
- 6. Mlecnik B, Bindea G, Angell HK, et al. Integrative analyses of colorectal cancer show Immunoscore is a stronger predictor of patient survival than microsatellite instability. Immunity 2016; 44: 698–711. [DOI] [PubMed] [Google Scholar]
- 7. Pagès F, Mlecnik B, Marliot F, et al. International validation of the consensus Immunoscore for the classification of colon cancer: a prognostic and accuracy study. Lancet 2018; 391: 2128–2139. [DOI] [PubMed] [Google Scholar]
- 8. Greaves M, Maley CC. Clonal evolution in cancer. Nature 2012; 481: 306–313. [DOI] [PMC free article] [PubMed] [Google Scholar]
- 9. Iacobuzio‐Donahue CA, Litchfield K, Swanton C. Intratumor heterogeneity reflects clinical disease course. Nat Cancer 2020; 1: 3–6. [DOI] [PubMed] [Google Scholar]
- 10. Cross W, Kovac M, Mustonen V, et al. The evolutionary landscape of colorectal tumorigenesis. Nat Ecol Evol 2018; 2: 1661–1672. [DOI] [PMC free article] [PubMed] [Google Scholar]
- 11. Diaz LA Jr, Williams RT, Wu J, et al. The molecular evolution of acquired resistance to targeted EGFR blockade in colorectal cancers. Nature 2012; 486: 537–540. [DOI] [PMC free article] [PubMed] [Google Scholar]
- 12. Johnson BE, Mazor T, Hong C, et al. Mutational analysis reveals the origin and therapy‐driven evolution of recurrent glioma. Science 2014; 343: 189–193. [DOI] [PMC free article] [PubMed] [Google Scholar]
- 13. Sansregret L, Vanhaesebroeck B, Swanton C. Determinants and clinical implications of chromosomal instability in cancer. Nat Rev Clin Oncol 2018; 15: 139–150. [DOI] [PubMed] [Google Scholar]
- 14. Sottoriva A, Kang H, Ma Z, et al. A Big Bang model of human colorectal tumor growth. Nat Genet 2015; 47: 209–216. [DOI] [PMC free article] [PubMed] [Google Scholar]
- 15. Watkins TBK, Lim EL, Petkovic M, et al. Pervasive chromosomal instability and karyotype order in tumour evolution. Nature 2020; 587: 126–132. [DOI] [PMC free article] [PubMed] [Google Scholar]
- 16. Yates LR, Gerstung M, Knappskog S, et al. Subclonal diversification of primary breast cancer revealed by multiregion sequencing. Nat Med 2015; 21: 751–759. [DOI] [PMC free article] [PubMed] [Google Scholar]
- 17. Hu Z, Ding J, Ma Z, et al. Quantitative evidence for early metastatic seeding in colorectal cancer. Nat Genet 2019; 51: 1113–1122. [DOI] [PMC free article] [PubMed] [Google Scholar]
- 18. Landau DA, Carter SL, Stojanov P, et al. Evolution and impact of subclonal mutations in chronic lymphocytic leukemia. Cell 2013; 152: 714–726. [DOI] [PMC free article] [PubMed] [Google Scholar]
- 19. Jamal‐Hanjani M, Wilson GA, McGranahan N, et al. Tracking the evolution of non‐small‐cell lung cancer. N Engl J Med 2017; 376: 2109–2121. [DOI] [PubMed] [Google Scholar]
- 20. Losic B, Craig AJ, Villacorta‐Martin C, et al. Intratumoral heterogeneity and clonal evolution in liver cancer. Nat Commun 2020; 11: 291. [DOI] [PMC free article] [PubMed] [Google Scholar]
- 21. Taylor AM, Shih J, Ha G, et al. Genomic and functional approaches to understanding cancer aneuploidy. Cancer Cell 2018; 33: 676–689.e3. [DOI] [PMC free article] [PubMed] [Google Scholar]
- 22. Wangsa D, Quintanilla I, Torabi K, et al. Near‐tetraploid cancer cells show chromosome instability triggered by replication stress and exhibit enhanced invasiveness. FASEB J 2018; 32: 3502–3517. [DOI] [PMC free article] [PubMed] [Google Scholar]
- 23. Hieronymus H, Schultz N, Gopalan A, et al. Copy number alteration burden predicts prostate cancer relapse. Proc Natl Acad Sci U S A 2014; 111: 11139–11144. [DOI] [PMC free article] [PubMed] [Google Scholar]
- 24. Smeets D, Miller IS, O'Connor DP, et al. Copy number load predicts outcome of metastatic colorectal cancer patients receiving bevacizumab combination therapy. Nat Commun 2018; 9: 4112. [DOI] [PMC free article] [PubMed] [Google Scholar]
- 25. Alonso MH, Aussó S, Lopez‐Doriga A, et al. Comprehensive analysis of copy number aberrations in microsatellite stable colon cancer in view of stromal component. Br J Cancer 2017; 117: 421–431. [DOI] [PMC free article] [PubMed] [Google Scholar]
- 26. Franch‐Expósito S, Bassaganyas L, Vila‐Casadesús M, et al. CNApp, a tool for the quantification of copy number alterations and integrative analysis revealing clinical implications. Elife 2020; 9: e50267. [DOI] [PMC free article] [PubMed] [Google Scholar]
- 27. Van Loo P, Nordgard SH, Lingjærde OC, et al. Allele‐specific copy number analysis of tumors. Proc Natl Acad Sci U S A 2010; 107: 16910–16915. [DOI] [PMC free article] [PubMed] [Google Scholar]
- 28. Nadeu F, Clot G, Delgado J, et al. Clinical impact of the subclonal architecture and mutational complexity in chronic lymphocytic leukemia. Leukemia 2018; 32: 645–653. [DOI] [PMC free article] [PubMed] [Google Scholar]
- 29. The Cancer Genome Atlas Network . Comprehensive molecular characterization of human colon and rectal cancer. Nature 2012; 487: 330–337. [DOI] [PMC free article] [PubMed] [Google Scholar]
- 30. Davoli T, Uno H, Wooten EC, et al. Tumor aneuploidy correlates with markers of immune evasion and with reduced response to immunotherapy. Science 2017; 355: eaaf8399. [DOI] [PMC free article] [PubMed] [Google Scholar]
- 31. Zack TI, Schumacher SE, Carter SL, et al. Pan‐cancer patterns of somatic copy number alteration. Nat Genet 2013; 45: 1134–1140. [DOI] [PMC free article] [PubMed] [Google Scholar]
- 32. Carter SL, Eklund AC, Kohane IS, et al. A signature of chromosomal instability inferred from gene expression profiles predicts clinical outcome in multiple human cancers. Nat Genet 2006; 38: 1043–1048. [DOI] [PubMed] [Google Scholar]
- 33. Bielski CM, Zehir A, Penson AV, et al. Genome doubling shapes the evolution and prognosis of advanced cancers. Nat Genet 2018; 50: 1189–1195. [DOI] [PMC free article] [PubMed] [Google Scholar]
- 34. Fiedler D, Heselmeyer‐Haddad K, Hirsch D, et al. Single‐cell genetic analysis of clonal dynamics in colorectal adenomas indicates CDX2 gain as a predictor of recurrence. Int J Cancer 2019; 144: 1561–1573. [DOI] [PMC free article] [PubMed] [Google Scholar]
- 35. Joung JG, Oh BY, Hong HK, et al. Tumor heterogeneity predicts metastatic potential in colorectal cancer. Clin Cancer Res 2017; 23: 7209–7216. [DOI] [PubMed] [Google Scholar]
- 36. van Dijk E, van den Bosch T, Lenos KJ, et al. Chromosomal copy number heterogeneity predicts survival rates across cancers. Nat Commun 2021; 12: 3188. [DOI] [PMC free article] [PubMed] [Google Scholar]
- 37. Henrichsen CN, Vinckenbosch N, Zöllner S, et al. Segmental copy number variation shapes tissue transcriptomes. Nat Genet 2009; 41: 424–429. [DOI] [PubMed] [Google Scholar]
- 38. Ried T, Meijer GA, Harrison DJ, et al. The landscape of genomic copy number alterations in colorectal cancer and their consequences on gene expression levels and disease outcome. Mol Aspects Med 2019; 69: 48–61. [DOI] [PubMed] [Google Scholar]
- 39. Mamlouk S, Childs LH, Aust D, et al. DNA copy number changes define spatial patterns of heterogeneity in colorectal cancer. Nat Commun 2017; 8: 14093. [DOI] [PMC free article] [PubMed] [Google Scholar]
- 40. Shen Y, Han X, Wang J, et al. Prognostic impact of mutation profiling in patients with stage II and III colon cancer. Sci Rep 2016; 6: 24310. [DOI] [PMC free article] [PubMed] [Google Scholar]
- 41. Chu D, Zhang Z, Zhou Y, et al. Notch1 and Notch2 have opposite prognostic effects on patients with colorectal cancer. Ann Oncol 2011; 22: 2440–2447. [DOI] [PubMed] [Google Scholar]
- 42. Javier BM, Yaeger R, Wang L, et al. Recurrent, truncating SOX9 mutations are associated with SOX9 overexpression, KRAS mutation, and TP53 wild type status in colorectal carcinoma. Oncotarget 2016; 7: 50875–50882. [DOI] [PMC free article] [PubMed] [Google Scholar]
- 43. Marcker Espersen ML, Linnemann D, Christensen IJ, et al. SOX9 expression predicts relapse of stage II colon cancer patients. Hum Pathol 2016; 52: 38–46. [DOI] [PubMed] [Google Scholar]
- 44. Sun X, Liu S, Wang D, et al. Colorectal cancer cells suppress CD4+ T cells immunity through canonical Wnt signaling. Oncotarget 2017; 8: 15168–15181. [DOI] [PMC free article] [PubMed] [Google Scholar]
- 45. Van den Eynde M, Mlecnik B, Bindea G, et al. The link between the multiverse of immune microenvironments in metastases and the survival of colorectal cancer patients. Cancer Cell 2018; 34: 1012–1026.e3. [DOI] [PubMed] [Google Scholar]
- 46. Sanz‐Pamplona R, Melas M, Maoz A, et al. Lymphocytic infiltration in stage II microsatellite stable colorectal tumors: a retrospective prognosis biomarker analysis. PLoS Med 2020; 17: e1003292. [DOI] [PMC free article] [PubMed] [Google Scholar]
- 47. Dalerba P, Sahoo D, Paik S, et al. CDX2 as a prognostic biomarker in stage II and stage III colon cancer. N Engl J Med 2016; 374: 211–222. [DOI] [PMC free article] [PubMed] [Google Scholar]
- 48. Kandimalla R, Linnekamp JF, van Hooff S, et al. Methylation of WNT target genes AXIN2 and DKK1 as robust biomarkers for recurrence prediction in stage II colon cancer. Oncogenesis 2017; 6: e308. [DOI] [PMC free article] [PubMed] [Google Scholar]
- 49. Jacob H, Stanisavljevic L, Storli KE, et al. A four‐microRNA classifier as a novel prognostic marker for tumor recurrence in stage II colon cancer. Sci Rep 2018; 8: 6157. [DOI] [PMC free article] [PubMed] [Google Scholar]
- 50. Dentro SC, Wedge DC, Van Loo P. Principles of reconstructing the subclonal architecture of cancers. Cold Spring Harb Perspect Med 2017; 7: a026625. [DOI] [PMC free article] [PubMed] [Google Scholar]
- 51. Torabi K, Miró R, Fernández‐Jiménez N, et al. Patterns of somatic uniparental disomy identify novel tumor suppressor genes in colorectal cancer. Carcinogenesis 2015; 36: 1103–1110. [DOI] [PMC free article] [PubMed] [Google Scholar]
- 52. Ueno H, Hase K, Hashiguchi Y, et al. Site‐specific tumor grading system in colorectal cancer: multicenter pathologic review of the value of quantifying poorly differentiated clusters. Am J Surg Pathol 2014; 38: 197–204. [DOI] [PubMed] [Google Scholar]
- 53. Lugli A, Kirsch R, Ajioka Y, et al. Recommendations for reporting tumor budding in colorectal cancer based on the International Tumor Budding Consensus Conference (ITBCC) 2016. Mod Pathol 2017; 30: 1299–1311. [DOI] [PubMed] [Google Scholar]
Associated Data
This section collects any data citations, data availability statements, or supplementary materials included in this article.
Supplementary Materials
Supplementary materials and methods
Figure S1. Kaplan–Meier estimates on TTR stratified by the annotated immunohistochemistry‐based variables
Figure S2. Correlation of FISH counts with SNP‐array copy‐number quantification
Figure S3. Extended assessments to validate intratumor heterogeneity analysis
Figure S4. Kaplan–Meier measures of TTR stratified by the mutational status of three genes tested by NGS
Figure S5. Analysis of the prognostic risk of the clinico‐genomic variables included in the predictive model
Figure S6. Flowchart of the machine learning‐based approach to develop our predictive model based on the annotated clinical and genomic variables
Table S1. Summary of the targeted genes and exon regions tested in the NGS analysis
Table S2. Chromosomal regions with a differential frequency of copy‐number or LOH alteration between relapsed and non‐relapsed tumors identified by SNP arrays
Table S3. Differential frequency of single nucleotide variants or indels in relapsed and non‐relapsed tumors for the 48‐gene panel analyzed by targeted sequencing
Table S4. Alternative multivariable Cox models for TTR, stratified by annotated clinico‐pathological and tumor‐genomic variables
Table S5. Train and test AUCs per fold and DeLong's pairwise comparisons between biomarker models
Table S6. Variables selected per fold using LASSO‐based feature selection
Data Availability Statement
SNP‐array and targeted next‐generation sequencing data have been deposited in the National Center for Biotechnology Information (NCBI) Gene Expression Omnibus and are accessible through GEO Series accession number GSE172191.