

Abstract
Purpose
Polycystic ovary syndrome is a complex heterogeneous endocrine disorder associated with established metabolic abnormalities and is a common cause of infertility in females. Glutathione metabolism in the cumulus cells (CCs) of women with PCOS may be correlated to the quality of oocytes for infertility treatment; therefore, we used a metabolomics approach to examine changes in CCs from women with PCOS and oocyte quality.
Methods
Among 135 women undergoing fertility treatment in the present study, there were 43 women with PCOS and 92 without. CCs were collected from the two groups and levels of pyroglutamic acid were measured using LC–MS/MS followed by qPCR and Western blot analysis to examine genes and proteins involved in pyroglutamic acid metabolism related to glutathione synthesis.
Results
Women with PCOS showed increased levels of l-pyroglutamic acid, l-glutamate, and l-phenylalanine and decreased levels of Cys–Gly and N-acetyl-l-methionine. Gene expression of OPLAH, involved in pyroglutamic synthesis, was significantly increased in women with PCOS compared with those without. Gene expression of GSS was significantly decreased in women with PCOS and synthesis of glutathione synthetase protein was decreased. Expression of nuclear factor erythroid 2-related factor 2, involved in resistance to oxidative stress, was significantly increased in women with PCOS.
Conclusions
CCs of women with PCOS showed high concentrations of pyroglutamic acid and reduced glutathione synthesis, which causes oxidative stress in CCs, suggesting that decreased glutathione synthesis due to high levels of pyroglutamic acid in CCs may be related to the quality of oocytes in women with PCOS.
Keywords: Polycystic ovary syndrome, Cumulus cells, Pyroglutamic acids, Glutathione, Metabolites
Introduction
Polycystic ovary syndrome (PCOS) is an endocrine disorder associated with metabolic abnormalities. Approximately 5% to 10% of reproductive-age women have PCOS and related infertility [1]. Common clinical indications of PCOS include hyperandrogenism, chronic anovulation, oligomenorrhea, and hyperinsulinemia [2]. PCOS is associated with a high risk of cardiovascular disease (CVD) and type 2 diabetes mellitus (T2DM) [1]. While the pathogenesis of PCOS remains unclear, it is a polygenic trait that originates from genomic variant interaction and environmental factors.
Metabolomics is a downstream complement to genomics, transcriptomics, and proteomics and involves the universal analysis of the physiological condition of a biological system. It represents the final state of genetic regulation and influence on enzymatic activities and endogenous biochemical reactions in a cell. The pathophysiology of PCOS involves abnormalities in several metabolic pathways, including altered regulation of steroid hormone and insulin signaling pathways [3, 4]. Women with PCOS have an increased risk of complications associated with metabolic disturbances. Insulin resistance, inflammation, dyslipidemia, and obesity are known risk factors for developing CVD and T2DM in PCOS [5]. Thus, understanding the metabolic dysfunction in PCOS may prevent long-term complications through appropriate screening, diagnosis, and intervention.
Previous studies into metabolic changes in PCOS patients showed significant increases in levels of serum saturated and unsaturated fatty acids, fatty amides (palmitic amide, oleamide), dehydroepiandrosterone sulfate, l-glutamic acid, azelaic acid, l-glyceric acid, and pyroglutamic acid and significant decreases in lysophosphatidylethanolamine, lysophosphatidylcholine, uridine, and l-carnitine in PCOS patients compared with controls [6, 7]. These differences in metabolites indicate abnormalities in steroid hormone biosynthesis, lipid and carbohydrate metabolism, glutathione (GSH) metabolism, amino acids, and nucleoside metabolism in PCOS patients [6]. Furthermore, significant decreases have been found in plasma levels of citrulline, lipid (CH2–CH2–C = C), arginine, lysine, ornithine, proline, glutamate, acetone, citrate, and histidine in PCOS patients compared with controls [8].
Gas chromatography with time-of-flight mass spectrometry (TOF–MS) and 1H nuclear magnetic resonance analysis revealed enhanced glycolysis and inhibition of the tricarboxylic acid cycle in women with PCOS and a low ratio of branched-chain amino acids/aromatic amino acids was associated with PCOS progression [9, 10]. Ovulatory dysfunction was correlated with increased production of threonine, serine, phenylalanine, tyrosine, and ornithine in PCOS patients. PCOS patients were also shown to have increased plasma levels of leucine and valine, and decreased levels of glycine, which may contribute to the sensitivity of insulin and could be biomarkers for long-term risk assessment of T2DM [9]. In contrast, PCOS patients showed increased fasting plasma concentrations of essential amino acids and branch chain amino acids, which may result from or contribute to insulin resistance [11].
Human follicular fluid from PCOS patients showed changes in intermediate metabolites which may have been caused by hyperandrogenism. Additionally, intermediate metabolite profiles in follicular fluid indicated that local ovary metabolism was related to mitochondria dysfunction in cumulus cells (CCs) in patients with PCOS. Mitochondrial crosstalk and metabolic signals may be involved in the pathogenesis of PCOS [12] and these previous studies revealed metabolic changes related to pathology in serum, plasma, and follicular fluid of women with PCOS [6–12].
Pyroglutamic acid, also known as 5-oxoproline, is an intermediate in GSH metabolism. Elevated levels of pyroglutamic acid may be a biomarker of GSH depletion [13]. High levels of pyroglutamic acid in the blood and decreased levels of GSH in urine are associated with oxidative stress [14]. GSH deficiency and insulin resistance remain controversial [15]. Pyroglutamic acidosis showed a high anion gap metabolic acidosis of unknown cause and is associated with sepsis and renal and hepatic dysfunction [16].
CCs support and protect the oocyte from the microenvironment and play a role in oocyte growth and maturation during the late stage of follicle development. Bidirectional communication between human oocytes and CCs is necessary for the acquisition of oocyte competence, early embryonic development, and expansion of CCs [17]. CCs are necessary for oocyte development and are associated with oocyte quality during folliculogenesis. Although several studies have reported changes in metabolic pathways of plasma, serum, and follicular fluid in infertile women with PCOS, it is unclear whether the metabolism in CCs is altered in women with PCOS. Therefore, the present study investigated changes in metabolism in the CCs of women with PCOS.
Materials and methods
Study population
This study population included 43 women with PCOS as the treatment group and 92 women without PCOS as the control group and was conducted from March 2020 to January 2021. All women met the met Rotterdam diagnostic criteria of the 2003 Women with PCOS [18] and all had oligoanovulation. Women with endometriosis, cancer diagnosis, diabetes, or autoimmune disease were excluded. The control group was selected from women attending the clinic due to male or tubal factor infertility. All women in the control group had regular menstrual cycles and normal androgen levels. The present study was approved by the Ethics Committee of the Tenth People's Hospital.
Isolation and storage CCs
All women underwent ovulation induction with clomiphene citrate and human menopausal gonadotrophin and used transvaginal ultrasound-guided follicle aspiration to retrieve oocytes 36 ~ 38 h after hCG administration. CCs were collected via follicular aspiration from women undergoing in vitro fertilization and then detached from the oocyte using hyaluronidase. CCs from individual patients were pooled, treated with 40% and 80% sperm gradients, and then centrifuged. Red blood cell lysis buffer was added to remove erythrocytes as previously described [19] then samples were washed three times with phosphate-buffered saline and flash-frozen in liquid nitrogen. The samples were stored at – 80 °C until used. The final cell pellet was used for metabolomics, RNA, and protein analysis.
Metabolite extraction
A volume of 100% methanol and internal standards were added to the cell suspensions. Next, chloroform was added to the samples, and centrifuged at 13,000 rpm for 10 min at 15 °C. The two phases were then transferred to a new tube and chilled acetonitrile (ACN) was added to each tube. The samples were vortexed, incubated at – 80 °C for 2 h, and centrifuged at 13,000 rpm for 10 min at 4 °C. The supernatant was transferred to new tubes and dried using a vacuum. The two tubes for each sample were pooled and resuspended in 50% ACN/water and then analyzed using ultra-high-performance liquid chromatography with TOF–MS [20].
Liquid chromatography with tandem mass spectrometry
The purified CCs were separated using Agilent 1290 Infinity LC ultra-high performance liquid chromatography and put into 4 autosamplers for metabolic analysis. The primary and secondary spectra of each sample were determined using an AB triple TOF 6600 mass spectrometer with instrument settings as previously described [21].
Data analysis
ProteoWizard software was used to convert the original data to.mzXML format. Peak alignment, retention time correction, and peak area extraction were performed using XCMS program. Data preprocessing was performed using the Pareto-scaling method followed by multidimensional statistical analysis. Multidimensional statistical analysis included orthogonal partial least squares discriminant analysis (OPLS-DA). Volcano plots were constructed using R software and one-dimensional statistical analysis including Student’s t test and multiple variation analysis.
qPCR
Total RNA was extracted from CCs using the TIANGEN RNA simple Total RNA Kit (company) according to the manufacturer’s instructions. RNA concentration was measured using a NanoDrop ND 2000 spectrophotometer (TIANGEN). TIANGEN reverse transcription kit (Fastking RT Kit) was used for the reverse transcription of RNA samples. The generated cDNA was then used as a template in the qPCR reaction to quantify the selected candidate gene. The reaction system was prepared in the following proportion: ChamQ Universal SYBR qPCR Master Mix (5 μL), forward and reverse primers (0.4 μL, 10 μM), cDNA (1 μL), and RNase-free water (3.6 μL). qPCR reaction was performed according to the following conditions: 95 °C for 80 s, 60 °C for 90 s, and 95 °C for 15 s. The cycle was repeated 40 times. The specific primer sequences are shown in Table 1. GAPDH was used as an internal control. The 2-ΔΔCt method was used to calculate relative changes in target gene expression.
Table 1.
Genes-related information
| Protein | Gene | Primer length | Primer Sequences (5'-3') | Tm |
|---|---|---|---|---|
| G-glutamyl-cyclotransferase | ggct | 138 | F: AGCAACCTGCTGACAGAGAGGA | 63.34 |
| R: GGCTATCCCTCCATGCCAAGTT | 62.42 | |||
| G-glutamyl cysteine synthase | gclc | 350 | F: AACCAAGCGCCATGCCGACC | 66.42 |
| R: CCTCCTTCCGGCGTTTTCGC | 64.32 | |||
| 5-oxoprolinase | oplah | 126 | F:GACTGTGCTCTGATGGTGTCTG | 60.93 |
| R:CCGCTCAGGTATGACAAAGCCA | 62.88 | |||
| Glutathione synthetase | gss | 806 | F: GCCCCATTCACGCTCTTCCCC | 65.69 |
| R: ATGCCCGGCCTGCTTAGCTC | 65.10 | |||
| Nuclear factor erythroid 2-related factor 2 | nrfe2l2 | 112 | F:CACATCCAGTCAGAAACCAGTGG | 61.36 |
| R: GGAATGTCTGCGCCAAAAGCTG | 63.44 |
qPCR primers: F: forward primer; R: reverse primer
Western blot analysis
Western blot analysis was performed according to standard protocols. Proteins were extracted from MGCs using a nuclear protein and cytoplasmic protein extraction kit (Servicebio). Protein concentration was measured using a BCA protein concentration assay kit (Servicebio, Wuhan, China). Proteins were loaded onto a 5% stacking gel for SDS-PAGE and transferred to a PVDF membrane (Servicebio). Rabbit anti-human glutathione synthetase (GSS) (1:1000; ABclonal, Wuhan, China) was used as the primary antibody and goat anti-mouse IgG conjugated with horseradish peroxidase (HRP) was used as the secondary antibody (1:3000; ABclonal). The images were analyzed using the Alpha software processing system (Burlington, MA, USA).
Statistical analysis
SPSS version 20.0 (SPSS Inc., Chicago, California, USA) was used to analyze data in the experiments. The mRNA expression level of the target gene was expressed as mean ± standard deviation and t test was used to assess statistical significance, where p < 0.05 was considered statistically significant.
Results
Patient demographics
The demographics of the women with and without PCOS are summarized in Table 2. Women with PCOS were significantly younger and had a higher body mass index LH, and the number of oocytes retrieved than women without PCOS. The maturation rate was significantly lower in PCOS group when compared with control group. There were no significant differences in serum concentrations of glucose, testosterone, and 17β-estradiol between the PCOS and control groups (Table 2).
Table 2.
Clinical characteristics of study participants
| Parameters | Normal (N = 93) | PCOS (N = 42) | P |
|---|---|---|---|
| Age (year) | 32.17 ± 3.04 | 28.79 ± 3.26 | < 0.001 |
| BMI (kg/m2) | 22.66 ± 0.37 | 25.83 ± 4.85 | < 0.001 |
| Glucose (mg/dl) | 5.192 ± 0.6 | 5.357 ± 0.86 | 0.190 |
| FSH (mIU/ml) | 8.06 ± 3.22 | 6.089 ± 2.02 | < 0.001 |
| LH (mIU/ml) | 5.149 ± 2.46 | 7.979 ± 3.87 | < 0.001 |
| T (nmol/L) | 1.155 ± 2.74 | 0.8983 ± 0.50 | 0.555 |
| E2 pmol/L | 122.65 ± 329.55 | 416.7 ± 109 | 0.736 |
| Number of oocytes retrieved | 8.7 ± 5.92 | 15.09 ± 8.30 | < 0.001 |
| Maturation rate (%) | 80.88 ± 24.46 | 62.33 ± 37.52 | 0.001 |
| Fertilization rate (%) | 92.64 ± 99.32 | 84.63 ± 84.35 | 0.653 |
| Pregnancy rate (%) | 53.49 | 31.18 |
Data are means ± standard deviation
BMI body mass index, E2 estradiol, FSH follicle-stimulating hormone, LH luteinizing hormone, T testosterone
Metabolomics analysis of CCs in women with and without PCOS
Metabolomics analysis revealed differences in the metabolic profiles of CCs between the PCOS and control groups. Among 20,546 metabolite ion peaks, 11,784 were found in positive ion mode and 8772 were found in negative ion mode. Furthermore, 21 metabolites showed differences between the PCOS and control groups, with 13 different metabolites in positive ion mode and 18 different metabolites in negative ion mode (Figs. 1 and 3a-b). Metabolites with VIP > 1 with multidimensional statistical analysis and p value < 0.05 with univariate statistical analysis were selected as the significant differential metabolites. Thirteen metabolites were detected at higher levels in women with PCOS, including five amino acids, three lipids, one nucleotide, and four others. Eight metabolites were significantly decreased, including one lipid, three amino acids, and four others. All detected metabolites were analyzed by heat mapping.
Fig. 1.

Time profile expression pattern of differentially expressed metabolites in CC derived from normal and PCOS women. A Positive mode and B negative mode. All quantitative information was marked using a color scale ranging from blue white and red for no changes, a little, and the highest up-regulation ratio, respectively. CP represents the CCs of the PCOS group and CC represents CCs of the normal group
Fig. 3.

Metabolite-metabolite correlation analysis. Positive correlations are shown in blue; negative correlations are shown in red. A Metabolite-metabolite correlation of group (positive mode). B Metabolite-metabolite correlation of group (negative mode). C KEGG enriched pathways of changed
Multivariate analysis
OPLS-DA score plots showed that supervised multivariate analysis revealed differences between the metabolites in CCs from the two groups, indicating a significant difference in metabolic components between the PCOS and control groups (Fig. 2a,b). Volcano plot analyses (Fig. 2c,b) revealed differences in metabolites between the two types of cells calculated from data for all tested substances. Cluster analysis of all the samples further revealed that the repeat results for PCOS and control cells clustered together, indicating a significant difference in metabolism. KEGG enrichment analysis using Fisher’s exact analysis of the PCOS vs. control group showed differentially expressed metabolites. The results revealed that choline metabolism in cancer, central carbon metabolism in cancer, glutathione metabolism, protein digestion, and absorption, and phenylalanine, tyrosine, and tryptophan biosynthesis were significantly different between the two groups (Fig. 3c).
Fig. 2.

A Score plots of principal component analysis of metabolome from CC of PCOS women in the negative ion modes. These plots display a clear separation between control and PCOS metabolome. The color circle (blue and green) around each sample group represents the 95% confidence intervals. B Score plots of principal component analysis of metabolome from CC of PCOS women in the positive ion modes. These plots display a clear separation between control and PCOS metabolome. The color circle (blue and green) around each sample group represents the 95% confidence intervals. C Volcano plot in negative ion mode showing the statistical significance (y-axis) and fold change (x-axis) for the difference between the metabolome of CC of PCOS and control women samples. p < 0.05, fold change ≥ 1.5. D Volcano plot in negative ion mode showing the statistical significance (y-axis) and fold change (x-axis) for the difference between the metabolome of MGC of PCOS and control women samples. p < 0.05, fold change ≥ 1.5, differential metabolites (pink), and non-differential substances (black) were screened out under the conditions of fold change ≥ 1 and p ≤ 0.05. CC represents cumulus cell in control group and CP represents cumulus cells in PCOS
Genes and proteins involved in GSH metabolism
We confirmed our liquid chromatography with tandem mass spectrometry (LC–MS/MS) results by performing qPCR to verify the gene expression of GGCT, GCLC, OPLAH, and GSS, involved in GSH synthesis, and NRF2, involved in antioxidative stress, in the CCs of PCOS patients. After 2-ΔΔCt conversion, qPCR analysis showed that the expression of OPLAH and NRF2 was significantly higher in PCOS group than in control group (5.16-fold and 2.25-fold, respectively, p < 0.05) and GSS expression was significantly lower in the PCOS group than the control group (0.35-fold; p < 0.05). Expression of GCLC and GGCT was 1.52-fold and 4.01-fold, respectively, higher in the PCOS group than control group (Fig. 4A). Western blot results showed that the expression of GSS in CCs was lower in the PCOS group than in the control group (Fig. 4b).
Fig. 4.
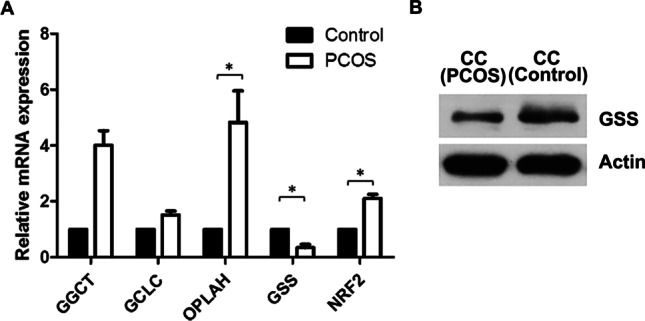
Pyroglutamic acid-induced cell stress in cumulus cell. A qRT-PCR expression analysis of the genes involved in the glutathione synthesis pathways in human cumulus cells. The expression levels of γ-glutamylcysteine ligase (GCL), glutathione synthetase (GSS), γ-glutamyl cyclotransferase (GGCT), 5-oxoprolinase (OPLAH) were analyzed in normal and PCOS patients. Data (technical triplicates of three biological experiments) are reported as means ± standard error. * indicates a statistically significant difference (p < 0.05). B Protein from cell lysates was resolved by SDS-PAGE and analyzed by Western blot using antibodies against GSS. The actin band is shown to confirm equal loading of proteins
Discussion
The present study is the first to describe differential metabolites profiles in CCs of women with PCOS. Differential metabolites were observed in women with PCOS compared with those without PCOS. Our results showed 21 metabolites were significantly different between the two groups, among which eight were involved in the amino acid pathway. Metabolomics analysis (UPHLC-Q-TOF–MS) of CCs showed increased levels of glutamate and pyroglutamic acid, whereas levels of glycine and cysteine were decreased in women with PCOS.
Previous studies in women with PCOS showed significantly increased serum levels of fatty amides (oleamide, palmitic amide), unsaturated and saturated fatty acids (linoleic acid, myristic acid, 9 and 13-hydroxyoctadecadienoic acid), dehydroepiandrosterone sulfate, l-glutamic acid, azelaic acid, pyroglutamic acid, and l-glyceric acid and decreased levels of uridine, l-carnitine, lysophosphatidylethanolamine, and lysophosphatidylcholine compared with control groups [6, 22]. In follicular fluid, 30 differential metabolites associated with amino acid metabolism were enriched in PCOS patients. Pyroglutamic acid, tyrosine, leucine, phenylalanine, tryptophan, and valine were considered to be core metabolites in the correlation network of metabolism. Among these, tryptophan and tyrosine were altered (increased) core metabolites, which affected PCOS metabolism [23]. These findings are similar to ours in that pyroglutamic acid and l-glutamic acid were enriched in the serum and follicular fluid of women with PCOS.
We found that levels of l-glutamic acid were significantly higher in women with PCOS compared with the control group. l-Pyroglutamic acid is a cyclized analog of l-glutamic acid and the conversion of l-pyroglutamic acid to l-glutamic acid by 5-oxoprolinase is the rate-limiting step of the 7-glutamyl cycle, which is involved with the intracellular transport of free amino acids and the synthesis and breakdown of GSH. GSH plays an important role in protecting cell membranes against peroxidative compounds [24]. High levels of l-pyroglutamic acid in the gamma-glutamyl cycle may be associated with GSH depletion and excessive oxidative stress, and its negative consequences depletion in a septic patient without enzymatic deficiency. Low levels of GSH and increased levels of GSSG are expected in situations of oxidative stress and increased redox potential. Several studies showed that low GSH levels were associated with increased levels of l-pyroglutamic acid and high oxidative stress [25–28]. Elevated levels of l-pyroglutamic acid in urine were associated with glycine insufficiency since levels increase when glycine is not sufficiently available to support GSH recovery via the renal gamma‐glutamyl cycle [29]. Thus, high levels of l-pyroglutamic acid may be a marker for GSH depletion [13].
GSH is a tripeptide comprising glutamate, cysteine, and glycine. Combined dietary supplementation of cysteine and glycine in the elderly and patients with diabetes enhanced glucose metabolism, increased GSH bioavailability, and reduced oxidative stress [15]. Therefore, GSH deficiency is commonly associated with oxidative stress. Several studies have evaluated the antioxidant effects of GSH in PCOS. One meta-analysis showed that mean GSH levels were 50% lower in PCOS patients than in the control group. In SF rats, decreased levels of GSH, cysteine, and γ-glutamylcysteine in the liver were observed due to the oxidation by free radicals and reactive oxygen species (ROS) [15]. In elderly humans, GSH deficiency occurs due to a marked reduction in synthesis. Dietary supplementation with cysteine and glycine induces GSH synthesis and concentrations and is related to lowers levels of oxidative stress and oxidant damage [30]. Similar to the findings of our study, Cys–Gly was significantly decreased in women with PCOS and led to a decrease in the expression of GSS, which may have led to a decrease in GSH production.
Oxidative stress is the imbalance between oxidants and antioxidants and the generation of excessive amounts of ROS [31]. Several studies have shown that oxidative markers are increased in PCOS patients compared with control groups and may trigger the pathogenesis of PCOS. PCOS patients showed low levels of antioxidants, which was associated with low levels of GSH and vitamins E and C, and increased activities of antioxidant enzymes, glutathione reductase, glutathione peroxidase, and glutathione transferase compared with the control group. However, insulin levels were also significantly increased and there was a positive correlation between insulin and oxidative stress parameters in PCOS patients. Increased oxidative stress combined with insulin resistance and low levels of antioxidants were correlated between these parameters. Thus, oxidative stress is involved in the pathophysiology of PCOS [32]. Elevated levels of total oxidant capacity (TOC) and the oxidative stress index (the ratio of TOC to TAC) were found in both follicular fluid and serum of the PCOS group compared with the control group. Thus, PCOS was accompanied by elevated oxidative stress in both follicular fluid and serum [33].
Our findings suggested that the alteration of several metabolic profiles in PCOS may affect cancerous development including choline metabolism in cancer [34], central carbon metabolism in cancer [35], glutathione metabolism [36], protein digestion and absorption [37], and phenylalanine, tyrosine, and tryptophan biosynthesis [38]. Accordingly, several studies supported that women with PCOS are associated with endometrial cancer [39, 40] but the association with other cancer is still unclear [41]. This evidence supposed that all metabolic changes may affect increased amounts of oxidative stress leading to generating cancer cells.
Nrf2 is a transcription factor that coordinates the basal and stress-inducible activation of a vast array of cytoprotective genes [42]. Nrf2 and Keap1, an endogenous nrf2 inhibitor, function as ubiquitous, conserved mechanisms of intracellular defense to prevent oxidative stress by regulating the transcription of components of the GSH and thioredoxin antioxidant systems [43]. Human GCs treated with hydrogen peroxide showed significantly higher gene expression of NRF2 and SOD1 than the control group. Thus, activation of Nrf2 may alleviate oxidative stress in human GCs [44]. We also found that higher expression of NRF2 was related to a decrease in GSS biosynthesis and an increase in OPLAH expression and pyroglutamic biosynthesis in human CCs of women with PCOS. Therefore, higher levels of l-pyroglutamic acid may lead to a decrease in GSH synthesis, inducing oxidative stress and activation of pro-antioxidants in women with PCOS.
Conclusion
Understanding the causes of PCOS and separating underlying pathogenic changes from secondary environmental disruptions remain a problem for clinical and basic research. Increased levels of l-pyroglutamic acid may be associated with low levels of GSH synthesis and high oxidative stress in women with PCOS (Fig. 5), suggesting that these changes may be associated with poor quality of oocytes and embryos during infertility treatment. However, the comparison of the metabolites between oocyte and cumulus cells in women with PCOS relates to oocyte growth, maturation, and subsequent embryonic developmental need to be further explored and studied.
Fig. 5.

Schematic show Gamma-glutamyl cycle, pyroglutamic acid biosynthesis and cysteine, glycine biosynthesis lead to decrease of glutathione biosynthesis. The decreased levels of cellular glutathione lead to decreased feedback for inhibition of γ-glutamylcysteine synthetase, and low glutathione levels would activate this enzyme
In addition to identifying novel metabolic biomarkers in CCs that can predict PCOS and its long-term complications, this study has significant implications for a better understanding of the metabolic pathways that are directly impacted by PCOS, which could serve as a rationale for the creation of novel therapeutic targets. Based on the amino acids and other metabolites identified in this study, additional correlation-based network analysis may assist us in developing a diagnostic indicator of PCOS.
Acknowledgements
This manuscript has been edited for English language and spelling by Enago.
Author contribution
R.C.C.: study design, manuscript writing, and critical discussion. B.T. and E.M.G.: study design, experiments execution, data analysis, manuscript writing, and critical discussion. F.Y., Y.B.L., Z.Y.Y, L.C.C, Y.J.X., W.M.H, L.W., and K.G.: experiments execution and manuscript comment. All authors read and approved the final manuscript.
Funding
This work was supported by the National Key R&D Program of China (No. 2017YFC1002003) and the Ministry of Science and Technology of China (No. 2017YFC1001601).
Data availability
Data and material are available offline.
Declarations
Ethics approval
This study was performed in line with the principles of the Declaration of Helsinki. Approval was granted by the Medical and Life Science Ethics Committee of Tongji University (approval No. 2017yxy001). All participants involved in this study have given their consent.
Consent for publication
Not applicable.
Competing interests
The authors declare no conflict of interest.
Footnotes
Publisher's note
Springer Nature remains neutral with regard to jurisdictional claims in published maps and institutional affiliations.
Bongkoch Turathum and Er-Meng Gao equally contributed to this study.
References
- 1.Goodarzi MO, Dumesic DA, Chazenbalk G, Azziz R. Polycystic ovary syndrome: etiology, pathogenesis and diagnosis. Nat Rev Endocrinol. 2011;7(4):219–231. doi: 10.1038/nrendo.2010.217. [DOI] [PubMed] [Google Scholar]
- 2.Norman RJ, Dewailly D, Legro RS, Hickey TE. Polycystic ovary syndrome. Lancet. 2007;370(9588):685–697. doi: 10.1016/S0140-6736(07)61345-2. [DOI] [PubMed] [Google Scholar]
- 3.Diamanti-Kandarakis E. Polycystic ovarian syndrome: pathophysiology, molecular aspects and clinical implications. Expert Rev Mol Med. 2008;10. [DOI] [PubMed]
- 4.Mukherjee S, Maitra A. Molecular & genetic factors contributing to insulin resistance in polycystic ovary syndrome. Indian J Med Res. 2010;131(6):743–761. [PubMed] [Google Scholar]
- 5.Wang ET, Calderon-Margalit R, Cedars MI, Daviglus ML, Merkin SS, Schreiner PJ, Sternfeld B, Wellons M, Schwartz SM, Lewis CE. Polycystic ovary syndrome and risk for long-term diabetes and dyslipidemia. Obstet Gynecol. 2011;117(1):6. doi: 10.1097/AOG.0b013e31820209bb. [DOI] [PMC free article] [PubMed] [Google Scholar]
- 6.Dong F, Deng D, Chen H, Cheng W, Li Q, Luo R, Ding S. Serum metabolomics study of polycystic ovary syndrome based on UPLC-QTOF-MS coupled with a pattern recognition approach. Anal Bioanal Chem. 2015;407(16):4683–4695. doi: 10.1007/s00216-015-8670-x. [DOI] [PubMed] [Google Scholar]
- 7.Zhao X, Xu F, Qi B, Hao S, Li Y, Li Y, Zou L, Lu C, Xu G, Hou L. Serum metabolomics study of polycystic ovary syndrome based on liquid chromatography–mass spectrometry. J Proteome Res. 2014;13(2):1101–1111. doi: 10.1021/pr401130w. [DOI] [PubMed] [Google Scholar]
- 8.Atiomo W, Daykin C. Metabolomic biomarkers in women with polycystic ovary syndrome: a pilot study. Mol Hum Reprod. 2012;18(11):546–553. doi: 10.1093/molehr/gas029. [DOI] [PubMed] [Google Scholar]
- 9.Zhao Y, Fu L, Li R, Wang L-N, Yang Y, Liu N-N, Zhang C-M, Wang Y, Liu P, Tu B-B, Zhang X, Qiao J. Metabolic profiles characterizing different phenotypes of polycystic ovary syndrome: plasma metabolomics analysis. BMC Med. 2012;10(1):153. doi: 10.1186/1741-7015-10-153. [DOI] [PMC free article] [PubMed] [Google Scholar]
- 10.Brinca AT, Ramalhinho AC, Sousa Â, Oliani AH, Breitenfeld L, Passarinha LA, Gallardo E. Follicular Fluid: A powerful tool for the understanding and diagnosis of polycystic ovary syndrome. Biomedicines. 2022;10(6):1254. doi: 10.3390/biomedicines10061254. [DOI] [PMC free article] [PubMed] [Google Scholar]
- 11.Chang AY, Lalia AZ, Jenkins GD, Dutta T, Carter RE, Singh RJ, Nair KS. Combining a nontargeted and targeted metabolomics approach to identify metabolic pathways significantly altered in polycystic ovary syndrome. Metab. 2017;71:52–63. doi: 10.1016/j.metabol.2017.03.002. [DOI] [PMC free article] [PubMed] [Google Scholar]
- 12.Zhao H, Zhao Y, Li T, Li M, Li J, Li R, Liu P, Yu Y, Qiao J. Metabolism alteration in follicular niche: the nexus among intermediary metabolism, mitochondrial function, and classic polycystic ovary syndrome. Free Radic Biol Med. 2015;86:295–307. doi: 10.1016/j.freeradbiomed.2015.05.013. [DOI] [PubMed] [Google Scholar]
- 13.Gamarra Y, Santiago FC, Molina-López J, Castaño J, Herrera-Quintana L, Domínguez Á, Planells E. Pyroglutamic acidosis by glutathione regeneration blockage in critical patients with septic shock. Crit Care. 2019;23(1):162. doi: 10.1186/s13054-019-2450-5. [DOI] [PMC free article] [PubMed] [Google Scholar]
- 14.Palmer BF, Alpern RJ. CHAPTER 12 - Metabolic Acidosis. In: Floege J, Johnson RJ, Feehally J, editors. Comprehensive clinical nephrology. 4. Philadelphia: Mosby; 2010. pp. 155–166. [Google Scholar]
- 15.El-Hafidi M, Franco M, Ramírez AR, Sosa JS, Flores JAP, Acosta OL, Salgado MC, Cardoso-Saldaña G. Glycine increases insulin sensitivity and glutathione biosynthesis and protects against oxidative stress in a model of sucrose-induced insulin resistance. Oxid Med Cell Longev. 2018;2018:2101562. doi: 10.1155/2018/2101562. [DOI] [PMC free article] [PubMed] [Google Scholar]
- 16.Wardell RJ, Burrows LA, Myall K, Marsh A. An unusual cause of high anion gap metabolic acidosis: pyroglutamic acidosis. Crit Care. 2012;16(1):P148. doi: 10.1186/cc10755. [DOI] [Google Scholar]
- 17.Demiray SB, Goker ENT, Tavmergen E, Yilmaz O, Calimlioglu N, Soykam HO, Oktem G, Sezerman U. Differential gene expression analysis of human cumulus cells. Clin Exp Reprod Med. 2019;46(2):76–86. doi: 10.5653/cerm.2019.46.2.76. [DOI] [PMC free article] [PubMed] [Google Scholar]
- 18.ESHRE TR, Group A-SPCW. Revised 2003 consensus on diagnostic criteria and long-term health risks related to polycystic ovary syndrome. Fertil Steril. 2004;81(1):19–25. [DOI] [PubMed]
- 19.Grøndahl ML, Andersen CY, Bogstad J, Borgbo T, Hartvig Boujida V, Borup R. Specific genes are selectively expressed between cumulus and granulosa cells from individual human pre-ovulatory follicles. Mol Hum Reprod. 2012;18(12):572–584. doi: 10.1093/molehr/gas035. [DOI] [PubMed] [Google Scholar]
- 20.Sheikh KD, Khanna S, Byers SW, Fornace AJ, Jr, Cheema AK. Small molecule metabolite extraction strategy for improving LC/MS detection of cancer cell metabolome. J Biomol Tech. 2011;22(1):1. [PMC free article] [PubMed] [Google Scholar]
- 21.Gao E-M, Turathum B, Wang L, Zhang D, Liu Y-B, Tang R-X, Chian R-C. The differential metabolomes in cumulus and mural granulosa cells from human preovulatory follicles. Reprod Sci. 2022;29(4):1343–1356. doi: 10.1007/s43032-021-00691-3. [DOI] [PMC free article] [PubMed] [Google Scholar]
- 22.Zhang Z, Hong Y, Chen M, Tan N, Liu S, Nie X, Zhou W. Serum metabolomics reveals metabolic profiling for women with hyperandrogenism and insulin resistance in polycystic ovary syndrome. Metabolomics. 2020;16(2):20. doi: 10.1007/s11306-020-1642-y. [DOI] [PubMed] [Google Scholar]
- 23.Hou E, Zhao Y, Hang J, Qiao J. Metabolomics and correlation network analysis of follicular fluid reveals associations between l-tryptophan, l-tyrosine and polycystic ovary syndrome. Biomed Chromatogr. 2021;35(3):e4993. doi: 10.1002/bmc.4993. [DOI] [PubMed] [Google Scholar]
- 24.Kumar A, Bachhawat AK. Pyroglutamic acid: throwing light on a lightly studied metabolite. Curr Sci. 2012;288–97.
- 25.Jackson AA, Gibson NR, Lu Y, Jahoor F. Synthesis of erythrocyte glutathione in healthy adults consuming the safe amount of dietary protein. Am J Clin Nutr. 2004;80(1):101–107. doi: 10.1093/ajcn/80.1.101. [DOI] [PubMed] [Google Scholar]
- 26.Geenen S, Yates JW, Kenna JG, Bois FY, Wilson ID, Westerhoff HV. Multiscale modelling approach combining a kinetic model of glutathione metabolism with PBPK models of paracetamol and the potential glutathione-depletion biomarkers ophthalmic acid and 5-oxoproline in humans and rats. Integr Biol. 2013;5(6):877–888. doi: 10.1039/c3ib20245c. [DOI] [PubMed] [Google Scholar]
- 27.Yu Y-M, Ryan CM, Fei Z-W, Lu X-M, Castillo L, Schultz JT, Tompkins RG, Young VR. Plasma L-5-oxoproline kinetics and whole blood glutathione synthesis rates in severely burned adult humans. Am J Physiol Endocrinol Metab. 2002;282(2):E247–E258. doi: 10.1152/ajpendo.00206.2001. [DOI] [PubMed] [Google Scholar]
- 28.Lord RS. Long-term patterns of urinary pyroglutamic acid in healthy humans. Physiol Rep. 2016;4(4):e12706. doi: 10.14814/phy2.12706. [DOI] [PMC free article] [PubMed] [Google Scholar]
- 29.Jackson AA, Badaloo AV, Forrester T, Hibbert J, Persaud C. Urinary excretion of 5-oxoproline (pyroglutamic aciduria) as an index of glycine insufficiency in normal man. Br J Nutr. 1987;58(2):207–214. doi: 10.1079/BJN19870088. [DOI] [PubMed] [Google Scholar]
- 30.Sekhar RV, Patel SG, Guthikonda AP, Reid M, Balasubramanyam A, Taffet GE, Jahoor F. Deficient synthesis of glutathione underlies oxidative stress in aging and can be corrected by dietary cysteine and glycine supplementation1–4. Am J Clin Nutr. 2011;94(3):847–853. doi: 10.3945/ajcn.110.003483. [DOI] [PMC free article] [PubMed] [Google Scholar]
- 31.Sies H, Berndt C, Jones DP. Oxidative stress. Annu Rev Biochem. 2017;86:715–748. doi: 10.1146/annurev-biochem-061516-045037. [DOI] [PubMed] [Google Scholar]
- 32.Fatima Q, Amin S, Kawa IA, Jeelani H, Manzoor S, Rizvi SM, Rashid F. Evaluation of antioxidant defense markers in relation to hormonal and insulin parameters in women with polycystic ovary syndrome (PCOS): a case-control study. Diabetes Metab Syndr. 2019;13(3):1957–1961. doi: 10.1016/j.dsx.2019.04.032. [DOI] [PubMed] [Google Scholar]
- 33.Liu Y, Yu Z, Zhao S, Cheng L, Man Y, Gao X, Zhao H. Oxidative stress markers in the follicular fluid of patients with polycystic ovary syndrome correlate with a decrease in embryo quality. J Assist Reprod Genet. 2021;38(2):471–477. doi: 10.1007/s10815-020-02014-y. [DOI] [PMC free article] [PubMed] [Google Scholar]
- 34.Assou S, Haouzi D, De Vos J, Hamamah S. Human cumulus cells as biomarkers for embryo and pregnancy outcomes. Mol Hum Reprod. 2010;16(8):531–538. doi: 10.1093/molehr/gaq032. [DOI] [PubMed] [Google Scholar]
- 35.Wang L, Guo M, Wang K, Zhang L. Prognostic roles of central carbon metabolism-associated genes in patients with low-grade glioma. Front Genet. 2019;10:831. doi: 10.3389/fgene.2019.00831. [DOI] [PMC free article] [PubMed] [Google Scholar]
- 36.Carretero J, Obrador E, Anasagasti MJ, Martin JJ, Vidal-Vanaclocha F, Estrela JM. Growth-associated changes in glutathione content correlate with liver metastatic activity of B16 melanoma cells. Clin Exp Metastasis. 1999;17(7):567–574. doi: 10.1023/A:1006725226078. [DOI] [PubMed] [Google Scholar]
- 37.Kurzer M, Meguid MM. Cancer and protein metabolism. Surg Clin North Am. 1986;66(5):969–1001. doi: 10.1016/S0039-6109(16)44036-3. [DOI] [PubMed] [Google Scholar]
- 38.Wiggins T, Kumar S, Markar SR, Antonowicz S, Hanna GB. Tyrosine, phenylalanine, and tryptophan in gastroesophageal malignancy: a systematic review. Cancer Epidemiol Biomarkers Prev. 2015;24(1):32–38. doi: 10.1158/1055-9965.EPI-14-0980. [DOI] [PubMed] [Google Scholar]
- 39.Hardiman P, Pillay OC, Atiomo W. Polycystic ovary syndrome and endometrial carcinoma. Lancet. 2003;361(9371):1810–1812. doi: 10.1016/S0140-6736(03)13409-5. [DOI] [PubMed] [Google Scholar]
- 40.Haoula Z, Salman M, Atiomo W. Evaluating the association between endometrial cancer and polycystic ovary syndrome. Hum Reprod. 2012;27(5):1327–1331. doi: 10.1093/humrep/des042. [DOI] [PubMed] [Google Scholar]
- 41.Barry JA, Azizia MM, Hardiman PJ. Risk of endometrial, ovarian and breast cancer in women with polycystic ovary syndrome: a systematic review and meta-analysis. Hum Reprod Update. 2014;20(5):748–758. doi: 10.1093/humupd/dmu012. [DOI] [PMC free article] [PubMed] [Google Scholar]
- 42.Tonelli C, Chio IIC, Tuveson DA. Transcriptional regulation by Nrf2. Antioxid Redox Sign. 2018;29(17):1727–1745. doi: 10.1089/ars.2017.7342. [DOI] [PMC free article] [PubMed] [Google Scholar]
- 43.Bellezza I, Giambanco I, Minelli A, Donato R. Nrf2-Keap1 signaling in oxidative and reductive stress. Biochim Biophys Acta Mol Cell Res. 2018;1865(5):721–733. doi: 10.1016/j.bbamcr.2018.02.010. [DOI] [PubMed] [Google Scholar]
- 44.Akino N, Wada-Hiraike O, Terao H, Honjoh H, Isono W, Fu H, Hirano M, Miyamoto Y, Tanikawa M, Harada M, Hirata T, Hirota Y, Koga K, Oda K, Kawana K, Fujii T, Osuga Y. Activation of Nrf2 might reduce oxidative stress in human granulosa cells. Mol Cell Endocrinol. 2018;470:96–104. doi: 10.1016/j.mce.2017.10.002. [DOI] [PubMed] [Google Scholar]
Associated Data
This section collects any data citations, data availability statements, or supplementary materials included in this article.
Data Availability Statement
Data and material are available offline.