Abstract
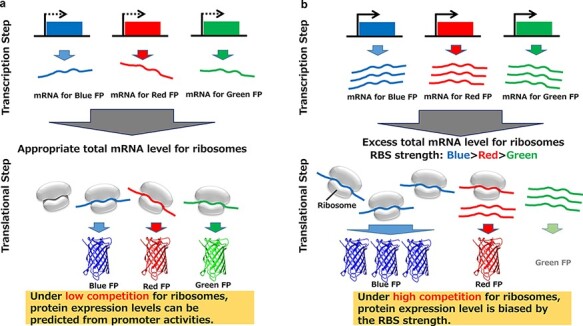
New materials with a low environmental load are expected to be generated through synthetic biology. To widely utilize this technology, it is important to create cells with designed biological functions and to control the expression of multiple enzymes. In this study, we constructed a cell-free evaluation system for multiple protein expression, in which synthesis is controlled by T7 promoter variants. The expression of a single protein using the T7 promoter variants showed the expected variety in expression levels, as previously reported. We then examined the expression levels of multiple proteins that are simultaneously produced in a single well to determine whether they can be predicted from the promoter activity values, which were defined from the isolated protein expression levels. When the sum of messenger ribonucleic acid (mRNA) species is small, the experimental protein expression levels can be predicted from the promoter activities (graphical abstract (a)) due to low competition for ribosomes. In other words, by using combinations of T7 promoter variants, we successfully developed a cell-free multiple protein synthesis system with tunable expression. In the presence of large amounts of mRNA, competition for ribosomes becomes an issue (graphical abstract (b)). Accordingly, the translation level of each protein cannot be directly predicted from the promoter activities and is biased by the strength of the ribosome binding site (RBS); a weaker RBS is more affected by competition. Our study provides information regarding the regulated expression of multiple enzymes in synthetic biology.
Keywords: cell-free protein synthesis, T7 promoter, T7 RNA polymerase, ribosome competition
Graphical Abstract
1. Introduction
In recent years, synthetic biology has attracted much attention, as new target substances can be efficiently produced through synthetic biology by utilizing more freely designed microorganisms (1). In this process, the desired small molecule is synthesized by a multistep reaction involving several enzymes, which are synthesized in the cell. The field of synthetic biology has been developed through recent breakthroughs in deoxyribonucleic acid (DNA) sequencing and synthesis technologies (2), as well as advances in information processing technologies, which have clarified the relationship between genomic information and biological functions (3). Substances synthesized by synthetic biology show a wide range of applications, and these substances include fuels, chemicals, pharmaceuticals and foodstuffs. In particular, biofuels (4) and artemisinins (5) are useful substances with practical applications.
To utilize synthetic biology-based manufacturing as an industrial infrastructure in the future, several important issues must be addressed, such as the cost and time needed to establish a cell strain. Establishing a cell strain involves repeated cycles that include designing the genome and evaluating the production efficiency of target substances (design-build-test-learn [DBTL] cycle); thus, the process is quite expensive and time-consuming (6). One of the technologies that addresses this issue is cell-free protein synthesis (7); in this process, proteins are synthesized by adding DNA to a solution that mimics the environment of a cell, such as cell extracts, rather than using the cell itself (8). Compared to expressing proteins in cells, cell-free protein synthesis is a simpler method; thus, this method is expected to become a ‘breadboard’ for the high-throughput screening of DNA during appropriate protein expression (9). Moreover, studies on low-cost cell-free production methods (10) and microcompartmentalized cell-free protein synthesis (11) have led to further utilization of cell-free breadboards.
To achieve multistep reactions by concerted catalysis in synthetic biology, multiple enzymes must be expressed in an optimal ratio. Therefore, a cell-free expression system that can easily optimize each protein expression level over a wide range is crucial for rapidly evaluating biological production methods. Although the expression of multiple proteins in arbitrary proportions can be achieved through microfluidic systems, which require sophisticated control technology (12), modulating promoter activity is a simple way to prepare the optimal messenger ribonucleic acid (mRNA) ratio of proteins without special devices, thus accelerating the DBTL cycle in synthetic biology.
One promising way to control protein expression is by modifying the T7 promoter sequence. The critical region in the promoter sequence for recognition by T7 RNA polymerase has been identified (13–16), and strong promoter binding generally facilitates protein expression (13). However, the information necessary for regulating the expression of multiple proteins simultaneously remains insufficient, even in vitro.
In this study, we utilized the T7-promoter-variant series to regulate the expression levels of multiple proteins in a single cell-free solution. We succeeded in the simultaneous expression adjustment of multiple proteins and then clarified the effective combinations of promoter variants. With this multiple protein expression system using the T7-promoter-variant series, efficient combinations of enzyme expression levels can be promptly optimized, thus facilitating faster DBTL cycles in synthetic biology.
2. Materials and methods
2.1. Plasmids
The plasmid supplied with the cell-free protein synthesis kit (RTS 100 Escherichia coli HY Kit; biotechrabbit GmbH) was used as the DNA plasmid expressing uv green fluorescent protein (uvGFP) with the wild-type (WT) T7 promoter. Plasmids in which uvGFP was replaced with other fluorescent proteins, including Tagged blue fluorescent protein (TagBFP), AmCyan1, Tagged green fluorescent protein (TagGFP2), ZsGreen1, mOrange2, HcRed1 and TurboFP635, were generated using a sequence replacement kit (In-Fusion HD Cloning Kit; Takara Bio). Plasmids with mutant T7 promoters were derived from those with the WT T7 promoter using a mutagenesis kit (QuikChange; Agilent). The plasmids were purified with a purification kit (Plasmid Midi Kit or Plasmid Mini Kit; Qiagen), and the sequences were confirmed by a sequencer (SeqStudio Genetic Analyzer; Thermo Fisher). The lengths and purities of the plasmids were confirmed by electrophoresis (TapeStation; Agilent).
2.2. SDS‒PAGE analysis
After cell-free protein expression, sodium dodecyl sulfate–polyacrylamide gel (SDS‒PAGE) analysis was performed using a protein solution purified by a HisTrap column (HisTrap HP; GE Healthcare, USA). The sample solution was diluted 2-fold with 2-mercaptoethanol-containing SDS sample buffer. The suspended solution was incubated for 2 min at 98°C, fractionated by 5–20% SDS‒PAGE (Atto Corporation, Japan) and stained with Bio-Safe (Bio-Rad, USA). Precision Plus Protein Standard (Bio-Rad) was used as the molecular weight marker.
2.3. Quantification of the interaction between T7 RNA polymerase and the T7 promoter
The binding strength between the T7 promoter sequence and T7 RNA polymerase was measured using a Biacore (×100; GE Healthcare) instrument for molecular interactions, and the dissociation constant KD (nM) and the association rate constant ka (M/s) were calculated. A linker sequence was added to both ends of the T7 promoter sequence, and one end was biotinylated and immobilized on a sensor chip SA (GE Healthcare) as double-stranded DNA (dsDNA).
To examine the interactions between T7 RNA polymerase (T7 RNA polymerase; Taiyo Nippon Sanso Corporation, Japan) and immobilized dsDNA, a streptavidin-surface sensor chip SA (GE Healthcare) was activated by successive injections of 1 M NaCl containing 50 mM NaOH and a biotinylated DNA oligonucleotide, e.g. WT/5ʹbiotin-35mer (biotin-5ʹ-TTTTG AAATT AATAC GACTC ACTAT AGGGA GACCA-3ʹ) hybridized with the complementary 35-mer strand (5ʹ-AAAAC TTTAA TTATG CTGAG TGATA TCCCT CTGGT-3ʹ). The immobilization was performed with an immobilization buffer, HBS-EP (0.01 M HEPES, pH 7.4, 0.15 M NaCl and 3 mM ethylenediaminetetraacetic acid), at a continuous flow rate of 5 ml/min. The biotinylated strands of the 13 mutants are as follows: (each complementary strand is excluded for clarity, and the mutated positions are underlined) A−10C: TTTTG AAATT AATAC GCCTC ACTAT AGGGA GACCA; A−10G: TTTTG AAATT AATAC GGCTC ACTAT AGGGA GACCA; A−10T: TTTTG AAATT AATAC GTCTC ACTAT AGGGA GACCA; A−10G/A−6G: TTTTG AAATT AATAC GGCTC GCTAT AGGGA GACCA; C−9T: TTTTG AAATT AATAC GATTC ACTAT AGGGA GACCA; C−9T/T−8C: TTTTG AAATT AATAC GATCC ACTAT AGGGA GACCA; C−9T/C−7T: TTTTG AAATT AATAC GATTT ACTAT AGGGA GACCA; T−8C: TTTTG AAATT AATAC GACCC ACTAT AGGGA GACCA; T−8C/C−7T: TTTTG AAATT AATAC GACCT ACTAT AGGGA GACCA; C−7T: TTTTG AAATT AATAC GACTT ACTAT AGGGA GACCA; A−6C: TTTTG AAATT AATAC GACTC CCTAT AGGGA GACCA; A−6G: TTTTG AAATT AATAC GACTC GCTAT AGGGA GACCA and A−6T: TTTTG AAATT AATAC GACTC TCTAT AGGGA GACCA.
The T7 RNA polymerase solution was passed over the chip, and the interactions were measured. All measurements were performed at a continuous flow rate of 30 μl/min at 25°C. HBS-P buffer containing 100 mM NaCl was used for running buffer. The T7 RNA polymerase was diluted with the running buffer to 1.25, 2.5, 5, 10 and 20 μg/ml. The injection time for all samples was 180 s, and the chip was monitored for 60 s postinjection before being washed. At the end of each cycle, the bound protein was removed by washing the chip with 2 M NaCl for 240 s.
2.4. Quantification of fluorescent proteins
The cell-free protein synthesis reaction was performed using a commercially available kit (Musaibou-Kun Quick, Catalog #A29-0058; Taiyo Nippon Sanso Corporation), which was based on the E. coli BL21-CodonPlus-RIL strain (BL21 CP; Stratagene) (17, 18). The experimental error of this kit was checked by measuring the amount of chloramphenicol acetyltransferase (CAT) protein synthesized by a dedicated colorimetric reaction using the DNA for CAT protein synthesis that was supplied with the kit. The variation in the amount of CAT protein synthesized in the same lot was approximately 10% Coefficient of Variation. For fluorescent protein synthesis, the reaction solution was prepared with Solution A included in the kit (final concentration: 54% v/v), Solution B included in the kit (final concentration: 32% v/v), sterile distilled water and plasmid DNA (8 ng/μl), and 20 µl aliquots were dispensed into 384-well plates (MicroPlate; Thermo Fisher, USA). When multiple plasmids were added to express multiple fluorescent proteins, the final concentration of each plasmid was 8 ng/μl. In an exceptional experiment to investigate the effect of plasmid concentration on protein synthesis, the plasmid concentration ranged from 0.4 to 8 ng/μl. The plate was placed in a plate reader (Infinite 200 Pro; Tecan, Switzerland) prewarmed to 37°C, and the change in fluorescence intensity was measured. To prevent evaporation, the plate remained sealed unless measurements were taken. The excitation and fluorescence wavelengths corresponding to each fluorescent protein were as follows: TagBFP (excitation: 380 nm; fluorescence: 460 nm), AmCyan1 (excitation: 415 nm; fluorescence: 485 nm), uvGFP (excitation: 485 nm; fluorescence: 535 nm), TagGFP2 (excitation: 448 nm; fluorescence: 510 nm), ZsGreen1 (excitation: 495 nm; fluorescence: 520 nm), mOrange2 (excitation: 550 nm; fluorescence: 580 nm), HcRed1 (excitation: 590 nm; fluorescence: 635 nm) and TurboFP635 (excitation wavelength: 590 nm; fluorescence wavelength: 635 nm). The fluorescence intensity was always compared with that of the WT as 100.
2.5. Quantification of CAT proteins
Cell-free translation using 14C-labeled leucine (328 mCi/mmol; Perkin Elmer) was performed as described in our previous work (19) except that the reaction reagent was from a Musaibou-Kun kit, as in the other Cell-free reactions in this paper. The template DNA was His-tagged CAT (19). By trichloroacetic acid precipitation (20), the Radio Isotope (RI)-labeled leucine incorporated into the CAT protein was separated from the remaining RI-labeled leucine with Whatman 3MM filter paper. The incorporated leucine was quantified by a liquid scintillation counter using an Insta-Gel Plus cocktail (Perkin Elmer).
2.6. Quantification of mRNA
To evaluate the transcriptional activities of each promoter, we performed in vitro transcription experiments as described in our previous work (21), with some modifications. The in vitro transcription was performed in 20 μl reaction solution containing 40 mM Tris-HCl (pH 8.0), 50 mM NaCl, 22 mM MgCl2, 1 mM Tris(2-carboxyethyl)phosphine, 5 mM DL-Dithiothreitol, 3 mM of each Nucleoside triphosphate, 0.5 units RNase inhibitor, 0.1 mg/ml T7 RNA polymerase and 5 ng/μl plasmid DNA template. After being incubated at 37°C for 2 h, the solution was incubated with 1 unit of RQ DNase I at 37°C for an additional 15 min. The transcribed RNA was then quantified by 0.8% agarose gel electrophoresis using an Amersham Typhoon scanner (Cytiva).
3. Results and discussion
3.1. T7 promoter variants
We collected a series of T7 promoter variants with one or two base substitutions in the sequence positions from −10 to −6 (Figure 1), which were expected to control the amount of downstream protein expression. In the structure of the T7-promoter-bound T7RNAP (22) (Supplementary Figure S1), the ‘specificity loop’ from the finger domain is inserted into the dsDNA major groove, which corresponds to the positions from −10 to −6 and achieves direct base recognition (13). There is no other direct RNAP recognition site with a specific sequence in the T7 promoter, and therefore, alterations in this region of the T7 promoter should considerably affect the efficiencies of protein expression. Using these variants, we examined the changes in protein expression levels by examining alterations in the T7 promoter sequence, and several kinds of fluorescent proteins that were encoded downstream were utilized.
Figure 1.
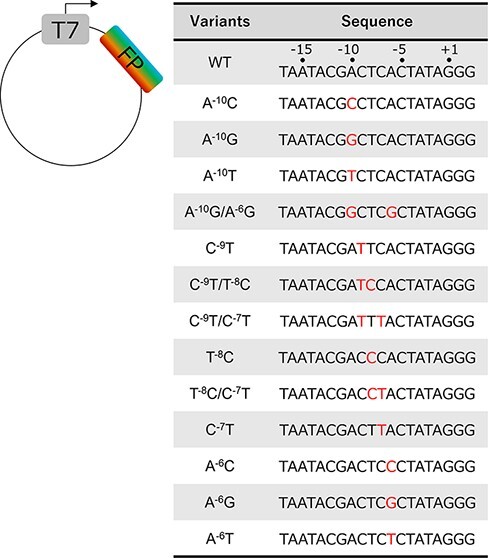
T7 promoter variants. Sequences of WT and mutant T7 promoter variants. DNA plasmids were utilized in the cell-free protein synthesis experiments. The quantities of the translated proteins were modulated by alterations in the T7 promoter. The positions from −10 to −6 in the promoter sequence were mutated .
3.2. The impact of interactions between T7 RNA polymerase and T7 promoter variants on promoter binding
To evaluate the differences in the binding strengths between the T7 promoter sequence and T7RNAP, the dissociation equilibrium constant KD (nM) and the association rate constant ka (M/s) were assessed through the procedure shown in Figure 2a and quantitated by surface plasmon resonance (SPR) analysis with a Biacore. Double-stranded DNA consisting of the T7 promoter sequence and flanking linker sequences was immobilized on the sensor chip via the attachment of biotin at the DNA terminus. The T7RNAP solutions were passed over the chip, and the interactions were measured. The impacts of the interactions between T7 RNA polymerase and T7 promoter variants are shown in Figure 2b. Dissociation equilibrium constant KD and association rate constant ka values were determined for the new variants and WT. The WT values were comparable with those in previous reports (15, 23). To achieve a variety of interaction strengths, we successfully created a promoter set in which the bases located from −10 to −6 were substituted since the C−7T−8C−9 bases are recognized by T7RNAP in a bidentate manner (Supplementary Figure S1); thus, this set could serve as a platform for controlling the expression levels of various proteins.
Figure 2.
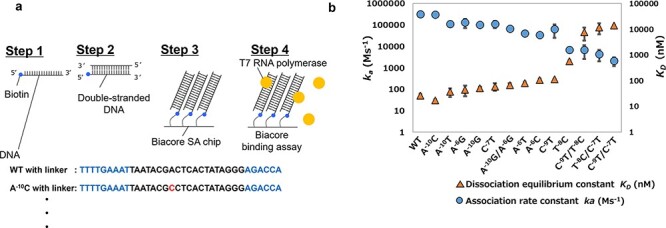
Interactions between T7 RNA polymerase and T7 promoter variants. (a) Measurements of the dissociation constants for T7 RNA polymerase and T7 promoter variants. The WT and variants of the T7 promoter sequence with additional linker nucleotides were biotinylated at the 5ʹ terminus of the sense strand DNA and immobilized on an SA chip as the ligand. The SPR experiments were performed by using a solution of T7 RNA polymerase as the analyte. (b) The impacts of the interactions between T7 RNA polymerase and T7 promoter variants. The dissociation equilibrium constant (KD) and the association rate constant (ka) for each promoter variant are shown. The averages are based on three independent replicates, and the error bars show standard deviations (SDs), which were calculated with the STDEVP function in Microsoft Excel.
3.3. Variations in promoter activity and fluorescent protein expression
By increasing the variety of T7 promoters, we constructed multiple plasmids with high to low levels of downstream protein expression. The series of plasmids containing a T7 promoter variant with a downstream fluorescent protein sequence was tested in the E. coli-based cell-free protein synthesis system (17, 18), and the quantities of the expressed proteins were measured by their fluorescence intensities. The changes in the fluorescence intensity of uvGFP during the protein synthesis reaction are shown in Figure 3a. The expression of uvGFP was also confirmed by performing electrophoreses with the samples before and after the reaction (Supplementary Figure S2). The fluorescence intensity increased along with the protein synthesis reaction and plateaued at approximately 300 min regardless of the plasmid concentration. This reaction is terminated by the depletion and inactivation of the protein synthesis substrates in the cell-free solution. A higher concentration of the plasmid resulted in increased protein expression, but at plasmid levels above 4 ng/μl, no further increase was observed (Figure 3b). Note that the DNA concentration in the expression system is much lower than either the KD observed in our experiment or the Km in the literature (15).
Figure 3.
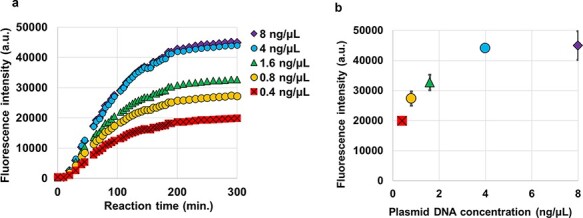
Fluorescent protein expression in a single color. (a) Time course and resultant quantities of uvGFP expression from different plasmid concentrations in cell-free protein synthesis solutions. Time courses of the expression (uvGFP fluorescent intensity) from each DNA concentration of 8 ng/μl (purple), 4 ng/μl (blue), 1.6 ng/μl (green), 0.8 ng/μl (orange) and 0.4 ng/μl (red) are represented in scatter plots. (b) All plots reached plateaus at approximately 300 min in (a). The resultant fluorescence intensities of each concentration with error bars show that the quantities of the expressed protein were highly correlated with the plasmid DNA concentration in the solution. Averages are based on four independent replicates, and the error bars show standard deviations (SDs), which were calculated with the STDEVP function in Microsoft Excel.
Under conditions with much lower plasmid concentrations (∼1.6 ng/μl), it was difficult to control the protein expression through the amount of plasmid because small errors in the plasmid volume, which were induced by the injection operation and/or absorption of the plasmid to pipette tips, seriously affected the protein expression (24). Therefore, we tried to control the protein expression by utilizing the differences in the promoter activity in each plasmid rather than the plasmid concentration.
For all fluorescent proteins, the expression levels of each protein changed depending on the type of T7 promoter variant. The time course of the fluorescence intensity for each protein is shown in Supplementary Figure S3. The selected fluorescent proteins cover a wide range of fluorescence wavelengths (maximum emission wavelength λf = 457–635 nm). The fluorescence intensity continuously increased, as observed for uvGFP, confirming the consecutive formation of fluorescent proteins. Even without a plasmid in the cell-free solution, the protein synthetic activity decreased with time because the enzymes in the solution degraded proteins and RNA and consumed adenosine triphosphate. The activity was almost zero after 100 min (Supplementary Figure S4).
Table 1 shows the differences in the expression levels of the promoter variants for each fluorescent protein. The expression level for each variant was defined as the ‘promoter activity unit’, which varied from almost 0 to 128 relative to the value for WT, which was set to 100. The effects of different promoters on the protein expression levels were similar for all the fluorescent proteins we measured. For the plasmid series encoding fluorescent proteins, the differences were only in the T7 promoter sequences, and all plasmids shared the same coding sequence that transcribed the same mRNA sequence. Thus, the differences in the signals from a fluorescent protein should be due to mRNA production, which is dependent on the promoter sequence. When multiple proteins were expressed simultaneously in the same well, if each protein was produced without interference from the production of other proteins, then the expression level of each protein was the same as in Table 1. We also evaluated the synthesis of CAT, a nonfluorescent protein, using our T7 promoter variants to verify the differences in their expression levels. As a result, the expression ratio of the CAT protein with each promoter variant exhibited similar trends as observed for the aforementioned fluorescent proteins, demonstrating that this series of T7 promoter variants is widely applicable for controlling the levels of protein expression.
Table 1.
Differences in the expression levels of fluorescent proteins for all T7 promoter variants. The relative expression quantities of eight fluorescent proteins after a 300-min reaction were determined in combination with 14 T7 promoter variants (Supplementary Figure S3), in which the values for each protein in combination with the WT T7 promoter were set to 100. For instance, in the case of TagBFP, the fluorescence intensities after 300 min in Supplementary Figure S3 are 7413 a.u. in WT and 7310 a.u. in A−10C. Therefore, the value of A−10C in Table 1 was calculated as 99 versus WT 100. All expression levels are averages based on three independent replicates. By choosing the appropriate promoter from the series of variants, the expression level of a single protein can be controlled. In addition, by using several T7 promoter variants, we confirmed that the CAT protein, a nonfluorescent protein, shows an expression trend similar to those of the fluorescent proteins
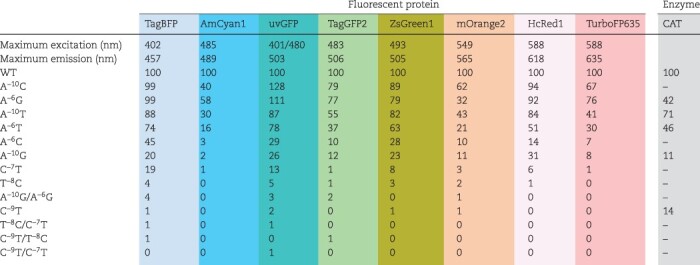
A comparison between the expression strengths and binding properties of the promoters revealed positive correlations between the binding property of a T7 promoter variant and its promoter activity or the average protein expression levels among fluorescent proteins with the promoter variants (Supplementary Figure S5). T7 promoter variants with higher activity generally exhibited larger association rate constants and smaller dissociation constants with T7RNAP, indicating that promoter activity and T7RNAP binding affinity are correlated (Supplementary Figure S5a). T7 promoter variants with dissociation constants below 50 nM, which bind strongly to T7RNAP, all showed relatively strong fluorescent protein expression intensities of 64 or higher (Supplementary Figure S5b). For other T7 promoter variants with moderate activities, the promoter activity units and dissociation constants did not correspond well in some circumstances; this was because the binding of T7 RNA polymerase to the short linear DNA in the model used in our SPR analysis was not completely reproduced in the transcription initiation from the plasmid DNA in the cell-free solution. In addition, the amount of mRNA produced by in vitro transcription was correlated with the amount of fluorescent protein expression (Supplementary Figure S6). These results indicate that the various transcription efficiencies of the T7 promoter variants have a significant impact on the final levels of protein expression.
Because the binding strength between the promoter and RNA polymerase is correlated with the strength of protein expression, it is possible to estimate the effects of nucleotide substitutions on the strength of protein expression based on the nucleotide sequence that serves as the binding site for the polymerase. Indeed, mutations at various locations from positions −18 to −1 in the T7 promoter reportedly altered the promoter activity and affected the protein expression, with a large dynamic range (25). Although mutations were selected at a limited number of bases (from positions −10 to −6), we prepared a promoter library with a similar large dynamic range. Further developments, such as changing the binding strengths of other regulatory proteins that bind sequences partially overlapping with the T7 promoter, may be achieved by substituting bases at nucleotide positions that were not mutated in this report.
3.4. Evaluation of promoter variants in the simultaneous synthesis of multiple proteins
We expressed three fluorescent proteins simultaneously using T7 promoters with various activities; then, we compared each fluorescence intensity with that of a fluorescent protein independently expressed from the WT promoter. We used TagBFP, TagGFP2 and TurboFP635, which exhibit short maturation half-times of 13, 11 and 24 min, respectively (26, 27). We verified the consistency between the expression levels of each fluorescent protein in the simultaneous synthesis of multiple proteins and the levels predicted from the independent expression of each protein (Supplementary Table S1). The ‘predicted’ fluorescent intensities were calculated on the basis of the promoter activities listed in Table 1. In the prediction, we also hypothesized that the total amount of proteins from DNA templates included in one test tube is the same as that in isolated test tubes. Similarly, the sum of the promoter activities of templates in one tube is assumed to be equal to that in independent tubes. For example, when TagBFP, TagGFP2 and TurboFP635 were all expressed with the WT promoter, the sum of the included promoter activities was 300 since we set the WT activity of each protein to 100. In this experiment, the sums of the promoter activities ranged from 20 to 300.
The sum of the promoter activities of DNA templates in a test tube determines the predictability of the protein expression. When the sum was low (under 160), the prediction matched well to the measured value for all fluorescent proteins (Figure 4a). In contrast, when the sum of the promoter activities was high (over 160), among the three proteins, only TagBFP matched the expression level predicted from the T7 variant monochromatic results, and the other two were lower than the predictions (Figure 4b). Since no difference in the lengths of the mRNAs was observed and the codons were optimized for the three proteins, the variations in predictability were likely due to the efficiency of initiating translation per mRNA on the proteins. To evaluate the effect of the ribosome binding efficiency of each variant, we used the online tool Ribosome Binding Site (RBS) Calculator v2.1 (https://salislab.net/software/predict_rbs_calculator), which can predict translation initiation rates that affect protein expression levels (28). The initiation rate of TagBFP (33 934 a.u.) translation was much larger than those of TagGFP2 (4111 a.u.) and TurboFP635 (9668 a.u.) (Supplementary Table S2).
Figure 4.
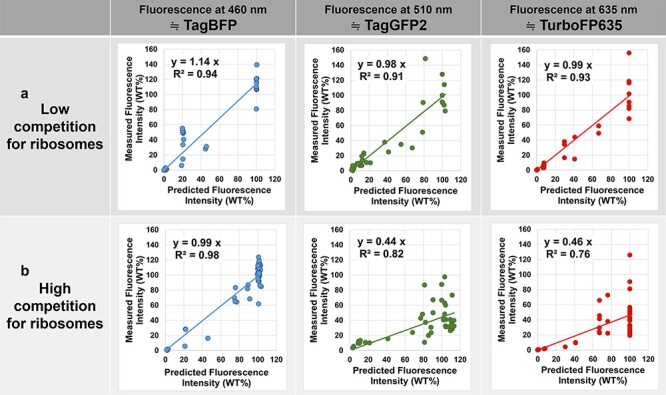
Expression of multiple fluorescent proteins. The scatter plots of measured fluorescence intensities against predicted fluorescence intensities in the combinatorial expression of three fluorescent proteins (TagBFP, TagGFP2 and TurboFP635) at three wavelengths (460, 510 and 635 nm). The final concentration of plasmid DNA was 8 ng/μl for each fluorescent protein. This figure is a graphical representation of the results of Supplementary Table S1, and regression lines through the origin were drawn to verify the relationship between the predicted fluorescence intensity and measured fluorescence intensity. The closer the slope of the regression line is to 1, the greater the match between the measured fluorescence intensity and the predicted fluorescence intensity. (a) When the competition for ribosomes was low, the measured fluorescence intensity matched the predicted fluorescence intensity for all three fluorescent proteins. (b) When the competition for ribosomes was high, only the gene with the strongest translation efficiency (TagBFP) matched the prediction from the activity of the T7 variant.
With high total mRNA concentrations, the unpredictability of multiple protein expression was likely derived from competition for ribosomes by the mRNA species, which exhibited different concentrations and translation initiation efficiencies. The T7 promoter sequence defined the RNA concentration, and the RNA sequences and structures around the start codons defined the translation initiation efficiency. In the competition for ribosomes, an mRNA with a weaker RBS hardly bound to ribosomes because another mRNA species with a stronger RBS was saturated with ribosomes; thus, a lower protein expression value than the predicted value was obtained. When two genes are expressed during the competition for protein synthesis resources in a cell-free system (29), the weaker the RBS (relative to the competitor), the greater the reduction in expression due to competition, which also supports that expression is unpredictable for proteins with low rates of translation initiation, as observed in this work.
By utilizing this simultaneous multiple protein expression systems, we can control the expression ratios of the enzymes in the cell-free system and improve the efficiency of multistep reactions in a single plate well. In addition to modulating promoters by mutation, orthogonal promoter sequence/RNA polymerase sets (variants of promoter/RNA polymerase interactions) were developed, which can be used to precisely control multigene pathways in E. coli cells (30, 31). It is important to consider ribosome competition in these cases and in future attempts to control the ratio of multiple proteins. We will further demonstrate the effectiveness of cell-free systems as a breadboard by adjusting ribosome competition and determining whether the conditions are also applicable in vivo.
Supplementary Material
Acknowledgments
The authors are grateful to Dr. Kenichi Takeda and Tomoyuki Sakai at Hitachi, Ltd., for suggesting the topic addressed in this paper. The authors also thank Ayami Hideshima and Ruolan Zhang at Hitachi, Ltd., for their expert technical assistance with the experiments.
Contributor Information
Naoko Senda, Research & Development Group, Hitachi, Ltd., Kokubunji, Tokyo, Japan.
Toshihiko Enomoto, Department of Electrical Engineering and Bioscience, Waseda University, Shinjuku, Tokyo, Japan.
Kenta Kihara, Department of Electrical Engineering and Bioscience, Waseda University, Shinjuku, Tokyo, Japan.
Naoki Yamashiro, Department of Electrical Engineering and Bioscience, Waseda University, Shinjuku, Tokyo, Japan.
Naosato Takagi, Department of Electrical Engineering and Bioscience, Waseda University, Shinjuku, Tokyo, Japan.
Daisuke Kiga, Department of Electrical Engineering and Bioscience, Waseda University, Shinjuku, Tokyo, Japan.
Hirokazu Nishida, Research & Development Group, Hitachi, Ltd., Kokubunji, Tokyo, Japan.
Supplementary data
Supplementary data are available at SYNBIO online.
Data availability
The data presented in this study are available at SYNBIO online. The following supplementary experimental data and plasmid sequence data are provided in the Supplementary data.
Figure S1. Locations of mutations based on the reported co-crystal structure of T7 RNA polymerase and the T7 promoter (PDB 1CEZ).
Figure S2. SDS‒PAGE analysis of the reaction.
Figure S3. Single-color fluorescent protein expression.
Figure S4. Deactivation of the cell-free solution through 37°C incubation.
Figure S5. Correlation between the binding property and promoter activity of T7 promoter variants.
Figure S6. Correlation between the levels of transcription and translation.
Table S1. Expression of the three fluorescent proteins in various combinations.
Table S2. Translation initiation rate.
The materials and resources described in the article can be obtained from the authors under a Materials Transfer Agreement.
Funding
D.K. received grants for this study from JSPS KAKENHI (Grant number 19H00985) and JST CREST (Grant number JPMJCR21N4), Japan.
Conflict of interest statement.
None declared.
References
- 1. Khalil A.S. and Collins J.J. (2010) Synthetic biology: applications come of age. Nat. Rev. Genet., 11, 367–379. [DOI] [PMC free article] [PubMed] [Google Scholar]
- 2. Ma S., Tang N. and Tian J. (2012) DNA synthesis, assembly and applications in synthetic biology. Curr. Opin. Chem. Biol., 16, 260–267. [DOI] [PMC free article] [PubMed] [Google Scholar]
- 3. Fong S.S. (2014) Computational approaches to metabolic engineering utilizing systems biology and synthetic biology. Comput. Struct. Biotechnol. J., 11, 28–34. [DOI] [PMC free article] [PubMed] [Google Scholar]
- 4. Peralta-Yahya P.P., Zhang F., Cardayre S.B. and Keasling J.D. (2012) Microbial engineering for the production of advanced biofuels. Nature, 488, 320–328. [DOI] [PubMed] [Google Scholar]
- 5. Ro D.K., Paradise E.M., Ouellet M., Fisher K.J., Newman K.L., Ndungu J.M., Ho K.A., Eachus R.A., Ham T.S., Kirby J.. et al. (2006) Production of the antimalarial drug precursor artemisinic acid in engineered yeast. Nature, 440, 940–943. [DOI] [PubMed] [Google Scholar]
- 6. Henkel J. and Maurer S.M. (2007) The economics of synthetic biology. Mol. Syst. Biol., 3, 1–4. [DOI] [PMC free article] [PubMed] [Google Scholar]
- 7. Karoui M.E., Hoyos-Flight M. and Fletcher L. (2019) Future trends in synthetic biology—a report. Front. Bioeng. Biotechnol., 7, 1–8. [DOI] [PMC free article] [PubMed] [Google Scholar]
- 8. Hodgman C.E. and Jewett M.C. (2012) Cell-free synthetic biology: thinking outside the cell. Metab. Eng., 14, 261–269. [DOI] [PMC free article] [PubMed] [Google Scholar]
- 9. Siegal-Gaskins D., Tuza Z.A., Kim J., Noireaux V. and Murray R.M. (2014) Gene circuit performance characterization and resource usage in a cell-free “breadboard”. ACS Synth. Biol., 3, 416–425. [DOI] [PubMed] [Google Scholar]
- 10. Lavickova B. and Maerkl S.J. (2019) A simple, robust, and low-cost method to produce the PURE cell-free system. ACS Synth. Biol., 8, 455–462. [DOI] [PubMed] [Google Scholar]
- 11. Benítez-Mateos A.I., Zeballos N., Comino N., Moreno de Redrojo L., Randelovic T. and López-Gallego F. (2020) Microcompartmentalized cell-free protein synthesis in hydrogel μ-channels. ACS Synth. Biol., 9, 2971–2978. [DOI] [PubMed] [Google Scholar]
- 12. Fan J., Villarreal F., Weyers B., Ding Y., Tseng K.H., Li J., Li B., Tan C. and Pan T. (2017) Multi-dimensional studies of synthetic genetic promoters enabled by microfluidic impact printing. Lab. Chip., 17, 2198–2207. [DOI] [PMC free article] [PubMed] [Google Scholar]
- 13. Ikeda R.A., Warshamana G.S. and Chang L.L. (1992) In vivo and in vitro activities of point mutants of the bacteriophage T7 RNA polymerase promoter. Biochemistry, 31, 9073–9080. [DOI] [PubMed] [Google Scholar]
- 14. Komura R., Aoki W., Satomura A. and Ueda M. (2018) High-throughput evaluation of T7 promoter variants using biased randomization and DNA barcoding. PLoS One, 13, e0196905. [DOI] [PMC free article] [PubMed] [Google Scholar]
- 15. Martin C.T. and Coleman J.E. (1987) Kinetic analysis of T7 RNA polymerase-promoter interactions with small synthetic promoters. Biochemistry, 26, 2690–2696. [DOI] [PubMed] [Google Scholar]
- 16. Conrad T., Plumbom I., Alcobendas M., Vidal R. and Saure S. (2020) Maximizing transcription of nucleic acids with efficient T7 promoters. Commun. Biol., 3, 1–8. [DOI] [PMC free article] [PubMed] [Google Scholar]
- 17. Kigawa T., Yabuki T., Matsuda N., Matsuda T., Nakajima R., Tanaka A. and Yokoyama S. (2004) Preparation of Escherichia coli cell extract for highly productive cell-free protein expression. J. Struct. Funct. Genomics, 5, 63–68. [DOI] [PubMed] [Google Scholar]
- 18. Kigawa T., Matsuda T., Yabuki T., Yokoyama S. (2007) Bacterial cell-free system for highly efficient protein synthesis, in cell-free protein synthesis: methods and protocols. In: Spirin AS, Swartz JR (eds). Wiley-VCH, Weinheim, pp. 83–97. [Google Scholar]
- 19. Kawahara-Kobayashi A., Masuda A., Araiso Y., Sakai Y., Kohda A., Uchiyama M., Asami S., Matsuda T., Ishitani R., Dohmae N.. et al. (2012) Simplification of the genetic code: restricted diversity of genetically encoded amino acids. Nucleic Acids Res., 40, 10576–10584. [DOI] [PMC free article] [PubMed] [Google Scholar]
- 20. Kiga D., Sakamoto K., Sato S., Hirao I. and Yokoyama S. (2001) Shifted positioning of the anticodon nucleotide residues of amber suppressor tRNA species by Escherichia coli arginyl-tRNA synthetase. Eur. J. Biochem., 268, 6207–6213. [DOI] [PubMed] [Google Scholar]
- 21. Ayukawa S., Sakai Y. and Kiga D. (2012) An aptazyme-based molecular device that converts a small-molecule input into an RNA output. Chem. Commun., 48, 7556–7558. [DOI] [PubMed] [Google Scholar]
- 22. Cheetham G.M.T., Jeruzalmi T.A. and Steitz T.A. (1999) Structural basis for initiation of transcription from an RNA polymerase-promoter complex. Nature, 399, 80–83. [DOI] [PubMed] [Google Scholar]
- 23. Ujvari A. and Martin C.T. (1996) Thermodynamic and kinetic measurements of promoter binding by T7 RNA Polymerase. Biochemistry, 35, 14574–14582. [DOI] [PubMed] [Google Scholar]
- 24. Shin J. and Noireaux V. (2010) Efficient cell-free expression with the endogenous E. Coli RNA polymerase and sigma factor 70. J. Biol. Eng., 4, 1–9. [DOI] [PMC free article] [PubMed] [Google Scholar]
- 25. Chizzolini F., Forlin M., Cecchi D. and Mansy S.S. (2014) Gene position more strongly influences cell-free protein expression from operons than T7 transcriptional promoter strength. ACS Synth. Biol., 3, 363–371. [DOI] [PubMed] [Google Scholar]
- 26. Subach O.M., Gundorov I.S., Yoshimura M., Subach F.V., Zhang J., Grüenwald D., Souslova E.A., Chudakov D.M. and Verkhusha V.V. (2008) Conversion of red fluorescent protein into a bright blue probe. Chem. Biol., 15, 1116–1124. [DOI] [PMC free article] [PubMed] [Google Scholar]
- 27. Shcherbo D., Merzlyak E.M., Chepurnykh T.V., Fradkov A.F., Ermakova G.V., Solovieva E.A., Lukyanov K.A., Bogdanova E.A., Zaraisky A.G., Lukyanov S.. et al. (2007) Bright far-red fluorescent protein for whole-body imaging. Nat. Methods, 4, 741–746. [DOI] [PubMed] [Google Scholar]
- 28. Salis H.M., Mirsky E.A. and Voigt C.A. (2009) Automated design of synthetic ribosome binding sites to control protein expression. Nat. Biotechnol., 27, 946–950. [DOI] [PMC free article] [PubMed] [Google Scholar]
- 29. Borokowski O., Bricio C., Murgiano M. and Rothschild-Mancinelli B. (2018) Cell-free prediction of protein expression costs for growing cells. Nat. Commun., 9, 1–11. [DOI] [PMC free article] [PubMed] [Google Scholar]
- 30. Temme K., Hill R., Segall-Shapiro T.H., Moser F. and Voigt C.A. (2012) Modular control of multiple pathways using engineered orthogonal T7 polymerases. Nucleic Acids Res., 40, 8773–8781. [DOI] [PMC free article] [PubMed] [Google Scholar]
- 31. Meyer A.J., Ellefson J.W. and Ellington A.D. (2015) Directed evolution of a panel of orthogonal T7 RNA polymerase variants for in vivo or in vitro synthetic circuitry. ACS Synth. Biol., 4, 1070–1076. [DOI] [PubMed] [Google Scholar]
Associated Data
This section collects any data citations, data availability statements, or supplementary materials included in this article.
Supplementary Materials
Data Availability Statement
The data presented in this study are available at SYNBIO online. The following supplementary experimental data and plasmid sequence data are provided in the Supplementary data.
Figure S1. Locations of mutations based on the reported co-crystal structure of T7 RNA polymerase and the T7 promoter (PDB 1CEZ).
Figure S2. SDS‒PAGE analysis of the reaction.
Figure S3. Single-color fluorescent protein expression.
Figure S4. Deactivation of the cell-free solution through 37°C incubation.
Figure S5. Correlation between the binding property and promoter activity of T7 promoter variants.
Figure S6. Correlation between the levels of transcription and translation.
Table S1. Expression of the three fluorescent proteins in various combinations.
Table S2. Translation initiation rate.
The materials and resources described in the article can be obtained from the authors under a Materials Transfer Agreement.


