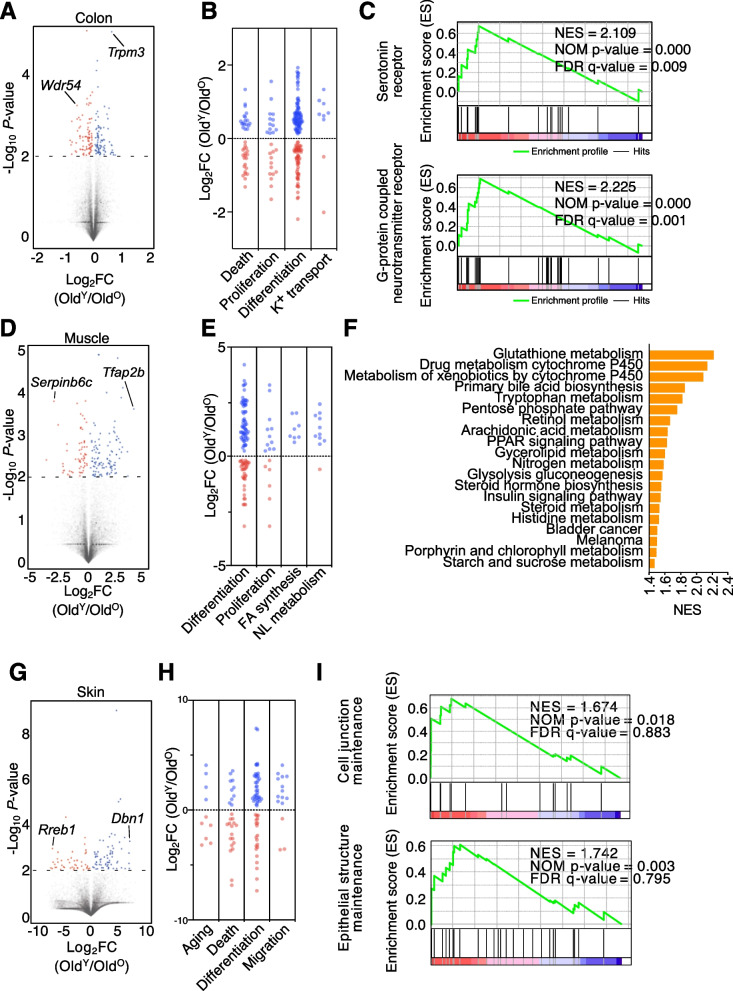
Fig. 3.
Genes in old mice are upregulated by FMT from young mice. A Volcano plot of fold changes (FCs) and P values for OldY versus OldO in the colon (n = 3). Gene (P ≤ 0.001) names with the highest fold change in OldO or OldY are shown. B FC levels of death-related (39), proliferation-related (26), differentiation-related (142), and potassium transport-related (9) marker genes in colon. C Gene set enrichment analysis (GSEA) for OldY vs. OldO in the colon. GSEA reveals positive enrichment of serotonin receptor activity and G-protein-coupled neurotransmitter receptor activity gene sets in the OldY colon. D Volcano plot of FCs and P values for OldY vs. OldO in the muscle (n = 3). E FC levels of differentiation-related (100), proliferation-related (17), fatty acid synthesis-related (8), and neutral lipid metabolism-related (11) marker genes in the muscle. F Top 20 KEGG pathways overrepresented in the muscle of OldY (n = 3) based on the NES score. G Volcano plot of FCs and P value for OldY (n = 2) vs. OldO (n = 3) in skin. H FC levels of aging-related (10), death-related (27), differentiation-related (58), and migration-related (15) marker genes in skin. I GSEA for OldY vs. OldO in skin. GSEA reveals enrichment of “cell junction maintenance” and “epithelial structure maintenance” in the OldY skin. P value cutoff for DEGs is 0.01

