

Abstract
Quantitative determination of the effects of surfactant chemistry and polymer chain length on the concentration conditions necessary to yield extraction of specific single-wall carbon nanotube (SWNCT) species in an aqueous two-polymer phase extraction (ATPE) separation are reported. In particular, the effects of polyethylene glycol (PEG) chain length, surfactant ratios, and systematic structural variations of alkyl surfactants and bile salts on the surfactant ratios necessary for extraction were investigated using a recently reported fluorescence-based method. Alkyl surfactant tail length was observed to strongly affect the amount of surfactant necessary to cause PEG-phase extraction of nanotube species in ATPE, while variation in the anionic sulfate/sulfonate head group chemistry has less impact on the concentration necessary for extraction. Substitution of different bile salts results in different surfactant packings on the SWCNTs, with substitution greatly affecting the alkyl surfactant concentrations required for (n,m) extraction. Finally, distinct alkyl-to-bile surfactant ratios were found to extract specific (n,m) SWCNTs across the whole effective window of absolute concentrations, supporting the hypothesized competitive adsorption mechanism model of SWCNT sorting. Altogether, these results provide valuable insights into the underlying mechanisms behind ATPE-based SWCNT separations, towards further development and optimization of the ATPE method for SWCNT chirality and handedness sorting.
Keywords: Single-wall carbon nanotube, SWCNT, aqueous two-phase extraction, separation
1. Introduction
Aqueous two-polymer phase extraction (ATPE) [1, 2] is a leading method for the separation of individual single-wall carbon nanotube (SWCNT) (n,m) species from the polydisperse mixture of species present in commercial sources [3–5]. Initially developed for the separation of biomolecules, ATPE exploits differential chemical affinities of solutes for two spontaneously self-separating polymer phases to produce spatial separation of those solutes at a macroscopic length scale. For SWCNTs, and focusing on ATPE utilizing surfactant concentrations to control the affinity of each (n,m) for the two polymer phases rather than specific DNA sequences, the method is scalable, requires only low-cost chemicals, and is highly tunable for selective purification [3]. Surfactant-controlled ATPE on SWCNT populations has been shown to enable isolation of individual SWCNT (n,m) species in both the small diameter (< 1 nm) [6–8] and large diameter (> 1 nm) [9, 10] regimes, is applicable to both metallic and semiconducting species, and can resolve populations to the ultimate level of single (n,m) enantiomers in both ranges [10].
Similar to other SWCNT separation methods utilizing surfactants such as density gradient ultracentrifugation (DGU) [11, 12] and gel chromatography [13–17] the phase space of possible variations to optimize ATPE separations is large. Optimization for each of these techniques has been tedious due to the need to perform and characterize actual separations to determine the outcomes. This is particularly limiting because actual separations take significant time, often have detection issues for low abundance species, and inherently introduce confounding effects such as mass transport limitations or interfacial deposition. Despite this, significant investigation of the capabilities of ATPE for SWCNT resolution in particular have been established based on the conduct of many, distinct, separation experiments [3, 18]. These include investigations on the use of co-surfactants [19], surfactant choice and modulator addition (e.g., salts [20], acids [21], bases [22]) that enable rapid selection of many SWCNT (n,m)s.
Recently, we reported a method to evaluate the SWCNT (n,m) species specific experimental conditions, such as surfactant and co-surfactant concentrations, necessary to shift that species from partition to the bottom phase to partition into the top-phase of an ATPE separation without conducting a separation [23]. The experimental conditions for these transitions were called partition coefficient change conditions (PCCCs), and importantly were shown to be determinable by measuring the dependence of the near-infrared (NIR) fluorescence for each (n,m) with the solution environment. Advantageously, these fluorescence measurements take only a few seconds, are amenable to strict environmental control (i.e., temperature), and require minimal (< 1 μg/mL) SWCNT concentrations for strong (n,m)-specific signal collection. In terms of the measurand, changes in the emission intensity of specific (n,m) SWCNTs were shown to be governed by the nature of the surfactant primarily adsorbed on the nanotube’s surface. For the pair of surfactants most often competed in ATPE separations, sodium dodecyl sulfate (SDS) and sodium deoxycholate (DOC) [24], the change in the fluorescence identified dominant adsorbate directly corresponds to the polymer phase to which that nanotube (n,m) partitions in ATPE [23]. A DOC dominated interfacial layer led to partition into the dextran (DEX)-rich phase of a polyethylene glycol (PEG)-DEX ATPE separation, and an SDS dominated interface to partition into the PEG-rich phase. This new measurement methodology enabled quantification of effects that were previously purely observational for the ATPE system, including the effects of experimental parameters such as the temperature and PEG concentration to the PCCCs of several (n,m) SWCNT species.
In this contribution the effects of variations in the molecular mass of PEG and the chemistry of the primary (bile salt) and secondary (alkyl chain) surfactants on the PCCCs of several commonly isolated (n,m) SWCNT species are reported. The results show that the PCCCs of each (n,m) are strongly dependent on the chemistry of the chosen surfactants, support the interpretation that the mechanism determining partition in surfactant ATPE is competition of surfactants for adsorption to the SWCNT interface, and provide insight into chemical selection for the optimization of separations.
2. Materials and Methods
Certain commercial equipment, instruments or materials are identified in this paper in order to adequately specify experimental details. Such identification does not imply recommendation or endorsement by the National Institute of Standards and Technology (NIST), nor does it imply that the materials or equipment are necessarily the best available for the purpose.
Preparation details for the SWCNT populations utilized in this work were previously reported. In brief, both the samples were purified by liquid-phase processing of dispersed SWCNT populations generated from cobalt-molybdenum-catalyst (CoMoCat) synthesis method SWCNT soot (Southwest Nanotechnologies now Chasm Nanotechnologies, Norman, OK, USA). The (7,6)/(7,5) sample was isolated from SG76 lot 24 by a multistep purification series including rate-zonal centrifugation and ATPE separation [25]. The (6,5)-rich sample (also containing (8,3)) was purified from SG65 soot by a multistep process including a rate-zonal centrifugation length separation step [26] and a density gradient ultracentrifugation (DGU) separation [11]. Polyethylene glycol (PEG) of various molecular weights were acquired from Alfa Aesar (1.5 kDa, 6 kDa, 20 kDa) and Sigma (3 kDa). Sodium dodecyl sulfate (SDS, C-12, BioXtra, ≥ 99 %) and sodium tetradecyl sulfate (STS, C-14, 95 %) were acquired from Sigma. Sodium n-undecyl sulfate (SUS, C-11, 99 %) was obtained from Santa Cruz Biotechnology. Sodium n-tridecyl sulfate (StS, C-13, 99 %), sodium n-decyl sulfate (SdS, C-10, 99 %), sodium n-nonyl sulfate (SNS, C-9, 99 %), and sodium n-octyl sulfate (SOS, C-8, 99 %) were purchased from Alfa Aesar. Sodium dodecylbenzenesulfonate (SDBS, technical grade) was obtained from Sigma and Sodium 1-undecanesulfonate (SUSO3, ≥ 98 %) was purchased from Alfa Aesar. Di-hydroxy bile salts sodium deoxycholate (DOC, BioXtra ≥ 98 %), sodium taurodeoxycholate (TDOC, BioXtra, ≥ 97 %), sodium glycodeoxycholate (GDOC, SigmaUltra, ≥ 97 %), and sodium chenodeoxycholate (CDOC, ≥ 97 %), and the tri-hydroxy sodium cholate (SC, BioUltra, ≥ 99 %) were purchased from Sigma-Aldrich. All PEG polymer and surfactant powders were used as received.
Stock SWCNT dispersions were stored in 10.0 g/L DOC in water (1.0 % mass/volume) and diluted with appropriate additions of the polymer and co-surfactant solutions to reach the specified surfactant concentrations of each measurement; each fluorescence data point comes from a single direct sample preparation from the parent dispersion. Stirred ultrafiltration cells (Millipore) were used several times to (re)concentrate and exchange the previous diluted and measured SWCNT samples to equivalent (by absorbance and fluorescence measurements) parent dispersions; this process removes the added PEG and co-surfactants, and (re)sets the DOC concentration to 10.0 g/L. Centrifugal ultrafiltration units (Microcon, 30 kDa molecular weight cutoff filters, Millipore) were used to exchange DOC for the other bile salts (SC, CDOC, GDOC, TDOC) as the primary dispersant of a parent dispersion at a smaller volume scale by sequential concentration and back dilution. The final concentration of exchanged bile salt in the SWCNT dispersion was 10.0 g/L (1.0 %) with DOC ≪ 0.1 g/L (0.01 %). These bile salt variant SWCNT dispersions were then likewise appropriately diluted with additions of the polymer and co-surfactant solutions (further diluting any remaining DOC) to reach the specified surfactant concentrations of each measurement.
Absorbance spectra were measured on a Cary 5000 UV-visible-near infrared (UV-vis-NIR) absorbance spectrophotometer through 1 mm path length cuvettes at room temperature. Samples and reference solutions were measured in separate runs and the reference spectra subtracted during data analysis. Measurements were conducted for the range of 200 nm to 1400 nm with a 1 nm step, a 2 nm bandpass, and an integration time of 0.1 s/step.
Near-infrared (NIR) fluorescence of the samples was measured in an NS3 Nanospectralyzer (Applied NanoFluorescence, Houston, TX), with multiple laser wavelength excitation capabilities [(532, 637, 671, and 782) nm]. All the fluorescence data in the main contribution was collected on single-phase liquid samples containing SWCNTs, varied concentrations of surfactant (vide infra) and PEG polymer in aqueous dispersion. Prior to measurement, samples were pre-incubated at 20.0 °C in a temperature-controlled dry bath (Torrey Pines Sci.). During measurements, the temperature of the sample within the instrument was controlled to (20.0 ± 0.2) °C using a water-jacketed cuvette (Firefly Science) attached to a temperature monitored water reservoir. The flowrate from the reservoir through the cell as driven by a small pump was measured at ≈ 200 mL/min. The total volume of sample used for each measurement was typically 900 μL. Acquisition conditions for NIR fluorescence detection were between 7 × 400 ms and 7 × 1500 ms depending on the emission intensity of each sample. A uniform SWCNT concentration was used for each experimental series that was sufficiently low to limit detector counts to within the linear range of the NIR detector array under all conditions. Fluorescence intensity data was acquired using each of the four different laser lines. The observed intensity in each collection was then linearly corrected for the simultaneously recorded laser power and then scaled by the maximum observed intensity (= 10, Arb. Units) for its data set. The resultant data are generally shown as scaled fluorescence intensity versus the alkyl co-surfactant (AcS, e.g., SDS) concentration data plots at the wavelength of peak E11 emission for each respective (n,m) species at a fixed bile salt and polymer concentration (e.g., 0.5 g/L (0.05 %) DOC, 35 g/L (3.5 %) 6 kDa PEG). The peak emission wavelength depends on the SWCNT species and were ≈ 1035 nm for (7,5), ≈ 1131 nm for (7,6), ≈ 963 nm for (8,3), and ≈ 984 nm for (6,5). Due to the high enrichment of the samples, generally any of the four excitation wavelength data sets can be used to monitor the fluorescence of the primary species; the specific wavelength for analysis was chosen based on considerations of laser power and stability, as well as (n,m) cross-section and abundance differences. With these considerations in mind, 637 nm excitation data was used for the (7,5), (7,6), and (6,5) data plots, while 671 nm excitation data was used for the (8,3) data plots.
Finite-width Heaviside functions were fit to the fluorescence intensity versus AcS concentration plots to generate the curves seen in Figures 3, 4A, 5, 7 and Figures S5–S8, S10, S12, S15–18 and to extract the PCCCs reported in Tables S1–S6. The formulation for the Heaviside fitting was taken from Agrawal et al. [27] and is shown in Equation 1.
Figure 3.
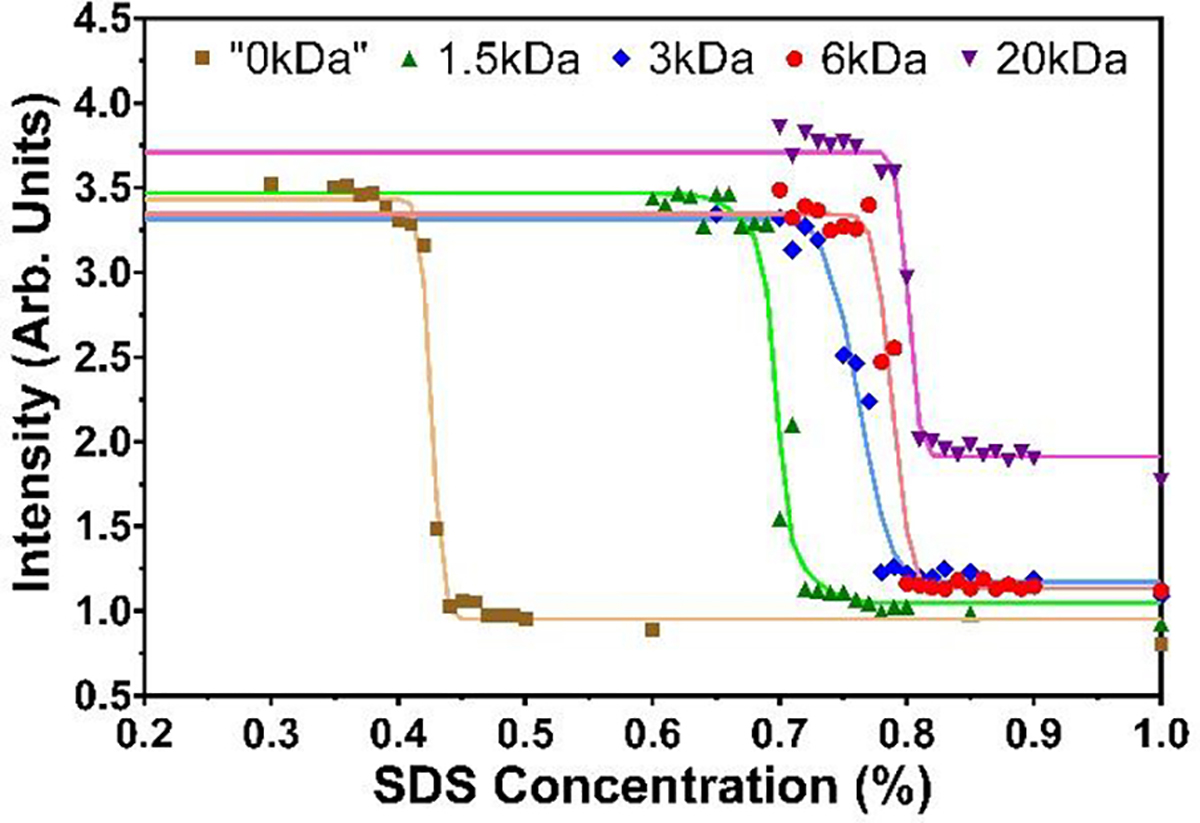
Fluorescence intensities of the +(7,5) SWCNT (637 nm excitation) as functions of SDS concentration for different molecular mass PEG polymers at a constant concentration of 35 g/L (3.5 %), with a constant DOC concentration of 0.5 g/L (0.05 %) at 20.0 °C. The effect of PEG addition to the PCCC is significant but is only weakly dependent on its molecular mass. Curves are double finite-width Heaviside fits to the data. PCCCs from Heaviside fitting are listed in Table S1.
Figure 4.

A) Fluorescence intensities of the +(7,5) SWCNT (637 nm excitation) as functions of SDS concentration for different concentrations of DOC in the dispersion with a constant 6 kDa PEG concentration of 35 g/L at 20.0 °C. Curves are double finite-width Heaviside fits to the data. Values for the fluorescence transition concentrations from Heaviside fitting are listed in Table S2. The amount of SDS necessary to change from a DOC-dominated interface to an SDS dominated interface increases with the concentration of DOC in solution. B) PCCCs for the +(7,5), and both enantiomers of the (7,6), (8,3), and (6,5) SWCNTs as a function of DOC concentration show a consistent linear trend (slope), reflecting that the PCCC occurs at an SDS:DOC mass ratio ≈ 15:1 for the +(7,5) SWCNT, and on average 15.6:1 for the (7,6) SWCNTs, 22.6:1 for the (8,3) SWCNTs, and 25.4:1 for the (6,5) SWCNTs species (separate values for both enantiomers are provided in Table S2).
Figure 5.

Fluorescence intensities of the +(7,5) SWCNT (637 nm excitation) as functions of AcS variant concentration at a constant 6 kDa PEG concentration of 35 g/L, constant DOC concentration of 0.5 g/L, and T = 20.0 °C. In A, the concentration of alkyl surfactant necessary to reach the PCCC increases significantly with decreasing AcS tail length, but with similar functionality for tail lengths of 9 to 12 carbons. In B, the unique behavior of SDBS (blue) is shown in comparison with its structurally similar analogues (STS, StS, SDS), which are replotted from A. In both plots the curves are double finite-width Heaviside fits to the data. PCCCs from Heaviside fitting are listed in Table S3.
Figure 7.

Fluorescence intensities of the +(7,5) SWCNT (637 nm excitation) as functions of SDS concentration for different bile salts at a constant concentration of 0.5 g/L, with a constant 6 kDa PEG concentration of 35 g/L at 20.0 °C. Curves are double finite-width Heaviside fits to the data. PCCCs from Heaviside fitting are listed in Table S5.
| (1) |
In Equation S1, cAcS is the concentration of AcS, I(cAcS) is the observed fluorescence intensity, and I1, I2, I3, are the intensity of the initial plateau, intermediate plateau, and final plateau, respectively; PCCCi and widthi are the partition coefficient change concentration (PCCC) and width of the ith observed transition. Of note is that the minimization surface for most of the fit parameters is affected by the presence or absence of specific data points, and by the anticipated measurement uncertainty in the data. While quantitative values are reported, a precise uncertainty is difficult to quantify, thus reported values should be considered central estimates. For consistency with the separations literature, all PCCCs throughout the text are presented as mass/volume percentage of alkyl co-surfactant (AcS, e.g., SDS) in solution unless otherwise stated.
To better illustrate emission wavelength shifting as a result of surfactant binding effects, the fluorescence data are sometimes shown as SDS concentration versus E11 fluorescence emission wavelength 2D contour plots, where the z-scale is the scaled fluorescence intensity. These contour plots are shown in Figures 6 and 8 and Figures S13, S14, and S19. The (7,6)/(7,5) contour plots use 637 nm excitation data, while the (6,5)/(8,3) contour plots use 671 nm excitation data to better highlight the behavior of the minor (8,3) component. In these contour plots, the labeled dashed lines represent the wavelengths of peak E11 emission for each of the (n,m) species at 0.5 g/L (0.05 %) DOC, 35 g/L (3.5 %) 6 kDa PEG [≈ 1035 nm for (7,5), ≈ 1131 nm for (7,6), ≈ 963 nm for (8,3), and ≈ 984 nm for (6,5)], with peak-shifting due to non-DOC surfactant interactions described as blue- or red-shifted with respect to these wavelengths.
Figure 6.

Alkyl tail length variant AcS concentration vs. fluorescence emission wavelength (637 nm excitation) 2D contour plots for the (7,6)/(7,5)-rich sample, where the z-scale is the scaled fluorescence intensity, at a constant 6 kDa PEG concentration of 35 g/L, with a constant DOC concentration of 0.5 g/L at 20.0 °C. The labeled dashed lines represent the wavelengths of peak emission [≈ 1035 nm for (7,5), ≈ 1131 nm for (7,6)] for each (n,m) species at 0.5 g/L DOC, 35 g/L 6 kDa PEG. Differences are observed in the peak emission wavelengths at AcS concentrations above the PCCC (intensity transition) that depend on the choice of AcS.
Figure 8.

SDS concentration vs. fluorescence emission wavelength 2D contour plots for the two SWCNT samples, where the z-scale is the scaled fluorescence intensity, for different bile salts at a constant concentration of 0.5 g/L with a constant 6 kDa PEG concentration of 35 g/L at 20.0 °C. The (7,6)/(7,5)-rich sample emission under 637 nm excitation is shown at the top and the (6,5)/(8,3)-rich sample emission under 671 nm excitation is shown at the bottom. The dashed lines represent the wavelengths of peak emission [≈ 1035 nm for (7,5), ≈ 1131 nm for (7,6), ≈ 963 nm for (8,3), and ≈ 984 nm for (6,5)] for each (n,m) species at 0.5 g/L DOC, 35 g/L 6 kDa PEG. Note the initial emission wavelength shifts due to different bile salt coverage, with additional wavelength shifting during the transition to SDS coverage for SC and CDOC.
Where specified, uncertainty in this contribution is reported as one standard deviation.
3. Results and Discussion
Our previous contribution demonstrated proof-of-concept that the fluorescence-based methodology could rapidly and accurately determine the experimental conditions (PCCCs) that yielded top-phase extraction of specific (n,m) species without performing a physical ATPE separation [23]. Having a quantitative manner to determine PCCCs, the effect of basic experimental parameters such as temperature and PEG concentration on the resultant PCCCs of the SWCNTs was explored, and those conditions necessary for excellent agreement between actual ATPE separations and the NIR fluorescence determined PCCCs were verified. In this contribution we focus on using the same PCCC determination methodology to evaluate the effects of different molecular mass PEG on the PCCCs and notably on the chemistry of the (generally two) competing surfactants whose competitive binding to the nanotube surface drives the ATPE selectivity. The chemical structures of each surfactant analyzed in this contribution are shown in Figure 1, with the alkyl sulfates and sulfonates (alkyl co-surfactants, AcSs) shown in Figure 1A and bile salt variants shown in Figure 1B. More details on the surfactant comparisons are contained within their respective sections (vide infra). As in the prior effort, only the PCCCs of semiconducting SWCNT (n,m) species can be determined via NIR fluorescence measurements, as metallic SWCNTs do not display fluorescence.
Figure 1.

A) Schematic showing the molecular structures and points of variation for the alkyl sulfate/sulfonate co-surfactants. The primary variation investigated is the effect of the number of repeat units, n, in the alkyl tail. B) Schematic of the bile salts used in this contribution. The circles and boxes highlight the chemical moieties that are different or present/absent across the shown set. The most commonly competed ATPE surfactants are SDS and DOC.
3.1. Optical Characterization of SWCNT Samples
Absorbance spectra and representative fluorescence spectra of the (7,6)/(7,5) and (6,5)/(8,3) parent dispersions in 10.0 g/L DOC are presented in Figures 2A and B respectively. As previously reported [25, 28, 29], both samples display the characteristics of high quality SWCNT dispersions in absorbance measurements [30], sharp optical transition features and a large ratio of peak to background absorbance. Fluorescence excitation similarly results in strong, distinguishable, emission assignable to single (n,m) species [31]; the feature size is different between the two techniques due to differences in fluorescence cross-section of each (n,m) species at the chosen excitation wavelengths [32]. Additional spectroscopic characterization is reported in Figures S1–S4. Of note, we empirically know the minor (7,5) component in the (7,6)/(7,5) sample to be heavily enriched in one enantiomer (positive CD signal at E22, i.e., the + enantiomer) from its separation process and published results [23, 25, 33]. Presenting fluorescence titration results for this species thus simplifies the data presentation and observability of experimental parameter variation effects. Titration plots for the other three SWCNT species [(7,6), (8,3), and (6,5)], which contain discernable quantities of both enantiomers, are primarily reported in the SI.
Figure 2.

A) Absorbance spectra of the (6,5)/(8,3) rich (purple) and (7,6)/(7,5) rich (blue) parent dispersions as measured in 10.0 g/L DOC. The (8,3) is a small shoulder on the (6,5) lowest energy optical transition (E11) at ≈ 985 nm, but is visible in fluorescence measurements due to its much larger fluorescence cross-section to the 637 nm laser excitation. B) Fluorescence emission for dilute aliquots of the (6,5)/(8,3) rich (purple) and (7,6)/(7,5) rich (blue) parent dispersions at 637 nm excitation.
3.2. PEG Molecular Mass Effect
Our previous work determined that the presence of PEG in the dispersion environment plays an important role in modulating the adsorbed surfactant shell on the SWCNTs, with PEG concentration significantly affecting the determined PCCCs values [23]. A 6 kDa PEG concentration of ≈ 33 g/L in the fluorescence measurement provided the best match to the PCCCs from typical experimental ATPE separation conditions. From a phase diagram of the experimental system, such a PEG concentration appears to correspond to the concentration experienced by SWCNTs previously residing in the DEX phase at the instigation of ATPE microphase separation. As such, when evaluating the effects of PEG molecular mass on SWCNT PCCCs, the concentrations of the four different PEG molecular masses (1.5 kDa, 3 kDa, 6 kDa, 20 kDa) compared were set at 35 g/L to better match the actual ATPE separation conditions across all PEG samples. This slight increase has minimal effect on the PCCCs for the 6 kDa PEG results. Modulation of the molecular masses of the two polymers (PEG and DEX) are potentially useful to optimize phase viscosities and volume fractions for large scale or automated ATPE processing [33] and so evaluation of the molecular mass driven effects is important. However, we previously demonstrated that the DEX concentration does not significantly affect the PCCCs. Focusing on the molecular mass effects of PEG, fluorescence intensity plots of the +(7,5) SWCNT are shown in Figure 3 as functions of SDS concentration for different molecular mass (but 35 g/L concentration) PEG polymers with a constant concentration of DOC in the dispersions at 20.0 °C.
In Figure 3, the amount of SDS necessary to change from a DOC-dominated interface to an SDS-dominated interface increases with the increased molecular mass of PEG in solution. This transition (i.e., the PCCC point), is responsible for the sharp reduction in fluorescence intensity that is attributed to a more porous adsorbed interfacial surfactant layer for SDS allowing quenching by dissolved oxygen species [34]. The magnitude of the induced shift in PCCCs is however relatively small and appears to taper off at higher molecular masses. A similar result is also seen for the two (7,6) enantiomers (Figure S5), with the calculated PCCCs also being slightly higher than that of the +(7,5) SWCNT (Table S1), in agreement with the observation of the +(7,5) SWCNT extracting just before the (7,6) SWCNTs under the typical (SDS vs. DOC) ATPE experiment used for diameter-based (n,m) sorting of SWCNTs. While both the size and number of the dispersed polymer molecules changes with the molecular mass, one hypothesis for the weak observed effect is that for a constant mass concentration, the number of ethylene glycol repeat units is constant. This implies that the surfactant binding is likely more affected by phenomenon such as a PEG-defined redox environment [35] than, for instance, osmotic pressure effects or binding of the PEG to the surfactant. This result importantly implies that engineering-lead choices of PEG molecular mass should not strongly alter the anticipated ATPE fractionation of SWCNT (n,m) species in scaled separations.
3.3. DOC Concentration Effect
After the two-phase separation phenomenon driven mostly by the thermodynamics of the polymer solution, the competition of the present surfactants for the nanotube surface is the most important phenomenological effect enabling ATPE separations of SWCNTs. While many variations of ATPE separation have been reported, systematic probing of the surfactant effects have not been reported at otherwise uniform experimental conditions. Thus, we next consider the impact of surfactant chemistry on the observed PCCCs, particularly for the DOC – alkyl surfactant combination to elucidate mechanistic information. Considering that typical ATPE separations are performed at 0.50 g/L DOC, we used that concentration as our reference value and experimented with evenly spaced (0.15 g/L) DOC concentrations above and below that value (0.20 g/L, 0.35 g/L, 0.65 g/L, and 0.80 g/L). Given that DOC adsorbs more strongly to the nanotubes than SDS, we expect that a decrease or increase in initial DOC concentration would require a lesser or greater SDS concentration in solution to displace the DOC and thus lead to partitioning to the top-phase (PEG-rich) in an ATPE separation, which we monitor here by the sharp decrease in fluorescence intensity associated with the PCCC value. Figure 4A shows fluorescence intensity plots of the +(7,5) SWCNT as functions of SDS concentration for different concentrations of DOC in dispersions with a constant 6 kDa PEG concentration of 35 g/L at 20.0 °C. As expected, the amount of SDS necessary to change from a DOC-dominated interface to an SDS-dominated interface increases with the concentration of DOC in solution. Importantly, this functionality is monotonic and well-fit by a linear trendline. This strongly implies, at least for the SDS-DOC pair, but potentially for other surfactant pairs, that the competition for adsorption to the SWCNT interface is dominated by the simple molar concentrations of the surfactants in solution, and does not include significant contributions from potential alternative mechanisms, such as micellar sequestration of the DOC. The same linear relationship is also seen for the other three SWCNT populations [(7,6), (8,3), and (6,5)] (Figures S6–8) analyzed. In addition, the calculated PCCCs for the SWCNTs at a particular DOC concentration increase in the order +(7,5), (7,6), (8,3), and (6,5) (Table S2), in agreement with the sorting order of these SWCNTs under the typical (SDS vs. DOC) ATPE experiment used for diameter-based (n,m) sorting [9]. The linear relationships for each of the SWCNT species are shown in Figures 4B and S9.
Another result to highlight in Figure 4B is that the PCCCs for the two enantiomers of each (n,m) species are resolvable; the difference in PCCCs for the two enantiomers also varies species to species. Depending on the literature work being compared to, the difference in separation conditions of enantiomers is typically unaddressed. In mass concentrations, the PCCC surfactant ratios for separating both hands of several commonly isolated SWCNT species are ≈ 15:1 for the +(7,5) SWCNT, 15.59:1 and 15.66:1 for the (7,6) enantiomers, 21.73:1 and 23.54:1 for (8,3) SWCNT enantiomers, and 23.95:1 and 26.80:1 for the (6,5) enantiomers; molar ratios for these species are shown in Table S2. The averages of these values, i.e., 15.6:1, 22.6:1, and 25.4:1 (all mass basis), are a good match to literature reports [9, 20, 36], albeit we can now state that enantiomer driven differences should be considered for separation development. It is also worth noting that the quantity of surfactant bound to SWCNTs in the dispersion is an insignificant fraction of the total surfactant mass, of either surfactant, at any of the experimental concentrations.
Several studies have also investigated the SWCNT surface binding competition between surfactants in a binary system using thermodynamic models such as the Hill equation [37–39]. However, it is difficult to quantitatively apply this type of thermodynamic model to the systems described in this contribution due to the presence of PEG as a 3rd component in our systems. As shown in our previous work [23] and also seen here (Figures 3 and S5), the concentration of PEG in the system has a strong effect on the thermodynamics of the system and strongly shifts all of the titration curves from those observed in a binary, surfactant-only system. As such, we have chosen to only fit the data to extract the transition points, as they affect the design of separation experiments, and for qualitative discussion of the binding competition. Quantitative description will require further model development and validation for applicability to the complex environment necessary to represent ATPE separations.
3.4. Alkyl Co-Surfactant (AcS) Variation Effect
SDS is the most commonly used co-surfactant along with a bile salt for (n,m) sorting of SWCNTs, with application in density gradient ultracentrifugation, column chromatography and ATPE and other methods [4, 40]. The straightforward measurement platform of this contribution, however, allows for evaluation of closely related alkyl tail surfactants and their competition with DOC for the diameter separation of SWCNTs. The commonality of SDS, however, does not necessarily imply that it is the optimal choice for such separations. As such, we sought to understand the effect of the alkyl tail length (for alkyl sulfate surfactants) on the PCCCs of SWCNTs, using SDS as our reference point. As shown on the left side of Figure 1A, the alkyl sulfates examined differ only by the number of CH2-units in their tails, ranging from seven (sodium octyl sulfate, SOS, C-8) to thirteen (sodium tetradecyl sulfate, STS, C-14), with the SDS reference having eleven CH2-units (C-12). This tail length range covers the functional limits of variation for this molecule type at room temperature conditions, as the short tail chains exhibit weaker surfactant functionality and longer tail length species exhibit greatly diminishing solubility and so also become ineffective.
Fluorescence intensity plots of the +(7,5) SWCNT as functions of AcS variant concentration at a constant 6 kDa PEG concentration of 35 g/L, with a constant DOC concentration of 0.5 g/L at 20.0 °C are shown in Figure 5A. The titration curves follow the expected trend, where the shorter chain alkyl sulfates (SOS, SNS, SdS, SUS) require greater concentrations than SDS in order to displace the initial DOC coverage and lead to fluorescence intensity decreases, owning to their less hydrophobic nature [41]. Conversely, the more hydrophobic longer chain alkyl sulfates (StS, STS) require lesser concentrations than SDS in order to displace the DOC, also as expected [41]. The (7,6) SWCNTs likewise feature the same trend (Figure S10A), with the calculated PCCCs being slightly higher than that of the +(7,5) SWCNT (Table S3). The calculated PCCCs for each alkyl sulfate are compared with their respective critical micelle concentration (CMC) values in Figure S11, which shows that although each PCCC is above the respective CMC (Table S4), they are poorly correlated. This is in agreement with the notion that the CMC value of a particular surfactant is not a decisive factor in determining that surfactant’s interactions with SWCNTs [41]. Focusing on the (7,6) PCCCs, it appears that STS, StS, and SOS lack the ability to resolve the (7,6) enantiomers, whereas the distinct PCCCs and two-step behavior of the remaining titration curves highlight the ability of SUS, SdS, and SNS to resolve the (7,6) enantiomers, alongside the reference surfactant SDS. The rationale behind the inability of STS, StS, and SOS to resolve the (7,6) enantiomers appear rooted in their binding properties, but for the opposite reasons. STS and StS, being more hydrophobic than SDS, appear to replace the adsorbed DOC on the SWCNTs sufficiently more readily that either this replacement disrupts the enantiomeric differences in the DOC binding, or occurs too close together to resolve. Handed interactions could perhaps be accentuated by competition with a greater concentration of bile salt (vide infra), however the limited solubility of STS and StS preclude this strategy. The binding mechanism for STS and StS may additionally follow a different path of replacement or incorporation into the adsorbed surfactant layer at the PCCC transition, as reflected in a different observed fluorescence transition shape (vide infra), than for the shorter tail AcS molecules. Note that a stronger apparent interaction of the STS and StS molecules with the nanotube, as compared to SDBS (vide infra), does not necessarily imply a lesser decrease in fluorescence. The fluorescence decrease will sensitively reflect the permeability of the specific resulting adsorbed structure, which can vary for AcS molecules based on the specific density and orientation of the adsorbed layer [42, 43]. Conversely, the short tail SOS is far less hydrophobic and more soluble, and exhibits a much wider PCCC transition width compared to the other alkyl sulfates. This suggests that it has much weaker binding interactions with the SWCNTs and precludes more accurate PCCC determination. Given this weak binding, obtaining enantiomeric resolution using SOS, while potentially possible, is probably impractical for actual separations. Significantly, although unexplored in this contribution, these results indicate that a single alkyl surfactant is likely to provide the optimal resolution for any given separation. Thus, the chemical purity of the alkyl co-surfactant is of significant importance for reproducible separations.
We also anticipated that the minor chemical variations of the surfactants could impact the packing structure of the adsorbed dispersant layer on each SWCNT species’ surface and not just modulate the PCCCs. As shown in our previous contribution and elsewhere, it is well known that SWCNT surface coverage by a different surfactant molecule can substantially alter not just the observed intensity (which the PCCCs are correlated with), but also the wavelength of the NIR fluorescence emission from the same SWCNT species. To better illustrate the wavelength shifting of the fluorescence emission because of different surfactant binding, we also plotted the fluorescence data as AcS concentration vs. fluorescence emission wavelength 2D contour plots, where the z-scale is the scaled fluorescence intensity. Three of these contour plots are shown in Figure 6, which show this relationship for the (7,6)/(7,5) SWCNT sample under 637 nm excitation for SDS (C-12), StS (C-13), and STS (C-14), with the dashed lines representing the wavelengths of peak emission for the two SWCNT species at the initial experiment conditions of 0.5 g/L (0.05 %) DOC, 35 g/L (3.5 %) 6 kDa PEG [≈ 1035 nm for (7,5), ≈ 1131 nm for (7,6)]. Looking at the leftmost of these plots in Figure 6, beginning at the initial conditions and increasing the SDS concentration (left to right) results in fluorescence intensity decreases for the +(7,5) at ≈ 0.79 % SDS and a two-step decrease along the (7,6) line, with the first step at ≈ 0.82 % SDS and a second step at ≈ 0.84 % SDS. As previously stated, these values represent the PCCCs for these SWCNTs under the experimental conditions, with the two-step behavior of the (7,6) SWCNTs attributed to the two enantiomers (7,6) and (6,7). Monitoring the fluorescence wavelength during this process results in a ≈ 1.5 nm blue-shift in the +(7,5) SWCNT after the PCCC point and a ≈ 1 nm red-shift in the (7,6) SWCNTs after the last PCCC point. Similar results with respect to wavelength shifts are also seen in the contour plots of the shorter tail alkyl sulfates (SOS, SNS, SdS, SUS; data not shown).
However, as shown in the middle and rightmost contour plots shown in Figure 6, for the longer chain alkyl sulfates StS and STS, the observed wavelengths post-PCCC are quite different. Here, monitoring the fluorescence wavelength during the AcS titration (left to right) results in a ≈ 5 nm blue-shift in the +(7,5) SWCNT after the PCCC point and a ≈ 3 nm blue-shift in the (7,6) SWCNTs after the last PCCC point, with respect to the initial DOC coverage. Combining these results yields two important observations: 1) that +(7,5) and (7,6) coverage by the longer chain alkyl sulfates StS and STS yields a ≈ 4 nm blue-shift in fluorescence emission wavelength compared to SDS (and the shorter chain alkyl sulfates); 2) confirmation of previous literature results that enantiomers of the same SWCNT species experience differences in competitive dispersant binding when at least one of the dispersants is also chiral. While the longer chain alkyl sulfates STS and StS have not been well studied, it is understood that their increased hydrophobicity should lead to increased binding affinity for the SWCNTs relative to the shorter chain alkyl sulfates [41]. This increased binding affinity would presumably lead to a denser surfactant coating on the SWCNTs and the subsequent blue-shifts in fluorescence emission [39, 44].
We also tested alkyl sulfonates (having an SO3 head group), including sodium 1-undecanesulfonate (SUSO3) and sodium dodecylbenzenesulfonate (SDBS), to monitor the effect of anionic head group chemistry on the observed PCCCs (right side of Figure 1A). Fluorescence intensity curves and contour plot for the (7,6)/(7,5) SWCNT sample with SUSO3 as the competing surfactant are shown in Figures S12 and S13, respectively, alongside replotted results for the structurally similar alkyl sulfates (SUS and SdS) for contrasting purposes. The PCCCs for SUS and SUSO3 are quite similar (Table S3 and S4), as are the wavelength shifts past the PCCC point (Figure S13). This result, when combined with the alkyl tail length study above, suggests that the PCCC-shifting effect of the anionic sulfate/sulfonate head group is very minor relative to the length of the alkyl tail in this class of surfactants, in agreement with the literature [44].
The fluorescence intensity curves of the +(7,5) and (7,6) SWCNTs with SDBS as the competing surfactant are shown in Figures 5B and S10B, respectively, alongside replotted results of the structurally similar alkyl sulfates (SDS, StS, and STS) for contrasting purposes. These curves show that SDBS behaves most similarly to the 13-carbon StS in terms of PCCCs (Table S3), with both having more in common with STS than SDS. This result is sensible given that the alkylbenzene tail of SDBS is closer in physical length to STS and StS. Likewise, the fluorescence wavelength contour plots for the (7,6)/(7,5) SWCNT sample with SDBS as the competing surfactant are shown in Figure S14, again with replotted results of the structurally similar alkyl sulfates (SDS, STS) for comparison. The magnitude of blue-shifting from SDBS is almost identical to those of StS and STS, with the +(7,5) SWCNT blue-shifting ≈ 4.5 nm after the PCCC point and the (7,6) SWCNTs blue-shifting ≈ 3 nm after the last PCCC point. This result is consistent with previous reports of SDBS forming a denser coating on SWCNTs than SDS due to a greater relative binding affinity [44]. A denser surfactant layer, in general, reduces the effective dielectric constant experienced by the nanotube by excluding water molecules, resulting in decreased screening of the exciton and bluer optical transition energies. Unlike the three alkyl sulfates, the fluorescence intensity decrease at SDBS concentrations greater than the PCCCs is also greatly reduced, which is also consistent with the formation of a dense, oxygen species excluding, surfactant layer by the SDBS. Interestingly, on close inspection of the SDBS curves, the fluorescence intensities of both SWCNT species probed fluctuate at the PCCC point, dropping to a sudden minimum before settling at a greater relative intensity (both SDBS covered SWCNT intensities are still lower than the initial intensities associated with DOC coverage). Our results above suggest that the SO3 head group (instead of SO4) could explain the slightly higher than expected PCCC for SDBS based on its alkyl(benzene) chain length being longer than StS and STS, but this would not be expected to dramatically alter the magnitude of the fluorescence. We’re thus compelled to believe that the presence of the benzene ring in the surfactant tail results in modified binding of the surfactant to the SWCNTs, with a unique surfactant exchange phenomenon occurring at the PCCC point during the replacement of the DOC-covered surface by SDBS. Molecular dynamics simulations have shown that when SDBS is present on the SWCNT surface at low concentrations, both the alkyl tail and benzene ring tend to adsorb to the surface [45]. However, when the SDBS concentration increases, it was shown that the anionic head group tends to pull the benzene ring away from the SWCNT surface [45]. This surface coverage-dependent SWCNT-benzene ring interaction could explain the fluorescence modulations observed at the PCCC point, if perhaps complicated by our system also containing DOC as a competitor for the SWCNT surface.
Altogether, these results suggest that the anionic sulfate/sulfonate head group only has a minor effect on the PCCCs of the SWCNTs, with both the SUSO3- and SDBS-covered SWCNTs having PCCCs very close to their most structurally similar alkyl sulfate analogues. For SDBS however, the nature of the binding interactions is different from its structurally similar analogues, featuring a more complex surface replacement mechanism, presumably due to the presence of the benzene ring. Further modeling of these differences is beyond the scope of this contribution but warrants further investigation.
3.5. Bile Salt Variant Effect
Although DOC, or the tri-hydroxy sodium cholate (SC), are the most commonly used bile salts for SWCNT dispersion and processing, multiple other bile salt molecules are commercially available including variations with a different -OH group location, such as chenodeoxycholate (CDOC), or appended tail functionality, such as taurodeoxycholate (TDOC) and glycodeoxycholate (GDOC). Molecular structures of the five bile salts used in this work are shown in Figure 1B, where the points of variation are identified by circles (for the hydroxy group locations) or boxes (for the appended tail group). Specifically, GDOC and TDOC are identical to DOC, except the carboxylate tail in DOC (red box) is replaced by glycine- (purple box) and taurine- (blue box) conjugates, respectively. Likewise, DOC (with 3α and 12α hydroxy groups) and CDOC (which has 3α and 7α hydroxy groups) are isomers differing only in the locations of their hydroxy groups (orange and green circles); the tri-hydroxy SC (hydroxy groups at 3α, 7α, and 12α) has hydroxy groups in both locations. For comparison to the separations literature, all solutions of bile salts investigated were constructed on a mass/volume basis of 0.5 g/L. Due to molecular mass differences amongst the molecules, the molar concentrations are somewhat different for a consistent mass concentration (by (4 to 26) % on a molar concentration basis, as compared to DOC) for the various bile salts.
Fluorescence intensity plots of the +(7,5) SWCNT as functions of SDS concentration for the different bile salts at a constant concentration of 0.5 g/L, with a constant 6 kDa PEG concentration of 35 g/L at 20.0 °C are shown in Figure 7, with the PCCCs listed in Table S5. A version of this figure as projected for a constant molar concentration of the bile salt is reported in Figure S18 (with projected PCCCs in Table S6). With either scaling, but focusing on Figure 7, the order in terms of requiring higher SDS concentrations to reach the PCCC is: DOC > GDOC > TDOC ≫ CDOC > SC. The order is maintained for the other three SWCNT populations [(7,6), (8,3), and (6,5)] (Figures S15–S17), with the calculated PCCCs for the SWCNTs with respect to a particular bile salt generally maintaining the SWCNT sorting order of (7,5), (7,6), (8,3), and (6,5) (Table S5), of the typical (SDS versus DOC) diameter-based (n,m) sorting ATPE experiment. It is worth noting that this is not an exhaustive set of (n,m) structures, and that different separation orders have been reported primarily for 3+ surfactant mixtures or broader (n,m) sets [46, 47]. Some differences are seen when comparing the SDS titration curves of the respective bile salts, with the TDOC curves generally featuring relatively larger fluorescence intensity decreases at the PCCC points, or the CDOC curves having much wider PCCC transition widths compared to the other bile salt curves, which feature more rapid PCCC transitions. We now compare the five bile salt variants by focusing on the aforementioned structural differences: 1) the appended tail triad of DOC, GDOC, TDOC and 2) the hydroxy position triad of DOC, CDOC, and SC.
Focusing on the appended tail triad, the PCCC order is DOC > GDOC > TDOC, which is maintained across the four SWCNT species. The glycine- and taurine- conjugation of DOC leads to increasingly weaker binding to the SWCNTs owing to their less hydrophobic character, as recently reported by Yomogida et al. [16] using hydrophobicity data from Heuman [48]. As noted earlier, the TDOC curves feature lower fluorescence intensities past the PCCC when compared to DOC and GDOC, although all generally feature sharp transitions at the PCCCs. When the bile salt (DOC, GDOC, TDOC) is the dominant surfactant, the initial SWCNT fluorescence is expected to be identical (or at least very similar) with the intensity decreases at the PCCCs also being consistent. Why this is not the case for TDOC is unclear, but could be the result of co-micellization, with the TDOC potentially disrupting the SDS coverage on the SWCNTs.
When examining the fluorescence contour plots of both the (7,6)/(7,5) and (6,5)/(8,3) SWCNT samples (Figure S19), we focus now on the initial wavelengths corresponding to fluorescence emission arising from SWCNT coverage by the bile salt variant. Here, the emission wavelengths for the GDOC and TDOC are the same as DOC for the three mixed enantiomer SWCNTS [≈ 1131 nm for (7,6), ≈ 963 nm for (8,3), and ≈ 984 nm for (6,5)], yet GDOC- and TDOC-covered +(7,5) are blue-shifted ≈ 1 nm relative to DOC-covered +(7,5). We attribute the slight shift seen only for this SWCNT species to it being the sole single handed SWCNT species, with the three mixed enantiomer SWCNTS likely experiencing competing blue- and red-shifting effects owning to their mixed enantiomer populations experiencing different interactions with the chiral bile salt surfactants. When competing SDS against these surfactants and monitoring the fluorescence wavelength (going left to right across each contour plot), no discernable shifts in the +(7,5) or (7,6) emission wavelengths are seen when both the TDOC and GDOC surfactants are replaced by SDS at the PCCC point (recall the respective slight blue- and red-shifts for DOC as described in the AcS variant section above). However, the (8,3) SWCNTs experience a ≈ 1 nm blue-shift after the PCCC point, while the (6,5) SWCNTs experience a ≈ 3 nm red-shift when covered by SDS; these shifts are the same for all three bile salts discussed here (DOC, GDOC, TDOC). Given the similarities in fluorescence emission wavelengths and character of fluorescent intensity plots between the three bile salts, our results support the generally accepted mechanism that the hydrophobic face of the bile salt (the tetracyclic ring complex with methyl groups) plays the major role in SWCNT binding interactions [49], with the conjugated tail mainly impacting surfactant-surfactant interactions (and hence, PCCCs) by way of hydrophobicity differences.
We next turn our attention to the hydroxy positioning triad of DOC, SC, and CDOC, where the PCCC order is DOC ≫ CDOC > SC, which is again generally maintained across all four SWCNT species. Again, the increasingly less hydrophobic characters of the CDOC and SC would account for the increasingly weaker SWCNT binding [16, 48], resulting in a lower SDS concentration needed to displace the bile salt surfactants and lower PCCCs. However, the unique observations seen in the CDOC results below highlight the importance of molecular geometry in the SWCNT-bile salt interactions, especially as CDOC and TDOC have approximately equal hydrophobic indices [48], but very different interactions with the SWCNTs. As mentioned earlier, the CDOC curves have much wider PCCC transition widths compared to DOC and SC, which feature more rapid PCCC transitions. The broadness of the CDOC curves, in addition to their single smooth decrease in fluorescence suggests CDOC lacks the ability to resolve SWCNT enantiomers. Although SC is a weaker binding surfactant than DOC (and CDOC), the SDS titration curves against SC generally feature two step decreases in fluorescence intensity (similar to DOC), however poorly resolved in the curve fitting calculations due to the small widths of the PCCC transitions. The fluorescence contour plots of the (7,6)/(7,5) and (6,5)/(8,3) SWCNT samples (Figure 8) reveal interesting differences between the binding interactions of DOC, SC, and CDOC. Again, focusing on the initial emission wavelengths, the three mixed population SWCNTs each experience red-shifting when covered by SC relative to DOC. The (7,6) red-shifts by ≈ 3 nm, the (8,3) red-shifts by ≈ 1 nm, and the (6,5) red-shifts by ≈ 4 nm, with the +(7,5) maintaining the same emission wavelength as DOC. However, when covered by CDOC, each of the (7,6), (8,3), and (6,5) SWCNTs feature ≈ 1.5 nm blue-shifts, with the +(7,5) SWCNT blue-shifting by ≈ 3 nm.
Even more interesting are the modulations in fluorescence emission wavelength during the SDS titrations as the bile salt surface is replaced by SDS. In the case of SC, invariant of the SWCNT species, the emission wavelength blue-shifts by up to ≈ 5 nm on approaching the PCCC point, before red-shifting and interestingly returning to the initial wavelength, although the SWCNT surface should now be dominated by SDS. Similarly curious wavelength shifts are seen in the case of CDOC, where the +(7,5) and (7,6) SWCNTs both blue-shift by ≈ 1 nm, with the (6,5) blue-shifting by ≈ 2 nm and (8,3) blue-shifting by ≈ 4 nm on approach to the PCCC point, with each red-shifting by ≈ 3 nm from these blue-shift maximums, resulting in net red shifts for the +(7,5), (7,6) and (6,5) SWCNTs and a net 1 nm blue-shift for the (8,3) when covered by SDS after initial CDOC coverage. Another fascinating observation is that the wavelength shifts during SDS titration for both SC and CDOC parallel the fluorescence intensity increases, with the maximum observed intensities coinciding with the maximum wavelength shift before the PCCC point. It is readily apparent that a complex surfactant exchange process is occurring on approach to the PCCC point when either the SC or CDOC is replaced by SDS. A recent study involving the SC-SDS competition pair, Yang et al. suggested the formation of a mixed micellar coating, affecting the effective permittivity and water accessibility, as a possible explanation for such observations in this complex exchange process [17]. Alternatively, an explanation for the wavelength shifts could be torsion exerted on the SWCNTs by adsorbed chiral bile salt surfactants, which would relax upon replacement by SDS; such an effect was previously seen in flavin mononucleotide (FMN) studies [50, 51]. Pursuing the exact mechanics of these transitions is however beyond the scope of this contribution, but we concur with the prompt for additional studies into this mechanism.
Unlike the conjugated tails of GDOC and TDOC, which are likely too distal to have significant impact on the surfactant-SWCNT binding interface, the hydroxy group locations, seen in comparing DOC, SC, and CDOC, have dramatic effects on the surfactant-SWCNT structure, with differences in SC vs. DOC binding [28] and the impact on SWCNT sorting previously shown in the literature. Unlike SC and DOC, very little has been published on the interactions of CDOC with SWCNTs, with no structural insights previously presented in the literature. CDOC is a particularly interesting ligand to study, as its lack of the 12α hydroxy present in both SC and DOC, allows for evaluation of this functional group’s impact on SWCNT binding. Likewise, CDOC having a 7α hydroxy along with SC, allows for evaluation of this hydroxy group’s importance in SWCNT binding given its absence in DOC. It is important to note that all three bile salts likely adopt the previously reported binding orientation [49], with the hydrophobic face (the tetracyclic ring complex with methyl groups) wrapping around the SWCNTs and the hydrophilic face (hydroxy and carboxylate groups) towards aqueous solution. As such, it is expected that the presence or absence of a particular hydroxy group will likely have little impact on the surfactant-SWCNT interface but may be more likely to modulate SWCNT binding (and PCCCs) by altering surfactant-surfactant interactions. The broadness of the CDOC curves compared to the sharper curves of SC or DOC (and the conjugated tail DOC analogues, GDOC and TDOC), suggest the absence of the 12α hydroxy results in a surfactant packing structure where the CDOC layer is more gradually removed by the competing surfactant SDS. Likewise, the presence of the 7α hydroxy in both SC and CDOC (which is absent in DOC and its conjugated tail analogues) could explain the observed fluorescence emission wavelength modulations seen in their SDS titration curves, where the wavelengths first blue-shifted, then red-shifted with increasing SDS concentration. Both of these observations are perhaps indicative of the initial formation of a mixed micellar coating, as recently proposed by Yang et al. for the SC-SDS competition pair [17]. Additional experimental, such as analytical ultracentrifugation [25, 28], and simulation studies of these SWCNT-surfactant interactions, especially for CDOC, could prove useful in elucidating the observed optical behavior. Finally, it should be noted that the number of SWCNT species surveyed here is not sufficient to determine whether different bile salt variants could be more or less optimal for isolation of different groups of (n,m) species. Similarly, further research is necessary with respect to multiple bile salt mixtures and the potentially complex interactions in such systems. As previously mentioned, it is well-known that bile salt interactions with SWCNTs depend on several complicating factors, including diameter [52], electronic character, chiral angle, and handedness [40]; thus, it would not be unexpected that different bile salts (or combinations therein) would yield different outcomes for SWCNT species not tested in this contribution.
3.6. Implications for ATPE Method Development
The results above report PCCC variation as a function of solution conditions and surfactant choice for only a limited number of (n,m) species, albeit frequently targeted species, but still offer significant implications for optimizing ATPE separations. In addition to the earlier highlighted preference for high purity alkyl surfactants, these implications include utilizing increased DOC (or more broadly bile salt) concentrations when attempting high fidelity separations of, in particular, larger diameter SWCNT species. Explicitly the alkyl surfactant concentration necessary to reach the PCCC point will increase with the bile salt concentration, and spread, in absolute concentration phase space the difference between species to enable better separation fidelity. There are known limits to this strategy, however, in that nanotube colloidal stability has been found to decrease above certain absolute surfactant concentration values [3, 7].
Another significant result is the measured relative insensitivity of the PCCCs to the molecular mass of the PEG phase molecule. While large scale or automated ATPE separations [3, 33] are beyond the scale of this contribution, these separations should benefit from optimization of the polymer components that result in lower viscosity polymer phases, bulk compositions that require less total polymer for the desired phase separation, and that are robust to minor variation in the utilized polymers. The observed relative insensitivity implies that the polymer composition optimization can be engineered without fundamental changes to the expected (n,m) selectivity.
This data set is the first to report comparative values for the PCCC of given species for different bile salt variants. Within even this set, at a single temperature, differences in selectivity of enantiomers of (n,m) species can be observed. Optimization of separations for the end goal, whether for separate isolation of (n,m) and (m,n) enantiomers, or simultaneous extraction of both hands in one fraction for greatest mass efficiency when enantiomeric effects are unimportant, can now be considered. The sharpness of the observed fluorescence intensity transitions, and thus of the PCCC for separations, is also important. Sharper transitions in surfactant coating are preferable for separations as they enable greater discrimination and require fewer steps to isolate different species and enantiomers. Of the bile salts, the steep transitions observed for DOC and its appended tail conjugates (particularly TDOC) point to the greatest potential for single (n,m) and enantiomeric enriched isolations amongst the compared variants. Conversely, competition with AcS molecules that do not yield sharp transitions are less likely to provide adequate separations. Lastly, although the cost on a mass basis of DOC is currently less than some of the variant bile salts, it is possible that the near equally selective TDOC, or an as yet unexplored bile salt variant, could offer better global cost optimization by the reduction of necessary co-surfactant concentrations.
4. Conclusions
In conclusion, fluorescence detection of the adsorbed surfactant composition on the nanotube interface at solution conditions reflective of ATPE separation was used to provide the first broad and quantitative comparisons of surfactant chemistry and concentration effects on PCCCs without conducting actual separations. The reported data set provides strong constraints towards exact description of the underlying mechanism for ATPE separation, as well as guidance towards optimization of ATPE for individual (n,m) SWCNT species and their enantiomers. We also identify new complexity in the apparent transition of the surfactant layer near the PCCCs and differences in the behavior of the bile salt variants that are yet unexamined by molecular modelling for attribution to the bile salt structure. Future work is expected to report more complete data sets of PCCCs for fixed surfactant type combinations, expanding the reported values and implications established in this contribution to larger diameter SWCNT species.
Supplementary Material
Acknowledgement
This effort was funded through internal National Institute of Science and Technology funds.
Footnotes
Supplemental Information
The Supplemental Information contains additional spectroscopic characterization of the samples (2D excitation-emission fluorescence contour plots, circular dichroism signal plots), additional surfactant concentration vs. fluorescence intensity curves and contour plots, and data tables containing PCCCs as calculated from Heaviside fitting.
References
- [1].Albertsson P-Å, Partition of Cell Particles and Macromolecules in Polymer Two-Phase Systems, in: Anfinsen CB, Edsall JT, Richards FM (Eds.), Adv. Protein Chem, Academic Press; 1970, pp. 309–341. [DOI] [PubMed] [Google Scholar]
- [2].Zaslavsky BY, Aqueous Two-Phase Partitioning: Physical Chemistry and Bioanalytical Applications, Marcel Dekker, Inc, New York, Basel, Oxford, 1995. [Google Scholar]
- [3].Fagan JA, Aqueous two-polymer phase extraction of single-wall carbon nanotubes using surfactants, Nanoscale Adv. 1(9) (2019) 3307–3324. [DOI] [PMC free article] [PubMed] [Google Scholar]
- [4].Yang F, Wang M, Zhang D, Yang J, Zheng M, Li Y, Chirality Pure Carbon Nanotubes: Growth, Sorting, and Characterization, Chem. Rev. 120(5) (2020) 2693–2758. [DOI] [PubMed] [Google Scholar]
- [5].Wang P, Barnes B, Huang Z, Wang Z, Zheng M, Wang Y, Beyond Color: The New Carbon Ink, Adv. Mater. 33(46) (2021) e2005890. [DOI] [PMC free article] [PubMed] [Google Scholar]
- [6].Khripin CY, Fagan JA, Zheng M, Spontaneous partition of carbon nanotubes in polymer-modified aqueous phases, J. Am. Chem. Soc. 135(18) (2013) 6822–5. [DOI] [PubMed] [Google Scholar]
- [7].Fagan JA, Khripin CY, Silvera Batista CA, Simpson JR, Haroz EH, Hight Walker AR, Zheng M, Isolation of specific small-diameter single-wall carbon nanotube species via aqueous two-phase extraction, Adv. Mater. 26(18) (2014) 2800–4. [DOI] [PubMed] [Google Scholar]
- [8].Subbaiyan NK, Parra-Vasquez ANG, Cambre S, Cordoba MAS, Yalcin SE, Hamilton CE, Mack NH, Blackburn JL, Doorn SK, Duque JG, Bench-top aqueous two-phase extraction of isolated individual single-walled carbon nanotubes, Nano Res. 8(5) (2015) 1755–1769. [Google Scholar]
- [9].Fagan JA, Haroz EH, Ihly R, Gui H, Blackburn JL, Simpson JR, Lam S, Hight Walker AR, Doorn SK, Zheng M, Isolation of >1 nm Diameter Single-Wall Carbon Nanotube Species Using Aqueous Two-Phase Extraction, ACS Nano 9(5) (2015) 5377–90. [DOI] [PubMed] [Google Scholar]
- [10].Li H, Gordeev G, Garrity O, Peyyety NA, Selvasundaram PB, Dehm S, Krupke R, Cambre S, Wenseleers W, Reich S, Zheng M, Fagan JA, Flavel BS, Separation of Specific Single-Enantiomer Single-Wall Carbon Nanotubes in the Large-Diameter Regime, ACS Nano 14(1) (2020) 948–963. [DOI] [PMC free article] [PubMed] [Google Scholar]
- [11].Arnold MS, Green AA, Hulvat JF, Stupp SI, Hersam MC, Sorting carbon nanotubes by electronic structure using density differentiation, Nat. Nanotechnol. 1(1) (2006) 60–5. [DOI] [PubMed] [Google Scholar]
- [12].Ghosh S, Bachilo SM, Weisman RB, Advanced sorting of single-walled carbon nanotubes by nonlinear density-gradient ultracentrifugation, Nat. Nanotechnol. 5(6) (2010) 443–50. [DOI] [PubMed] [Google Scholar]
- [13].Liu H, Nishide D, Tanaka T, Kataura H, Large-scale single-chirality separation of single-wall carbon nanotubes by simple gel chromatography, Nat. Commun. 2(1) (2011) 309. [DOI] [PMC free article] [PubMed] [Google Scholar]
- [14].Zeng X, Yang DH, Liu HP, Zhou NG, Wang YC, Zhou WY, Xie SS, Kataura H, Detecting and Tuning the Interactions between Surfactants and Carbon Nanotubes for Their High-Efficiency Structure Separation, Adv. Mater. Interfaces 5(2) (2018) 1700727. [Google Scholar]
- [15].Wei XJ, Tanaka T, Hirakawa T, Tsuzuki M, Wang GW, Yomogida Y, Hirano A, Kataura H, High-yield and high-throughput single-chirality enantiomer separation of single-wall carbon nanotubes, Carbon 132 (2018) 1–7. [Google Scholar]
- [16].Yomogida Y, Tanaka T, Tsuzuki M, Wei XJ, Kataura H, Automatic Sorting of Single-Chirality Single-Wall Carbon Nanotubes Using Hydrophobic Cholates: Implications for Multicolor Near-Infrared Optical Technologies, ACS Applied Nano Materials 3(11) (2020) 11289–11297. [Google Scholar]
- [17].Yang D, Li L, Wei X, Wang Y, Zhou W, Kataura H, Xie S, Liu H, Submilligram-scale separation of near-zigzag single-chirality carbon nanotubes by temperature controlling a binary surfactant system, Sci. Adv. 7(8) (2021) eabe0084. [DOI] [PMC free article] [PubMed] [Google Scholar]
- [18].Defillet J, Martinati M, Wenseleers W, Cambré S, Systematic Aqueous Two-Phase Separations of Carbon Nanotubes to Investigate the Separation Mechanism, ECS Meeting Abstracts, The Electrochemical Society, Seattle, WA, 2018. [Google Scholar]
- [19].Podlesny B, Olszewska B, Yaari Z, Jena PV, Ghahramani G, Feiner R, Heller DA, Janas D, En route to single-step, two-phase purification of carbon nanotubes facilitated by high-throughput spectroscopy, Sci. Rep. 11(1) (2021) 10618. [DOI] [PMC free article] [PubMed] [Google Scholar]
- [20].Subbaiyan NK, Cambre S, Parra-Vasquez AN, Haroz EH, Doorn SK, Duque JG, Role of surfactants and salt in aqueous two-phase separation of carbon nanotubes toward simple chirality isolation, ACS Nano 8(2) (2014) 1619–28. [DOI] [PubMed] [Google Scholar]
- [21].Li H, Gordeev G, Garrity O, Reich S, Flavel BS, Separation of Small-Diameter Single-Walled Carbon Nanotubes in One to Three Steps with Aqueous Two-Phase Extraction, ACS Nano 13(2) (2019) 2567–2578. [DOI] [PubMed] [Google Scholar]
- [22].Podlesny B, Shiraki T, Janas D, One-step sorting of single-walled carbon nanotubes using aqueous two-phase extraction in the presence of basic salts, Sci. Rep. 10(1) (2020) 9250. [DOI] [PMC free article] [PubMed] [Google Scholar]
- [23].Sims CM, Fagan JA, Near -infrared fluorescence as a method for determining single -wall carbon nanotube extraction conditions in aqueous two polymer phase extraction, Carbon 165 (2020) 196–203. [Google Scholar]
- [24].Wenseleers W, Vlasov II, Goovaerts E, Obraztsova ED, Lobach AS, Bouwen A, Efficient isolation and solubilization of pristine single-walled nanotubes in bile salt micelles, Adv. Funct. Mater. 14(11) (2004) 1105–1112. [Google Scholar]
- [25].Lam S, Zheng M, Fagan JA, Characterizing the Effect of Salt and Surfactant Concentration on the Counterion Atmosphere around Surfactant Stabilized SWCNTs Using Analytical Ultracentrifugation, Langmuir 32(16) (2016) 3926–36. [DOI] [PubMed] [Google Scholar]
- [26].Fagan JA, Becker ML, Chun J, Nie P, Bauer BJ, Simpson JR, Hight-Walker A, Hobbie EK, Centrifugal length separation of carbon nanotubes, Langmuir 24(24) (2008) 13880–9. [DOI] [PubMed] [Google Scholar]
- [27].Agrawal KV, Shimizu S, Drahushuk LW, Kilcoyne D, Strano MS, Observation of extreme phase transition temperatures of water confined inside isolated carbon nanotubes, Nat. Nanotechnol. 12(3) (2017) 267–273. [DOI] [PubMed] [Google Scholar]
- [28].Fagan JA, Zheng M, Rastogi V, Simpson JR, Khripin CY, Silvera Batista CA, Hight Walker AR, Analyzing surfactant structures on length and chirality resolved (6,5) single-wall carbon nanotubes by analytical ultracentrifugation, ACS Nano 7(4) (2013) 3373–87. [DOI] [PubMed] [Google Scholar]
- [29].Batista CA, Zheng M, Khripin CY, Tu X, Fagan JA, Rod hydrodynamics and length distributions of single-wall carbon nanotubes using analytical ultracentrifugation, Langmuir 30(17) (2014) 4895–904. [DOI] [PubMed] [Google Scholar]
- [30].Zheng Y, Sanchez SR, Bachilo SM, Weisman RB, Indexing the Quality of Single-Wall Carbon Nanotube Dispersions Using Absorption Spectra, J. Phys. Chem. C 122(8) (2018) 4681–4690. [Google Scholar]
- [31].Weisman RB, Bachilo SM, Dependence of optical transition energies on structure for single-walled carbon nanotubes in aqueous suspension: An empirical Kataura plot, Nano Lett. 3(9) (2003) 1235–1238. [Google Scholar]
- [32].Streit JK, Bachilo SM, Ghosh S, Lin CW, Weisman RB, Directly measured optical absorption cross sections for structure-selected single-walled carbon nanotubes, Nano Lett. 14(3) (2014) 1530–6. [DOI] [PubMed] [Google Scholar]
- [33].Zhang M, Khripin CY, Fagan JA, McPhie P, Ito Y, Zheng M, Single-step total fractionation of single-wall carbon nanotubes by countercurrent chromatography, Anal. Chem. 86(8) (2014) 3980–4. [DOI] [PMC free article] [PubMed] [Google Scholar]
- [34].Blanch AJ, Shapter JG, Surfactant concentration dependent spectral effects of oxygen and depletion interactions in sodium dodecyl sulfate dispersions of carbon nanotubes, J Phys Chem B 118(23) (2014) 6288–96. [DOI] [PubMed] [Google Scholar]
- [35].Gui H, Streit JK, Fagan JA, Hight Walker AR, Zhou C, Zheng M, Redox sorting of carbon nanotubes, Nano Lett. 15(3) (2015) 1642–6. [DOI] [PubMed] [Google Scholar]
- [36].Zhao Y, Clar JG, Li L, Xu J, Yuan T, Bonzongo JC, Ziegler KJ, Selective desorption of high-purity (6,5) SWCNTs from hydrogels through surfactant modulation, Chem. Commun. 52(14) (2016) 2928–31. [DOI] [PubMed] [Google Scholar]
- [37].Ju SY, Doll J, Sharma I, Papadimitrakopoulos F, Selection of carbon nanotubes with specific chiralities using helical assemblies of flavin mononucleotide, Nat. Nanotechnol. 3(6) (2008) 356–62. [DOI] [PubMed] [Google Scholar]
- [38].Oh H, Sim J, Ju SY, Binding affinities and thermodynamics of noncovalent functionalization of carbon nanotubes with surfactants, Langmuir 29(35) (2013) 11154–62. [DOI] [PubMed] [Google Scholar]
- [39].Park M, Park J, Lee J, Ju SY, Scaling of binding affinities and cooperativities of surfactants on carbon nanotubes, Carbon 139 (2018) 427–436. [Google Scholar]
- [40].Janas D, Towards monochiral carbon nanotubes: a review of progress in the sorting of single-walled carbon nanotubes, Materials Chemistry Frontiers 2(1) (2018) 36–63. [Google Scholar]
- [41].Fernandes RM, Abreu B, Claro B, Buzaglo M, Regev O, Furo I, Marques EF, Dispersing Carbon Nanotubes with Ionic Surfactants under Controlled Conditions: Comparisons and Insight, Langmuir 31(40) (2015) 10955–65. [DOI] [PubMed] [Google Scholar]
- [42].Silvera-Batista CA, Weinberg P, Butler JE, Ziegler KJ, Long-term improvements to photoluminescence and dispersion stability by flowing SDS-SWNT suspensions through microfluidic channels, J. Am. Chem. Soc. 131(35) (2009) 12721–8. [DOI] [PubMed] [Google Scholar]
- [43].Duque JG, Densmore CG, Doorn SK, Saturation of Surfactant Structure at the Single-Walled Carbon Nanotube Surface, Journal of the American Chemical Society 132(45) (2010) 16165–16175. [DOI] [PubMed] [Google Scholar]
- [44].Hirano A, Kameda T, Yomogida Y, Wada M, Tanaka T, Kataura H, Origin of the Surfactant-Dependent Redox Chemistry of Single-Wall Carbon Nanotubes, ChemNanoMat 2(9) (2016) 911–920. [Google Scholar]
- [45].Suttipong M, Tummala NR, Kitiyanan B, Striolo A, Role of Surfactant Molecular Structure on Self-Assembly: Aqueous SDBS on Carbon Nanotubes, J. Phys. Chem. C 115(35) (2011) 17286–17296. [Google Scholar]
- [46].Jain RM, Ben-Naim M, Landry MP, Strano MS, Competitive Binding in Mixed Surfactant Systems for Single-Walled Carbon Nanotube Separation, J. Phys. Chem. C 119(39) (2015) 22737–22745. [Google Scholar]
- [47].Yomogida Y, Tanaka T, Zhang M, Yudasaka M, Wei X, Kataura H, Industrial-scale separation of high-purity single-chirality single-wall carbon nanotubes for biological imaging, Nat. Commun. 7(1) (2016) 12056. [DOI] [PMC free article] [PubMed] [Google Scholar]
- [48].Heuman DM, Quantitative estimation of the hydrophilic-hydrophobic balance of mixed bile salt solutions, J. Lipid Res. 30(5) (1989) 719–30. [PubMed] [Google Scholar]
- [49].Lin S, Blankschtein D, Role of the bile salt surfactant sodium cholate in enhancing the aqueous dispersion stability of single-walled carbon nanotubes: a molecular dynamics simulation study, J Phys Chem B 114(47) (2010) 15616–25. [DOI] [PubMed] [Google Scholar]
- [50].Ju SY, Abanulo DC, Badalucco CA, Gascon JA, Papadimitrakopoulos F, Handedness enantioselection of carbon nanotubes using helical assemblies of flavin mononucleotide, J. Am. Chem. Soc. 134(32) (2012) 13196–9. [DOI] [PMC free article] [PubMed] [Google Scholar]
- [51].Sim J, Kim S, Jang M, Park M, Oh H, Ju SY, Determination of the Absolute Enantiomeric Excess of the Carbon Nanotube Ensemble by Symmetry Breaking Using the Optical Titration Method, Langmuir 33(41) (2017) 11000–11009. [DOI] [PubMed] [Google Scholar]
- [52].Cambre S, Muyshondt P, Federicci R, Wenseleers W, Chirality-dependent densities of carbon nanotubes by in situ 2D fluorescence-excitation and Raman characterisation in a density gradient after ultracentrifugation, Nanoscale 7(47) (2015) 20015–24. [DOI] [PubMed] [Google Scholar]
Associated Data
This section collects any data citations, data availability statements, or supplementary materials included in this article.