

SUMMARY
Obesity induces chronic inflammation resulting in insulin resistance and metabolic disorders. Cold exposure can improve insulin sensitivity in humans and rodents, but the mechanisms have not been fully elucidated. Here, we find that cold resolves obesity-induced inflammation and insulin resistance and improves glucose tolerance in diet-induced obese mice. The beneficial effects of cold exposure on improving obesity-induced inflammation and insulin resistance depend on brown adipose tissue (BAT) and liver. Using targeted LC-MS/MS, we discovered that cold and β3-adrenergic stimulation promote BAT to produce Maresin 2 (MaR2), a member of the specialized pro-resolving mediators of bioactive lipids that play a role in the resolution of inflammation. Importantly, MaR2 reduces inflammation in obesity in part by targeting macrophages in the liver. Thus, BAT-derived MaR2 could contribute to the beneficial effects of BAT activation in resolving obesity-induced inflammation and may inform therapeutic approaches to combat obesity and its complications.
Keywords: specialized pro-resolving mediators, Maresin, cold exposure, brown adipose tissue, obesity, inflammation, insulin resistance, glucose tolerance, steatohepatitis
INTRODUCTION
Obesity and related metabolic disorders such as diabetes, cardiovascular disease, nonalcoholic fatty liver disease (NAFLD), nonalcoholic steatohepatitis (NASH), and cancer, are major health concerns worldwide1. As obesity progresses, immune cells, including macrophages, neutrophils, and lymphocytes accumulate in insulin-sensitive tissues and perturb insulin signaling2,3. These immune cells secrete pro-inflammatory cytokines such as tumor necrosis factor-alpha (TNFα) and interleukin 1 beta (IL1β), leading to low-grade chronic inflammation and resulting in insulin resistance which is a hallmark feature of metabolic disorders4,5.
Resolution of inflammation is an active process mediated in part by lipid autacoids termed specialized pro-resolving mediators (SPM)6. SPM act as agonists to dampen inflammatory signaling, stimulate the transition from inflammation to tissue repair, and enhance host-defense7,8. Accumulating evidence indicates that obesity-induced chronic inflammation is associated with defective resolution and impaired SPM biosynthesis9,10. Notably, some SPM and their structural analogs are in clinical development for the treatment of inflammatory diseases11. Maresins are SPM that were identified in self-resolving inflammatory exudates12. They are biosynthesized from docosahexaenoic acid (DHA) via 12-lipoxygenase (12-LOX)-dependent production of a 14-hydroperoxide intermediate that can be reduced to 14-hydroxydocosahexaenoic acid (14-HDHA) or undergo enzymatic epoxidation to form 13S, 14S-epoxy maresin13. This epoxide subsequently undergoes enzymatic hydrolysis to form maresin 1 (MaR1, 7R, 14S-dihydroxy DHA) or maresin 2 (MaR2, 13R, 14S-dihydroxy DHA), with the latter being dependent on soluble epoxide hydrolase (sEH)14. In contrast to MaR1 in which extensive studies have documented its receptor-dependent roles in resolving inflammation12,15–18, little is known about the biological roles of MaR214.
Cold exposure improves insulin sensitivity in humans, though the mechanisms have not been fully elucidated19,20. Upon activation by cold challenge or β3-adrenergic receptor (β3-AR) stimulation, brown adipose tissue (BAT) and its related beige/brite fat consume nutrients and dissipate the chemical energy into heat production. In cold-acclimatized mice, BAT utilizes a large quantity of ingested lipids and glucose21. In humans, mild cold exposure increases energy expenditure and may facilitate weight loss22–24. Recently, a large retrospective study reported that people with detectable BAT had significantly lower prevalence of cardiometabolic diseases25. Although BAT has been traditionally recognized for its energy-consuming function, it also exerts beneficial effects via secretion of signaling molecules to modulate systemic metabolism26,27. Cold exposure is well established to enhance BAT activity. We previously identified that cold facilitates the secretion of lipid mediators from BAT, namely 12,13-dihydroxy-octadecaenoic acid (12,13-diHOME) and 12-hydroxy-eicosapentaenoic acid (12-HEPE), that regulate lipid and glucose metabolism28,29. While the role of BAT in regulating systemic metabolism is well-established, whether BAT activation plays a role in resolving systemic inflammation in obesity is largely unknown.
In this study, we discovered that cold exposure and β3-AR stimulation reduce inflammation and improve metabolism in obesity. This is mediated, at least in part, by activation of BAT to selectively initiate the maresin biosynthetic pathway. We found that MaR2 resolves inflammation systemically and in the liver. These findings suggest a previously unrecognized function of BAT in promoting the resolution of inflammation in obesity via production of MaR2, which may mediate a BAT-liver crosstalk.
RESULTS
Cold reduces inflammation and insulin resistance in obesity
To determine whether cold exposure could exert beneficial effects on metabolic abnormalities and inflammation in obesity, diet-induced obese (DIO) mice were housed in thermoneutrality (30°C, TN) or cold (5°C) for 7 days. DIO mice were created by a high-fat diet (HF diet, 60% kilocalories from fat) feeding for 14 weeks. Mice fed normal chow (NC) were used as controls to observe the degree of metabolic abnormalities and inflammation induced by HF feeding. Cold exposure significantly reduced body weight in both NC and HF-fed male mice despite increasing food intake (Fig. 1a,b). The changes in body weight were mainly caused by reduction in adipose and liver masses, whereas muscle weight was not altered (Fig. 1c). HF diet increased fasting glucose and insulin levels in circulation, leading to insulin resistance (as measured by HOMA-IR) and glucose intolerance. These abnormalities were markedly ameliorated by cold exposure to the same levels as those in NC-fed mice (Fig. 1d,e).
Fig. 1: Cold exposure reduces inflammation and insulin resistance and improves glucose tolerance in diet-induced obese (DIO) mice.
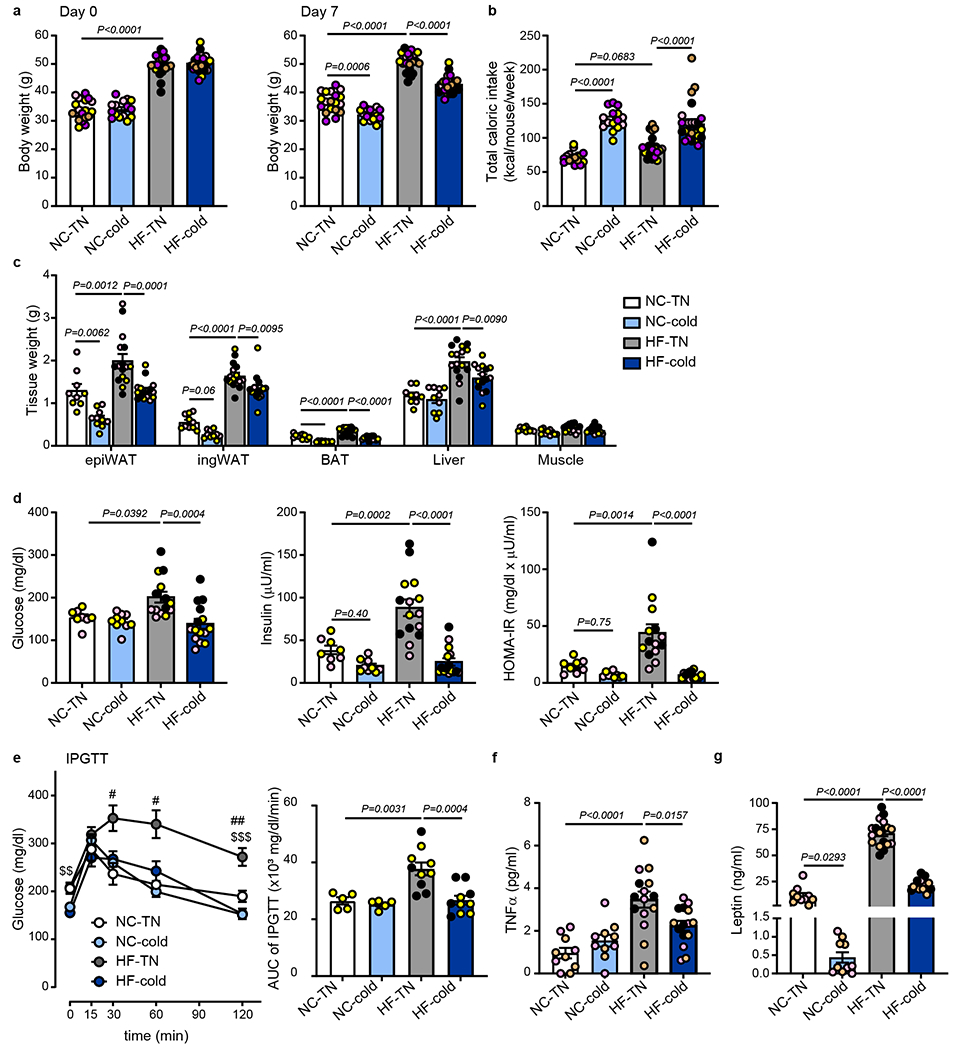
C57BL6/J male mice were fed with normal chow (NC) or high fat (HF) diet at room temperature for 14 weeks. The mice were then put in thermoneutral temperature (30°C, TN) or cold (5°C) for 7 days. (a) Body weight at day 0 and at day 7 following TN or cold exposure (n=19 biologically independent animals for NC-TN, n=15 for NC-cold and n=23 for HF-TN and HF-cold, from 5 independent experiments). (b) Total caloric intake for 7 days during the exposure period (n=18 biologically independent animals for NC-TN, n=15 for NC-cold, n=23 for HF-TN, n=24 for HF-cold, from 5 independent experiments). (c) Tissue weight at day 7 following TN or cold exposure (epiWAT, Liver: n=9 biologically independent animals for NC-TN, n=10 for NC-cold, n=16 for HF-TN, n=15 for HF-cold; ingWAT, BAT, Muscle: n=10 for NC-TN and NC-cold, n=16 for HF-TN, n=15 for HF-cold, from 3 different experiments). (d) Fasting blood glucose, plasma insulin, and homeostatic model assessment of insulin resistance (HOMA-IR) at day 7 following TN or cold exposure (Glucose: n=8 biologically independent animals for NC-TN, n=10 for NC-cold, n=14 for HF-TN, n=15 for HF-cold; Insulin: n=8 for NC-TN, n=9 for NC-cold, n=15 for HF-TN, HF-cold; HOMA-IR: n=8 for NC-TN, n=9 for NC-cold, n=14 for HF-TN, HF-cold, from 3 independent experiments). (e) Glucose levels during IPGTT at day 5 following TN or cold exposure (n=5 biologically independent animals for NC-TN and NC-cold, n=10 for HF-TN and HF-cold, #p<0.05, from 2 independent experiments, ##p<0.01 vs NC-TN, $$p<0.01, $$$p<0.001 vs HF-cold, Two-Way ANOVA followed by a Tukey’s post-hoc). Area under the curve (AUC) of IPGTT shown in the right panel. (f) Plasma TNFα levels at day 7 following TN or cold exposure (n=10 biologically independent animals for NC-TN and NC-cold, n=15 for HF-TN and HF-cold, from 3 independent experiments). (g) Plasma leptin levels at day 7 following TN or cold exposure (n=10 biologically independent animals for NC-TN and NC-cold, n=18 for HF-TN, n=15 HF-cold, from 3 independent experiments). One-Way ANOVA followed by a Tukey’s post-hoc test, except panel e. Different colors of circles represent mice from different study cohorts.
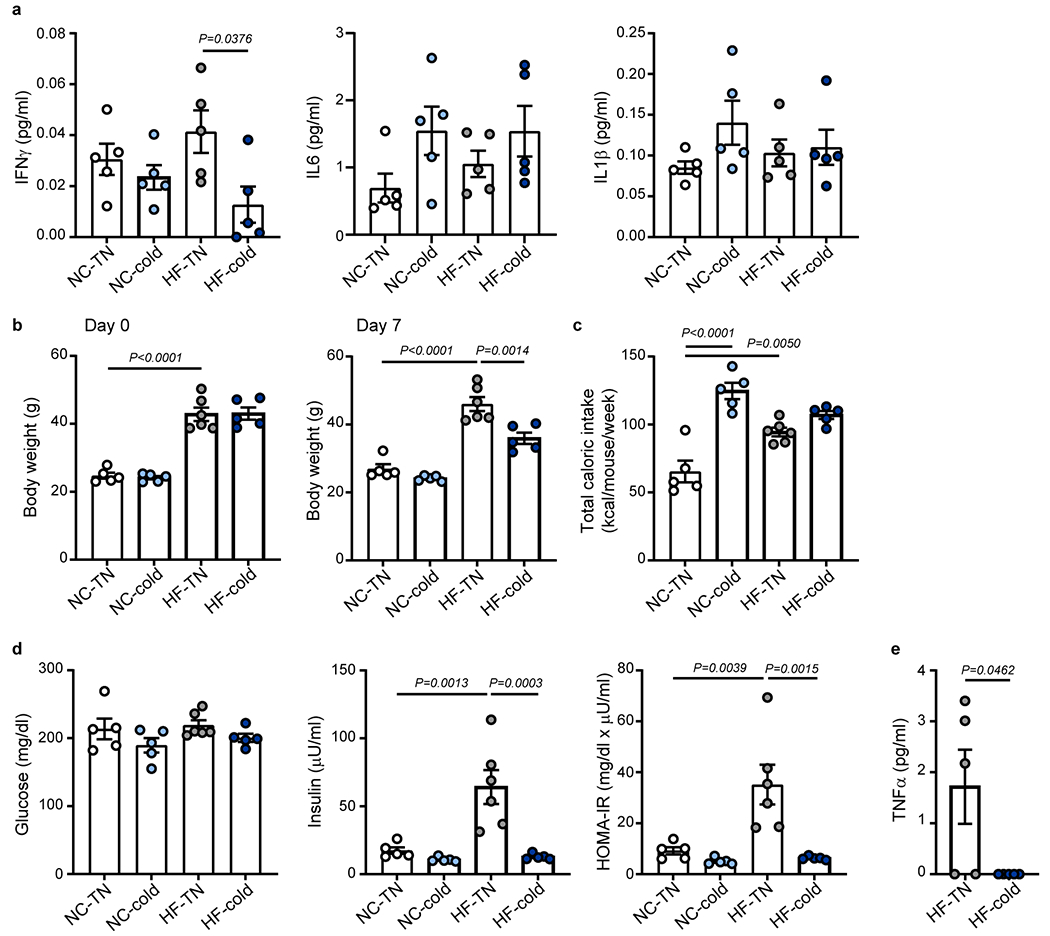
TNFα is a major proinflammatory cytokine that impairs insulin signaling and promotes insulin resistance2,30. Circulating TNFα levels positively correlate with insulin resistance31–33. Consistent with obesity-associated insulin resistance (Fig. 1d), HF diet increased circulating TNFα levels, which were significantly reduced by cold exposure (Fig. 1f). Patients with insulin resistance show higher circulating leptin levels34,35, and leptin exerts pro-inflammatory effects36,37. Similar to TNFα, the HF-induced elevation of leptin levels was completely normalized by cold exposure (Fig. 1g). In contrast, the HF diet did not significantly increase plasma levels of interferon γ, interleukin 6 (IL6), or IL1β (Extended Data Fig. 1a). The effects of cold exposure on reversing HF-induced body weight gain, insulin resistance, and production of TNFα were also observed in female mice (Extended Data Fig. 1b–e).
To examine whether the effects of the 7-day cold exposure on insulin resistance, glucose tolerance, and inflammation depend on body-weight reduction, we performed a shorter duration of cold exposure on DIO male mice. Though the 2-day cold exposure did not significantly alter body weight nor the weight of white adipose tissue (WAT) and liver (Extended Data Fig. 2a–c), it was sufficient to reduce HF diet-induced insulin resistance and elevation of circulating TNFα and leptin levels (Extended Data Fig. 2d–f), suggesting that the cold-induced improvements of insulin resistance and inflammation precede bodyweight reduction.
β3-AR stimulation is the principal modulator of cold-induced BAT activation in rodents38. CL316243 is a selective β3-AR agonist and can activate BAT thermogenesis, induce browning of WAT, and improve insulin sensitivity39,40. We found that treatment of DIO mice with CL316243 (1mg/kg/day) for 9 days led to significant improvement in glucose tolerance and reduced plasma TNFα levels without affecting body weight and food intake (Extended Data Fig. 2g–k). These results reinforce the notion that activation of adipose β3-AR by cold exposure improves glucose metabolism and obesity-induced inflammation, which is independent of bodyweight reduction.
Cold resolves obesity-induced inflammation in BAT and liver
Obesity evokes chronic inflammation in multiple tissues and impairs insulin signaling, leading to systemic insulin resistance2,3. In addition to inducing the expression of pro-inflammatory cytokines, obesity triggers the activation of the NLRP3 inflammasome, which worsens obesity-induced inflammation and insulin resistance41. We sought to identify the specific tissue(s) that are associated with cold-induced reduction of inflammation in obesity. Consistent with previous reports2,42, 14 weeks of HF diet led to profound inflammation in adipose tissue and the liver (Fig. 2 and Extended Data Fig. 3). Inflammation in visceral WAT is a major contributor to systemic insulin resistance. As expected, HF diet led to increased expression of genes associated with inflammation and macrophage accumulation including Adgre1 (F4/80), Ccl2, Ccr2, Itgax (CD11c), Tnfα and Il1β (Fig. 2 and Extended Data Fig. 3)43,44. Surprisingly, cold exposure generally did not significantly alter the expression of pro-inflammatory and NLRP3 inflammasome-related genes in epididymal WAT (epiWAT) and inguinal WAT (ingWAT) of HF-fed mice at this time point (Fig. 2a and Extended Data Fig. 3a). Cold also did not alter the number of crown-like structures in the epiWAT of DIO mice (Extended Data Fig. 3b,c). As obesity progresses, CD11c+ macrophages that accumulate in WAT contribute to the production of inflammatory cytokines such as TNFα and IL1β that promote insulin resistance45. Using flow cytometry, we found that HF diet increased the ratio of CD45+F4/80+CD11c+ to CD45+F4/80+CD206+ macrophages, with the former being the predominant population in WAT (Fig. 2b and Extended Data Fig. 3d,e). Notably, cold exposure did not alter this ratio in epiWAT or ingWAT of DIO mice. These data suggest that the improvement of systemic inflammation by cold exposure in DIO mice was likely not mediated by altering inflammation in WAT. In contrast, exposure to cold significantly reduced the expression of genes associated with macrophage accumulation and inflammatory signals that were increased by HF, such as Adgre1 (F4/80), Ccl2, Ccr2, and Itgax (CD11c), as well as NLRP3 inflammasome related genes Nlrp3, Casp1, and Il18, in both BAT and liver (Fig. 2c and 2e). Moreover, cold significantly reduced the ratio of CD11c+ to CD206+ macrophages in both BAT and liver (Fig. 2d and 2f and Extended Data Fig. 3e, f).
Fig. 2: Cold resolves obesity-induced inflammation in BAT and liver of DIO mice.

C57BL6/J male mice were fed with normal chow (NC) or high fat (HF) diet at room temperature for 14 weeks. The mice were then put in thermoneutral temperature (30°C, TN) or cold (5°C) for 7 days. (a, c, and e) Relative expression of mRNA in pro-inflammatory and NLRP3 inflammasome-related genes in epididymal white fat (epiWAT) (n= 5 biologically independent animals per group, except n=4 for Il6 and Il1b HF-cold, from 1 independent experiment; a), BAT (n= 5 biologically independent animals per group, from 1 independent experiment, c), and liver (n= 5 biologically independent animals per group, from 1 independent experiment, e). (b and d) Ratio of CD11c+/CD206+ cells within the CD45+ F4/80+ population, as determined by flow cytometry analysis in epiWAT (n=5 biologically independent animals for NC-TN, n=8 for HF-TN and HF-cold, from 2 independent experiments, b) and BAT (n=5 biologically independent animals for NC-TN, n=6 for HF-TN, n=7 for HF-cold, from 2 independent experiments, d). (f) Ratio of CD11c+/CD206+ cells within the CD45+ F4/80+ CD11blow population as determined by flow cytometry analysis in the liver (n=7 biologically independent animals for NC-TN and HF-TN, n=6 for HF-cold, from 2 independent experiments). (g) Relative mRNA expression of toll-like receptors (Tlr) and Tgfb1 in the liver. (n= 5 biologically independent animals for NC-TN, NC-cold, from 1 independent experiment). (h) Plasma levels of ALT. (n=6 biologically independent animals for NC-TN, n=5 for NC-cold, n=12 for HF-TN, n=13 for HF-cold, from 3 independent experiments). One-Way ANOVA followed by a Tukey’s post-hoc test. Data are presented as mean ± SEM.
Activation of toll-like receptor (TLR) and transforming growth factor (TGF) β1 signaling in the liver plays an important role in the progression of hepatic fibrosis42,46,47. We found that cold exposure significantly reduced Tlr2 and Tgfb1 gene expression in the liver of DIO mice (Fig. 2g). Elevated levels of circulating alanine aminotransferase (ALT) indicate hepatocellular damage due to inflammation or other liver diseases48. The DIO mice exhibited high circulating ALT levels, which were significantly decreased by cold exposure (Fig. 2h). Increased de novo lipogenesis can trigger inflammation and fibrosis in the liver49, therefore, we examined whether cold exposure affects hepatic lipid metabolism. Exposure to cold for 7 days reduced the expression of several lipogenic genes, such as Srebf1, Chrebpa, Gck, Scd1, and Pparg, in lean and obese mice (Extended Data Fig. 4a). It also significantly reduced hepatic TG levels and partially decreased steatosis in DIO mice (Extended Data Fig. 4b,c). Shorter-term cold exposure (i.e., 2 days) also reduced the expression levels of lipogenic genes but did not alter hepatic TG levels and lipid accumulation (Extended Data Fig. 4d–f), suggesting that 2 days of cold exposure was not sufficient to reverse fatty liver. However, the expression of some pro-inflammatory and NLRP3 inflammasome-related genes in the liver was reduced by 2 days of cold challenge (Extended Data Fig. 4g). Together, these data indicate that reducing liver inflammation by cold likely precedes subsequent changes in hepatic lipid accumulation.
Cold increases DHA-derived MaR2 and isomers in BAT and liver
Because cold exposure reduced obesity-induced inflammation in mice, we questioned whether activation of BAT regulates the production of mediators that resolve inflammation. Maresins are SPM that actively resolve inflammation in a non-immunosuppressive manner13. They are biosynthesized via 12-LOX, which generates a 14-hydroperoxide intermediate that undergoes epoxidation to form 13S, 14S-epoxy maresin (Fig. 3a)12,13. Hydrolysis of this intermediate by sEH generates MaR2. We previously found that expression of Alox12 (the gene encoding 12-LOX) and Ephx2 (the gene encoding sEH) was significantly elevated in cold-activated BAT28,29, leading to an increase in the production of 14-HDHA, a maresin pathway marker14. Thus, we examined whether maresin biosynthesis was impacted by cold exposure in BAT. Using targeted LC-MS/MS, we identified 14-HDHA and MaR2 and found that cold exposure increased their levels in BAT of DIO mice when normalized to tissue weight (Fig. 3b and Extended Data Fig. 5a). Multiple reaction monitoring (MRM) chromatograms (m/z 359>221) and MS/MS spectra of synthetic MaR2 standard (blue) and MaR2 (red) identified in a selected sample of BAT are shown in Extended Data Fig. 5a, demonstrating matching of retention time and the presence of similar diagnostic ions as compared with the MaR2 standard14. Similar trends were observed when their levels were normalized to the protein content of BAT (Extended Data Fig. 5b). Both 14-HDHA and MaR2 were also identified in BAT of mice fed NC and their levels tended to increase with cold exposure, although these changes were not statistically significant (Extended Data Fig. 5c). In addition, we noted the presence of a peak eluting at a retention time later (~0.3 min) than MaR2 that had an MS/MS spectrum that was similar to MaR2, indicating that it was likely a stereoisomer. Consistent with this possibility, prior studies demonstrated that human macrophages produce MaR2 as well as an isomer that elutes after MaR214. Quantification of this isomer indicated that it also increased significantly with cold exposure in BAT of DIO mice (Fig. 3b and Extended Data Fig. 5b, c). We denote this product as MaR2 isomer II because we later identified an additional isomer that elutes before this product (see below). Of note, MaR1 was not quantifiable in BAT under these conditions due to a lack of separation from adjacent peaks.
Fig. 3: Cold increases DHA-derived MaR2 and related structural isomers in BAT and liver of DIO mice.
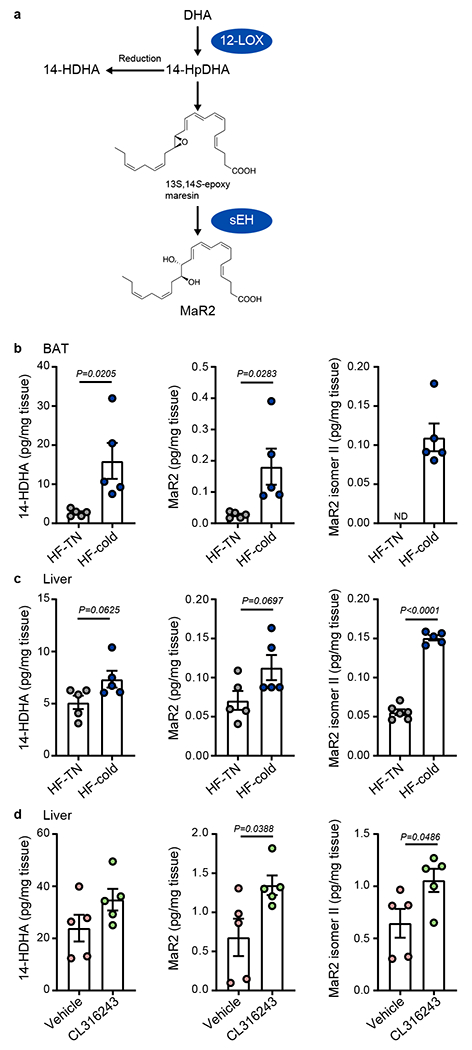
(a) Schematic of the Maresin 2 (MaR2) biosynthetic pathway including key enzymes (12-lipoxygenase, 12-LOX; and soluble Epoxide Hydrolase; sEH) and biosynthetic intermediates, 14-hydroperoxydocosahexaenoic acid (14-HpDHA) and 13S, 14S-epoxy maresin. Reduction of 14-HpDHA to 14-hydroxydocosahexaenoic acid (14-HDHA) is indicated and this product serves as a biosynthetic marker of the maresin pathway. (b, c) Quantification of 14-HDHA, MaR2, and MaR2 Isomer II in BAT (n=5 biologically independent animals per group, from 1 independent experiment, b) and liver (14HDHA and MaR2; n=5 biologically independent animals per group; MaR2 isomer II: n=6 per group, from 1 independent experiment, c) of 14 weeks HF-fed male C57BL6/J mice exposed to cold (5°C) or thermoneutral temperature (30°C, TN) for 7 days. (d) Quantification of 14-HDHA, MaR2, and MaR2 Isomer II in liver of 15 weeks HF-fed male C57BL6/J mice treated with vehicle control or CL316243 (1 mg/kg/day, i.p.) for 9 days (n=5 biologically independent animals per group, from 1 independent experiment). Two-tailed Unpaired Student’s t tests. Data are presented as mean ± SEM.
Because we found that cold exposure reduced inflammation in the liver of obese mice, we next quantified the products of the maresin pathway in the liver. Similar to BAT, we identified 14-HDHA, MaR2, and MaR2 isomer II in the liver of obese mice, and their levels increased with cold exposure, especially when normalized to the protein content (Fig. 3c and Extended Data Fig. 5d,e). Similar patterns were observed in the liver of mice fed NC and exposed to cold (Extended Data Fig. 5f). Of note, MaR1 was below the limit of quantification in the liver under these conditions. In addition, treatment of obese mice with β3-AR agonist CL316243 significantly increased MaR2 and MaR2 isomer II (Fig. 3d) in the liver of DIO mice. These changes persisted when normalized to the protein content of the liver (Extended Data Fig. 5g). As above, MaR1 was not identified in the liver under these conditions. Collectively, these results demonstrate that cold exposure increases products of the MaR2 pathway in BAT and the liver in obese mice.
Cold increases 12-LOX and sEH expression in BAT not in liver
Next, we investigated the effect of cold exposure on the expression of 12-LOX and sEH in BAT and the liver. Consistent with the previous report28, we found that cold increased the levels of Alox12 mRNA in BAT of DIO mice compared with BAT from mice housed at TN (Fig. 4a). In contrast, cold exposure did not alter Alox12 expression in the liver, or other metabolic tissues including ingWAT, epiWAT, or skeletal muscle (Fig. 4a). Cold exposure induces a “beige” phenotype in WAT50 and we observed that cold increased expression of Ucp1 in ingWAT (Extended Data Fig. 6a). However, consistent with the lack of a cold-induced increase in Alox12 in this tissue, levels of 14-HDHA and MaR2 were not modulated by cold exposure in ingWAT and MaR1 was largely not detected (Extended Data Fig. 6b,c). Similarly, cold increased the expression of Ephx2, the gene encoding sEH, in BAT of DIO mice, but not in other tissues including liver (Fig. 4b). Expression of genes encoding enzymes related to other lipid mediators and SPM, such as Alox5, Alox15, Ptgs1 (encoding COX-1), and Ptgs2 (encoding COX-2) were not increased by cold in BAT of DIO mice (Fig. 4c). In the liver, cold exposure also did not increase the protein levels of 12-LOX or sEH of DIO mice (Fig. 4d), suggesting that the cold-induced increase in maresin pathway products in the liver might originate in BAT. In further support of this hypothesis, mRNA expression of Alox12 and Ephx2 were not increased in the liver of obese mice treated with CL316243 (Fig. 4e). These results suggest that cold exposure specifically enhances the maresin pathway in BAT.
Fig. 4: Cold specifically enhances the expression of 12-LOX and sEH in BAT, but not in the liver of DIO mice.

C57BL6/J male mice were fed with high fat (HF) diet at room temperature for 14 weeks to create DIO mice. The DIO mice were then put in thermoneutral temperature (30°C, TN) or cold (5°C) for 7 days. n = 5 mice/group. (a, b) Relative expression of 12-LOX mRNA (Alox12, n=5 biologically independent animals per group, from 1 independent experiment, a) and sEH mRNA (Ephx2, n=5 biologically independent animals per group, from 1 independent experiment, b) in BAT, epiWAT, ingWAT, liver and muscle. (c) Relative mRNA expression of 5-LOX (Alox5), 12/15-LOX (Alox15), COX-1 (Ptgs1) and COX-2 (Ptgs2) in BAT (n=5 biologically independent animals per group, from 1 independent experiment). (d) Western blot analysis of 12-LOX and sEH protein in the liver. Total proteins from the stain-free gel were used as loading control. Bottom panels: quantification of 12-LOX or sEH relative to total proteins (n=5 biologically independent animals per group, from 1 independent experiment). (e) DIO mice were treated with vehicle control or CL316243 (1mg/kg/day, daily i.p.) for 9 days. Relative mRNA expression of Alox12 and Ephx2 in the liver were then determined (n=5 biologically independent animals per group, from 1 independent experiment). Two-tailed Unpaired Student’s t tests. Data are presented as mean ± SEM.
BAT secretes MaR2 isomers into the circulation
Given that cold specifically enhances the 12-LOX/sEH/MaR2 pathway in BAT and that cold and a β3-AR agonist did not increase the expression of 12-LOX and sEH in the liver, we hypothesized that the elevated MaR2 pathway products in the liver are derived from BAT. From this point forward, we focused our analysis on the 14-HDHA/MaR2 pathway because MaR1 was not readily identified in BAT or liver under these conditions (see above). To examine if activated BAT could secrete products of the MaR2 pathway into the circulation, obese mice underwent surgical removal of interscapular BAT or sham surgery, followed by a 10-day rest period, after which the mice were placed in a cold or TN environment for 2 days. In the plasma of these mice, we identified 14-HDHA and MaR2 isomer II, similar to what we observed in BAT and liver. We also identified an additional MaR2 isomer that eluted after MaR2 (~0.1 min) but before MaR2 isomer II. We denoted this product MaR2 isomer I. MRM chromatograms of MaR2 standard and the two MaR2 isomers identified in the plasma of a selected sample are shown in Extended Data Fig. 6d,e, along with MS/MS spectra of each product in a selected sample showing similar product ions. Quantification of these products indicated that cold increased 14-HDHA, MaR2 isomer I, and MaR2 isomer II in plasma, and BAT removal blunted the cold-induced elevation of 14-HDHA and MaR2 isomer II, but not isomer I (Fig. 5a). As a gain-of-function approach, BAT from mice housed at TN or cold was transplanted to recipient mice, followed by 7 weeks of HF feeding. Recipient mice with transplanted cold exposed-BAT had higher levels of the MaR2 isomers in plasma as compared with mice transplanted with TN exposed-BAT, with MaR2 isomer I reaching statistical significance (Fig. 5b).
Fig. 5. BAT secretes MaR2 isomers in circulation.

(a) Left panel: Schematic of the experimental design of BAT removal study. Male C57BL6/J mice fed a high fat (HF) diet for 16 weeks at room temperature underwent surgical removal of their interscapular BAT or a sham procedure. Following a 10-day recovery period, the mice with BAT removal were placed in cold (5°C) for 2 days while sham mice were placed at thermoneutrality (30°C, TN) or cold (5°C). Right panel: Quantification of 14-HDHA, MaR2 Isomer I, and MaR2 Isomer II in plasma of HF-fed mice kept at thermoneutrality (TN) or exposed to cold (5°C) and subjected to sham or BAT removal (no BAT) surgery (14HDHA and MaR2 isomer II; n=5 biologically independent animals per group, MaR2 isomer I: n=5 for TN-sham and cold-no BAT, n=4 for Cold-sham, from 1 independent experiment). (b) Left panel: Schematic of the experimental design of BAT transplant study. BAT was removed from male mice exposed to TN or cold for 7 days and then transplanted to recipient male mice. After 7 weeks of HF diet feeding, plasma from recipient mice was subjected to LC-MS/MS analysis. Right panel: Quantification of 14-HDHA, MaR2 Isomer I, and MaR2 Isomer II in plasma of mice that received transplanted BAT from TN- or cold-exposed donor mice (n=5 biologically independent animals per group, from 1 independent experiment). (c) Left panel: Schematic of the experimental design whereby male mice fed a HF diet for 15 weeks were treated with vehicle control or CL316243 (1 mg/kg/day, daily i.p.) for 9 days. Right panel: Quantification of 14-HDHA, MaR2 Isomer I, and MaR2 Isomer II in plasma of mice administered vehicle control or CL316243 (n=5 biologically independent animals per group, from 1 independent experiment). (d) Left panel: Schematic illustrating the collection of cell culture media from in vitro differentiated murine brown adipocytes stimulated with vehicle control or CL316243 (1μM) for 4 hours. Right panel: Quantification of MaR2 Isomer I in cell culture media from brown adipocytes after 4 hours of treatment (n=5 wells per group, from 1 independent experiment). Two-tailed Unpaired Student’s t tests were performed to compare only 2 groups and One-Way ANOVA followed by a Tukey’s post-hoc test was performed to compare 3 groups. Data are presented as mean ± SEM.
As an additional approach to determining the contribution of BAT to the observed increases in maresin pathway products in the circulation, we assessed plasma levels of these products in mice treated with BAT activator, CL316243. We found that CL316243 treatment increased plasma levels of MaR2 isomers, with MaR2 isomer II reaching statistical significance (Fig. 5c). Moreover, treatment of in vitro differentiated murine brown adipocytes with CL316243 significantly increased levels of MaR2 isomer I (Fig. 5d) and 14-HDHA as previously reported28 in the culture media, while MaR2 isomer II was undetectable. Although differential changes in MaR2 and its isomers appear to depend on the different experimental contexts, these results collectively suggest that activated BAT secretes products of the maresin pathway into the circulation.
A β3-AR agonist increases the maresin pathway in humans
To assess the translational relevance of our findings, we measured maresin pathway products in the plasma of humans exposed to mirabegron, a specific β3-AR agonist approved for the treatment of overactive bladder in humans51. The plasma samples were collected from a clinical study performed previously52. In this study, eleven healthy male subjects were acutely treated with mirabegron (200mg) or placebo. Mirabegron treatment led to increased BAT activity and resting metabolic rate. We identified 14-HDHA and MaR2 isomer I in human plasma. MRM chromatograms and MS/MS spectra of synthetic 14-HDHA and MaR2 standards are shown in Extended Data Fig. 7a,b, along with MRM chromatograms and MS/MS spectra of 14-HDHA and MaR2 isomer I identified in a selected human plasma sample from subjects treated with mirabegron. Quantification of these products revealed that mirabegron significantly increased both 14-HDHA and MaR2 isomer I in human plasma (Fig. 6a,b). Further, levels of 14-HDHA and MaR2 isomer I were predicted by BAT activity, as measured by (18)F-fluorodeoxyglucose uptake via PET-CT52 (Fig. 6c,d). In support of these observations, stimulation of human brown adipocytes with adenylate cyclase activator forskolin in vitro increased the expression of both Alox12 and Ephx2 mRNA (Extended Data Fig. 7c–d). These results collectively suggest that activated BAT secretes products of the maresin pathway into the circulation in both mice and humans and that cold stimulates their production through the β3-adrenergic receptor.
Fig. 6: Mirabegron increases maresin pathway products in humans.

(a, b) Quantification of 14-HDHA and MaR2 Isomer I in human plasma after administration of placebo or mirabegron (n=11 biologically independent samples). Two-tailed Paired t test. Data are expressed as paired samples from the same individual following the indicated treatment. (c, d) Relationship between circulating 14-HDHA or MaR2 isomer I and log10 BAT activity as determined by a linear mixed model. BAT activity was defined using PET-CT.
Loss of 12-LOX in BAT increases inflammation in the liver
To understand the role of BAT-derived 12-LOX metabolites, including MaR2, in liver inflammation, we created mice with BAT-specific Alox12-knockdown using a combined cre-lox, Crispr/Cas9, and AAV approach as previously reported28 (Fig. 7a, b). We previously found that BAT-specific Alox12-kockdown reduces maresin pathway marker, 14-HDHA, in the serum28. These mice were fed a HF diet for 8 weeks prior to administration of the AAV expressing gRNA targeting Alox12 into BAT and were allowed to rest for 2 weeks prior to cold exposure (see Methods). Upon exposure to cold, we found that decreased 12-LOX in BAT led to increased expression of genes indicative of inflammation in the liver in obesity, including Ccl2, Ccr2, Itgax, Il1b (p=0.073), Il18, Tlr2, and Tgfb1 (Fig. 7c). Plasma ALT was notably higher in the BAT-specific Alox12 knockdown mice compared with the control (Fig. 7d). BAT-specific Alox12 knockdown did not alter weight, TG, or steatosis in the liver under cold exposure (Fig. 7e–g). These results suggest that BAT-derived 12-LOX products have a role in reducing inflammation in the liver independent of hepatic lipid accumulation, and that BAT may communicate with the liver to dampen hepatic inflammation.
Fig. 7: BAT-specific loss of Alox12 increases inflammation in the liver of DIO mice.

(a) Schematic illustrating the experimental design for cold-exposed UCP1CRE/Alox12-KD obese male mice using UCP1CRE and CRISPR-Cas9 knock-in mice. UCP1CRE/Cas9 knockin male mice and WT/Cas9 knockin male mice were generated by mating between UCP1CRE strain and the homozygous Rosa26-floxed STOP-Cas9 knockin mice. Each strain of mice was injected with AAV/Alox12 gRNA and AAV/Empty vector (EV) respectively, after 8 weeks of high fat (HF) diet feeding. The resultant BAT-specific Alox12-KD obese mice (UCP1CRE/Alox12-KD) and wild type obese mice (EV) were subsequently exposed to 7 days of cold (5°C). (b)Protein levels of 12-LOX in BAT as determined by Western blot. Vinculin was used as loading control. Bottom panels: quantification of 12-LOX relative to vinculin. (n=5 biologically independent animals for EV Cold, n=6 for UCP1cre/ALOX12-KD Cold, from 1 independent experiment). (c) Relative mRNA expression of pro-inflammatory, NLRP3-inflammasome related- and fibrosis related genes in the liver (n=5 biologically independent animals for EV Cold, n=6 for UCP1cre/ALOX12-KD Cold, from 1 independent experiment). (d) Plasma ALT levels. (n=4 biologically independent animals for EV Cold, n=5 for UCP1cre/ALOX12-KD Cold, from 1 independent experiment). (e, f) Liver weight and triglyceride (TG) levels (n=5 biologically independent animals for EV Cold, n=6 for UCP1cre/ALOX12-KD Cold, from 1 independent experiment). (g) Representative image of hematoxylin and eosin (H&E) staining of liver sections from each group (Scale bar=100 μm). Two-tailed Unpaired Student’s t tests. Data are presented as mean ± SEM.
MaR2 reduces inflammation systemically and in the liver
To directly test whether MaR2 regulates obesity-induced inflammation, we administered MaR2 (5μg/kg/day; i.p.) to DIO mice for 28 days (Extended Data Fig. 8a) and assessed plasma levels of TNFα, as well as a panel of pro-inflammatory genes in the liver. Treatment of DIO mice with MaR2 did not alter body weight, but significantly reduced plasma levels of TNFα (Extended Data Fig. 8b,c). Moreover, MaR2 significantly reduced the expression of Il18 and Tlr2 in the liver, while other inflammation-related genes tended to be reduced but were not statistically significant at this time point and dosage (Extended Data Fig. 8d).
We next administered a higher dosage of MaR2 (10μg/kg/day x 26 days; i.p.) to DIO mice (Fig. 8a and Extended Data Fig. 8e). The higher dosage did not alter body weight nor food intake (Extended Data Fig. 8f–g), but again significantly reduced plasma levels of TNFα (Fig. 8b). The expression of pro-inflammatory and inflammasome-related genes, including Casp1 and Il1b, were significantly reduced by MaR2, and there was a trend toward a reduction in the expression of several other pro-inflammatory genes in the liver (Fig. 8c). These changes in inflammation were independent of hepatic steatosis, as liver weight, TG levels, expression of lipogenic genes, steatosis, and ALT were not altered by MaR2 treatment at this time point (Extended Data Fig. 8h–l). Moreover, MaR2 did not significantly modulate expression of inflammatory genes in the BAT or epiWAT using this treatment regimen (Extended Data Fig. 8m,n).
Fig. 8: MaR2 resolves inflammation in obesity in part by targeting macrophages.

(a) Schematic of the experimental design of MaR2 treatment. C57BL6/J male mice were fed with a high fat (HF) diet at room temperature for 16 weeks. Then, the mice were administered vehicle or MaR2 (10 μg/kg/day; daily i.p.) for 26 days. (b) Plasma TNFα levels (n=6 biologically independent animals per group, from 1 independent experiment). (c) Relative mRNA expression of pro-inflammatory, NLRP3-inflammasome related- and fibrosis related genes in the liver (n=6 biologically independent animals per group, except Tnfa Vehicle: n=5, Tnfa Mar2: n=4, from 1 independent experiment). (d) Schematic of the experimental design of MaR2 treatment. C57BL6/J male mice were fed with a high fat (HF) diet at room temperature for 17 weeks. Then, the mice were administered vehicle or MaR2 (10 μg/kg/day; daily i.p.) for 5 days. (e) Flow cytometry gating strategy of monocyte and macrophage populations in the liver. Representative dot plots showing CD45+F4/80−CD11bhi monocytes with differential expression of Ly6C and CCR2 (top) and CD45+F4/80+CD11bint macrophages (bottom) are shown. Macrophages were further delineated based on expression of TIM4 and MHCII, with TIM4hiMHCII+VISIG4+CCR2− macrophages defined as resident Kupffer cells (KCs) and TIM4loMHCII+VISIG4+CCR2− macrophages defined as monocyte-derived Kupffer cells (mo-KCs). (f) Representative contour plots showing TREM2 expression on KCs of mice treated with vehicle or MaR2, with isotype control indicated. (g, h, i) Quantification of TREM2+ monocyte subsets in the liver (n=5 biologically independent animals per group, from 1 independent experiment). (j) Quantification of TREM2+ KCs in the liver (n=4 biologically independent animals per group, from 1 independent experiment). (k) Quantification of TREM2+ mo-KCs in the liver (n=5 biologically independent animals for Vehicle, n=4 for MaR2, from 1 independent experiment). (l) Schematic of the treatment protocol whereby resting or LPS-primed (100 ng/ml; 3 hours) bone marrow-derived macrophages (BMDM) were stimulated with palmitate conjugated to BSA (PA-BSA, 200μM, 24 hours) with or without MaR2 (10nM). Supernatants were collected and the concentrations of IL-1β and TNFα were measured by ELISA (n=7 biologically independent animals per group, from 3 independent experiments, Paired parametric 1-way ANOVA followed by Fisher’s LSD test). Two-tailed Unpaired Student’s t test, except panel l. Data are presented as mean ± SEM.
To assess the absorption kinetics of MaR2 administered at this dose, we used a deuterated form of MaR2 (d5-MaR2) to differentiate it from endogenous MaR2 by targeted LC-MS/MS. Exogenous spiking experiments with d5-MaR2 revealed a lower limit of quantification in mouse plasma of approximately 1.3 pg (Extended Data Fig. 9a). We administered d5-MaR2 to DIO mice (10μg/kg; i.p.) and assessed its levels in plasma (Extended Data Fig. 9b). Levels of d5-MaR2 peaked in plasma after 15 min post-injection and were significantly reduced by 30 and 60 min (Extended Data Fig. 9c). The concentration of d5-MaR2 detected in plasma over the time course ranged from 224 +/− 23 pg/ml (15 min) to 4.2 +/− 1.4 pg/ml (60 min) and was thus within the range of that observed for MaR2 isomers in the plasma during cold exposure or β3-AR agonist administration in both humans and mice (see Figs. 5 and 6). These results demonstrate that the dose of MaR2 administered was not supraphysiologic and that a single injection only transiently increases MaR2 in the plasma.
Prior studies have shown that MaR2 stimulates resolution of acute inflammation in vivo and has direct actions on human macrophages, promoting efferocytosis14. To understand the mechanisms whereby MaR2 regulates inflammation, we asked whether MaR2 modulates monocyte and macrophage populations in the liver. During obesity, resident liver macrophages (i.e., Kupffer cells; KCs) are reduced, undergo phenotypic changes, and are supplemented by CCR2-dependent recruitment of Ly6C+ monocytes that ultimately give rise to macrophage subsets including “monocyte-derived KCs (mo-KCs)”53,54. To determine whether MaR2 modulates monocyte/macrophage populations in the liver during obesity, DIO mice were treated with MaR2 (10μg/kg/day x 5 days; i.p.; Fig. 8d). The perfused liver was collected, and monocyte/macrophage populations were assessed by flow cytometry (see the gating strategy in Fig. 8e). We observed three prominent CD45+CD11b+F4/80− monocyte populations with differential expression of Ly6C and CCR2 and found that MaR2 treatment significantly increased levels of CD45+CCR2−Ly6Clo monocytes (Extended Data Fig. 9d). Overall levels of KCs (CD45+F4/80+CD11bIntTIM4hiMHCII+VISIG4+CCR2−) and mo-KCs (CD45+F4/80+CD11bIntTIM4loMHCII+VISIG4+CCR2−)54 were not significantly different between control and MaR2-treated mice (Extended Data Fig. 9e). Recent studies utilizing single-cell RNA sequencing have established that lipid-associated macrophages expressing triggering receptor expressed on myeloid cells-2 (TREM2) are prominent in both the liver and adipose tissue during obesity53–55. These TREM2+ macrophages correlate with the progression of liver steatosis, but play a protective role in limiting inflammation and fibrosis in NASH and other models of liver injury54,56–58. Moreover, TREM2 blunts TLR signaling in macrophages and KCs via reducing IL1β and TNFα production 56,59,60. We found that MaR2 selectively increased the levels CCR2+Ly6Chi monocytes expressing TREM2 (Fig. 8g). A similar trend was observed with CCR2−Ly6Chi monocytes and CCR2−Ly6Clo monocytes (Fig. 8h,i). Interestingly, despite not changing the total amount of KCs in the liver of DIO mice, MaR2 led to a significant increase in the abundance of TREM2+ KCs (Fig. 8f, j, k). These results suggest that MaR2 modulates monocyte/macrophage populations in the liver of DIO mice and selectively increases TREM2 that serves a protective anti-inflammatory role in the liver during obesity.
In support of a direct role of MaR2 in regulating inflammatory gene expression in KCs, incubation of primary rat KCs with MaR2 led to a significant reduction in the baseline expression of Tnfa, Il18, Tlr2 and Tgfb1 (Extended Data Fig. 9f). To more directly mimic the microenvironment in the liver during obesity, we further used a well-established model of lipotoxicity-induced inflammasome activation in macrophages61. Murine bone marrow-derived macrophages (BMDM) were primed with lipopolysaccharide (LPS), followed by the addition of palmitic acid-bovine serum albumin conjugates (PA-BSA) to activate inflammasome-dependent production of IL1β. Co-treatment with MaR2 significantly blunted the production of mature IL1β induced by PA-BSA (Fig. 8l). Moreover, MaR2 significantly blunted TNFα production in the presence of PA-BSA. Collectively, these results indicate that MaR2 reduces obesity-induced inflammation in the liver, in part by targeting macrophages.
DISCUSSION
Extensive evidence indicates that obesity and metabolic syndrome are associated with chronic inflammation that leads to systemic insulin resistance. Interruption of inflammatory signaling in obese animal models prevents the development of insulin resistance3. However, current anti-inflammatory strategies have limited long-term therapeutic applicability because of their immunosuppressive and other detrimental side effects. Thus, identifying new therapeutic agents that can resolve inflammation without the unwanted side effects will provide promising therapeutics for obesity-related metabolic sequelae. Informed by our previous observation that BAT activation increases expression of 12-LOX and 14-HDHA28, we hypothesized that production of maresins could in part underlie the beneficial effect of BAT activation on obesity-induced inflammation. In the present study, we demonstrated that activation of BAT increases maresin production and that MaR2 plays a role in reducing inflammation.
These findings highlight potential crosstalk between activated BAT and the liver, resulting in antagonizing obesity-induced inflammation and insulin resistance. Several secreted factors produced by BAT have been reported to modulate hepatic function. For example, neuregulin 4 is a BAT-derived cytokine, which attenuates hepatic steatosis via reducing liver lipogenesis62. Exosomal miRNAs derived from BAT regulate hepatic gene expression63. Succinate produced by brown and beige adipocytes reduces immune cell infiltration in NAFLD64. However, not all BAT-derived factors exert beneficial effects. Stress triggers IL6 secretion from BAT, which promotes hepatic gluconeogenesis and decreases host fitness to inflammatory challenges65. We found circulating levels of IL6 were not altered in obese animals after cold exposure, suggesting that IL6 is likely not involved in the cold-induced BAT-liver communication observed in our study. Conversely, factors originated from the liver can also regulate BAT activity. Simcox et al. showed that liver-derived acylcarnitine provides fuels for BAT thermogenesis66. Our data suggest that MaR2 is potentially a new player to the network of BAT-liver communication.
We discovered that BAT activation increases maresin pathway products, albeit BAT is likely not the sole source of maresins. Both MaR1 and MaR2 have previously been identified in human WAT67. A recent study determined that MaR2 is an abundant product formed in murine BAT and that its levels decline with aging and obesity68. We found that BAT produces 14-HDHA, MaR2, and structural isomers of MaR2 and that isolated brown adipocytes contribute in part to their biosynthesis. Of note, although MaR1 and MaR2 are produced from the same epoxide intermediate, the bias towards MaR2 observed in the present study is likely related to expression of sEH, which converts the 13S, 14S-epoxide precursor to MaR2 but not MaR1 in vitro14. Human macrophages produce MaR2, as well as an additional isomer that elutes after MaR2 using reverse-phase (RP)-HPLC14, consistent with what we observed in the present study. Production of multiple stereoisomers from the same epoxide intermediate is common for lipid mediators and is also observed for the protectins and leukotrienes69,70. Of note, non-enzymatic epoxide hydrolysis can also occur and give rise to stereoisomers with distinct retention times on RP-HPLC. Isomerization of native MaR2 could also occur during sample storage or exposure to ultraviolet light. Thus, we monitored 14-HDHA and MaR2, as well as the MaR2 stereoisomers, as a collective readout of enhanced activation of the maresin pathway during BAT activation. Future studies will be required to assign the complete stereochemistry of the two MaR2 isomers observed here, to determine how they are formed, and whether they possess unique biological functions.
As evidence that activation of the MaR2 pathway plays a role in the inflammation-resolving effects of BAT activation, treatment with MaR2 reduced inflammation in obesity. This was evident at the systemic level, where MaR2 led to a reduction in plasma levels of TNFα, as well as a reduction of inflammatory genes in the liver of obese mice. The effects of cold-induced MaR2 on resolving inflammation appeared to be specific to the liver as the expression of pro-inflammatory genes remained high in WAT of the cold-exposed obese mice as well as those treated with MaR2. Nonetheless, we cannot rule out that the lack of effect of exogenous MaR2 on resolving inflammation in WAT or other tissues (i.e., BAT) could also be due to lack of efficient delivery and/or enhanced metabolic inactivation in those tissues. Similar to the role of MaR2 observed in the present study, MaR1 is protective in high-fat diet-induced NASH16,17,71. Importantly, MaR1 similarly reduces liver inflammation in the context of obesity, in part by serving as a ligand for retinoic acid-related orphan receptor alpha15. We note that in addition to MaR2, other 12-LOX products also contribute to the protective actions of 12-LOX during BAT activation. Indeed, 12-HEPE and 12, 13-diHOME regulate glucose and fatty acid metabolism in BAT, respectively, and thereby contribute to metabolic improvements associated with BAT activation28,29.
While SPM primarily act within local tissue microenvironments, several SPM have been identified in the plasma of rodents and humans11. Indeed, MaR2, MaR1, and 14-HDHA, have been identified in plasma and sera of humans28,72–76. Our findings indicate that cold increases 12-LOX and sEH in BAT, suggesting that BAT secretes MaR2 into circulation. This is supported by both loss-of-function (i.e., BAT removal) and gain-of-function (i.e., BAT transplantation and CL316243 treatment) approaches demonstrating that BAT is at least partially responsible for the cold-induced secretion of maresin pathway products into the circulation. Our results demonstrate that the appearance of d5-MaR2 in the plasma was transient after a single bolus injection, indicating that stable analogs of MaR2 may be more efficacious in resolving inflammation and improving downstream metabolism than we observed in the present study.
Macrophages play a key role in driving chronic inflammation in obesity5,45. Because MaR2 acts on macrophages during resolution by enhancing phagocytic functions14, we hypothesized that the protective actions of MaR2 in resolving hepatic inflammation might be related to actions on macrophages. We found that MaR2 reduces pro-inflammatory genes including Tnfα and Il18 in primary KCs and that it reduces secretion of pro-inflammatory cytokines IL1β and TNFα in model of macrophage lipotoxicity. Moreover, MaR2 increased monocyte/macrophage populations in the liver that express TREM2. Similar to what we observed with MaR2, TREM2 also counter-regulates inflammatory cytokine production in bone marrow-derived macrophages, as well as KCs56,60. Loss of TREM2 worsens liver inflammation, steatosis, and necrosis in obesity and in models of acute and chronic liver injury56,57. Thus, MaR2 may act to blunt inflammation in macrophages exposed to high levels of lipids and TLR agonists, potentially by regulating TREM2. Of note, TREM2 also regulates phagocytic functions of macrophages58, which is also a key function of MaR2 and other SPM6,14. Future studies are needed to define the signaling mechanisms engaged by MaR2 in macrophages.
Inflammation is necessary to protect the host from pathogens, but failure of resolution causes chronic maladaptive inflammation that leads to disease progression. Unlike nonsteroidal anti-inflammatory drugs and steroids, SPM actively resolve inflammation without causing immunosuppression or other detrimental side effects. Indeed, several studies have shown that SPM actually enhance host defense11. Thus, therapeutic biomimetics informed by the BAT-MaR2 axis described here could have the potential to dampen obesity-induced inflammation and serve as a novel approach to combat obesity-related metabolic disorders.
METHODS
Mice and treatments
All animal experiments and care procedures were approved by the Institutional Animal Use and Care Committee at Joslin Diabetes Center. C57BL6/J mice were purchased from the Jackson Laboratory, and the details of in vivo experiments are described in each section. The mice were kept in a temperature-controlled room (23°C) on a 12 h light/dark cycle (lights on 06:30 h; off 18:30 h) unless temperature indicated with free access to food and water. The humidity in the mouse room is 30%. Lean mice were fed chow diet (cat# 5020, LabDiet). For creating diet-induced obese (DIO) mice, 6-week-old mice were fed with a high-fat diet containing 60 kcal% from fat (cat# D12492, Research Diets) for 14-19 weeks.
Before sacrifice, mice were fasted (the duration of fasting times is described in each section) by transferring mice to clean cages with no food or feces in hoppers or bottom of cages. Mice were anesthetized with inhalation of isoflurane (cat# NDC 66794-017-25, Piramal Critical Care), then blood was taken from the tails of mice under the anesthesia to determine fasting glucose concentrations with Infinity Blood Glucose Meter (US Diagnostics) to calculate HOMA-IR as described below. Blood was also obtained by cardiopuncture, subsequently plasma or serum was separated by centrifugation at 4°C and stored at −80°C until future analysis of ALT, insulin, cytokine, and lipid mediators (see below). The epididymal and inguinal white fat, liver, muscle (quadriceps) and interscapular brown fat were dissected and weighed, then snap frozen in liquid nitrogen and stored at −80°C until further analysis.
For cold exposure, mice were housed individually at 5°C or thermoneutrality 30°C as the control for 2 or 7 days. This was achieved by housing mice in the temperature controlled diurnal incubators (Caron Products & Services Inc.) on a 12hrs light/dark cycle (lights on 06:30 h; off 18:30 h) with free access to food and water. Body weight and food intake were monitored. Bedding in cages was changed every other day. Both male and female mice were used in the cold exposure studies.
For CL316243 (cat# 1499, Tocris) injection in vivo studies, DIO male mice were administered daily 1mg/kg/day of CL316243 by intraperitoneal (i.p.) injection. On day 7 of the CL316243 injection, IPGTT was performed after 6hrs of fasting. At day 9 of the CL316243 injection, mice were sacrificed for collecting tissues and plasma after overnight fasting.
For MaR2 treatment, DIO mice were administered synthetic MaR2 (13R, 14S-dihydroxy-4Z, 7Z, 9E, 11E, 16Z, 19Z-docosahexaenoic acid; cat# 16369, Cayman Chemical) by i.p. at the doses and duration indicated in each section.
For the BAT removal study, male mice were fed a high-fat diet containing 60 kcal% fat for 16 weeks, then underwent sham or BAT removal under anesthesia with inhalation of isoflurane. After 2 days of cold or TN exposure, mice were sacrificed after 4hrs fasting.
For the BAT transplant study, donors of C57BL6/J male mice (12 weeks old) were exposed to 30°C or 5°C for 7 days, then the BAT were transplanted to recipient C57BL6/J male mice (12 weeks old) under anesthesia with inhalation of isoflurane. Following 7 weeks of high fat diet (cat# D12492, Research Diets) at room temperature, the recipient mice were sacrificed after 6hrs fasting to collect plasma for LC-MS/MS.
Measurement of blood parameters
Plasma insulin levels were determined by Ultra-Sensitive Mouse Insulin ELISA Kit (cat# 90080, Crystal Chem). Insulin resistance was assessed by calculating HOMA-IR ((fasting glucose x fasting insulin)/405). Plasma TNFα and leptin were determined by ELISA (Mouse TNF-alpha Quantikine ELISA kit, cat# MTA00B R&D systems and Mouse/Rat Leptin Quantikine ELISA Kit, cat# MOB00, R&D systems, respectively). Plasma levels of IFNγ, IL6 and IL1β were determined using an electrochemi-luminescence-based multi-array method through the Quickplex SQ 120 system (by the Meso Scale Diagnostics LLC). The proinflammatory panel 1 (mouse) multiplex kits were utilized, which detects cytokines in a 96-well-based assay system. The procedures were following the protocols suggested by the manufacturer that have been previously reported77,78. In brief, the experimental samples and protein standards were prepared in resuspension with the diluents provided by the manufacturer. The mixed solution was placed on a shaker for 2 hours, followed by washing and then incubation with the detection antibodies for another 2 hours, and then the solution was washed and added with the reading buffer. The electrochemi-luminescence signals were captured through the SQ 120 system. The protein concentrations in the samples were analyzed using the protein standards. Protein levels were compared in our analysis among different experimental groups. Plasma alanine aminotransferase (ALT) was measured using an autoanalyzer through Preclinical Murine Pharmacogenetics Core at Beth Israel Deaconess Medical Center.
Glucose tolerance tests
For an intraperitoneal glucose tolerance test (IPGTT), mice were fasted for 6 hours (8AM to 2PM) by transferring mice to clean cages with no food or feces in hoppers or bottom of cages. Mice had free access to drinking water. A baseline glucose level was determined by collecting blood from the tail of fully conscious mice, before a solution of glucose (2.0 g/kg body weight) was administered by i.p. Subsequently, blood was taken from the tail at 15, 30, 45, 60, 90, and 120 minutes after the injection. Glucose concentrations were determined using Infinity Blood Glucose Meter.
Hepatic triglyceride (TG) Content
Liver tissue TG were extracted and quantified with a TG assay kit (cat# ab65336, Abcam) according to the manufacturer’s instructions and normalized to total protein concentration.
Targeted LC-MS/MS
Tissue samples were weighed and placed in 1 mL of ice-cold methanol containing commercially available deuterated internal standards including d4-LTB4, d5-MaR1, and d8-5-HETE (Cayman Chemical, Ann Arbor, MI) and then thoroughly minced with surgical micro scissors on ice. For liquid samples (murine and human plasma and cell culture media), 3 volumes of methanol containing internal standards were added and samples were vortexed. Samples were placed at −80°C for a minimum of 1 hour to allow for protein precipitation. Following centrifugation (13,000 rpm; 10 min; 4°C), supernatants were separated from protein pellets. Pellets were lysed using RIPA buffer (Thermo) and total protein was determined via Pierce BCA assay (Thermo) and used for the normalization of lipid mediator abundance in some cases. Solid phase extraction (SPE) was carried out in part as described in detail previously79 using C18 SPE columns (Biotage, Uppsala, Sweden) that were conditioned with successive washes of methanol and water. Samples were acidified to a pH of 3.5 and subsequently loaded on the columns. Following a wash with n-hexanes to remove neutral lipids, lipid mediators were eluted from the column using methyl formate. Methyl formate was then evaporated using a gentle stream of N2 gas, and lipid mediators were resuspended in methanol:water (50:50, v/v).
Lipid mediators were analyzed using a high-performance liquid chromatography system (Shimadzu, Kyoto, Japan) equipped with a Poroshell reverse-phase C18 column (100 mm x 4.6 mm x 2.7mm; Agilent Technologies) that was held at 50°C. A gradient of methanol-water-acetic acid ranging from 50:50:0.01 (v/v/v) to 98:2:0.01 (v/v/v) was used at a constant flow rate of 0.5ml/min. The HPLC was coupled to a QTrap5500 mass spectrometer (AB Sciex, Framingham, MA) operating in negative ionization mode and utilizing Analyst software (v 1.6.2). Lipid mediators were identified utilizing scheduled multiple reaction monitoring (MRM) transitions for 14-HDHA (m/z: 343/205), MaR1 (m/z: 359/221), and MaR2 (m/z: 359/221) and by matching the retention times of compounds identified in samples with those of synthetic standards (Cayman Chemical, Ann Arbor, MI) for each lipid mediator acquired in parallel. In selected samples, we also compared MS/MS fragmentation spectra of identified compounds to those of synthetic standards using information-dependent enhanced product ion mode scanning. Identification of MaR2 isomers observed at retention times distinct from authentic MaR2 was accomplished using the same MRM transition as MaR2 (m/z 359/221) and by matching at least 6 diagnostic MS/MS ions (including a minimum of 1 backbone or backbone-derived fragment) in selected samples to the synthetic MaR2 standard run in parallel. Quantification of lipid mediators was determined by extrapolating MRM peak areas above the baseline to external standard curves for each mediator, followed by accounting for the extraction recovery of internal deuterated standards with similar chromatographic retention times. Finally, values were normalized to tissue weight, protein concentration, or sample volume, as indicated in the graphs. The MRM peaks and MS/MS spectra shown in the figures are derived from selected samples using the export function in Analyst, followed by plotting in GraphPad Prism. For MS/MS spectra, the abundance of ions was converted to relative intensity and expressed as a percentage.
The limit of quantification for 14-HDHA, MaR1, and MaR2 was determined using synthetic standard curves and was defined as the lowest amount that could be quantified in replicate injections with a coefficient of variation (CV) of less than 20%. This yielded a lower limit of quantification of approximately 0.5 pg on-column for 14-HDHA, 5pg for MaR1, and approximately 1pg for MaR2. The lower limit of quantification was also determined in plasma by spiking known amounts of deuterated MaR2 (d5-MaR2; Cayman Chemical) into mouse plasma and determining the amount that could be quantified in replicate injections with a CV less than 20%. This yielded a lower limit of quantification of approximately 1.3 pg in plasma (see Extended Data Fig. 9). To determine the absorption kinetics of exogenously administered MaR2 into the blood, d5-MaR2 was injected i.p. to male mice fed an HF diet for 15 weeks (Jackson Labs) at a dose of 10μg/kg body weight, and plasma was collected at the indicated time intervals using EDTA as the anticoagulant. Following SPE, d5-MaR2 was quantified using a specific MRM transition (m/z 364/221) and was normalized to an external calibration curve for d5-MaR2.
mRNA Expression
Trizol reagent was used to extract total RNA from tissue and RNA was purified using a spin column kit (cat# R2052, Zymo Research). RNA (500ng - 2μg) was reverse-transcribed with a high-capacity complementary DNA (cDNA) reverse transcription kit (Applied Biosystems). Quantitative real-time PCR (qRT-PCR) was performed using SYBR green PCR Master Mix (cat# A25778, Applied Biosystems) with 300 nM of each forward and reverse oligonucleotide primer in in an ABI Prism 7900 sequence detection system (Applied Biosystems). Acidic ribosomal phosphoprotein P0 (ARBP) expression were chosen as an internal standard in mice and humans. Ribosomal protein L13a (Rpl13a) expression was chosen as an internal standard in rats. Real time PCR primer sequences are listed in Supplementary Table 1.
Western blot analysis
Selected tissues were lysed with T-PER™ Tissue Protein Extraction Reagent (cat# 78510, Thermo Fisher Scientific) with protease inhibitor cocktail (cat# P8340, Sigma). Homogenates were centrifuged for 20min of 13,000 rpm at 4°C and the supernatants were collected. Protein concentrations were determined with a Pierce BCA kit (cat# 23225, Life Technologies). For immunoblots, lysates were diluted into Laemmli buffer, boiled, and loaded onto Tris gel for SDS-PAGE. After the proteins were completely separated, they were transferred to a PVDF membrane (cat# IPVH00010, MilliporeSigma) and blocked with Western blocking buffer (cat# 11096176001, Sigma-Aldrich). Primary antibodies of 12-LOX (cat# sc-365194, Santacruz) and sEH (UC Davis) were applied in an immunoreaction enhancer solution, Can Get Signal (cat# NKB-201, Toyobo), overnight at 4°C. After washing 2x for 10 min with TBS-T, secondary antibodies were applied for 1 h at room temperature in blocking buffer. Membranes were washed again 4x times for 10 min in TBS-T and developed using chemiluminescence (cat# 34095, ThermoFisher). Signals on the immunoblot were quantified using Image Lab Software (Bio-Rad). Vinculin or total protein were used as an endogenous control for normalization.
Flow cytometry and Antibodies
Single cells of SVF fraction in BAT, epiWAT or ingWAT were isolated by enzymatic digestion with 1.5mg/ml of collagenase I (cat# LS004197, Worthington Biochemical Corporation) at 37°C for 45 min, followed by filtration. Single cells from the liver were isolated by enzymic digestion with 1.5 mg/ml of collagenase I at 37°C for 40 min, followed by filtration. Cells were previously blocked with purified anti-mouse CD16/32 antibody (cat# 101302, BioLegend) and True-Stain monocyte Blocker (cat# 426101, BioLegend) at room temperature for 15 min to prevent nonspecific binding of Abs and were stained with monoclonal antibodies at 4°C in staining buffer for 20 min. Cells were then washed and resuspended in a staining buffer with PI (100 ng/ml) for dead cell exclusion. Analysis of stained cells was performed on an LSR Fortessa (BD Biosciences) at Joslin Diabetes Center Flow Core. Flow cytometry data were analyzed with FlowJo Version 10 software (Tree Star). The antibodies used are listed in Supplementary Table 2.
Hepatic immune cells from DIO mice treated with MaR2 or vehicle were isolated following the protocol described by Daemen S et. al80. Briefly, DIO mice were euthanized, and the liver was perfused through the portal vein with PBS until the liver appeared pale. The liver was weighed and digested with 0.75mg/ml of Collagenase A (cat# C5138, Sigma) and 50μg/ml of DNase I (cat# 10104159001, Sigma) at 37°C for 30 min on a shaker, followed by filtration using a 70μm cell strainer. To separate hepatocytes from non-parenchymal cells (NPCs), the strained cell suspension was centrifuged at 50 x g for 3 min at 4°C. The supernatant containing the NPCs was transferred into a new 50ml falcon tube and centrifuged at 163 x g for 7 min at 4°C. The NPCs pellet was incubated with RBC Lysis Buffer (10x, cat# 420301, Biolegend) at RT for 5 min, the cell suspension was washed with PBS and centrifuged at 163 x g for 7 min at 4°C. The NPCs were resuspended in PBS containing Zombie Aqua (cat# 423101, Biolegend) for dead cell exclusion, and incubated for 20min at RT. Cells were blocked with Fc block (TruStain FcX™ PLUS, cat# 156604, Biolegend) in FACs buffer (PBS with 0.5% BSA and 2mM EDTA) for 15min at 4°C. NPCs were stained with a cocktail of monoclonal antibodies in FACs buffer with Brilliant Stain Buffer Plus (Cat# 566385, BD), at 4°C for 30 min. Cells were fixed with BD Cytofix/Cytoperm™ (cat# 554722, BD). Analysis of stained samples was performed on an LSR Fortessa using the Brigham and Women’s Hospital Flow Cytometry Core. Flow cytometry data were analyzed with FlowJo 10.8.1 software (BD). The antibodies used are listed in Supplementary Table 2. Compensation was performed on single-stained beads (UltraComp eBeads™ Plus Compensation Beads, cat# 01-3333-42 and ArC™ Amine Reactive Compensation Bead Kit, cat# A10346, Invitrogen). For setting gates and addressing fluorescence spillover, we used fluorescence-minus-one (FMO) controls. For TREM2 expression, we additionally used IgG isotype control.
H&E staining
Liver tissue was freshly collected and immediately fixed overnight in 10% neutral buffered formalin. Tissue samples were dehydrated using gradient ethanol and were embedded in paraffin. The sections were stained with hematoxylin and eosin (H&E).
Immunohistochemistry and quantification of crown like structures (CLS)
Formalin fixed, paraffin embedded epididymal adipose tissue sections were incubated with F4/80 Rabbit monoclonal antibody (cat# 70076, Cell Signaling) overnight at 4°C, followed by incubation with SignalStain Boost IHC detection Reagent (HRP, Rabbit, catalog# 8114, Cell signaling). The slides were mounted with liquid DAB (cat# sk-4100, Vector Lab) for 5min. CLSs were identified as adipocytes completely surrounded by F4/80+ cells and were counted in a random 200x field of all animals.
CL316243 treatment of mouse brown adipocytes
Mouse immortalized brown preadipocytes were allowed to reach confluency, and treated with induction media supplemented with 2% FBS, 20 nM insulin, 1 nM triiodothyronine (T3), 0.125mM indomethacin, 5 μM dexamethasone, and 500 μM isobutilmetilxantin (IBMX) for 2 days. Then, cells were maintained in differentiation media supplemented with 2%FBS, 20 nM insulin, and 1 nM T3 for 6 more days81. After differentiation, about 5 million differentiated mouse brown adipocytes in a 10cm dish were washed with PBS, the growth medium was replaced by 5 ml of serum-free and phenol red-free DMEM medium with or without CL316243 (1μM) for 4hrs. After 4hrs, 2ml of the media was collected and placed on the dry ice immediately. The media was stored in −80°C for targeted LC-MS/MS.
Human brown adipocyte differentiation and forskolin treatment
Immortalized human preadipocytes82,83 were cultured in high glucose DMEM supplemented with 10% FBS. When cells reached confluence, brown adipocyte differentiation was induced by using induction media (DMEM high glucose media with 10% FBS, 33 μM Biotin, 17 μM Pantothenate, 0.5 μM human insulin, 500 μM IBMX, 2 nM T3, 0.1 μM dexametasone and 30 μM indomethacin) for 21 days. After fully differentiated, human brown adipocytes were washed with PBS and the induction medium was replaced by DMEM medium with or without 10 μM forskolin for 12, 18, 24 and 36 hours. After the incubation cells were washed with PBS and RNA was extracted for qPCR analysis.
Treatment of Kupffer cells with MaR2
For assessing direct effects of MaR2 on liver Kupffer cells, primary rat Kupffer cells (cat# RTKCCS, Thermofisher) isolated from adult male Sprague-Dawley rats were incubated with or without MaR2 for 18hrs using a serum-free macrophage media (cat#10961, STEMCELL). After 18hrs, the cells were washed with PBS and harvested for RNA collection following the protocol for qPCR as described above.
Bone marrow-derived macrophage isolation, culture, and treatment
Bone marrow was isolated from C57BL/6J mice following euthanasia by CO2 inhalation and cervical dislocation. Bone marrow cells from femurs and tibias were collected in PBS (without calcium and magnesium). Bone marrow derived macrophages (BMDM) were generated by culturing in basal medium (DMEM/F12, supplemented with 10 mM L-glutamine, 10% FBS, 1% penicillin/streptomycin) containing 25% L929 conditioned medium as previously described84.
On day 7 of differentiation, cells were harvested using Accutase (cat# 25-058-CL, Corning), collected, and spun down at 500 × g for 7 min. Cells were then resuspended in basal medium, counted, and plated at a density of 6×10⁵ cells in 12-well flat-bottom plates for experiments. The following day, cells were serum starved for 4 hours and then the medium was replaced with DMEM supplemented with 1%FBS. BMDM were primed with LPS from Escherichia coli strain O111:B4 (100ng/ml, cat# L4391, Sigma) for 3 hours and then stimulated with palmitate conjugated to BSA (200uM, PA-BSA, cat# 29558, Cayman Chemical, Ann Arbor, MI) for 24 hours in the presence or absence of MaR2 (10 nM). The supernatants were collected, centrifuged, and the concentrations of IL1β (cat# 88-7013-22, Invitrogen) and TNFα (cat# 430904, Biolegend) were measured by enzyme-linked immunosorbent assay (ELISA) at the indicated time point following the manufacturer’s instructions.
Generation of UCP1CRE/Alox12 knock-down mice
For the generation of the UCP1CRE/Cas9 mice, we crossed the UCP1CRE strain (Stock no. 024670, The Jackson Laboratories) with homozygous Rosa26-floxed STOP-Cas9 knockin mice (Stock no. 024857, The Jackson Laboratory). Rosa26-floxed STOP-Cas9 knockin mice have a cre recombinase-dependent expression of Cas9. As a result, we obtained 50% UCP1CRE/Cas9 (HET) knockin mice and half WT/Cas9 (HET), which were injected with AAV/Alox12 gRNA and AAV/EV respectively through the method described below, after 8 weeks of HF diet (cat# D12492, Research Diets) feeding starting at 10 weeks of age.
We selected the most efficient gRNA among 5 tested gRNA sequences, as described in Leiria et al.28. As described in this previous publication, we selected the gRNA targeting exon 1 of the mouse Alox12 gene. This gRNA was constructed into the 1179_pAAV-U6-BbsI-gRNA-CB-EmGFP plasmid (Addgene plasmid #89060). The Alox12 gRNA or empty vector were packaged in AAV2/8 particles and then bilaterally injected into both brown adipose tissue lobes of the obese UCP1CRE/Cas9 mice described above. We injected 40 μl per mouse (20 μl in one lobe of brown fat). For the injection, mice were anesthetized with inhalation of isoflurane, then a small incision was made at the interscapular area. After the injections, the incision area was immediately closed and sutured. The animals were put on a heating pad following the surgery until complete recovery and then were housed individually in clean cages. There was a 2-week rest period between the surgery and the beginning of the experimental procedures (i.e., cold (5°C) exposure) in these mice. Using this approach, the Ucp1CRE Alox12 KD obese mice or empty vector (EV) obese mice were created. The efficiency of the 12-LOX deletion was confirmed by Western blot of BAT.
Study with human subjects treated with Mirabegron
Human plasma was collected as part of a previous clinical study52 and was analyzed retrospectively. Twelve healthy individuals (male, age: 22.2 +/− 0.6 years; BMI: 22.7 +/− 0.5 kg/m2) were administered a single dose of placebo or mirabegron (200mg) followed by a blood draw 3.5 hours later. After 28.1 ± 7.4 days of the first administration, the same individuals were given the opposite treatment followed by a blood draw 3.5 hours later. We finally excluded one of the twelve subjects for this analysis, since the subject did not participate in the study for the placebo day. Plasma samples stored at −80°C were subjected to LC-MS/MS analysis as described above. BAT activity was defined via PET-CT as described52.
Statistics
No statistical method was used to predetermine sample size. All statistics were calculated with GraphPad Prism. Unpaired Student’s t tests were performed to compare only 2 groups and One-Way ANOVA followed by a Tukey’s post-hoc test was performed to compare 3 or more groups. Two-way ANOVA followed by a Tukey’s post-hoc test was performed to compare 4 groups for IPGTT experiment. Grubbs’ method was used to identified outliers. For BMDM experiments, the Shapiro-Wilk test was used to define normality and equal variance. In the case of sample normality and equal variances, paired parametric 1-way ANOVA followed by Fisher’s LSD test was used. For comparing human plasma lipids between placebo and mirabegron treated group, Paired t test was used. For the calculation of the relationship between human BAT activity and plasma lipids, we used a linear mixed model. P values less than 0.05 were considered statistically significant.
Extended Data
Extended Data Fig. 1. Cold exposure reduces body weight, inflammation and insulin resistance in obese mice, related to Fig. 1.
(a) C57BL6/J male mice were fed with normal chow (NC) or high-fat (HF) diet at room temperature for 14 weeks. The mice were then put in thermoneutral temperature (30 °C, TN) or cold (5 °C) for 7 days. Plasma levels of IFNγ, IL-6 and IL-1β at day 7 following TN or cold exposure (related to Fig. 1, n = 5 biologically independent animals per group, from 1 independent experiment). (b-e) C57BL6/J female mice were fed with normal chow (NC) or high-fat (HF) diet at room temperature for 19 weeks. The mice were then put in thermoneutral temperature (30 °C, TN) or cold (5 °C) for 7 days. (b) Body weight on day 0 or day 7 following TN or cold exposure (n = 5 biologically independent animals for NC-TN, NC-cold and HF-cold, n = 6 for HF-TN, from 1 independent experiment). (c) Total caloric intake during the exposure period (n = 5 biologically independent animals for NC-TN, NC-cold and HF-cold, n = 6 for HF-TN, from 1 independent experiment). (d) Fasting blood glucose, plasma insulin and homeostatic model assessment of insulin resistance (HOMA-IR) (n = 5 biologically independent animals for NC-TN, NC-cold and HF-cold, n = 6 for HF-TN, from 1 independent experiment). (e) Plasma levels of TNF-α (n = 5 biologically independent animals per group, from 1 independent experiment, statistical significance was determined by two-tailed unpaired Student’s t-test). One-Way ANOVA followed by a Tukey’s post hoc test. Data are presented as mean ± SEM.
Extended Data Fig. 2. Two days of cold exposure reduces insulin resistance and inflammation in DIO mice, related to Fig. 1.

C57BL6/J male mice were fed with normal chow (NC) or high-fat (HF) diet at room temperature for 14 weeks to create DIO mice. (a-f) The DIO mice were exposed to thermoneutral (30 °C, TN) or cold (5 °C) conditions for 2 days. (a) Body weight on day 0 or day 2 following TN or cold exposure (n = 5 biologically independent animals for NC-TN and NC-cold, n = 10 for HF-TN and HF-cold, from 2 independent experiments). (b) Total caloric intake during the exposure period (n = 5 biologically independent animals for NC-TN and NC-cold, n = 10 for HF-TN and HF-cold, from 2 independent experiments). (c) Tissue weights at the end of the exposure period (epiWAT, ingWAT, Liver, Muscle: n = 5 biologically independent animals for NC-TN and NC-cold, n = 10 for HF-TN and HF-cold, from 2 independent experiments; BAT: n = 5 per group, from 1 independent experiment). (d) Fasting blood glucose, plasma insulin and homeostatic model assessment of insulin resistance (HOMA-IR) (n = 5 biologically independent animals for NC-TN and NC-cold, n = 10 for HF-TN and HF-cold, from 2 independent experiments). (e) Plasma levels of TNF-α (n = 5 biologically independent animals per group, from 1 independent experiment). (f) Plasma leptin levels (n = 5 biologically independent animals per group, from 1 independent experiment). (g-k) The DIO mice fed a HF diet for 15 weeks were treated with CL316243 (1 mg/kg/day, daily, i.p) for 9 days. (g, h) Body weight on day 0 and day 9 (n = 5 biologically independent animals per group, from 1 independent experiment). (i) Total caloric intake between day 0 and day 9 (n = 5 biologically independent animals per group, from 1 independent experiment). (j) Glucose levels during IPGTT after 7 days of CL316243 treatment (n = 5 biologically independent animals per group, from 1 independent experiment, Two-Way ANOVA followed by a Tukey’s post hoc). (k) Plasma TNF-α levels in mice treated with CL316243 for 9 days (n = 5 biologically independent animals for Vehicle, n = 6 for CL316243, from 1 independent experiment). Two-tailed Unpaired Student’s t-tests were performed to compare only 2 groups and One-Way ANOVA followed by a Tukey’s post hoc test was performed to compare 4 groups. Data are presented as mean ± SEM.
Extended Data Fig. 3. Cold does not resolve inflammation in white fat of DIO mice, related to Fig. 2.

C57BL6/J male mice were fed with normal chow (NC) or high-fat (HF) diet at room temperature for 14 weeks. The mice were then put in thermoneutral temperature (30 °C, TN) or cold (5 °C) for 7 days. (a) Relative mRNA expression of proinflammatory and NLRP3 inflammasome-related genes in ingWAT (n = 5 biologically independent animals per group, from 1 independent experiment). (b) Representative image of F4/80 staining of epiWAT sections from each group (Scale bar=100 μm) (n = 5 biologically independent animals for NC-TN, NC-cold and HF-cold, n = 4 for HF-TN, from 1 independent experiment). (c) The number of crown-like structures in epiWAT was determined by counting F4/80 positive areas per mm2 (n = 5 biologically independent animals for NC-TN, NC-cold and HF-cold, n = 4 for HF-TN, from 1 independent experiment). (d) The percentage of CD11c+ cells or CD206+ cells within the CD45+ F4/80+ population from ingWAT of DIO mice (n = 4 biologically independent animals per group, from 1 independent experiment). (e, f) Gating strategy for identification of CD11c+ and CD206+ cells in the epiWAT, ingWAT and BAT (e) and in the liver (f). One-Way ANOVA followed by a Tukey’s post hoc test. Data are presented as mean ± SEM.
Extended Data Fig. 4. Cold-induced resolution of inflammation precedes changes in lipid accumulation in the liver of DIO mice, related to Fig. 2.
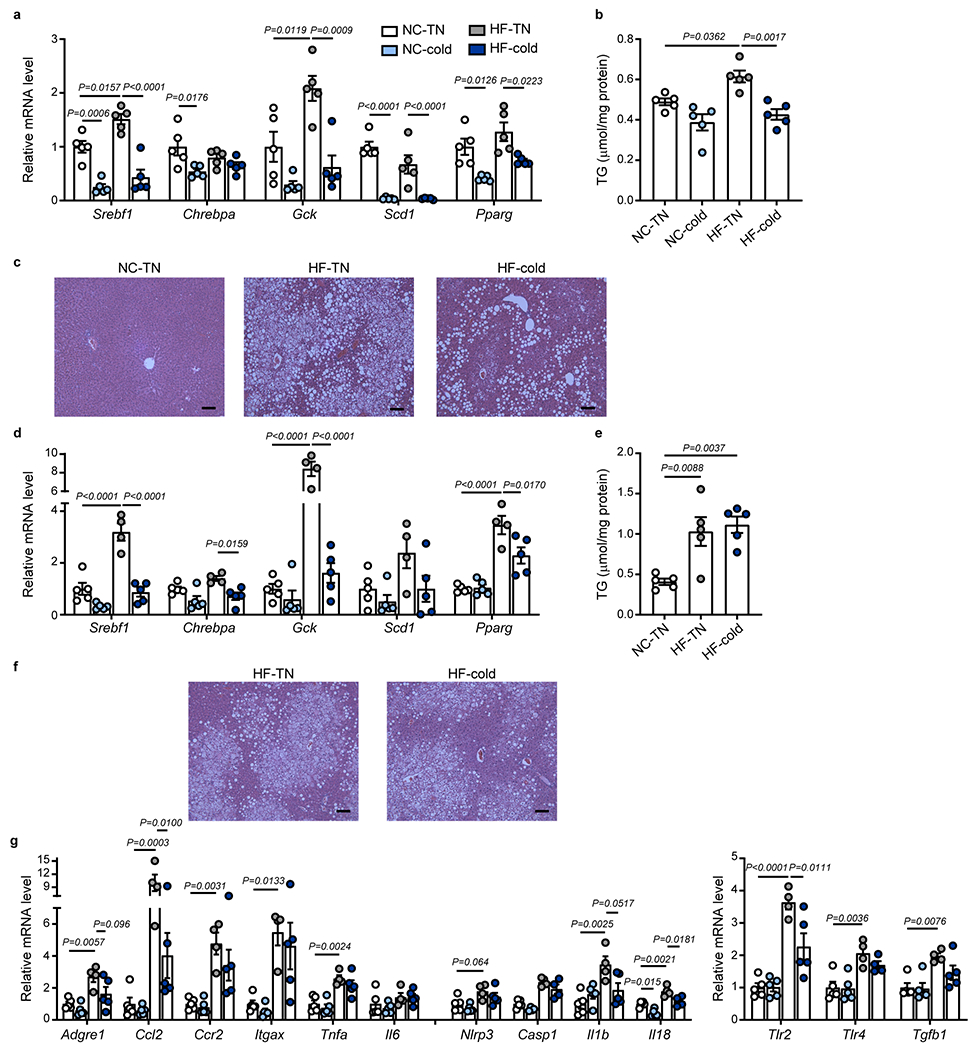
(a-c) C57BL6/J male mice were fed with normal chow (NC) or high-fat (HF) diet at room temperature for 14 weeks. The mice were then exposed to thermoneutral temperature (30 °C, TN) or cold (5 °C) for 7 days. (a) Relative mRNA expression of lipogenesis-related genes in the liver (n = 5 biologically independent animals per group, from 1 independent experiment). (b) Liver TG levels (n = 5 biologically independent animals per group, from 1 independent experiment). (c) Representative images of hematoxylin and eosin (H&E) staining of liver sections from NC-TN, HF-TN and HF-cold groups (Scale bar=100 μm). (d-g) C57BL6/J male mice were fed with normal chow (NC) or high-fat (HF) diet at room temperature for 14 weeks. The mice were then put in thermoneutral temperature (30 °C, TN) or cold (5 °C) for 2 days. (d) Relative mRNA expression of lipogenesis-related genes in the liver (n = 5 biologically independent animals for NC-TN and NC-cold and HF-cold, n = 4 for HF-TN, from 1 independent experiment). (e) Liver TG levels (n = 5 biologically independent animals per group, from 1 independent experiment). (f) Representative images of hematoxylin and eosin (H&E) staining of liver sections from HF-TN and HF-cold groups (Scale bar=100 μm). (g) Relative mRNA expression of proinflammatory, NLRP3 inflammasome-related- and fibrosis-related genes in the liver (n = 5 biologically independent animals for NC-TN, NC-cold and HF-cold, n = 4 for HF-TN, Casp1 NC-cold, Casp1 HF-cold, Il18 HF-cold, Tlr4 HF-cold, from 1 independent experiment). One-Way ANOVA followed by a Tukey’s post hoc test. Data are presented as mean ± SEM.
Extended Data Fig. 5. Identification and quantification of maresin pathway products in BAT and liver, related to Fig. 3.

(a, d) MRM peaks (top) and MS/MS spectra with diagnostic ions labeled (bottom) of authentic MaR2 standard (blue) and of MaR2 and a structural isomer (denoted isomer II, red) identified in a selected sample from BAT (a) and liver (d) of 14 weeks high-fat (HF)-fed mice exposed to cold (5 °C) or thermoneutral (30 °C, TN) conditions for 7 days. (b, c) Quantification of 14-HDHA, MaR2, and MaR2 isomer II in BAT of C57BL6/J mice fed a high-fat diet (HF; b; normalized to protein concentration; n = 5 biologically independent animals per group, from 1 independent experiment) or normal chow (NC; 14 weeks; c; n = 5 biologically independent animals for NC-TN and n = 4 for NC-cold, from 1 independent experiment) exposed to thermoneutral temperature (30 °C, TN) or cold (5 °C) for 7 days. ND: not detected. (e, f) Quantification of 14-HDHA, MaR2, and MaR2 isomer II in the liver of C57BL6/J mice fed HF (e; normalized to protein concentration; n = 5 biologically independent animals per group, except n = 4 for 14-HDHA HF-cold, from 1 independent experiment) or NC (f; n = 5 biologically independent animals per group, from 1 independent experiment) exposed to thermoneutral temperature (30 °C, TN) or cold (5 °C) for 7 days. (g) Quantification of 14-HDHA, MaR2, and MaR2 Isomer II (normalized to protein concentration) in the liver of HF-fed (15 weeks) male C57BL6/J mice treated with vehicle or CL316243 (1 mg/kg/day, daily i.p.) for 9 days (n = 5 biologically independent animals per group, from 1 independent experiment). Two-tailed Unpaired Student’s t-tests. Data are presented as mean ± SEM.
Extended Data Fig. 6. Identification of maresin pathway products in ingWAT of obese mice exposed to cold and in plasma of mice with BAT removal, related to Fig. 4 and Fig. 5.

(a) Relative expression of Ucp1 mRNA in ingWAT of HF-fed (14 weeks) C57BL6/J mice exposed to TN or cold for 7 days (n = 5 biologically independent animals per group, from 1 independent experiment). (b, c) Quantification of 14-HDHA, MaR1, and MaR2 in ingWAT and normalized to tissue weight (n = 6 biologically independent animals for HF-TN, n = 5 for HF-cold, from 1 independent experiment; b) or protein concentration (n = 6 biologically independent animals for HF-TN, n = 5 for HF-cold, from 1 independent experiment; c). (d, e) MRM peaks (d) and MS/MS spectra with diagnostic ions labeled (e) of authentic MaR2 standard and of two MaR2 isomers (denoted isomer I and II) identified in a selected sample of plasma of HF-fed mice following BAT removal. ND: not detected. Two-tailed Unpaired Student’s t-tests. Data are presented as mean ± SEM.
Extended Data Fig. 7. Identification of maresin pathway products in plasma of humans and expression of 12-LOX and sEH in human brown adipocytes, related to Fig. 6.
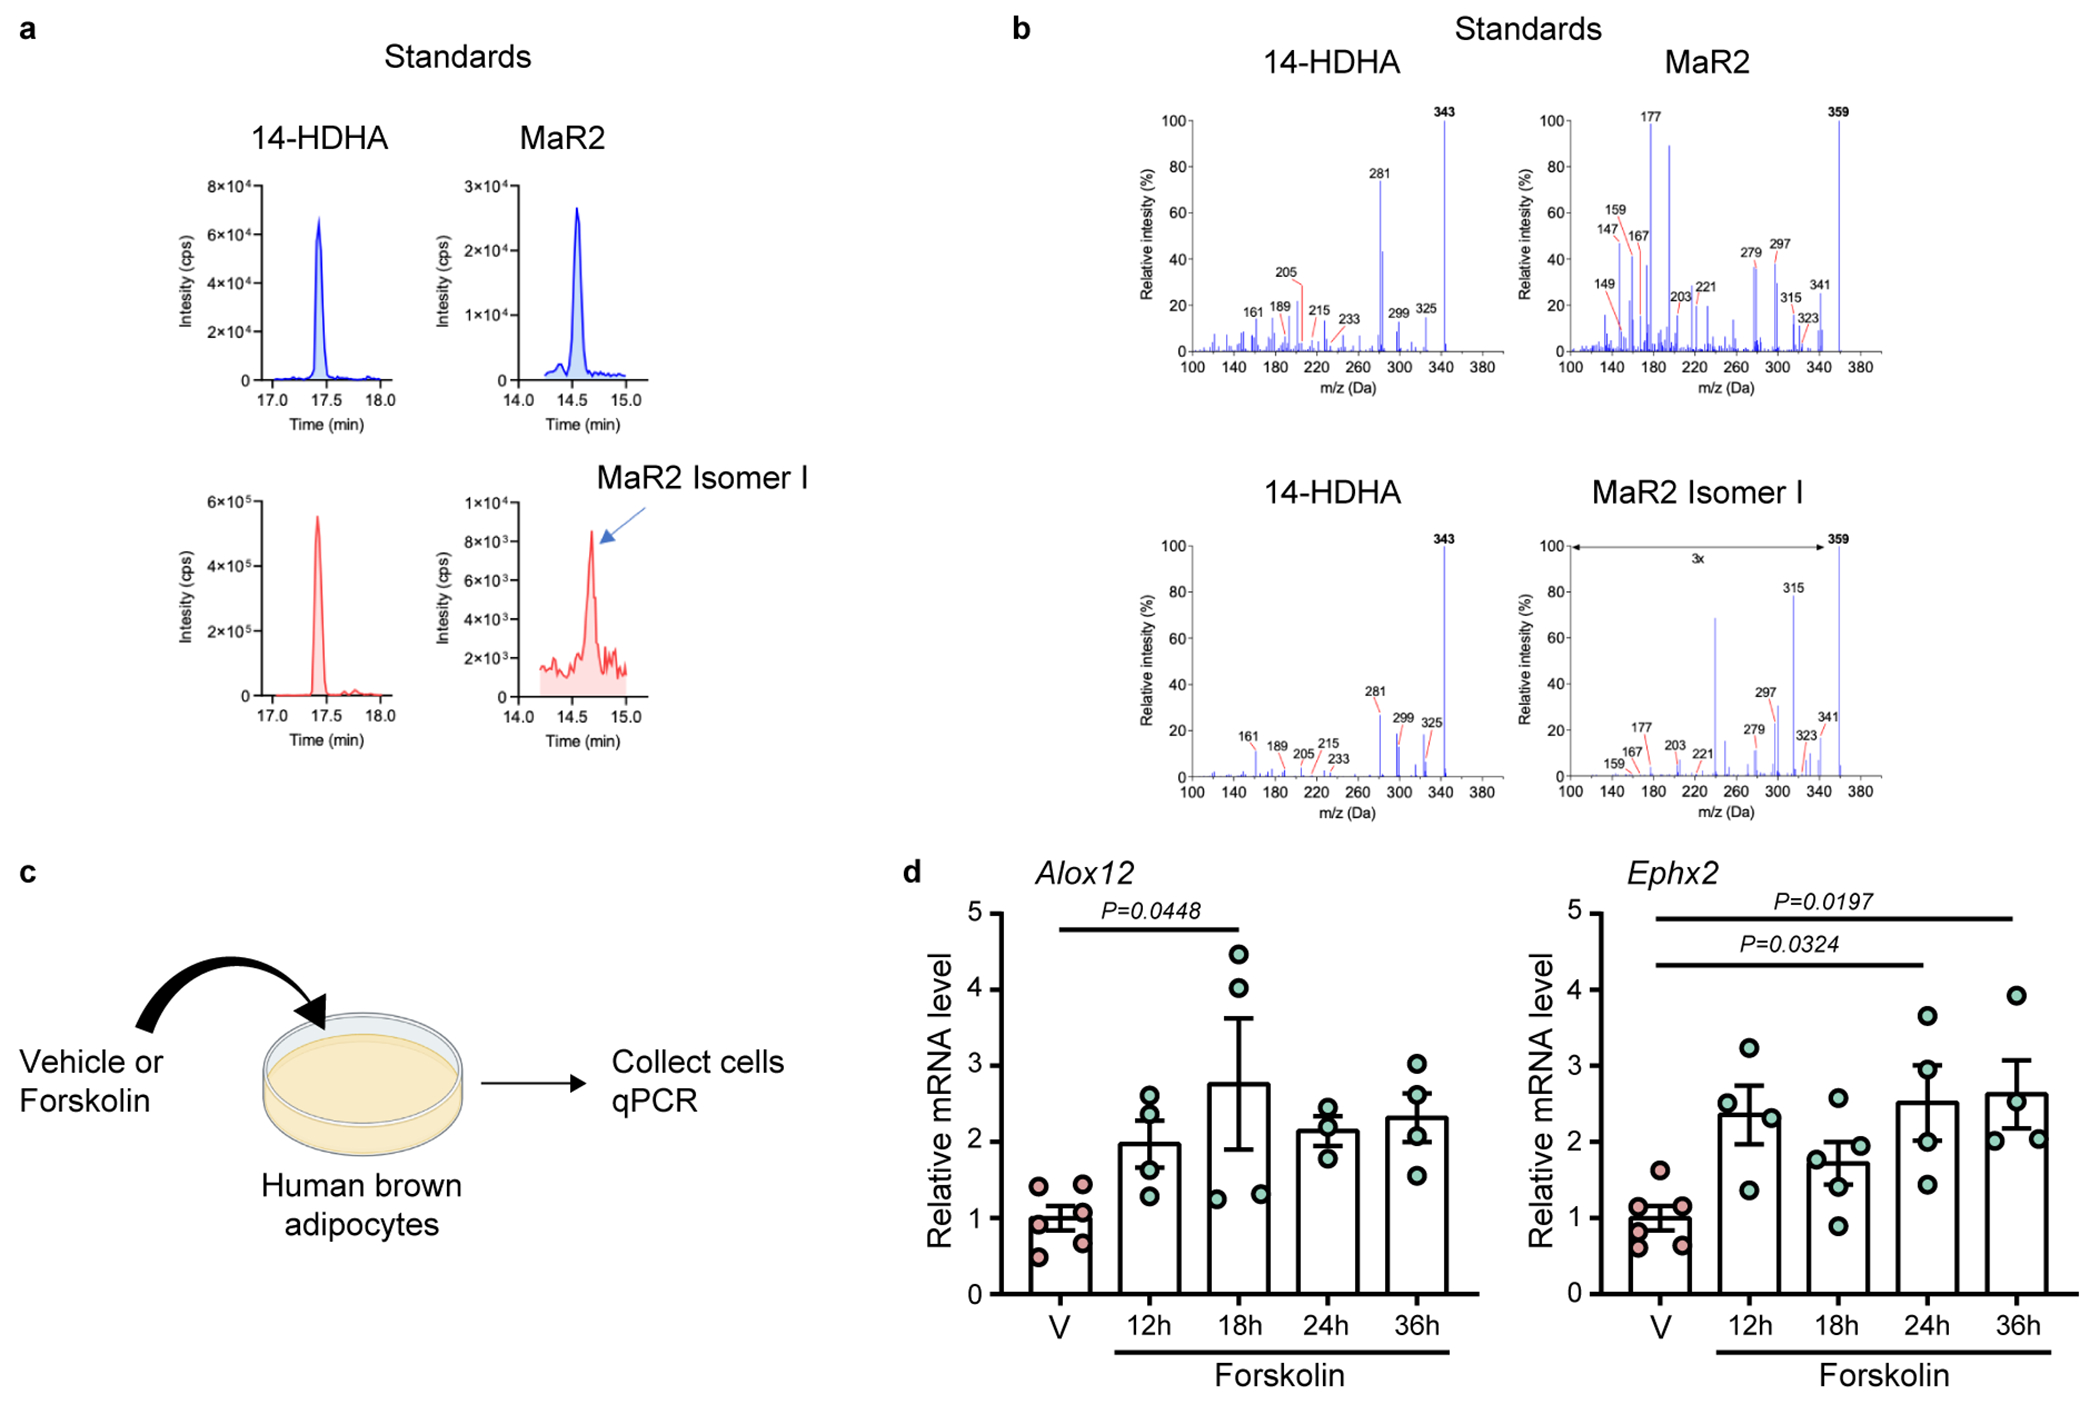
(a, b) MRM peaks (a) and MS/MS spectra with diagnostic ions labeled (b) of authentic 14-HDHA and MaR2 standards (top) and of 14-HDHA and MaR2 Isomer I identified in a selected sample of human plasma (bottom) following mirabegron administration. (c) Schematic of the treatment of human brown adipocytes with vehicle control or Forskolin (10μM), followed by the collection of the cells for qPCR (d) Relative mRNA expression of Alox12 and Ephx2 in human brown adipocytes treated with vehicle or Forskolin for indicated times (Alox12: n = 6 biologically independent cells for Vehicle, n = 4 biologically independent cells for 12 h, 18 h and 36 h, n = 3 biologically independent cells for 24 h, Ephx2: n = 6 biologically independent cells for Vehicle, n = 4 biologically independent cells for 12 h, 24 h and 36 h, n = 5 biologically independent cells for 18 h). One-Way ANOVA followed by a Tukey’s post hoc test. Data are presented as mean ± SEM.
Extended Data Fig. 8. MaR2 resolves inflammation systemically and in the liver of DIO mice, related to Fig. 8.

(a) Schematic of the experimental design of MaR2 treatment. C57BL6/J male mice were fed with a high-fat (HF) diet at room temperature for 14 weeks. Then the mice were administered vehicle or MaR2 (5 μg/kg/day; daily i.p.) for 28 days. (b) Body weight at day 0 and day 28 post-treatment (n = 5 biologically independent animals per group, from 1 independent experiment). (c) Plasma TNF-α levels post-treatment (n = 5 biologically independent animals per group, from 1 independent experiment). (d) Relative mRNA expression of proinflammatory, NLRP3-inflammasome-related- and fibrosis-related genes in the liver post-treatment (n = 5 biologically independent animals per group, from 1 independent experiment). (e) Schematic of the experimental design of MaR2 treatment. C57BL6/J male mice were fed with a high-fat (HF) diet at room temperature for 16 weeks. Then, the mice were administered vehicle or MaR2 (10 μg/kg/day; daily i.p.) for 26 days. (f) Body weight at day 0 and day 25 post-treatment, and the body weight change from baseline (n = 6 biologically independent animals per group, from 1 independent experiment). (g) Total caloric intake (n = 6 biologically independent animals per group, from 1 independent experiment). (h, i) Liver weight and TG levels in liver (n = 6 biologically independent animals per group, from 1 independent experiment). (j) Relative mRNA expression of lipogenesis-related genes in liver (n = 6 biologically independent animals per group, from 1 independent experiment). (k) Representative liver H&E staining from each group (Scale bar=100 μm). (l) Plasma levels of ALT in mice treated with vehicle or MaR2 (n = 6 biologically independent animals per group, from 1 independent experiment). (m, n) Relative mRNA expression of inflammation and NLRP3-inflammasome-related genes in the BAT (n = 6 biologically independent animals per group, from 1 independent experiment, m) and epiWAT (n = 5 for Vehicle, except Casp1 n = 4, n = 6 for MaR2, from 1 independent experiment, n) of mice treated with vehicle or MaR2. Two-tailed Unpaired Student’s t-tests. Data are presented as mean ± SEM.
Extended Data Fig. 9. Absorption kinetics of d5-MaR2 and regulation of liver monocytes/macrophages by MaR2, related to Fig. 8.

(a) Recovery of d5-MaR2 spiked into murine plasma and subjected to solid phase extraction and LC-MS/MS analysis, with mean d5-MaR2 recovered indicated along with the calculated coefficient of variation (CV) from 4 individual replicates. (b) Schematic of the administration of d5-MaR2 to male mice fed a high-fat diet for 15 weeks, followed by collection of blood at the indicated time points. The red circle indicates the position of the deuterium (D) atoms at the omega end of MaR2. (c) Quantification of d5-MaR2 in plasma after intraperitoneal administration to obese mice, as determined by LC-MS/MS (n = 3 biologically independent animals per group, from 1 independent experiment, Kruskal-Wallis test, followed by Dunn’s multiple comparisons post-tests). (d) Flow cytometry gating strategy of monocyte and macrophage populations in the liver. Representative dot plots showing Single cells, Live cells and CD45 + cells (related to Fig. 8e). (e, f) Quantification of monocyte (e) and macrophage (f) populations in the liver of mice treated with vehicle or MaR2 (10 μg/kg/day; daily i.p.) for 5 days (related to Fig. 8; n = 5 biologically independent animals per group, from 1 independent experiment) (g) Primary rat Kupffer cells were incubated with vehicle or MaR2 (50 nM) for 18 hours, then RNA was harvested for qPCR to measure relative mRNA expression of proinflammatory, NLRP3-inflammasome-related- and fibrosis-related genes (n = 3 technical replicates per group). Two-tailed Unpaired Student’s t-tests, except c. Data are presented as mean ± SEM.
Supplementary Material
ACKNOWLEDGEMENTS
This work was supported in part by US National Institutes of Health (NIH) grants R01DK122808 (to Y.-H.T. and M.S.), R01DK077097 and R01DK102898 (to Y.-H.T.), R01HL106173 (to M.S.), R01DK099511 and R01DK112283 (to L.J.G.), P30DK036836 (to Joslin Diabetes Center’s Diabetes Research Center, DRC) and by US Army Medical Research grant W81XWH-17-1-0428 (to Y.-H.T.). S.S. was supported by the Manpei Suzuki Diabetes Foundation in Japan. G.P. was supported by grant 2019/20554-7 from The São Paulo Research Foundation, FAPESP. L.O.L. was supported by an American Diabetes Association post-doctoral fellowship (1-16-PDF-063) and by the Sao Paulo Research Foundation (FAPESP) grants 2017/02684 and 2019/26008-4. We appreciate Matthew Lynes, Farnaz Shamsi and Yang Zhang for providing general technical support and helpful advice. We thank Shifen Dong for helping with animal work, and Allen Clermont, A. Dean, and Megan Halpin of the Joslin DRC Animal Physiology core for assisting with the studies using the diurnal incubators. We thank Hirokazu Takahashi for providing helpful advice related to the clinical aspects of this work. We would like to thank the laboratory of Bruce Hammock for providing the sEH antibody. All the schematics of the experimental design were created with BioRender.com.
Footnotes
Competing Interests Statement
M.S. and Y.-H.T. are inventors of a pending provisional patent application related to maresin 2 and metabolic therapeutics.
Data availability
The authors declare that the data supporting the findings of this study are available within the paper and the Supplementary Information files. The raw data that support the findings of this study are available as source data files.
References
- 1.Blüher M Obesity: global epidemiology and pathogenesis. Nature reviews. Endocrinology 15, 288–298 (2019). [DOI] [PubMed] [Google Scholar]
- 2.Weisberg SP, et al. Obesity is associated with macrophage accumulation in adipose tissue. The Journal of clinical investigation 112, 1796–1808 (2003). [DOI] [PMC free article] [PubMed] [Google Scholar]
- 3.Romeo GR, Lee J & Shoelson SE Metabolic syndrome, insulin resistance, and roles of inflammation--mechanisms and therapeutic targets. Arteriosclerosis, thrombosis, and vascular biology 32, 1771–1776 (2012). [DOI] [PMC free article] [PubMed] [Google Scholar]
- 4.Hotamisligil GS, Arner P, Caro JF, Atkinson RL & Spiegelman BM Increased adipose tissue expression of tumor necrosis factor-alpha in human obesity and insulin resistance. The Journal of clinical investigation 95, 2409–2415 (1995). [DOI] [PMC free article] [PubMed] [Google Scholar]
- 5.Esser N, Legrand-Poels S, Piette J, Scheen AJ & Paquot N Inflammation as a link between obesity, metabolic syndrome and type 2 diabetes. Diabetes research and clinical practice 105, 141–150 (2014). [DOI] [PubMed] [Google Scholar]
- 6.Serhan CN Pro-resolving lipid mediators are leads for resolution physiology. Nature 510, 92–101 (2014). [DOI] [PMC free article] [PubMed] [Google Scholar]
- 7.Serhan CN, et al. Macrophage proresolving mediator maresin 1 stimulates tissue regeneration and controls pain. FASEB journal : official publication of the Federation of American Societies for Experimental Biology 26, 1755–1765 (2012). [DOI] [PMC free article] [PubMed] [Google Scholar]
- 8.Hellmann J, et al. Biosynthesis of D-Series Resolvins in Skin Provides Insights into their Role in Tissue Repair. J Invest Dermatol 138, 2051–2060 (2018). [DOI] [PMC free article] [PubMed] [Google Scholar]
- 9.Spite M, Claria J & Serhan CN Resolvins, specialized proresolving lipid mediators, and their potential roles in metabolic diseases. Cell metabolism 19, 21–36 (2014). [DOI] [PMC free article] [PubMed] [Google Scholar]
- 10.Pal A, Gowdy KM, Oestreich KJ, Beck M & Shaikh SR Obesity-Driven Deficiencies of Specialized Pro-resolving Mediators May Drive Adverse Outcomes During SARS-CoV-2 Infection. Frontiers in immunology 11, 1997 (2020). [DOI] [PMC free article] [PubMed] [Google Scholar]
- 11.Serhan CN & Levy BD Resolvins in inflammation: emergence of the pro-resolving superfamily of mediators. The Journal of clinical investigation 128, 2657–2669 (2018). [DOI] [PMC free article] [PubMed] [Google Scholar]
- 12.Serhan CN, et al. Maresins: novel macrophage mediators with potent antiinflammatory and proresolving actions. The Journal of experimental medicine 206, 15–23 (2009). [DOI] [PMC free article] [PubMed] [Google Scholar]
- 13.Dalli J, et al. The novel 13S,14S-epoxy-maresin is converted by human macrophages to maresin 1 (MaR1), inhibits leukotriene A4 hydrolase (LTA4H), and shifts macrophage phenotype. FASEB J 27, 2573–2583 (2013). [DOI] [PMC free article] [PubMed] [Google Scholar]
- 14.Deng B, et al. Maresin biosynthesis and identification of maresin 2, a new anti-inflammatory and pro-resolving mediator from human macrophages. PloS one 9, e102362 (2014). [DOI] [PMC free article] [PubMed] [Google Scholar]
- 15.Han YH, et al. A maresin 1/RORα/12-lipoxygenase autoregulatory circuit prevents inflammation and progression of nonalcoholic steatohepatitis. The Journal of clinical investigation 129, 1684–1698 (2019). [DOI] [PMC free article] [PubMed] [Google Scholar]
- 16.Laiglesia LM, et al. Maresin 1 mitigates liver steatosis in ob/ob and diet-induced obese mice. International journal of obesity (2005) 42, 572–579 (2018). [DOI] [PubMed] [Google Scholar]
- 17.Jung TW, Kim HC, Abd El-Aty AM & Jeong JH Maresin 1 attenuates NAFLD by suppression of endoplasmic reticulum stress via AMPK-SERCA2b pathway. The Journal of biological chemistry 293, 3981–3988 (2018). [DOI] [PMC free article] [PubMed] [Google Scholar]
- 18.Chiang N, Libreros S, Norris PC, de la Rosa X & Serhan CN Maresin 1 activates LGR6 receptor promoting phagocyte immunoresolvent functions. The Journal of clinical investigation 129, 5294–5311 (2019). [DOI] [PMC free article] [PubMed] [Google Scholar]
- 19.Hanssen MJ, et al. Short-term cold acclimation improves insulin sensitivity in patients with type 2 diabetes mellitus. Nature medicine 21, 863–865 (2015). [DOI] [PubMed] [Google Scholar]
- 20.Iwen KA, et al. Cold-Induced Brown Adipose Tissue Activity Alters Plasma Fatty Acids and Improves Glucose Metabolism in Men. The Journal of clinical endocrinology and metabolism 102, 4226–4234 (2017). [DOI] [PubMed] [Google Scholar]
- 21.Bartelt A, et al. Brown adipose tissue activity controls triglyceride clearance. Nature medicine 17, 200–205 (2011). [DOI] [PubMed] [Google Scholar]
- 22.Ouellet V, et al. Brown adipose tissue oxidative metabolism contributes to energy expenditure during acute cold exposure in humans. The Journal of clinical investigation 122, 545–552 (2012). [DOI] [PMC free article] [PubMed] [Google Scholar]
- 23.van der Lans AA, et al. Cold acclimation recruits human brown fat and increases nonshivering thermogenesis. The Journal of clinical investigation 123, 3395–3403 (2013). [DOI] [PMC free article] [PubMed] [Google Scholar]
- 24.Yoneshiro T, et al. Recruited brown adipose tissue as an antiobesity agent in humans. The Journal of clinical investigation 123, 3404–3408 (2013). [DOI] [PMC free article] [PubMed] [Google Scholar]
- 25.Becher T, et al. Brown adipose tissue is associated with cardiometabolic health. Nature medicine 27, 58–65 (2021). [DOI] [PMC free article] [PubMed] [Google Scholar]
- 26.Villarroya F, Cereijo R, Villarroya J & Giralt M Brown adipose tissue as a secretory organ. Nature reviews. Endocrinology 13, 26–35 (2017). [DOI] [PubMed] [Google Scholar]
- 27.Scheele C & Wolfrum C Brown Adipose Crosstalk in Tissue Plasticity and Human Metabolism. Endocrine reviews 41, 53–65 (2020). [DOI] [PMC free article] [PubMed] [Google Scholar]
- 28.Leiria LO, et al. 12-Lipoxygenase Regulates Cold Adaptation and Glucose Metabolism by Producing the Omega-3 Lipid 12-HEPE from Brown Fat. Cell metabolism 30, 768-783.e767 (2019). [DOI] [PMC free article] [PubMed] [Google Scholar]
- 29.Lynes MD, et al. The cold-induced lipokine 12,13-diHOME promotes fatty acid transport into brown adipose tissue. Nature medicine 23, 631–637 (2017). [DOI] [PMC free article] [PubMed] [Google Scholar]
- 30.Hotamisligil GS, Budavari A, Murray D & Spiegelman BM Reduced tyrosine kinase activity of the insulin receptor in obesity-diabetes. Central role of tumor necrosis factor-alpha. The Journal of clinical investigation 94, 1543–1549 (1994). [DOI] [PMC free article] [PubMed] [Google Scholar]
- 31.Miyazaki Y, Pipek R, Mandarino LJ & DeFronzo RA Tumor necrosis factor alpha and insulin resistance in obese type 2 diabetic patients. International journal of obesity and related metabolic disorders : journal of the International Association for the Study of Obesity 27, 88–94 (2003). [DOI] [PubMed] [Google Scholar]
- 32.Olson NC, et al. Circulating levels of TNF-α are associated with impaired glucose tolerance, increased insulin resistance, and ethnicity: the Insulin Resistance Atherosclerosis Study. The Journal of clinical endocrinology and metabolism 97, 1032–1040 (2012). [DOI] [PMC free article] [PubMed] [Google Scholar]
- 33.Plomgaard P, et al. Associations between insulin resistance and TNF-alpha in plasma, skeletal muscle and adipose tissue in humans with and without type 2 diabetes. Diabetologia 50, 2562–2571 (2007). [DOI] [PubMed] [Google Scholar]
- 34.Ayina CN, et al. Association of serum leptin and adiponectin with anthropomorphic indices of obesity, blood lipids and insulin resistance in a Sub-Saharan African population. Lipids in health and disease 15, 96 (2016). [DOI] [PMC free article] [PubMed] [Google Scholar]
- 35.Kennedy A, et al. The metabolic significance of leptin in humans: gender-based differences in relationship to adiposity, insulin sensitivity, and energy expenditure. The Journal of clinical endocrinology and metabolism 82, 1293–1300 (1997). [DOI] [PubMed] [Google Scholar]
- 36.Francisco V, et al. Obesity, Fat Mass and Immune System: Role for Leptin. Frontiers in physiology 9, 640 (2018). [DOI] [PMC free article] [PubMed] [Google Scholar]
- 37.Santos-Alvarez J, Goberna R & Sánchez-Margalet V Human leptin stimulates proliferation and activation of human circulating monocytes. Cellular immunology 194, 6–11 (1999). [DOI] [PubMed] [Google Scholar]
- 38.Zhao J, Unelius L, Bengtsson T, Cannon B & Nedergaard J Coexisting beta-adrenoceptor subtypes: significance for thermogenic process in brown fat cells. The American journal of physiology 267, C969–979 (1994). [DOI] [PubMed] [Google Scholar]
- 39.Ghorbani M, et al. Anti diabetic effect of CL 316,243 (a beta3-adrenergic agonist) by down regulation of tumour necrosis factor (TNF-alpha) expression. PloS one 7, e45874 (2012). [DOI] [PMC free article] [PubMed] [Google Scholar]
- 40.Himms-Hagen J, et al. Effect of CL-316,243, a thermogenic beta 3-agonist, on energy balance and brown and white adipose tissues in rats. The American journal of physiology 266, R1371–1382 (1994). [DOI] [PubMed] [Google Scholar]
- 41.Vandanmagsar B, et al. The NLRP3 inflammasome instigates obesity-induced inflammation and insulin resistance. Nature medicine 17, 179–188 (2011). [DOI] [PMC free article] [PubMed] [Google Scholar]
- 42.Kazankov K, et al. The role of macrophages in nonalcoholic fatty liver disease and nonalcoholic steatohepatitis. Nature reviews. Gastroenterology & hepatology 16, 145–159 (2019). [DOI] [PubMed] [Google Scholar]
- 43.Xu H, et al. Chronic inflammation in fat plays a crucial role in the development of obesity-related insulin resistance. Journal of Clinical Investigation 112, 1821–1830 (2003). [DOI] [PMC free article] [PubMed] [Google Scholar]
- 44.Zatterale F, et al. Chronic Adipose Tissue Inflammation Linking Obesity to Insulin Resistance and Type 2 Diabetes. Frontiers in physiology 10, 1607 (2019). [DOI] [PMC free article] [PubMed] [Google Scholar]
- 45.Lumeng CN, Bodzin JL & Saltiel AR Obesity induces a phenotypic switch in adipose tissue macrophage polarization. The Journal of clinical investigation 117, 175–184 (2007). [DOI] [PMC free article] [PubMed] [Google Scholar]
- 46.Seki E, et al. TLR4 enhances TGF-beta signaling and hepatic fibrosis. Nature medicine 13, 1324–1332 (2007). [DOI] [PubMed] [Google Scholar]
- 47.Yang L & Seki E Toll-like receptors in liver fibrosis: cellular crosstalk and mechanisms. Frontiers in physiology 3, 138 (2012). [DOI] [PMC free article] [PubMed] [Google Scholar]
- 48.Kim WR, Flamm SL, Di Bisceglie AM & Bodenheimer HC Serum activity of alanine aminotransferase (ALT) as an indicator of health and disease. Hepatology (Baltimore, Md.) 47, 1363–1370 (2008). [DOI] [PubMed] [Google Scholar]
- 49.Chen G, Ni Y, Nagata N, Xu L & Ota T Micronutrient Antioxidants and Nonalcoholic Fatty Liver Disease. International journal of molecular sciences 17(2016). [DOI] [PMC free article] [PubMed] [Google Scholar]
- 50.Shamsi F, Wang CH & Tseng YH The evolving view of thermogenic adipocytes - ontogeny, niche and function. Nat Rev Endocrinol 17, 726–744 (2021). [DOI] [PMC free article] [PubMed] [Google Scholar]
- 51.Goldenberg MM Pharmaceutical approval update. P & T : a peer-reviewed journal for formulary management 37, 668–708 (2012). [PMC free article] [PubMed] [Google Scholar]
- 52.Cypess AM, et al. Activation of human brown adipose tissue by a beta3-adrenergic receptor agonist. Cell metabolism 21, 33–38 (2015). [DOI] [PMC free article] [PubMed] [Google Scholar]
- 53.Seidman JS, et al. Niche-Specific Reprogramming of Epigenetic Landscapes Drives Myeloid Cell Diversity in Nonalcoholic Steatohepatitis. Immunity 52, 1057-1074 e1057 (2020). [DOI] [PMC free article] [PubMed] [Google Scholar]
- 54.Daemen S, et al. Dynamic Shifts in the Composition of Resident and Recruited Macrophages Influence Tissue Remodeling in NASH. Cell Rep 34, 108626 (2021). [DOI] [PMC free article] [PubMed] [Google Scholar]
- 55.Jaitin DA, et al. Lipid-Associated Macrophages Control Metabolic Homeostasis in a Trem2-Dependent Manner. Cell 178, 686-698 e614 (2019). [DOI] [PMC free article] [PubMed] [Google Scholar]
- 56.Perugorria MJ, et al. Non-parenchymal TREM-2 protects the liver from immune-mediated hepatocellular damage. Gut 68, 533–546 (2019). [DOI] [PMC free article] [PubMed] [Google Scholar]
- 57.Hou J, et al. TREM2 sustains macrophage-hepatocyte metabolic coordination in nonalcoholic fatty liver disease and sepsis. The Journal of clinical investigation 131(2021). [DOI] [PMC free article] [PubMed] [Google Scholar]
- 58.Deczkowska A, Weiner A & Amit I The Physiology, Pathology, and Potential Therapeutic Applications of the TREM2 Signaling Pathway. Cell 181, 1207–1217 (2020). [DOI] [PubMed] [Google Scholar]
- 59.Hamerman JA, et al. Cutting edge: inhibition of TLR and FcR responses in macrophages by triggering receptor expressed on myeloid cells (TREM)-2 and DAP12. J Immunol 177, 2051–2055 (2006). [DOI] [PubMed] [Google Scholar]
- 60.Turnbull IR, et al. Cutting edge: TREM-2 attenuates macrophage activation. J Immunol 177, 3520–3524 (2006). [DOI] [PubMed] [Google Scholar]
- 61.Wen H, et al. Fatty acid-induced NLRP3-ASC inflammasome activation interferes with insulin signaling. Nature immunology 12, 408–415 (2011). [DOI] [PMC free article] [PubMed] [Google Scholar]
- 62.Wang GX, et al. The brown fat-enriched secreted factor Nrg4 preserves metabolic homeostasis through attenuation of hepatic lipogenesis. Nat Med 20, 1436–1443 (2014). [DOI] [PMC free article] [PubMed] [Google Scholar]
- 63.Thomou T, et al. Adipose-derived circulating miRNAs regulate gene expression in other tissues. Nature 542, 450–455 (2017). [DOI] [PMC free article] [PubMed] [Google Scholar]
- 64.Mills EL, et al. UCP1 governs liver extracellular succinate and inflammatory pathogenesis. Nature metabolism 3, 604–617 (2021). [DOI] [PMC free article] [PubMed] [Google Scholar]
- 65.Qing H, et al. Origin and Function of Stress-Induced IL-6 in Murine Models. Cell (2020). [DOI] [PMC free article] [PubMed] [Google Scholar]
- 66.Simcox J, et al. Global Analysis of Plasma Lipids Identifies Liver-Derived Acylcarnitines as a Fuel Source for Brown Fat Thermogenesis. Cell Metab 26, 509-522 e506 (2017). [DOI] [PMC free article] [PubMed] [Google Scholar]
- 67.Titos E, et al. Signaling and Immunoresolving Actions of Resolvin D1 in Inflamed Human Visceral Adipose Tissue. Journal of immunology (Baltimore, Md. : 1950) 197, 3360–3370 (2016). [DOI] [PMC free article] [PubMed] [Google Scholar]
- 68.Félix-Soriano E, et al. Changes in brown adipose tissue lipid mediator signatures with aging, obesity, and DHA supplementation in female mice. FASEB journal : official publication of the Federation of American Societies for Experimental Biology 35, e21592 (2021). [DOI] [PMC free article] [PubMed] [Google Scholar]
- 69.Serhan CN, et al. Anti-inflammatory actions of neuroprotectin D1/protectin D1 and its natural stereoisomers: assignments of dihydroxy-containing docosatrienes. Journal of immunology (Baltimore, Md. : 1950) 176, 1848–1859 (2006). [DOI] [PubMed] [Google Scholar]
- 70.Shimizu T, Rådmark O & Samuelsson B Enzyme with dual lipoxygenase activities catalyzes leukotriene A4 synthesis from arachidonic acid. Proceedings of the National Academy of Sciences of the United States of America 81, 689–693 (1984). [DOI] [PMC free article] [PubMed] [Google Scholar]
- 71.Musso G, Gambino R, Cassader M, Paschetta E & Sircana A Specialized Proresolving Mediators: Enhancing Nonalcoholic Steatohepatitis and Fibrosis Resolution. Trends in pharmacological sciences 39, 387–401 (2018). [DOI] [PubMed] [Google Scholar]
- 72.Barden A, et al. The effects of alcohol on plasma lipid mediators of inflammation resolution in patients with Type 2 diabetes mellitus. Prostaglandins, leukotrienes, and essential fatty acids 133, 29–34 (2018). [DOI] [PubMed] [Google Scholar]
- 73.Colas RA, Shinohara M, Dalli J, Chiang N & Serhan CN Identification and signature profiles for pro-resolving and inflammatory lipid mediators in human tissue. American journal of physiology. Cell physiology 307, C39–54 (2014). [DOI] [PMC free article] [PubMed] [Google Scholar]
- 74.Gomez EA, et al. Blood pro-resolving mediators are linked with synovial pathology and are predictive of DMARD responsiveness in rheumatoid arthritis. Nature communications 11, 5420 (2020). [DOI] [PMC free article] [PubMed] [Google Scholar]
- 75.López-Vicario C, et al. Leukocytes from obese individuals exhibit an impaired SPM signature. FASEB journal : official publication of the Federation of American Societies for Experimental Biology 33, 7072–7083 (2019). [DOI] [PubMed] [Google Scholar]
- 76.Welty FK, et al. Regression of human coronary artery plaque is associated with a high ratio of (18-hydroxy-eicosapentaenoic acid + resolvin E1) to leukotriene B(4). FASEB journal : official publication of the Federation of American Societies for Experimental Biology 35, e21448 (2021). [DOI] [PMC free article] [PubMed] [Google Scholar]
- 77.Burguillos MA Use of meso-scale discovery™ to examine cytokine content in microglia cell supernatant. Methods in molecular biology (Clifton, N.J.) 1041, 93–100 (2013). [DOI] [PubMed] [Google Scholar]
- 78.Choi SH, et al. Combined adult neurogenesis and BDNF mimic exercise effects on cognition in an Alzheimer’s mouse model. Science (New York, N.Y.) 361(2018). [DOI] [PMC free article] [PubMed] [Google Scholar]
- 79.Dalli J, Colas RA, Walker ME & Serhan CN Lipid Mediator Metabolomics Via LC-MS/MS Profiling and Analysis. Methods in molecular biology (Clifton, N.J.) 1730, 59–72 (2018). [DOI] [PubMed] [Google Scholar]
- 80.Daemen S, Chan MM & Schilling JD Comprehensive analysis of liver macrophage composition by flow cytometry and immunofluorescence in murine NASH. STAR protocols 2, 100511 (2021). [DOI] [PMC free article] [PubMed] [Google Scholar]
- 81.Tseng YH, et al. New role of bone morphogenetic protein 7 in brown adipogenesis and energy expenditure. Nature 454, 1000–1004 (2008). [DOI] [PMC free article] [PubMed] [Google Scholar]
- 82.Xue R, et al. Clonal analyses and gene profiling identify genetic biomarkers of the thermogenic potential of human brown and white preadipocytes. Nature medicine 21, 760–768 (2015). [DOI] [PMC free article] [PubMed] [Google Scholar]
- 83.Kriszt R, et al. Optical visualisation of thermogenesis in stimulated single-cell brown adipocytes. Sci Rep 7, 1383 (2017). [DOI] [PMC free article] [PubMed] [Google Scholar]
- 84.Sansbury BE, et al. Myeloid ALX/FPR2 regulates vascularization following tissue injury. Proceedings of the National Academy of Sciences of the United States of America 117, 14354–14364 (2020). [DOI] [PMC free article] [PubMed] [Google Scholar]
Associated Data
This section collects any data citations, data availability statements, or supplementary materials included in this article.
Supplementary Materials
Data Availability Statement
The authors declare that the data supporting the findings of this study are available within the paper and the Supplementary Information files. The raw data that support the findings of this study are available as source data files.