

Summary
Gustatory information is relayed from the anterior tongue by geniculate ganglion neurons and from the posterior tongue by neurons of the petrosal portion of the jugular/nodose/petrosal ganglion complex. Here, we use in vivo calcium imaging in mice to compare the encoding of taste information in the geniculate and petrosal ganglia, at single-neuron resolution. Our data support an anterior/posterior specialization of taste information coding from the tongue to the ganglia, with petrosal neurons more responsive to umami or bitter and less responsive to sweet or salty stimuli than geniculate neurons. We found that umami (50 mM MPG + 1 mM IMP) promotes salivation when applied to the posterior, but not anterior, tongue. This suggests a functional taste map of the mammalian tongue where the anterior and posterior taste pathways are differentially responsive to specific taste qualities, and differentially regulate downstream physiological functions of taste, such as promoting salivation.
Subject areas: Cellular neuroscience, sensory neuroscience
Graphical abstract
Highlights
-
•
Geniculate and petrosal gustatory neurons respond differentially to taste stimuli
-
•
Petrosal neurons are more likely to respond to bitter or umami taste stimuli
-
•
Umami promotes salivation when applied to the posterior, but not anterior, tongue
-
•
Posterior gustatory neurons may integrate into distinct circuits for salivation
Cellular neuroscience; Sensory neuroscience
Introduction
Edwin Boring’s mis-interpretation of a 1901 study1,2,3 popularized the tongue map2 with discrete regions of taste sensitivity across the tongue surface. This representation persisted in textbooks for decades but was largely discredited by the observation that most taste buds express the full array of taste receptors, irrespective of their position on the tongue.1 However, gustatory papillae of the anterior and posterior tongue are derived from different developmental origins4 and are innervated by separate peripheral sensory afferents.1,5,6,7,8,9,10,11,12
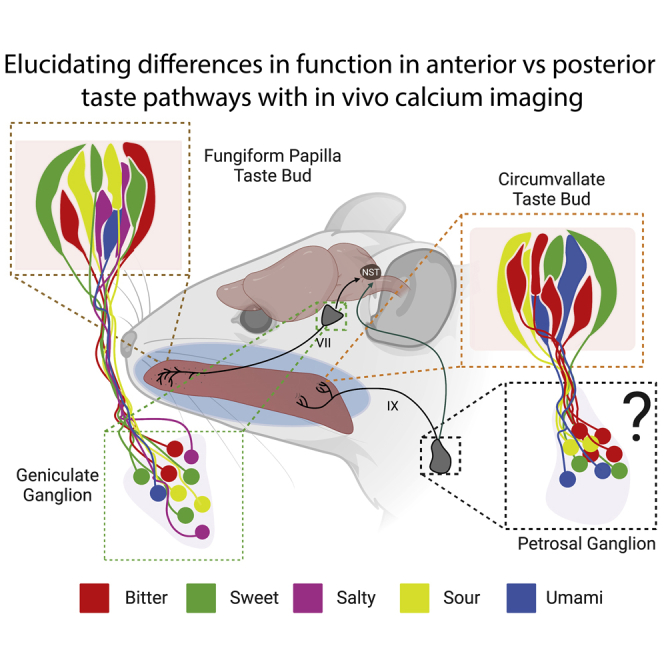
The sense of taste is conveyed by two pairs of peripheral sensory ganglia: the geniculate and the petrosal ganglia (Figure 1A). Geniculate ganglion neurons innervate taste buds in the anterior tongue within the scattered fungiform papillae (FP), as well as taste buds present in the nasoincisor ducts and the soft palate.1,7,8,9,10 The petrosal neurons in the jugular/nodose/petrosal complex send processes to the circumvallate (CV) and the foliate papillae, located in the posterior tongue.1,5,8,9,10
Figure 1.

The TRCs of the tongue are differentially innervated by the Chorda Tympani and Glossopharyngeal nerve in a topographical fashion
(A) An image showing the two major taste pathways. TRCs in the fungiform papillae of the anterior tongue send information through the chorda tympani (CT) to the geniculate ganglion. TRCs in the circumvallate of the posterior tongue communicate through the glossopharyngeal nerve (CN IX) with petrosal neurons of the jugular/nodose/petrosal complex (JNP), but previous work has not characterized responses of petrosal neurons.
(B) Geniculate ganglion (GG), seventh cranial nerve (VII), and greater superior petrosal nerve (GSP) from a Snap25-2A-GCaMP6s transgenic mouse. Robust expression of GCaMP can be seen throughout the geniculate ganglia.
(C) The JNP during surgical exposure shows cranial nerve X innervating the nodose and hints of cranial nerve IX innervating the petrosal.
(D) Expression of GCaMP6s in the JNP of a Snap25-2A-GCaMP6s mouse, demonstrating robust expression across the complex. Created with BioRender.com.
The differences between the anterior and posterior tongue’s innervation by separate peripheral ganglia, developmental origins, and involvement in different reflexive responses have supported the idea of a regional specialization of taste responses on the tongue.13 Electrophysiological recordings, anatomical, and behavioral studies have provided strong evidence that the anterior taste pathway is necessary for salt discrimination responses in rodents.14,15,16,17 And evidence supports a greater role of bitter signaling from the posterior taste pathway, especially related to producing aversive oral-facial reflexes such as gapes.18,19,20,21,22,23 Now, with access to advanced functional imaging tools, we have the opportunity to investigate the differences in taste coding across the two taste ganglia both at the population and single-neuron level.
In vivo calcium imaging of geniculate ganglion neurons has provided detailed information about the responses of these neurons to taste stimuli.9,24,25,26,27 At low to moderate taste stimulus concentrations, the majority of geniculate ganglion neurons respond narrowly.24,25 In response to higher concentrations of stimuli, neurons can increase their breadth of tuning.26 Precisely what this breadth of tuning change means is still being investigated, but one possibility is to create a generalized response among appetitive stimuli (sweet + umami) or aversive stimuli (bitter + ionic) in geniculate ganglion neurons.9 Until the present study, the equivalent calcium imaging data from gustatory petrosal ganglion neurons has been lacking.
Results and discussion
Calcium imaging of taste-evoked responses in geniculate and petrosal ganglia neurons
To compare taste-evoked activity in geniculate and petrosal neuron populations, we performed in vivo calcium imaging using transgenic Snap25-2A-GCaMP6s knockin mice.28 These mice express GCaMP6s, a genetically encoded calcium indicator, under the promoter for Snap25, a SNARE protein widely expressed in neurons. First, to validate the expression of GCaMP6s, the geniculate and vagal ganglia were immuno-stained using an anti-GFP antibody. We confirmed that GCaMP6s is highly expressed in neuronal cell bodies throughout the geniculate and vagal ganglia in this mouse strain (Figures 1B and 1D).
To observe taste responses, we surgically exposed either the geniculate29 or the jugular/nodose/petrosal complex30 (Figure 1C) in anesthetized animals and applied taste stimuli to the tongue representative of each of the five basic taste qualities: sweet (30 mM acesulfame potassium; AceK), bitter (5 mM quinine), salty (60 mM NaCl), umami (50 mM monopotassium glutamate + 1 mM inosine monophosphate; MPG + IMP), or sour (50 mM citric acid)24,25,29 (Figure 2). All tastant solutions provoked fluorescent responses in neurons of the geniculate (Figures 2A, 2C, and 2D) and the petrosal (Figures 2B, 2E, and 2F). Repeated trials showed that responses to taste stimuli were reproducible in both taste ganglia (Figures 2A and 2B). Neurons in these ganglia showed time-locked responses characterized by a rapid increase of fluorescence at stimulus presentation and returning to baseline over a few seconds (Figures 2C and 2E).
Figure 2.

A direct comparison of geniculate and vagal neurons
(A) Geniculate neurons show repeated responses to multiple applications of an individual taste stimulus.
(B) Petrosal neurons show repeatable responses to multiple applications of taste stimuli.
(C) Representative traces of geniculate neurons responding to taste stimuli. Most neurons show strong responses to a single taste stimulus.
(D) An image showing changes of GCaMP fluorescence in geniculate neurons before (left) and after (right) taste delivery. Empty arrows indicate neuron location without fluorescence, filled arrows indicate fluorescing neurons.
(E) Representative traces of petrosal neurons responding to taste stimuli. Again, most neurons respond to a single taste stimulus.
(F) Images showing JNP complex neurons in changing states of GCaMP fluorescence. Note that JNP neurons innervate multiple peripheral organs and respond to non-taste stimuli such as respiration. Empty arrows indicate neuron position when not fluorescing, filled arrows indicate fluorescing neurons. Small arrowheads indicate neurons responding to a non–taste-related stimulus.
We also compared geniculate ganglion data from the transgenic Snap25-GCaMP6s to previously published results from experiments using virally encoded AAV-GCaMP6s for calcium imaging in the geniculate ganglion.25 145 responses over 5 animals from our dataset were compared to 144 responses over 9 animals from the previous dataset. Our results did not show a significant difference in response profiles between the two datasets (Figure S1).
Comparison of tuning profiles of geniculate and petrosal neurons
The number of neurons responding to each taste quality is detailed in Figure 3. 145 geniculate ganglion neurons responded to taste stimuli across 5 animals. 140 petrosal ganglion neurons responded to taste stimuli across 12 animals. The majority of neurons responded selectively to a single taste quality (113 of 140 or 80.7% for the petrosal, 114 of 145 or 78.6% for geniculate). However, note that neurons responding to multiple stimuli were observed mostly within particular taste combinations. For instance, there is a prevalence for bitter-sour responding neurons24 in both ganglia (12 neurons or ∼8.6% for the petrosal, 6 neurons or 4.14% for the geniculate) and sweet-salty in the geniculate (10 neurons or 6.9%, but none in the petrosal). Most other categories of polymodal neurons had a very small number of neurons, each less than 3% of the population.
Figure 3.

A comparison of geniculate and petrosal ganglion neuron responses to taste stimuli
(A) Each panel in the Venn diagram shows the total number of geniculate neurons in the dataset responding to each taste quality or to multiple taste qualities. Percentages are shown for subpopulations exceeding 4 neurons.
(B) Venn diagram showing a total number of petrosal neurons responding to each category of taste or to multiple categories of taste. Percentages are shown for subpopulations exceeding 4 neurons.
(C) Heatmap showing responses of geniculate neurons to stimuli for different taste qualities. Results are shown as % DF/F. Subthreshold responses (<4% D/F) are on the gray scale.
(D) Heatmap showing responses of petrosal neurons to stimuli for different taste qualities. Results are shown as % DF/F. Subthreshold responses (<4% D/F) are on the gray scale.
We found differences in the proportions of neurons responding to individual taste qualities between ganglia. The populations of umami- (Mann Whitney U, p = 0.0046) and bitter- (p = 0.0087) responding neurons were significantly greater in the petrosal compared to the geniculate. Sweet- (p = 0.0186) and salty- (p = 0.0267) responding populations were more prevalent in the geniculate; however, these trends were not significant when adjusted for multiple comparisons (α = 0.01). We found no significant difference between the two ganglia in the average proportion of neurons that responded to the sour taste stimulus.
To be counted and characterized as a response and reported in the Venn diagrams in Figure 3, petrosal and geniculate neurons produced at least a 4% DF/F (3x median absolute deviation of the population) change in fluorescence over baseline (median response for 2 s before stimulus) in at least two of three trials. Wu et al., 2015 showed that geniculate neurons increase the breadth of tuning with high concentrations of stimuli.26 We have used taste solution concentrations that are already relatively strong stimuli—based on behavioral, electrophysiological, and imaging assays.24,25,26,31,32,33 Some of the discrepancy in the interpretation of these results may be due to differences in determining an appropriate threshold. Figures 3C and 3D displays the same cells in a heatmap color-coded by the intensity of responses. This representation highlights the different proportions of taste responses in the ganglia (more umami and bitter responders, fewer salt and sweet responders in the petrosal than in the geniculate) and also displays the distribution of response amplitudes across stimuli.
To determine how the taste-evoked responses of petrosal neurons may change between low and high stimulus concentrations, we tested a panel of low and high concentrations of sweet, bitter, umami, and sour stimuli (Figure S2A). In this experiment, we observed stimulus-evoked responses in 30 cells in the petrosal ganglia of 5 animals to a taste panel that included 100 mM sucrose, 300 mM sucrose, 50 mM MPG + 1 mM IMP, 100 mM MPG + 1 mM IMP, 0.5 mM quinine, 5 mM quinine, and 10 mM citric acid. Overall, we find that the responses to low and high concentrations of the same tastant are consistent, with more neurons recruited at higher stimulus concentrations. A few exceptions are seen, notably for sucrose where two neurons responded robustly to 100 mM but not to 300 mM sucrose. However, we don’t observe a marked increase in the breadth of tuning as concentrations increase.
An overly simplistic “scalable TRC to neuron” model would predict that the populations of gustatory neurons responding to a given taste modality would scale to the proportion of TRCs for each taste modality at the region of the tongue that those neurons innervate. Although there are some notable surprises regarding population responses in the geniculate ganglion (i.e. relatively few umami-responding neurons compared to the prevalence of Tas1R1-expressing fungiform TRCs34), it is a useful first approximation. This model accurately predicted the higher proportion of bitter-responding neurons and lower proportion of sweet- and salty-responding neurons within the petrosal relative to the geniculate.
As expected, in line with a lack of salt-specific circumvallate TRCs,35,36 we identified very few (only 2) neurons responding to the appetitive “low salt” (60 mM NaCl) in the petrosal. We performed an additional set of nodose/petrosal imaging experiments with a taste panel that included both low and high salt stimuli (60 mM NaCl, 250 mM NaCl, 500 mM NaCl, 250 mM KCl, 500 mM KCl, 5 mM Quinine, and 50 mM Citric Acid, Figure S2B). We observed stimulus-evoked responses in 48 cells in the petrosal ganglia of 4 animals. In this experiment, we found no petrosal neurons responding to 60 mM NaCl, confirming a dearth of low-salt responses in the petrosal. High salt stimuli likely activate bitter and sour TRCs.37 However, the number of high-salt responding neurons observed was greater than the combined total of bitter and sour responders. It is possible that some of these responses were generated by nodose neurons innervating the larynx as part of the vagal airway defense system.38 A potential avenue for further research would be to repeat these experiments with a unilateral transection of the glossopharyngeal or superior laryngeal nerve to isolate taste and airway defense signals from each other.
One notable discrepancy of the “scalable TRC to neuron” model is our finding that a much higher proportion of neurons respond to umami in the petrosal than in the geniculate. This is curious, as not only are Tas1r1-expressing cells more common in the FP than the CV,34,39 but single fiber recording experiments indicate that a significant population of CT fibers respond to umami taste stimuli.40 However, previous calcium imaging experiments also report a relatively low number of umami responding cells in the geniculate,24,25 which raises the possibility that a sampling bias is underestimating the number of umami responding neurons. In our surgical approach, geniculate neurons located close to the greater superficial petrosal nerve are less accessible for imaging and may be under-sampled in our dataset. If that location is particularly rich in umami neurons we may be missing it, but given that for other taste modalities, neural responses appear in a salt-and-pepper fashion throughout the ganglion, this seems unlikely.
However, this umami discrepancy is in keeping with previous studies showing that umami stimuli elicit stronger electrophysiological responses from the glossopharyngeal (GL) nerve innervating the posterior tongue than the chorda tympani (CT) nerve which innervates the anterior taste buds.41 Umami responding geniculate neurons frequently also respond to sweet.24,25,26 Single fiber recordings of the CT showed considerable overlap between umami responses and sweet or salty responses, the response patterns to MSG and NaCl were similar to one another, and the umami responses were often weaker than the response to the other stimuli.42 In contrast, single fiber recordings of the GL found fibers that responded to umami taste stimuli were less likely to respond to sweet or salty responses and the response patterns between MSG and NaCl were markedly different.42 This difference would suggest that umami-specific taste information is mostly conveyed by petrosal ganglion neurons, which our findings support.
Salivation in response to taste stimuli presented on the anterior or posterior tongue
Why is there a relatively large population of umami-responding neurons in the petrosal, especially with proportionately fewer Tas1r1-expressing TRCs present in the CV compared to the FP34? The posterior taste pathway encounters food largely as it approaches the oropharynx to be swallowed, and could be preferentially involved in preparation for digestion8 or the last chance to expel toxins from the oral cavity by prompting gag/gape reflexes.8,20
Taste signaling increases the production of saliva which aids in swallowing and contains enzymes that begin the breakdown of starch, lipids, and proteins.43 Umami taste stimuli have been shown to induce salivation44 and 0.1 M MSG causes a greater increase in salivation when applied to the posterior tongue than the anterior tongue in humans.45 For these reasons, we hypothesized that stimulating the posterior tongue with the umami tastant MPG + IMP in mice would produce more salivation than using the same stimulus on the anterior tongue.
We applied 50 mM MPG mixed with 1 mM IMP to the posterior tongue, rinsed the mouth with water, and measured the quantity of saliva produced over a 30 s period.46 This was repeated for the anterior tongue (Figure 4A). We saw a significant effect of interaction between tastant and the location it was placed on the tongue (ANOVA, F(1,10) = 6.657, p = 0.002). At the anterior tongue, umami tastant produced no significant increase in salivation when compared to water control (Tukey, p = 0.6129), but when it was applied to the posterior tongue, there was a significant increase in salivation (Tukey, p < 0.001 MPG compared to water at posterior tongue, p < 0.001 MPG compared to anterior tongue).
Figure 4.

Differential taste-salivation responses in FP vs. CV
(A) Salivation responses to water and 50 mM MPG + 1 mM IMP in wild-type C57/B6 mice. Significant differences (Tukey, p < 0.05) are indicated by “∗.” N = 5.
(B) Salivation differences (saliva produced by posterior stimulation minus saliva produced by anterior stimulation) in Skn1a +/− mice and Skn1a −/−. 50 mM MPG + 1 mM IMP produces a significant salivation response in Skn1a +/−, but not in Skn1a −/−. T-test, p < 0.05 indicated by “∗.” N = 6 per group.
(C) Salivation differences (saliva produced by posterior stimulation minus saliva produced by anterior stimulation) seen in C57/B6 mice to taste stimuli for the 5 canonical tastes and high salt (250 mM NaCl). The effect of tastant was significant (ANOVA, F(6,24) = 21.63, p < 0.001). Significant differences (Tukey, p < 0.05) are indicated by “∗.” N = 5. All data are presented as mean +/− SD. Where applicable, Bonferroni correction for multiple comparisons was applied.
To test whether this difference was mediated by taste signaling, we measured salivation in mice lacking umami-sensing TRCs. We used mice lacking Skn-1a (Pou2f3), a transcription factor crucial for the development of Type II TRCs, including those that sense umami taste stimuli.47 We applied the same umami stimulus as before (50 mM MPG + 1 mM IMP) to the anterior and posterior tongue of both Skn-1a −/− animals and to their heterozygous littermates (Figure 4B). As expected, and similar to wild-type mice, Skn-1a +/− mice produced more saliva when MPG was applied to the posterior tongue compared to the anterior tongue (p = 0.009 after normalizing for water responses). Strikingly, Skn-1a −/− mice salivated at similar rates when presented with MPG or water at both tongue locations (p = 0.9), providing strong evidence that the difference in salivation from anterior and posterior tongue stimulation with MPG + IMP is a taste-mediated effect. It should be noted that the Skn-1a −/− mice showed significantly less salivation overall (Figure S3), which may be important to follow up in the future as a model for taste-related deficits and its implications for dry mouth syndromes.
Next, to determine if the posterior taste pathway is more critical for taste-induced salivation generally, regardless of taste quality, wild-type mice were assayed using an expanded taste panel to include 30 mM AceK, 5 mM Quinine, 60 mM NaCl, 50 mM MPG + 1 mM IMP, 50 mM Citric Acid, and 250 mM NaCl (Figure 4C). These stimuli and concentrations were chosen to mirror the stimuli used in the imaging panel and to focus on taste-dependent pathways for salivation. While higher concentrations of acid stimuli are typically used to elicit salivation, there are concerns that they may activate both taste and trigeminal salivation pathways.48,49
We found that the salivation difference between anterior and posterior tongue stimulation changed based on tastant (ANOVA, F(6,24) = 21.63, p < 0.001). Three tastants caused more salivation with posterior stimulation: umami (50 mM MPG + 1 mM IMP), sweet (30 mM AceK), and bitter (5 mM Quinine) (Tukey test comparing stimuli vs. H2O, MPG p = 0.001, AceK p = 0.0185, Quinine p = 0.0259). The application of citric acid, to the anterior tongue (p = 0.0185), and high concentration (250 mM) sodium chloride, to either region of the tongue (anterior p < 0.001, posterior p < 0.001) produced significantly more saliva than water, but the amount was similar between anterior and posterior stimulation, rendering no significant difference between the location of stimulation for either stimulus (Figure S4). Further experiments might explore whether salivation to high salt is due partially or entirely too high salt’s recruitment of bitter and sour TRCs.37
The parasympathetic neurons that regulate salivation form the inferior salivary nuclei (ISN) and the superior salivary nuclei (SSN) in the brainstem.50 Notably, ISN project through the glossopharyngeal nerve to the otic ganglia, which supply the parotid glands, or the intralingual ganglia which control the von Ebner gland surrounding the CV.51 SSN send projections via the chorda tympani nerve to the submandibular ganglia, which controls the submandibular and the sublingual salivary glands. This anatomical organization has been suggested as a basis for taste stimulation initiating reflex salivation.52 Our findings support this closed-loop control: For example, the detection of umami in the CV is conveyed by afferent glossopharyngeal fibers originating from petrosal neurons to the nucleus of the solitary tract. This then activates a local reflex circuit to the ISN,53 which sends efferent instructions back via the glossopharyngeal nerve to stimulate the von Ebner gland, increasing saliva secretion in the posterior tongue. Future experiments may investigate taste-dependent secretory activity in the different salivary glands to demonstrate this feedback loop. Another possibility is to test for an effect of regional tongue taste stimulation on other physiological measures associated with digestion, such as insulin release and bile production.
It should also be noted that there are additional pathways that respond to taste stimuli. We have mentioned the vagal airway defense, which respond to water and several taste stimuli detected by taste receptor cells within the larynx.38 There are also cells that express taste receptors within the digestive system and recent work has shown how the vagus nerve (CN X) innervates these cells and vagal neurons respond to taste stimuli in the intestines.30,54 These vagal taste stimuli responses have been less studied in mammals, but related systems have seen a considerable study in other models55,56 and merit closer scrutiny.
While Boring’s chemotopic taste map of the tongue is a myth, mounting evidence suggests that there are important differences in the functions of the anterior and posterior taste pathways. Here, we used in vivo calcium imaging to compare the taste response profiles of the primary gustatory ganglion neurons innervating the anterior and posterior tongue. Although these ganglia respond to taste stimuli in a similar fashion, there are significant differences in the relative proportions of neurons responding to individual taste qualities. Umami-responsive neurons are over-represented in the petrosal ganglion compared to the geniculate. This may be important for the selective salivary response to MPG when applied to the posterior tongue. This indicates that these posterior gustatory neurons integrate into distinct circuits for salivation and perhaps other downstream physiological responses. Therefore, it is time for a more nuanced taste map.
Limitations of this study
While experiments replicating calcium imaging protocols with dye solution showed that dye was present in the CV (Figure S4), it also coated the entire oral cavity, and as such we cannot rule out JNP responses from other taste tissue, such as the laryngeal taste buds. Future experiments could compare the responses of the different taste tissues making up the posterior taste pathway.
It should also be noted that the salivation experiments do not perfectly isolate FP and CV or CT and GL signaling. We tested the range of fluid application between anterior and posterior protocols with dye experiments and found that there was minimal overlap between the two. However, while physically positioning the anterior tongue outside of the mouth limits exposure of the anterior FP to liquid placed in the oral cavity, the FP extends posteriorly enough that we may have activated some taste buds toward the rear of the FP. Even if we had perfectly prevented the activation of TRCs in the FP, there are additional regions expressing taste buds within the oral cavity, such as the palate, which would have been exposed to taste stimuli. Future experiments could address this using nerve transection to eliminate signals through the CT or the GL to align salivary response more closely with the activity of the anterior or posterior taste pathways.
While we provide a possible pathway for the taste-induced salivation shown within this article, additional studies will be required to confirm the contribution of the various salivary pathways.
STAR★Methods
Key resources table
| REAGENT or RESOURCE | SOURCE | IDENTIFIER |
|---|---|---|
| Antibodies | ||
| Chicken Anti-GFP | Aves Labs | NC9510598; RRID: AB_2307313 |
| Anti-Chicken Alexafluor 488 | Jackson Immuno Research | NC0215979; RRID: AB_2340376 |
| Vectashield Mounting Media | Vector Labs | H-1000-10; RRID: AB_2336789 |
| Chemicals, peptides, and recombinant proteins | ||
| Acesulfame K | TCI Chemicals | A149025G |
| Citric Acid | Fisher Chemical | A95-3 |
| IMP | Alfa Aesar | AAJ6195906 |
| MPG | Alfa Aesar | AAA1723230 |
| NaCl | Fisher Chemical | 50-947-346 |
| Quinine | Acros Organics | AC163720050 |
| Ketamine | Ketaved | NDC 50989-996-06 |
| Xylazine | Anased | NADA# 139-236 |
| Experimental models: Organisms/strains | ||
| Snap25-2A-GCaMP6s-D | JAX | 025111 |
| C57BL/6J | JAX | 000664 |
| Skn-1A −/− | This paper, Lee lab | N/A |
| Software and algorithms | ||
| Anaconda 3 | Anaconda Software Distribution | https://www.anaconda.com/ |
| Venn Library57 | Python Package Index | https://pypi.org/project/venn/ |
| Matlab | Mathworks | https://www.mathworks.com/products/matlab.html |
Resource availability
Lead contact
Further information and request for reagents should be directed to and will be fulfilled by the lead contact, Lindsey Macpherson (lindsey.macpherson@utsa.edu).
Materials availability
The Skn-1a −/− transgenic mouse line is available to the scientific community. Please email Hojoon Lee (hojoon.lee@northwestern.edu).
Experimental model and subject details
All procedures were carried out in accordance with US National Institutes of Health (NIH) guidelines for the care and use of laboratory animals, and were approved by the University of Texas at San Antonio IACUC. Both male and female mice were used in this study, ranging from 2–6 months of age. No randomization or blinding was used. For calcium imaging experiments, Snap25-2A-GCaMP6s mice (Jackson strain #025111) were used, maintained heterozygous by crossing with C57BL/6J and genotyped according to established protocols.28
Salivation experiments were conducted with C57BL/6J wild-type mice (Jackson strain #000664), homozygous Skn-1a −/− mutant animals and heterozygous Skn-1a +/− littermates. These animals were engineered by a CRISPR-based strategy, generating an insertion of a dGTP nucleotide in the sixth codon (5′-ATG ATG AGC CCA CTG GACC-3′) for a frameshift mutation.
Method details
Immunohistochemistry
Animals were sacrificed by CO2 inhalation, and then perfused with PBS and then 4% paraformaldehyde (PFA). Following perfusion, geniculate and vagal ganglia were dissected and placed in 30% sucrose for cryoprotection overnight at 4°C. Tissues were then embedded in OCT, frozen, and then sectioned on a cryostat at 20 μm. Tissue sections were mounted on Superfrost microscope slides and allowed to sit for 1 h. Slides were then briefly rinsed in PBS, and then blocked in 10% Donkey serum (Genetex Inc catalog no. NC0952420) in PBS with 0.3% Triton X100 for 1 hour at room temperature. Tissue was stained overnight at 4°C for anti-GFP primary (Aves labs catalog no. NC9510598, 1:2000 dilution) then overnight at 4°C with Alexafluor 488 anti-chicken secondary (Jackson Immuno Research Catalog no. NC0215979, 1:1000 dilution). Tissue was then rinsed and mounted with Vectashield anti-fade mounting media (Vector labs H-1000-10). Images were obtained on a Zeiss LSM 710 confocal microscope using a Zeiss Plan-Neofluar 10x objective and the Zen imaging software.
Calcium imaging of the geniculate and petrosal ganglia
Calcium imaging of the geniculate ganglion was performed as per Fowler & Macpherson 202129 and detailed schematics and video may be found with said publication. Briefly, the mouse was anesthetized with 100mg/kg ketamine mixed with 10mg/kg xylazine. The skin on top of the head was then removed and the skull was secured to a metal post with dental cement. The animals was then placed in a supine position and an incision was made from sternum to chin followed by blunt dissection to expose the trachea and insert a tracheotomy tube. The digastric muscle was then cut at the anterior insertion point, avoiding damage to blood vessels, and retracted posteriorly and laterally. Blunt dissection exposed the ventral side of the tympanic bulla and a surgical probe was used to poke a hole in the seam of the tympanic bulla. This hole was enlarged with scissors to expose the cochlea and the tensor tympani. The tensor tympani is cut and removed. A surgical probe was then used to break open the cochlea and PBS was used to dilute the resulting liquid, all of which was then suctioned out of the cavity. Cochlear bone and nerve tissue was then removed until the underlying temporal bone , and the posterior hole within said bone, were revealed. The surgical probe was placed within this hole and the temporal bone was lifted and removed to reveal the body of CN VII and the geniculate ganglion. Remaining bone obscuring the geniculate ganglion was removed and the animal was placed under an epifluorescent scope. The cavity gradually, but continuously, filled with fluid that needed to be suctioned to avoid flooding and loss of visual field. Taste stimuli and vehicle were applied continuously at room temperature to the tongue via pressurized liquid perfusion apparatus (Automate Scientific) at a rate of 5 mL/min.
Surgery to visualize the jugular/nodose/petrosal (JNP) complex was performed similarly to Tan et al. 2020.30 Briefly, the mouse was anesthetized with 100 mg/kg ketamine mixed with 10 mg/kg xylazine. The skin on top of the head was then removed and the skull was secured to a metal post with dental cement. The animal was then placed in a supine position and an incision was made from sternum to chin followed by blunt dissection to expose the trachea and insert a tracheotomy tube. The digastric muscle was retracted and blunt dissection was then performed medial to the posterior end of the digastric muscle to expose the jugular/nodose/petrosal complex. Taste stimuli and vehicle were applied continuously at room temperature to the tongue via pressurized liquid perfusion apparatus (Automate Scientific) at a rate of 5 mL/min.
Taste stimuli for initial experiments in both ganglia were 30 mM acesulfame potassium, 5 mM quinine, 60 mM NaCl, 50 mM MPG + 1 mM IMP, and 50 mM citric acid, all presented in water. Additional concentration experiments were performed in the petrosal with a panel of A) 100 mM sucrose, 300 mM sucrose, 0.5 mM quinine, 5 mM quinine, 50 mM MPG + 1 mM IMP, 100 mM MPG + 1 mM IMP, and 10 mM citric acid B) 60 mM NaCl, 250 mM NaCl, 500 mM NaCl, 250 mM KCl, 500 mM KCl, 5 mM quinine, and 50 mM citric acid. For all experiments, the oral cavity was primed with 10 s of water flow before experimental trials. A 6.5 s baseline was taken, then tastants were applied sequentially for 2 s each with a 13 s recovery period between them. Fluid delivery was performed the same for geniculate and JNP imaging. The relevant ganglion was imaged under an Olympus BX51WI microscope, coupled to a sCMOS camera (Hamamatsu OrcaFlash 4.0). Resulting videos were analyzed using custom MATLAB script for image stabilization58 and DF/F normalization. ROI’s were identified by comparing maximal pixel intensity over mean pixel intensity, median filtered, thresholded and separated by watershed segmentation.59 Resulting ROI’s were manually examined and compared between experimental trials. Maximum response of ROI’s were tested against a threshold of 4% DF/F (average of 3x median absolute deviation),25,59 and if this response repeated twice across three separate experimental trials.
Salivation experiments
Animals were anesthetized with 100 mg/kg ketamine and 10 mg/kg xylazine and their heads were restrained and a tracheotomy was performed as described in Fowler & Macpherson 2021.29 The animal’s tongue was then gently pulled so the anterior tongue protruded from the mouth and the tongue was restrained to prevent it from retracting into the mouth. This restraint was done by gently applying pressure with forceps grasping an absorbent point, at no point was the tongue clamped, pierced, or held tightly with forceps. For posterior tongue stimulation, 0.02 mL of tastant was applied deep in the oral cavity by blunt dispensing needle. After 10 s, the stimulus was suctioned out and the oral cavity was rinsed with 0.05 mL of DI water, suctioned, and swabbed quickly with an absorbent point to ensure taste stimuli and water rinse were no longer present in oral cavity. Immediately following this, a pre-weighed absorbent point was placed into the mouth of the mouse and left for 30 s. During the last 5 s the absorbent point was used to swab the animal’s mouth before re-weighing for comparison to the initial weight.
For anterior tongue trials, liquid was applied carefully to anterior tongue and absorbent points were used to prevent liquid from entering the oral cavity. Other steps remained the same. Methods for measuring salivation with absorbent points were adapted from Bagavant et al 2018.46
The first experiment was designed to test two primary factors and the interaction between them: 1) The effect of an umami taste stimulus: 50 mM MPG + 1 mM IMP vs. water control. 2) The location where stimuli were applied: the anterior vs. posterior tongue. Both factors were fully repeated within each animal.
A second experiment was designed to test whether the difference in salivation between anterior and posterior application of umami was taste dependent. This resulted in three primary factors. 1) Taste stimuli: water vs. 50 mM MPG + 1 mM IMP. 2) Location of stimuli application: Anterior vs. posterior tongue. 3) Genotype of animal: Skn-1a −/− mutant vs. heterozygous littermate. Factors 1 and 2 were repeated within each animal.
The third experiment was designed to test whether stimulation of the posterior tongue would produce more saliva in response to taste stimuli for all taste categories or only for umami taste stimuli. This resulted in the following test factors: 1) The taste stimuli applied: 30 mM acesulfame potassium, 5 mM quinine, 50 mM MPG + 1 mM IMP, 50 mM citric acid, 60 mM NaCl, and 250 mM NaCl. 2) The target of taste stimuli application: Anterior vs. posterior tongue. Both factors were fully repeated within each animal.
Additional concentrations of taste stimuli were also tested for salivation response. For these, taste stimuli were 1 mM AceK, 100 mM Sucrose, 300 mM Sucrose, 0.5 mM Quinine, 100mM MPG + 1mM IMP, and 10 mM Citric Acid. New concentrations and stimuli were shown for comparison against original panel.
Dye confirmation of stimulus placement
Animals were sacrificed by CO2 inhalation and perfused with PBS before experiments. Animals had their heads restrained and were given tracheotomies as previously described. Water containing blue Wilton Gel Food Colors dye was applied to either the anterior or posterior tongue as in salivation experiments. Dye was allowed to remain in place for 10 s and was then gently suctioned. The anterior tongue was imaged prior to cutting the jaw open to visualize the posterior tongue and palate. Pictures were taken with Leica M80 dissection scope and Leica MC170 HD camera.
For pressurized perfusion (Automate) validation, animal sedation and restraint were the same as above. Water was pumped into the oral cavity for 13 s (as per calcium imaging) and followed by dye solution. Animal was then imaged, front of the tongue first, and the jaw separated and oral cavity imaged second. While the dye was present in the CV, it also coated the entire oral cavity, and as such cannot rule out JNP responses from other taste tissue, such as the pharyngeal taste buds. Future experiments could further compare the responses of the different taste tissues making up the posterior taste pathway.
Quantification and statistical analysis
Calcium imaging
The portion of neurons responding to each taste quality was calculated for each animal. These values were then compared between ganglia using the Mann-Whitney U test for sweet, bitter, umami, and salty stimuli. The Bonferroni method was used to correct for multiple comparisons.
Salivation experiments with umami taste stimuli on wild type mice
Values for initial umami induced salivation experiments were log normalized to satisfy assumptions for the ANOVA test. A two factor repeated measures ANOVA was used to compare effects of tastant, location of stimulation, and their interaction on salivation. Post hoc comparisons were conducted by Tukey test. Data was plotted as mean +/− standard deviation and significant differences (Tukey p < 0.05) were denoted with “∗.”
Salivation experiments with the Skn-1a −/− line
To compare the effects of 50 mM MPG + 1 mM IMP in Skn-1a −/− mice with heterozygous littermates, the difference in salivation (salivation response to posterior stimulation minus salivation response to anterior condition) was calculated for each animal. Difference in MPG posterior and anterior stimulation for Skn-1a −/− animals were compared to heterozygous littermates using Student’s T-test. Data was plotted as mean +/− standard deviation and significant differences (Tukey p < 0.05) were denoted with “∗.”
Salivation experiments with a taste panel on wild type mice
To test the effects of taste stimuli for all five taste qualities on salivation, differences in salivation between posterior stimulation and anterior stimulation was calculated for each mouse-tastant combination. A one factor repeated measures ANOVA was used to compare effects of tastant on salivation. Tastant groups were compared to water by Tukey test. Data was plotted as mean +/− standard deviation and significant differences between individual taste stimuli and water (Tukey p < 0.05) were denoted with “∗.”
Supplemental salivation values
Raw salivation values were plotted in Figure S4 as mean +/− standard deviation. Comparison of 250 mM NaCl and 50 mM citric acid to water induced salivation were plotted as mean +/− standard deviation. Significant difference between NaCl or citric acid induced salivation and same location water values (Tukey, p < 0.06) are denoted by “∗.”
Plots and Venn diagrams
All plots were made in Python using Anaconda3.60 Venn diagrams required installation of the Venn library from the Python Package Index.57
Acknowledgments
This study was supported in part by NIH Grant SC2GM130411, The Brain Research Foundation Seed Grant, Whitehall Foundation Research Award, and Voelcker Fund Young Investigator Award to LM and UTSA Brain Health Consortium Seed Grant to BF. HL is supported by the Whitehall Foundation Research Award.
Author contributions
LM and BF conceived and designed the study. BF, JY, and SH performed the experiments. BF analyzed data. BF and LM drafted the article with input from HL. BF, JY, HL, and LM revised and finalized the article. All authors read and approved the final version of the article.
Declaration of interests
The authors declare no competing interests.
Inclusion and diversity
We support the inclusive, diverse, and equitable conduct of research.
Published: December 22, 2022
Footnotes
Supplemental information can be found online at https://doi.org/10.1016/j.isci.2022.105700.
Supplemental information
Data and code availability
All data reported in this paper will be shared by the lead contact upon request.
This paper reports no original code.
References
- 1.Bartoshuk L.M. The biological basis of food perception and acceptance. Food Qual. Prefer. 1993;4:21–32. [Google Scholar]
- 2.Boring E. 1942. Sensation and Perception in the History of Psychology. [Google Scholar]
- 3.Hanig D.P. Universitat Leipzig; 1901. Psychophysik des Geschmackssinnes. PhD. [Google Scholar]
- 4.Rothova M., Thompson H., Lickert H., Tucker A.S. Lineage tracing of the endoderm during oral development. Dev. Dyn. 2012;241:1183–1191. doi: 10.1002/dvdy.23804. [DOI] [PubMed] [Google Scholar]
- 5.Frank M.E. Taste-responsive neurons of the glossopharyngeal nerve of the rat. J. Neurophysiol. 1991;65:1452–1463. doi: 10.1152/jn.1991.65.6.1452. [DOI] [PubMed] [Google Scholar]
- 6.Krimm R.F. Factors that regulate embryonic gustatory development. BMC Neurosci. 2007;8:S4. doi: 10.1186/1471-2202-8-S3-S4. [DOI] [PMC free article] [PubMed] [Google Scholar]
- 7.Sollars S.I., Hill D.L. In vivo recordings from rat geniculate ganglia: taste response properties of individual greater superficial petrosal and chorda tympani neurones. J. Physiol. 2005;564:877–893. doi: 10.1113/jphysiol.2005.083741. [DOI] [PMC free article] [PubMed] [Google Scholar]
- 8.Spector A.C., Travers S.P. Oxford Research Encyclopedia of Neuroscience. 2021. Taste buds and gustatory transduction: a functional perspective. [Google Scholar]
- 9.Travers S.P., Spector A.C. Oxford Research Encyclopedia of Neuroscience. 2021. Anatomical organization and coding in the gustatory system: a functional perspective. [Google Scholar]
- 10.Schier L.A., Spector A.C. The functional and neurobiological properties of bad taste. Physiol. Rev. 2019;99:605–663. doi: 10.1152/physrev.00044.2017. [DOI] [PMC free article] [PubMed] [Google Scholar]
- 11.Breslin P.A.S., Spector A.C. Mammalian taste perception. Curr. Biol. 2008;18:R148–R155. doi: 10.1016/j.cub.2007.12.017. [DOI] [PubMed] [Google Scholar]
- 12.Spector A.C., Travers S.P. The representation of taste quality in the mammalian nervous system. Behav. Cogn. Neurosci. Rev. 2005;4:143–191. doi: 10.1177/1534582305280031. [DOI] [PubMed] [Google Scholar]
- 13.Alan C Spector, John I Glendinning, Linking peripheral taste processes to behavior, Curr. Opin. Neurobiol. 2009; 19: 370-377, ISSN 0959-4388, 10.1016/j.conb.2009.07.014 [DOI] [PMC free article] [PubMed]
- 14.Blonde G.D., Garcea M., Spector A.C. The relative effects of transection of the gustatory branches of the seventh and ninth cranial nerves on NaCl taste detection in rats. Behav. Neurosci. 2006;120:580–589. doi: 10.1037/0735-7044.120.3.580. [DOI] [PubMed] [Google Scholar]
- 15.Spector A.C., Grill H.J. Salt taste discrimination after bilateral section of the chorda tympani or glossopharyngeal nerves. Am. J. Physiol. 1992;263:R169–R176. doi: 10.1152/ajpregu.1992.263.1.R169. [DOI] [PubMed] [Google Scholar]
- 16.St John S.J., Spector A.C. Behavioral discrimination between quinine and KCl is dependent on input from the seventh cranial nerve: implications for the functional roles of the gustatory nerves in rats. J. Neurosci. 1998;18:4353–4362. doi: 10.1523/JNEUROSCI.18-11-04353.1998. [DOI] [PMC free article] [PubMed] [Google Scholar]
- 17.Markison S., St John S.J., Spector A.C. Glossopharyngeal nerve transection does not compromise the specificity of taste-guided sodium appetite in rats. Am. J. Physiol. 1995;269:R215–R221. doi: 10.1152/ajpregu.1995.269.1.R215. [DOI] [PubMed] [Google Scholar]
- 18.Geran L.C., Travers S.P. Glossopharyngeal nerve transection impairs unconditioned avoidance of diverse bitter stimuli in rats. Behav. Neurosci. 2011;125:519–528. doi: 10.1037/a0023934. [DOI] [PMC free article] [PubMed] [Google Scholar]
- 19.Danilova V., Hellekant G. Comparison of the responses of the chorda tympani and glossopharyngeal nerves to taste stimuli in C57BL/6J mice. BMC Neurosci. 2003;4:5. doi: 10.1186/1471-2202-4-5. [DOI] [PMC free article] [PubMed] [Google Scholar]
- 20.King C.T., Garcea M., Spector A.C. Glossopharyngeal nerve regeneration is essential for the complete recovery of quinine-stimulated oromotor rejection behaviors and central patterns of neuronal activity in the nucleus of the solitary tract in the rat. J. Neurosci. 2000;20:8426–8434. doi: 10.1523/JNEUROSCI.20-22-08426.2000. [DOI] [PMC free article] [PubMed] [Google Scholar]
- 21.King C.T., Travers S.P., Rowland N.E., Garcea M., Spector A.C. Glossopharyngeal nerve transection eliminates quinine-stimulated fos-like immunoreactivity in the nucleus of the solitary tract: implications for a functional topography of gustatory nerve input in rats. J. Neurosci. 1999;19:3107–3121. doi: 10.1523/JNEUROSCI.19-08-03107.1999. [DOI] [PMC free article] [PubMed] [Google Scholar]
- 22.Markison S., John S.J., Spector A.C. Glossopharyngeal nerve transection reduces quinine avoidance in rats not given presurgical stimulus exposure. Physiol. Behav. 1998;65:773–778. doi: 10.1016/s0031-9384(98)00219-4. [DOI] [PubMed] [Google Scholar]
- 23.Travers J.B., Grill H.J., Norgren R. The effects of glossopharyngeal and chorda tympani nerve cuts on the ingestion and rejection of sapid stimuli: an electromyographic analysis in the rat. Behav. Brain Res. 1987;25:233–246. doi: 10.1016/0166-4328(87)90071-4. [DOI] [PubMed] [Google Scholar]
- 24.Barretto R.P.J., Gillis-Smith S., Chandrashekar J., Yarmolinsky D.A., Schnitzer M.J., Ryba N.J.P., Zuker C.S. The neural representation of taste quality at the periphery. Nature. 2015;517:373–376. doi: 10.1038/nature13873. [DOI] [PMC free article] [PubMed] [Google Scholar]
- 25.Lee H., Macpherson L.J., Parada C.A., Zuker C.S., Ryba N.J.P. Rewiring the taste system. Nature. 2017;548:330–333. doi: 10.1038/nature23299. [DOI] [PMC free article] [PubMed] [Google Scholar]
- 26.Wu A., Dvoryanchikov G., Pereira E., Chaudhari N., Roper S.D. Breadth of tuning in taste afferent neurons varies with stimulus strength. Nat. Commun. 2015;6:8171. doi: 10.1038/ncomms9171. [DOI] [PMC free article] [PubMed] [Google Scholar]
- 27.Zhang J., Jin H., Zhang W., Ding C., O'Keeffe S., Ye M., Zuker C.S. Sour sensing from the tongue to the brain. Cell. 2019;179:392–402.e15. doi: 10.1016/j.cell.2019.08.031. [DOI] [PubMed] [Google Scholar]
- 28.Madisen L., Garner A.R., Shimaoka D., Chuong A.S., Klapoetke N.C., Li L., Van Der Bourg A., Niino Y., Egolf L., Monetti C., et al. Transgenic mice for intersectional targeting of neural sensors and effectors with high specificity and performance. Neuron. 2015;85:942–958. doi: 10.1016/j.neuron.2015.02.022. [DOI] [PMC free article] [PubMed] [Google Scholar]
- 29.Fowler B.E., Macpherson L.J. In vivo calcium imaging of mouse geniculate ganglion neuron responses to taste stimuli. J. Vis. Exp. 2021 doi: 10.3791/62172. [DOI] [PMC free article] [PubMed] [Google Scholar]
- 30.Tan H.-E., Sisti A.C., Jin H., Vignovich M., Villavicencio M., Tsang K.S., Goffer Y., Zuker C.S. The gut–brain axis mediates sugar preference. Nature. 2020;580:511–516. doi: 10.1038/s41586-020-2199-7. [DOI] [PMC free article] [PubMed] [Google Scholar]
- 31.Chandrashekar J., Kuhn C., Oka Y., Yarmolinsky D.A., Hummler E., Ryba N.J.P., Zuker C.S. The cells and peripheral representation of sodium taste in mice. Nature. 2010;464:297–301. doi: 10.1038/nature08783. [DOI] [PMC free article] [PubMed] [Google Scholar]
- 32.Glendinning J.I., Gresack J., Spector A.C. A high-throughput screening procedure for identifying mice with aberrant taste and oromotor function. Chem. Senses. 2002;27:461–474. doi: 10.1093/chemse/27.5.461. [DOI] [PubMed] [Google Scholar]
- 33.Mueller K.L., Hoon M.A., Erlenbach I., Chandrashekar J., Zuker C.S., Ryba N.J.P. The receptors and coding logic for bitter taste. Nature. 2005;434:225–229. doi: 10.1038/nature03352. [DOI] [PubMed] [Google Scholar]
- 34.Stone L.M., Barrows J., Finger T.E., Kinnamon S.C. Expression of T1Rs and gustducin in palatal taste buds of mice. Chem. Sens. 2007;32:255–262. doi: 10.1093/chemse/bjl053. [DOI] [PubMed] [Google Scholar]
- 35.Kretz O., Barbry P., Bock R., Lindemann B. Differential expression of RNA and protein of the three pore-forming subunits of the amiloride-sensitive epithelial sodium channel in taste buds of the rat. J. Histochem. Cytochem. 1999;47:51–64. doi: 10.1177/002215549904700106. [DOI] [PubMed] [Google Scholar]
- 36.Taruno A., Nomura K., Kusakizako T., Ma Z., Nureki O., Foskett J.K. Taste transduction and channel synapses in taste buds. Pflugers Arch. 2021;473:3–13. doi: 10.1007/s00424-020-02464-4. [DOI] [PMC free article] [PubMed] [Google Scholar]
- 37.Oka Y., Butnaru M., von Buchholtz L., Ryba N.J.P., Zuker C.S. High salt recruits aversive taste pathways. Nature. 2013;494:472–475. doi: 10.1038/nature11905. [DOI] [PMC free article] [PubMed] [Google Scholar]
- 38.Prescott S.L., Umans B.D., Williams E.K., Brust R.D., Liberles S.D. An airway protection program revealed by sweeping genetic control of vagal afferents. Cell. 2020;181:574–589.e14. doi: 10.1016/j.cell.2020.03.004. [DOI] [PMC free article] [PubMed] [Google Scholar]
- 39.Yamada Y., Takai S., Watanabe Y., Osaki A., Kawabata Y., Oike A., Hirayama A., Iwata S., Sanematsu K., Tabata S., Shigemura N. Gene expression profiling of alpha-gustducin-expressing taste cells in mouse fungiform and circumvallate papillae. Biochem. Biophys. Res. Commun. 2021;557:206–212. doi: 10.1016/j.bbrc.2021.04.022. [DOI] [PubMed] [Google Scholar]
- 40.Yasumatsu K., Ogiwara Y., Takai S., Yoshida R., Iwatsuki K., Torii K., Margolskee R.F., Ninomiya Y. Umami taste in mice uses multiple receptors and transduction pathways. J. Physiol. 2012;590:1155–1170. doi: 10.1113/jphysiol.2011.211920. [DOI] [PMC free article] [PubMed] [Google Scholar]
- 41.Ninomiya Y., Nakashima K., Fukuda A., Nishino H., Sugimura T., Hino A., Danilova V., Hellekant G. Responses to umami substances in taste bud cells innervated by the chorda tympani and glossopharyngeal nerves. J. Nutr. 2000;130:950S–953S. doi: 10.1093/jn/130.4.950S. [DOI] [PubMed] [Google Scholar]
- 42.Ninomiya Y., Funakoshi M. Peripheral neural basis for behavioural discrimination between glutamate and the four basic taste substances in mice. Comp. Biochem. Physiol. A Comp. Physiol. 1989;92:371–376. doi: 10.1016/0300-9629(89)90578-1. [DOI] [PubMed] [Google Scholar]
- 43.Mese H., Matsuo R. Salivary secretion, taste and hyposalivation. J. Oral Rehabil. 2007;34:711–723. doi: 10.1111/j.1365-2842.2007.01794.x. [DOI] [PubMed] [Google Scholar]
- 44.Sasano T., Satoh-Kuriwada S., Shoji N., Iikubo M., Kawai M., Uneyama H., Sakamoto M. Important role of umami taste sensitivity in oral and overall health. Curr. Pharm. Des. 2014;20:2750–2754. doi: 10.2174/13816128113199990577. [DOI] [PubMed] [Google Scholar]
- 45.Matsuo R., Yamamoto T. Salivary secretion elicited by taste stimulation with umami substances in human adults. Chem. Senses. 1989;14:47–54. [Google Scholar]
- 46.Bagavant H., Trzeciak M., Papinska J., Biswas I., Dunkleberger M.L., Sosnowska A., Deshmukh U.S. A method for the measurement of salivary gland function in mice. J. Vis. Exp. 2018:57203. doi: 10.3791/57203. [DOI] [PMC free article] [PubMed] [Google Scholar]
- 47.Matsumoto I., Ohmoto M., Narukawa M., Yoshihara Y., Abe K. Skn-1a (Pou2f3) specifies taste receptor cell lineage. Nat. Neurosci. 2011;14:685–687. doi: 10.1038/nn.2820. [DOI] [PMC free article] [PubMed] [Google Scholar]
- 48.Lugaz O., Pillias A.-M., Boireau-Ducept N., Faurion A. Time–intensity evaluation of acid taste in subjects with saliva high flow and low flow rates for acids of various chemical properties. Chem. Senses. 2005;30:89–103. doi: 10.1093/chemse/bji004. [DOI] [PubMed] [Google Scholar]
- 49.Dana R.M., McCaughey S.A. Gustatory responses of the mouse chorda tympani nerve vary based on region of tongue stimulation. Chem. Senses. 2015;40:335–344. doi: 10.1093/chemse/bjv015. [DOI] [PubMed] [Google Scholar]
- 50.Contreras R.J., Gomez M.M., Norgren R. Central origins of cranial nerve parasympathetic neurons in the rat. J. Comp. Neurol. 1980;190:373–394. doi: 10.1002/cne.901900211. [DOI] [PubMed] [Google Scholar]
- 51.Kim M., Chiego D.J., Bradley R.M. Morphology of parasympathetic neurons innervating the lingual salivary glands. Auton Neurosci. 2004;111:27–36. doi: 10.1016/j.autneu.2004.01.006. [DOI] [PubMed] [Google Scholar]
- 52.Sbarbati A., Crescimanno C., Osculati F. The anatomy and functional role of the circumvallate papilla/von Ebner gland complex. Med. Hypotheses. 1999;53:40–44. doi: 10.1054/mehy.1997.0708. [DOI] [PubMed] [Google Scholar]
- 53.Suwabe T., Fukami H., Bradley R.M. Synaptic responses of neurons controlling the parotid and von Ebner salivary glands in rats to stimulation of the solitary nucleus and tract. J. Neurophysiol. 2008;99:1267–1273. doi: 10.1152/jn.01115.2007. [DOI] [PubMed] [Google Scholar]
- 54.Williams E.K., Chang R.B., Strochlic D.E., Umans B.D., Lowell B.B., Liberles S.D. Sensory neurons that detect stretch and nutrients in the digestive system. Cell. 2016;166:209–221. doi: 10.1016/j.cell.2016.05.011. [DOI] [PMC free article] [PubMed] [Google Scholar]
- 55.Finger T.E. Sorting food from stones: the vagal taste system in goldfish, Carassius auratus. J. Comp. Physiol. A Neuroethol. Sens. Neural Behav. Physiol. 2008;194:135–143. doi: 10.1007/s00359-007-0276-0. [DOI] [PMC free article] [PubMed] [Google Scholar]
- 56.Finger T.E. Evolution of gustatory reflex systems in the brainstems of fishes. Integr. Zool. 2009;4:53–63. doi: 10.1111/j.1749-4877.2008.00135.x. [DOI] [PMC free article] [PubMed] [Google Scholar]
- 57.Grigorev K. 2018. Venn. Python Package Index. [Google Scholar]
- 58.Li K. The image stabilizer plugin for ImageJ. 2008. http://www. cs. cmu. edu/∼ kangli/code/Image_Stabilizer. html can be found under.
- 59.Yarmolinsky D.A., Peng Y., Pogorzala L.A., Rutlin M., Hoon M.A., Zuker C.S. Coding and plasticity in the mammalian thermosensory system. Neuron. 2016;92:1079–1092. doi: 10.1016/j.neuron.2016.10.021. [DOI] [PMC free article] [PubMed] [Google Scholar]
- 60.Anaconda 3. Anaconda Software Distribution. 2016. https://anaconda.com
Associated Data
This section collects any data citations, data availability statements, or supplementary materials included in this article.
Supplementary Materials
Data Availability Statement
All data reported in this paper will be shared by the lead contact upon request.
This paper reports no original code.