Abstract
Genome-wide association studies have uncovered hundreds of autoimmune disease-associated loci; however, the causal genetic variant(s) within each locus are mostly unknown. Here, we perform high-throughput allele-specific reporter assays to prioritize disease-associated variants for five autoimmune diseases. By examining variants that both promote allele-specific reporter expression and are located in accessible chromatin, we identify 60 putatively causal variants that enrich for statistically fine-mapped variants by up to 57.8-fold. We introduced the risk allele of a prioritized variant (rs72928038) into a human T cell line and deleted the orthologous sequence in mice, both resulting in reduced BACH2 expression. Naïve CD8 T cells from mice containing the deletion had reduced expression of genes that suppress activation and maintain stemness, and, upon acute viral infection, displayed greater propensity to become effector T cells. Our results represent an example of an effective approach for prioritizing variants and studying their physiologically relevant effects.
Genome-wide association studies (GWAS) are a powerful approach for identifying genetic susceptibility loci for autoimmune diseases. However, our ability to draw direct mechanistic insights from GWAS loci has been hampered by challenges in identifying which variant(s) actually cause disease risk at any given locus. Pinpointing the specific causal variant provides insight into the context and mechanism by which the disease association modulates disease risk. There are three major challenges to identifying causal variant(s): 1) at most loci, there are many disease-associated variants due to linkage disequilibrium (LD) between causal and non-causal variants, 2) ~90% of causal variants reside in non-coding regions1,2, where their mechanisms of action are difficult to infer, and 3) the context (e.g., cell type, cell state, etc.) in which variants act may at times be difficult to discern, particularly for non-coding variants. Thus, to identify causal variants, we must refine strategies to prioritize and test variants for how they perturb genomic functions, particularly in disease-relevant cell types and states.
Here, we applied massively parallel reporter assays (MPRA) and accessible chromatin in T cells to prioritize ~18,000 variants associated with five autoimmune diseases including type 1 diabetes (T1D), inflammatory bowel disease ([IBD], including ulcerative colitis [UC] and Crohn’s disease [CD]), rheumatoid arthritis (RA), psoriasis, and multiple sclerosis (MS). Through integrating these methods, we found 60 likely causal variants that enriched up to 57.8-fold for causal variants according to fine-mapping. We further characterized the effects of a single highly conserved variant (rs72928038) associated with multiple autoimmune diseases. Human T cells heterozygous for this variant have substantial reductions in accessible chromatin containing the risk allele, and insertion of the variant into Jurkat T cells reduced expression of BACH2, a transcriptional repressor that negatively regulates effector T cell differentiation3. We found rs72928038-deleted mice to have naïve CD8 T cells with reduced Bach2 expression and reduced expression of naïve T cell stemness-associated genes, indicating that rs72928038 plays an important role in suppressing naïve T cell activation. Upon acute viral infection, we found rs72928038-deleted naïve CD8 T cells are more likely to differentiate into effector T cells and less likely to form central memory precursors, suggesting that at least part of the cellular mechanism of rs72928038 is to skew naïve T cells toward effector T cell fates.
With a focus on regulatory variants in T cells, this work demonstrates that chromatin accessibility and MPRA independently enrich for likely causal variants, and that integration of the two methods substantially increases this enrichment, providing a highly efficacious framework for identifying regulatory variants that impact risk for autoimmune disease. By applying this framework and through deep mechanistic follow-up of a prioritized variant in vivo, we provide a clear example of how to move from variant prioritization to causal effects on cellular outcome in an organismic model.
Results
Prioritizing autoimmune GWAS variants with MPRA.
Because autoimmune disease-associated genetic variants are highly enriched in T cell cis-regulatory elements1,2,4–7, we hypothesized that many disease-causal variants likely alter the activity of T cell cis-regulatory elements. One way to determine the effect of variants on regulatory activities is through testing variant alleles for their differential effects on reporter expression in MPRA8–11. To this end, we created MPRA libraries for variants associated with diseases in which T cells are known to play a role (henceforth collectively referred to as T-GWAS). These diseases include IBD (including CD and UC)12, MS13,14, T1D15, psoriasis16, and RA17.
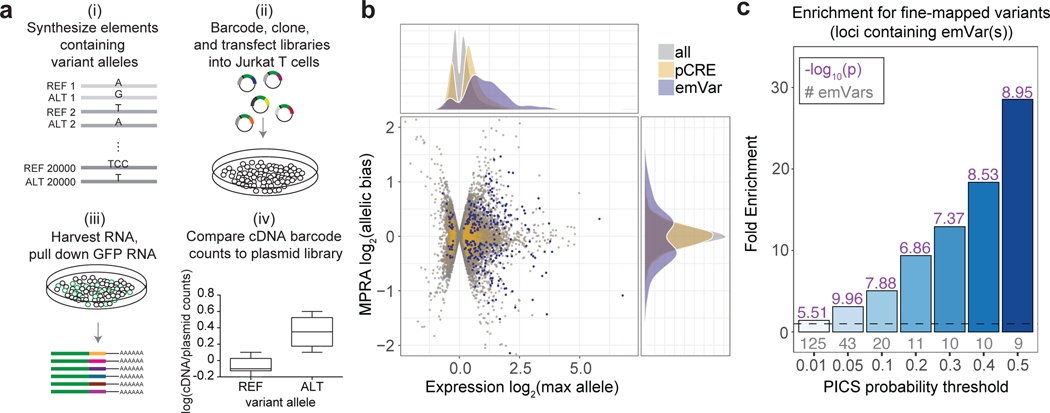
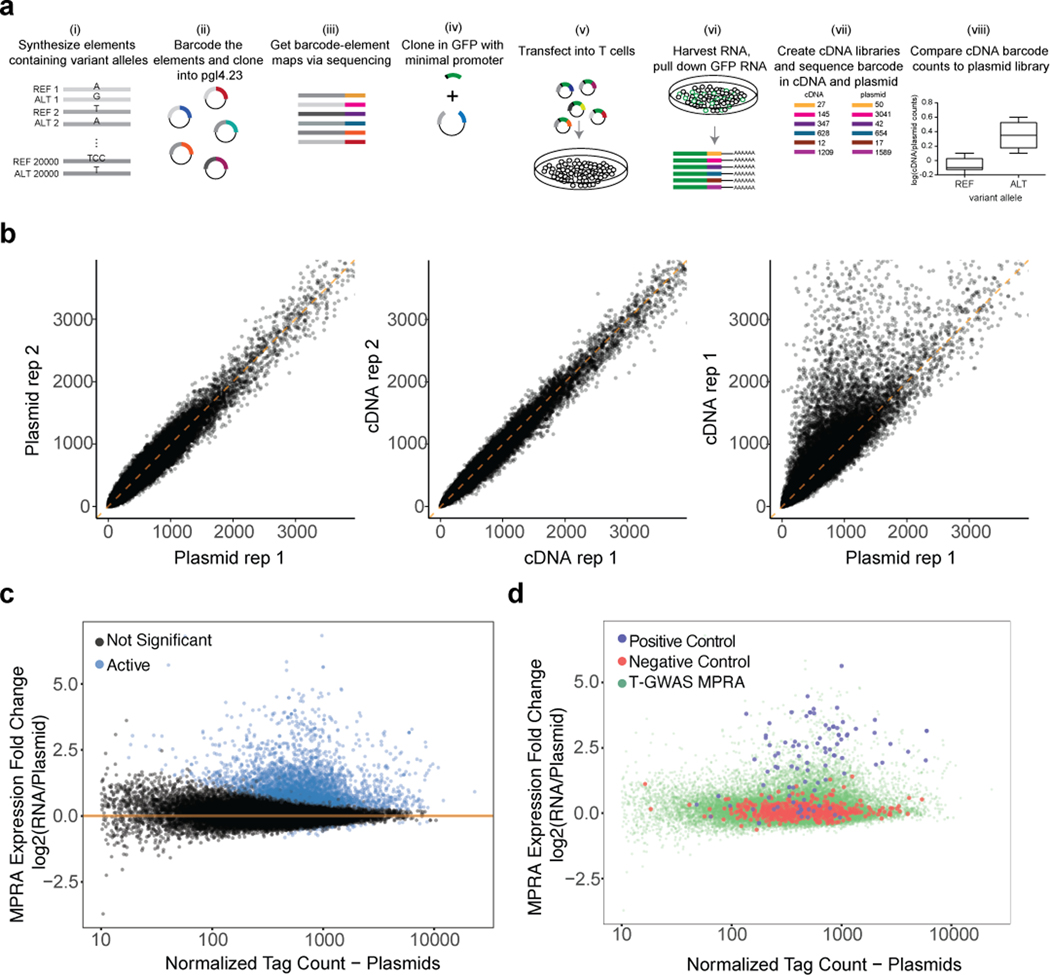
We collected 578 GWAS index variants (representing 531 distinct GWAS loci) and variants in tight LD (r2 > 0.8) from the above-cited studies, totaling 18,312 variants, and designed MPRA libraries by centering each variant within 200 bp of its genomic context to test for allele-specific effects on reporter expression (see Supplementary Note, Supplementary Fig. 1a and Supplementary Tables 1–2). After nucleofection of the library into Jurkat T cells, followed by RNA sequencing of barcodes after 24 h, we found that barcode prevalence in plasmid and cDNA replicates was tightly correlated, and that some barcodes were more present in cDNA than in plasmid libraries, indicative of their higher expression (Supplementary Fig.1b; Supplementary Table 3). We found 7,095 elements that had higher reporter expression than expected from their prevalence in plasmid libraries for at least one variant allele (termed putative cis-regulatory elements, pCREs; Supplementary Fig.1c); positive enhancer controls generally were pCREs, while negative controls had minimal expression (Supplementary Fig.1d). Of the 7,095 pCRE elements, we found 313 variants that had statistically significant differences in expression between the reference and alternate alleles, which we term expression-modulating variants (emVars) (Fig. 1b; Supplementary Table 3).
Fig. 1. Prioritizing GWAS variants using high-throughput reporter assays in Jurkat T cells.
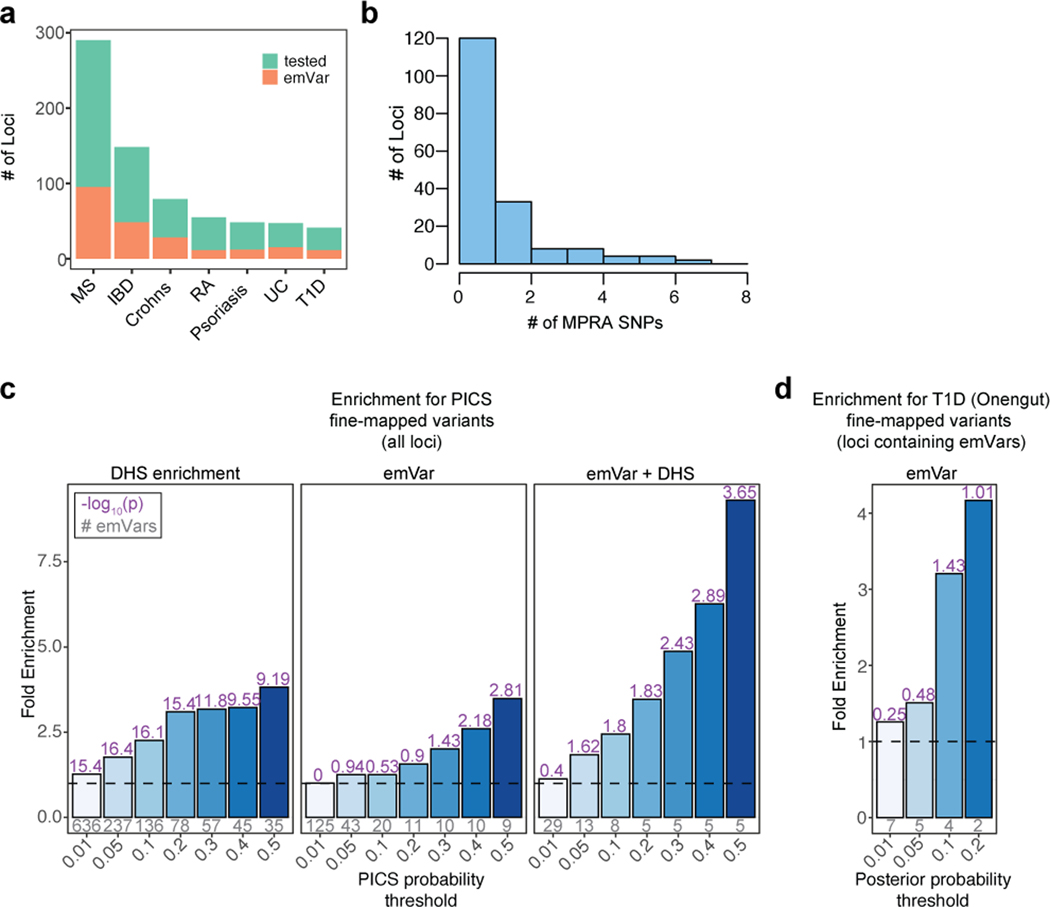
a) Workflow for creating MPRA libraries- i) Oligonucleotide synthesis of variants and 200 bp surrounding genomic region; ii) barcoding, cloning, and transfection of plasmid library into Jurkat T cells; iii) harvesting RNA from Jurkat T cells and pull down of GFP mRNA; iv) RNA-sequencing of barcodes, normalization to their prevalence in the plasmid library, and comparison of alleles for differential reporter activity (a more detailed workflow is provided in Supplementary Fig. 1a). b) Volcano plot. The log2 expression value of the highest expressing allele is on the X axis, and the log2 of the activity of allele1/allele2 is on the Y axis. pCRE = putative cis-regulatory element; emVar = expression-modulating variant. c) Bar plot showing enrichment of emVars for PICS statistically fine-mapped variants at GWAS loci where an emVar was detected, with the minimum PICS probability threshold indicated on the X axis and bars with darker shades of blue as probability increases. Gray numbers below each bar show the number of emVars that are statistically fine-mapped at a given PICS probability threshold. Purple numbers above each bar show the -log10 of the enrichment P value. Details of PICS enrichment results are shown in Supplementary Table 11. Enrichment in (c) was calculated as a risk ratio (see Methods), and P values were determined through a two-sided Fisher’s exact test.
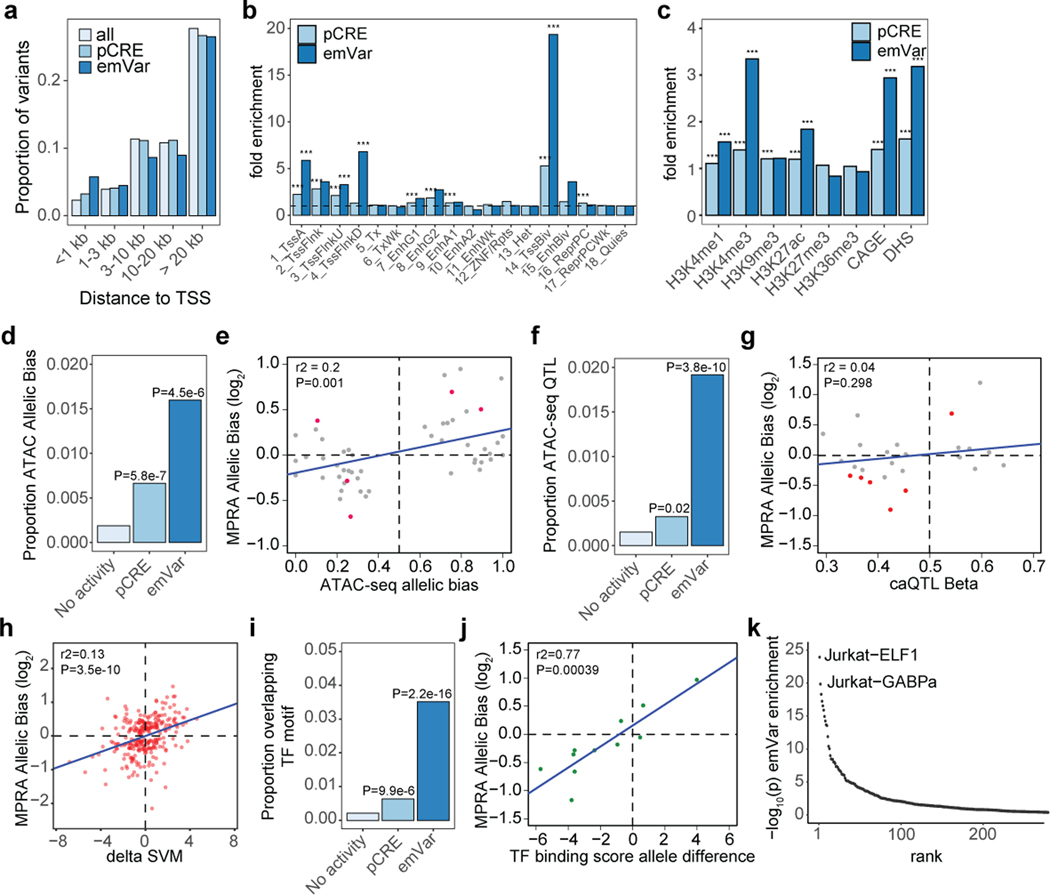
Consistent with previous studies, emVars were highly enriched for regions that were putatively cis-regulatory and for variants that are predicted to have allele-specific activities in the genome (see Supplementary Note, Supplementary Fig. 2, Supplementary Tables 4–8). Since emVars enrich for variants that impact regulatory activity, we predicted that MPRA could be used to identify causal variants at GWAS loci. Most GWAS loci are thought to have one or a small number of causal variants, with remaining variants statistically associated with a given disease solely due to tight LD with the true causal variant(s). In line with this notion, of the 181 GWAS loci for which we found an emVar (31% of all assessed GWAS loci; Supplementary Fig. 3a), 120/181 loci had only one emVar, and 169/181 loci had four or fewer emVars (Supplementary Fig. 3b). To determine if emVars are identifying causal variants, we next tested whether emVars are enriched for variants identified by statistical fine-mapping. We performed fine-mapping using Probabilistic Identification of Causal SNPs (PICS1) for all five autoimmune diseases (Supplementary Tables 9 and 10), as this method does not require full GWAS summary statistics, which were unavailable for many of the diseases we analyzed. We tested whether emVars are enriched for high PIP variants at various posterior inclusion probability (PIP) thresholds. When considering all GWAS loci, regardless of whether an emVar was identified in that locus, emVars enriched up to 3.49-fold for causal variants according to PICS (Supplementary Fig. 3c [center]; Supplementary Table 11). With an understanding that MPRA will not identify variants in all loci such as those where a coding variant is causal, we decided to test enrichments for loci where at least one emVar was identified. In these loci we found that emVars were as much as 28.5-fold enriched for causal variants according to PICS (Fig. 1c; Supplementary Table 12). Among loci containing both an emVar and fine-mapped SNP with high PIP (> 0.5), 45% of the high PIP fine-mapped SNPs were also emVars. emVars were also enriched up to 4.17-fold for high PIP variants from a T1D fine-mapping study15 (Supplementary Fig. 3d). These data suggest that MPRA is a highly robust approach for prioritizing causal variants.
To estimate the sensitivity and specificity of the MPRA, we again leveraged PICS. We constructed credible sets (Supplementary Table 9; see Methods) and calculated the sensitivity of MPRA to be 16.5% to 19.4.% and a specificity ranging from 85.2% to 89.1%. Thus, MPRA can prioritize causal variants at a fifth of all loci while maintaining high specificity.
emVars in T cell DHS are near genes that regulate T cells.
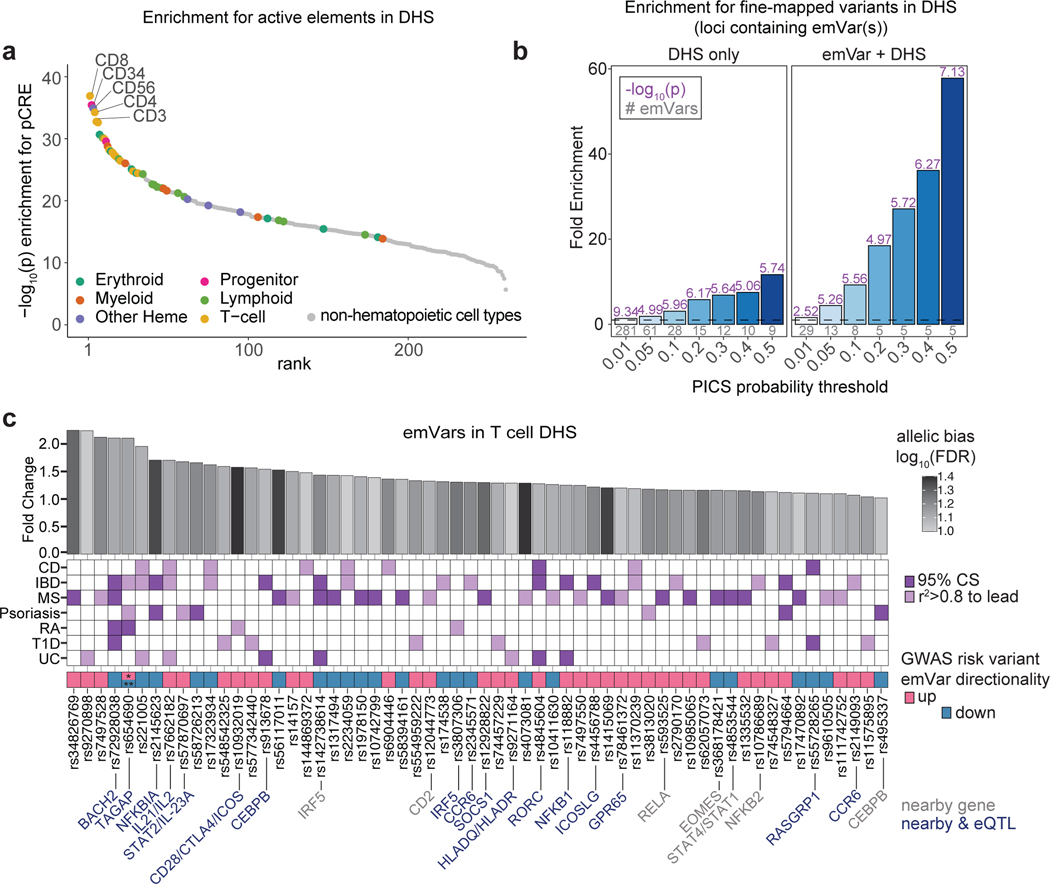
We found that active elements within our MPRA enriched for regions of accessible chromatin from T cells and other hematopoietic cell types compared to non-hematopoietic cell types (Fig. 2a), suggesting that MPRA regulatory activity accurately reflects the transcriptional regulation of the cell type in which it is tested. We previously observed enhanced enrichment for putatively disease-causal variants in the TNFAIP3 locus when intersecting MPRA variants with accessible chromatin data6. To see if this strategy further enriches for putatively causal variants in our genome-wide dataset, we compared all variants tested in MPRA to those that were in DNase I hypersensitive (DHS) regions in T cells. Of the 313 emVars, 60 overlapped a T cell DHS peak (Supplementary Table 6). For genetic associations that had at least one emVar in accessible chromatin, we found up to 57.8-fold enrichment for causal variants according to PICS (9.3-fold enrichment for all loci; Fig. 2b, Supplementary Fig. 3c [right], and Supplementary Table 11–12). We calculated sensitivity and specificity for emVars within PICS credible sets at loci where any variant on the haplotype overlapped a T cell DHS peak. When subsetting loci for those with a variant in DHS, MPRA achieved a sensitivity ranging from 19.7% to 23.4% and specificity ranging from 79.8% to 84.8%. Therefore, emVars that are present in the accessible chromatin of T cells enriched strongly for causal variants, and to a much greater extent than with either methodology alone.
Fig. 2. T-GWAS emVars in T cell accessible chromatin enrich highly for fine-mapped variants.
a) Enrichment of DHS sites from hematopoietic and non-hematopoietic cell types for MPRA pCREs. Cell types are ranked from left to right from most statistically significant to least significant. Hematopoietic cell types are colored by their ontogeny as indicated in the legend. Non-hematopoietic cell types are shown in gray. Y-axis shows the -log10 of the enrichment P value. b) Enrichment of statistically fine-mapped variants within T cell DHS sites (left) and enrichment of statistically fine-mapped variants that are emVars within T cell DHS sites (right), with darker shades of blue as probability increases. Details of PICS enrichment results are shown in Supplementary Table 9. c) Bar plot (top) of 60 emVars in T cell DHS sites with their allelic bias (y-axis) and log2FDR (shade of bar). GWAS for which emVar is associated (middle). emVars in 95% fine-mapping credible sets are shown in dark purple, while variants in tight LD to lead the variant (r2 > 0.8) but not in credible sets are shown in light purple. Immediately underneath, pink and teal boxes indicate the MPRA expression directionality of the GWAS disease risk-increasing variant as compared to the non-risk variant, followed by variant rsIDs. For one variant, rs654690, the risk alleles are opposing depending on disease, with * indicating the risk allele for both psoriasis and IBD, and ** indicating the risk allele for RA. Nearby genes that are known to play a role in T cell differentiation and function (gray) and nearby genes for which the variant is an eQTL (dark blue; according to Open Targets Genetics;53 are listed on bottom. Enrichments (a) were determined through a two-sided Fisher’s exact test. Enrichment in (b) was calculated as a risk ratio (see Methods), and P values were determined through a two-sided Fisher’s exact test. Statistical significance of allelic bias in (c, top bar plot) was calculated using a paired Student’s two-sided t-test.
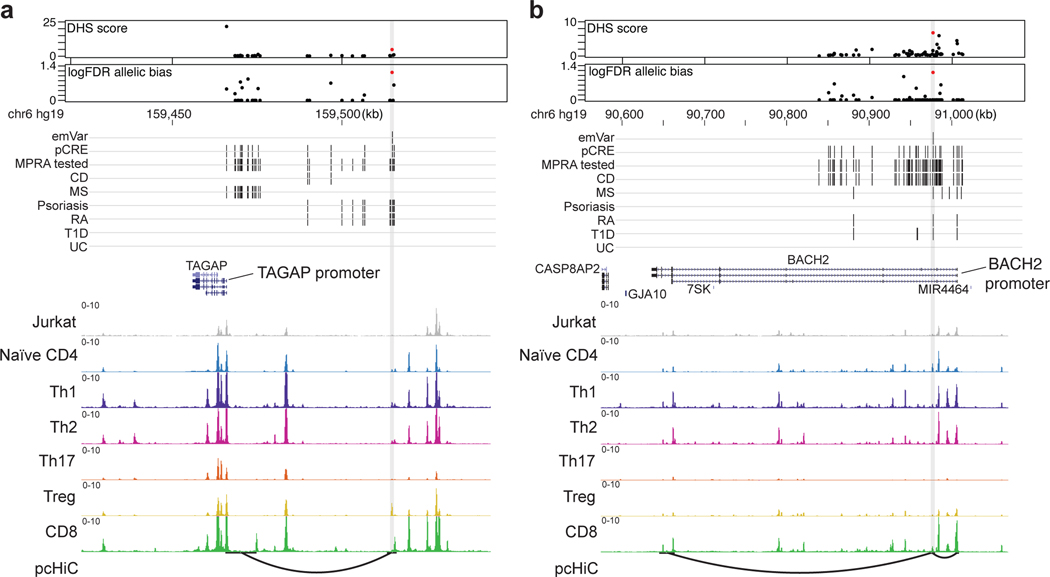
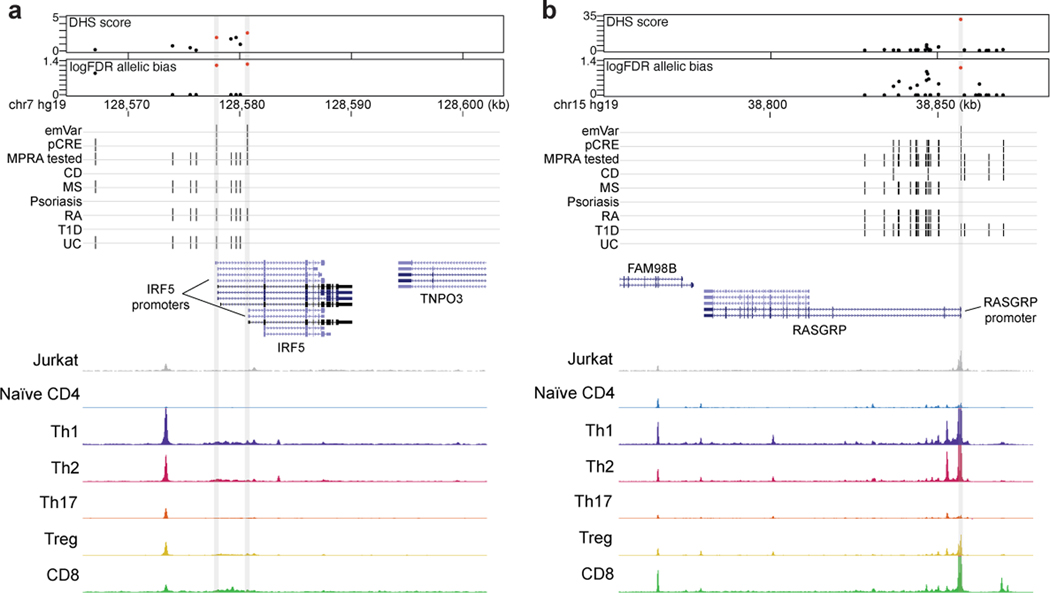
Many emVars in accessible chromatin were near (and in most cases were expression quantitative trait loci [eQTLs] for) genes with important roles in T cell biology, including genes that regulate T cell differentiation (BACH2, EOMES, RORC, CEBPB), signal transduction (CD28, CTLA4, ICOS, STAT1, STAT2, STAT4, IRF5, NFKB1, NFKB2, RELA, SOCS1), cytokine production (IL2, IL21, IL23), and migration (CCR6) (Fig. 2c). rs654690, associated with psoriasis, IBD, and RA, falls in accessible chromatin preferential to Tregs and contacts the TAGAP promoter ~50kb downstream18, a gene that has been shown to play a role in Th17 cell differentiation and thymocyte trafficking19–21 (Fig. 3a). Two emVars, rs142738614, associated with MS, RA, and UC, and rs3807306, associated with RA, were in moderate LD to each other (r2 = 0.7), and in separate regulatory elements of IRF5, a gene with many roles in immunity, including T cell-intrinsic roles that modulate signaling, migration, and differentiation22 (Supplementary Fig. 4a). rs55728265, associated with CD and T1D, is in the 5′ UTR of RASGRP1, a gene that regulates T cell signaling and differentiation23,24 (Supplementary Fig. 4b). rs72928038, associated with T1D, RA, and MS, is within an intron of BACH2, a gene involved in suppressing effector CD4 and CD8 T cell differentiation, while promoting regulatory T cell differentiation3,25 and T cell stemness26 (Fig. 3b). This variant falls within accessible chromatin preferential to naïve T cells and contacts the BACH2 promoter in naïve T cells18. Collectively, these data suggest that disease-associated emVars fall in regulatory regions that regulate genes involved in T cell signaling, differentiation, and function.
Fig. 3. Putative causal variants in a BACH2 intron and upstream of TAGAP.
a and b) Dotplot (top) showing DHS signal (DHS score) and statistical significance of allelic bias (log10FDR of MPRA allelic bias) for MPRA variants in the region; all tested variants on haplotype (black), significant emVars in DHS (red dot). Position of variants that are emVars, pCREs, variants tested in MPRA, and disease-associated variants for CD, MS, psoriasis, RA, T1D, and UC from the GWAS Catalog54 (middle). Genes in the locus are shown along with chromatin accessibility profiles (from Jurkat and specific T cell subsets) and T cell promoter capture HiC (pcHiC18) loops anchored on the region containing the emVar. pcHiC loops in (a) are specific to naïve T cells; pcHiC loop in (b) is present in all T cell subsets and conditions tested. Gray line depicts position of the prioritized emVar with respect to all data types. Statistical significance of allelic biases in (a) and (b) were calculated using a paired Student’s two-sided t-test as described in Methods.
An emVar in accessible chromatin reduces BACH2 expression.
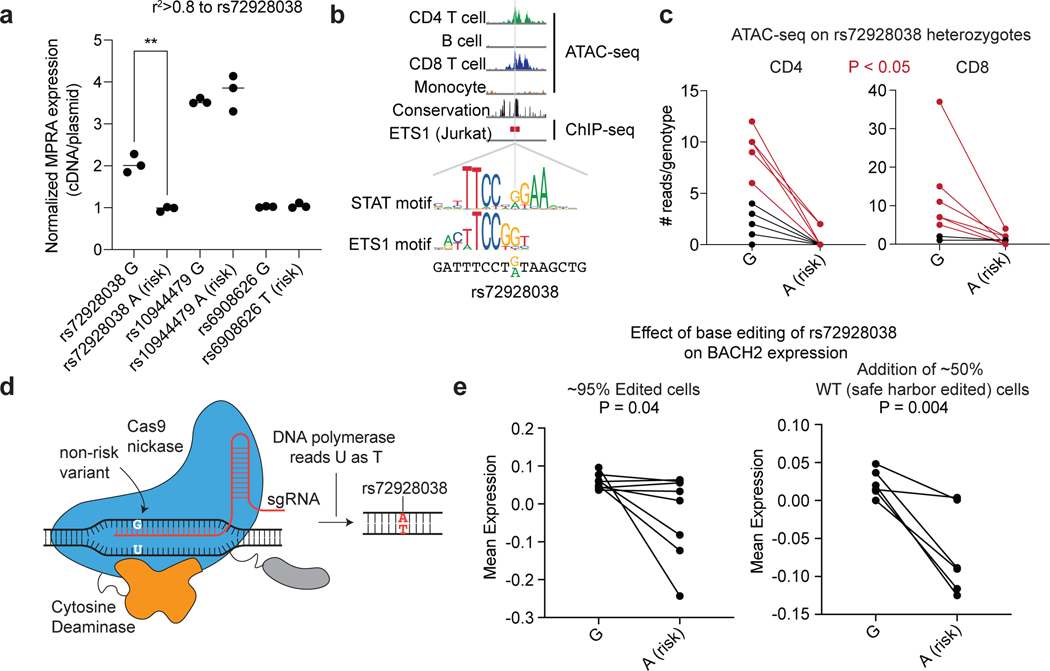
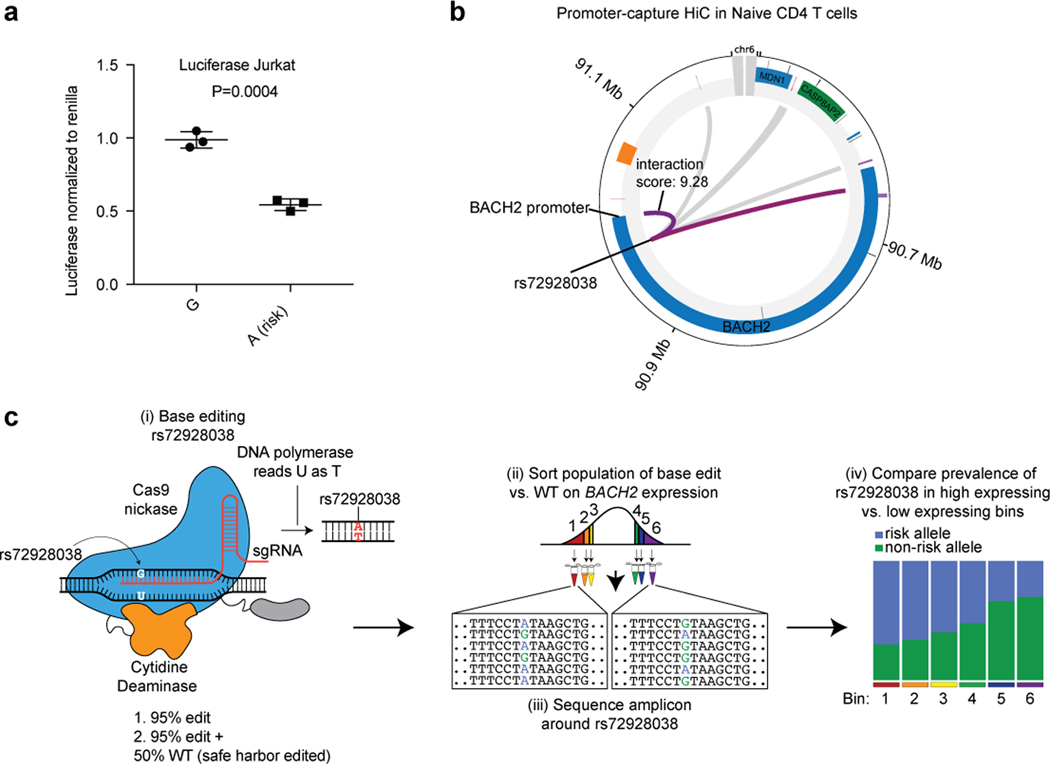
We further characterized rs72928038, as it displayed one of the strongest allelic biases in reporter activity in the MPRA (Fig. 2c). We first validated our MPRA results for rs72928038 using a luciferase assay in Jurkat T cells (Supplementary Fig. 5a). There were two other statistically fine-mapped variants in the locus, rs10944479 (PIP 0.0458 in MS GWAS) and rs6908626 (PIP 0.0894 in MS GWAS; in comparison, rs72928038 had PIP of 0.865 for MS GWAS). Neither of these variants were found to have allelic bias in the MPRA (Fig. 4a). Thus, we chose to further dissect the regulatory capacity of rs72928038 in T cells, recognizing that the other two variants (rs10944479 and rs6908626) may still contribute to disease through gene-regulatory features not recognized by an MPRA performed in T cells.
Fig. 4. Base editing of the BACH2 emVar (rs72928038) reduces BACH2 expression.
a) MPRA reporter expression of credible set variant alleles at the BACH2 locus (n=3 independent replicates). b) ATAC-seq profiles in CD4 T cells, B cells, CD8 T cells, and monocytes, vertebrate conservation, and ETS1 ChIP-seq55 at the site of rs72928038 (top). STAT and ETS1 TF motifs at the site of rs72928038 (bottom). c) ATAC-seq reads overlapping rs72928038 in CD4 and CD8 T cells from heterozygous healthy individuals (10 genotyped individuals); 5 of the 10 individuals for CD4 and 6 of the 8 individuals for CD8 (marked red) had a significant difference (at P < 0.05 using a one-sided binomial test, see Supplementary Table 13 for specific P values) in number of reads between reference and alternate alleles. d) Schematic of base editing rs72928038 using the evoCDAmax cytosine base editor. e) PrimeFlow mean expression of BACH2 in cells containing the rs72928038 non-risk (G) and base-edited risk (A) allele with rs72928038 base-edited cells alone (left; 8 independent replicates) and when combined with cells that were edited at a safe harbor locus (right; 6 independent replicates). For (a), ** indicates P = 0.002, according to a two-sided t-test; central tendency is shown as median and all points are plotted to show dispersion. For (e), central tendency is shown as mean and all points are plotted to show dispersion. P values determined by Student’s two-sided t-test (a); one-sided Binomial test (c); Student’s one-sided t-test (e).
rs72928038 is an eQTL specifically in naïve CD4, naïve CD8, and naïve regulatory T cells (but not other immune or T cell types) with the risk allele (A) associated with lower expression of BACH227. We found rs72928038 is located in accessible chromatin specifically in T cells, and not in B cells or monocytes (Fig. 4b). We surveyed CD4 and CD8 T cells from healthy donors who were heterozygous at rs72928038 and observed the non-risk allele (G) to be preferentially present in accessible chromatin in both T cell subsets (Fig. 4c; Supplementary Table 13) and the risk allele disrupts binding motifs for ETS or STAT family transcription factors (TFs) (Fig. 4b; Supplementary Table 7). Furthermore, based on published promoter-capture HiC data, the region surrounding rs72928038 physically interacts with the BACH2 promoter specifically in naïve T cells, but not other immune cell types (Supplementary Fig. 5b). These data suggest that the risk allele of rs72928038 regulates BACH2 expression specifically in T cells through reducing cis-regulatory activity.
We next sought more direct functional evidence for the role of rs72928038 in altering BACH2 expression. To do this, we used a cytosine base editor along with a guide RNA targeting rs72928038 to introduce the risk allele into Jurkat T cells, which are homozygous for the non-risk allele (Methods)28 (Fig. 4d, Supplementary Fig. 5c, and see Supplementary Note). To assess the effect of the risk variant on BACH2 expression, we isolated cells that have either high or low BACH2 expression (Supplementary Fig. 5c)6,29. For each bin, we sequenced the rs72928038 region and compared the prevalence of amplicons containing the edited risk allele to those without edits, finding that the risk variant reduces BACH2 expression (Fig. 4e, left). This effect was maintained when we added unedited cells to the edited cell pool at a 50/50 ratio (Fig. 4e, right, Supplementary Fig. 5c, and see Supplementary Note). Together, these experiments show that the rs72928038 risk allele reduces the expression of BACH2 in a human T cell line.
rs72928038 deletion in mice alters T cell stemness genes.
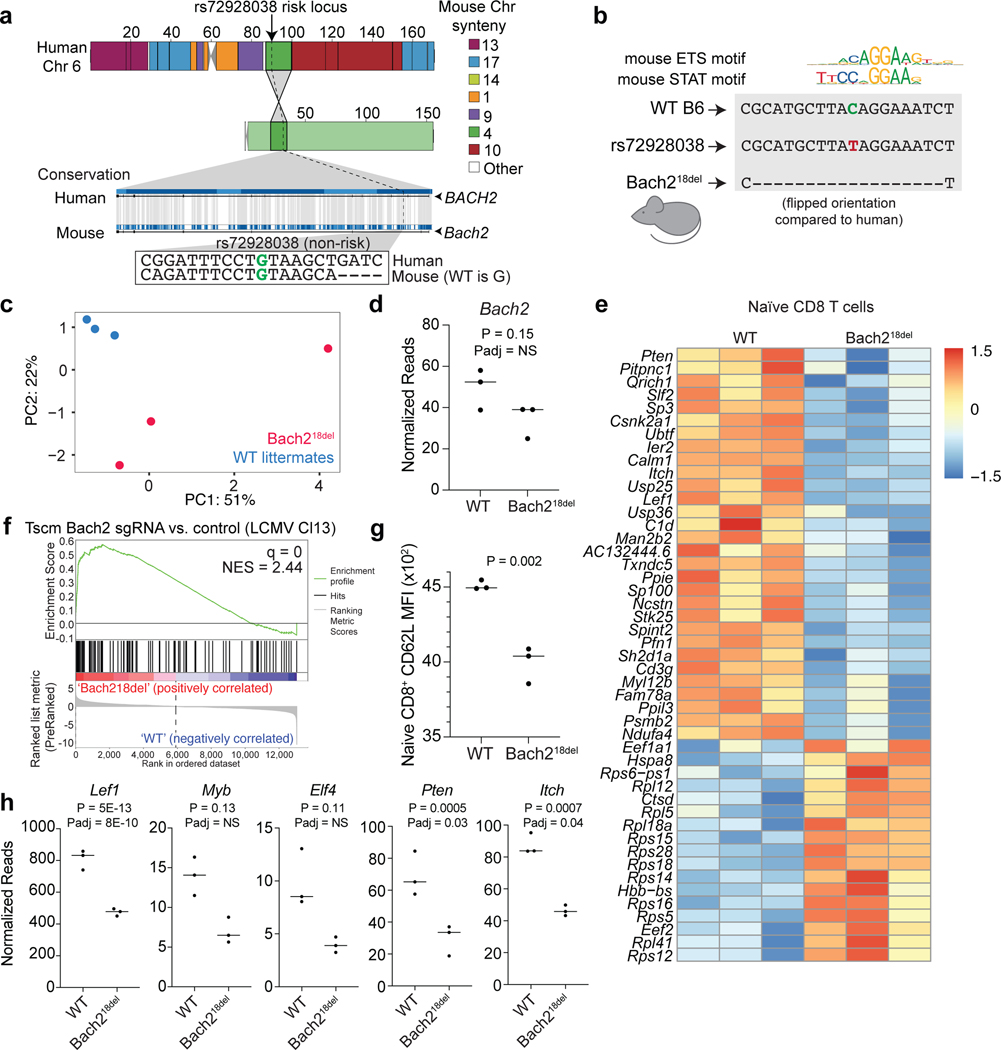
We sought to investigate the in vivo phenotypic effects of the regulatory region containing rs72928038 in primary naïve T cells. We assessed conservation between human and mouse at the site of the variant using synteny analysis of the locus, finding that the variant exists on mouse chromosome 4 within an intron of Bach2, similar to its position with respect to BACH2 in the human genome (Fig. 5a). In humans, the pCRE containing rs72928038 is 51.2% conserved between species, with especially high conservation in the 16 bps surrounding rs72928038 (Fig. 5a). Similar to human T cells, the orthologous variant region in mouse T cells has accessible chromatin, H3K27ac deposition, and both ETS1 and STAT TFs binding (Supplementary Fig. 6a)30. Based on these findings, we created a mouse line containing an 18bp deletion of the non-coding region overlapping the variant using CRISPR-mediated genome editing (Bach218del; Fig. 5b, Supplementary Fig. 6a).
Fig. 5. Naïve T cells from mice with a deletion overlapping orthologous rs72928038 have reduced transcriptional features of stemness.
a) Synteny analysis of rs72928038 between human and mouse. Location of rs72928038 (arrow and dotted line) on human chromosome 6 and mouse chromosome 4 (top) with colors indicating mouse chromosome synteny (see key). Conservation of human BACH2 with mouse Bach2, with the location of rs72928038 noted (dotted line), with inset showing conserved sequence between human and mouse at the site of rs72928038 (bottom). b) Schematic of Bach218del mutation. c) Principal components 1 and 2 from gene expression analysis of naïve CD8 T cells from Bach218del and their WT littermates. d) Bach2 gene expression within naïve CD8 T cells from WT and Bach218del mice. e) Expression heatmap of differentially expressed genes between WT and Bach218del naïve CD8 T cells (n = 3 animals per genotype). f) GSEA showing enrichment of Bach218del vs. WT naïve CD8 T cells for a gene set derived from genes differentially expressed in Bach2 guide RNA-targeted CD8 Tscm cells vs. empty vector Tscm cells. Full GSEA results are shown in Supplementary Table 13. g) Mean fluorescence intensity of CD62L surface expression on naïve WT and Bach218del CD8 T cells. h) Sample genes differentially expressed between WT and Bach218del mice in naïve CD8 T cells (c-h, n = 3 per animals per genotype). P values in (d), (e), and (h) were determined by a two-sided Wald test for significance of GLM coefficients and adjusted P values were determined using the Benjamini and Hochberg method. P values in (g) were obtained through Student’s two-sided t-test. For (d), (g), and (h), central tendency shown as median and all points are plotted to show dispersion. Normalized enrichment score (NES) in (f) was calculated based on observed enrichment as compared to enrichments from permuted data and statistical significance shown as the false discovery rate (q)58.
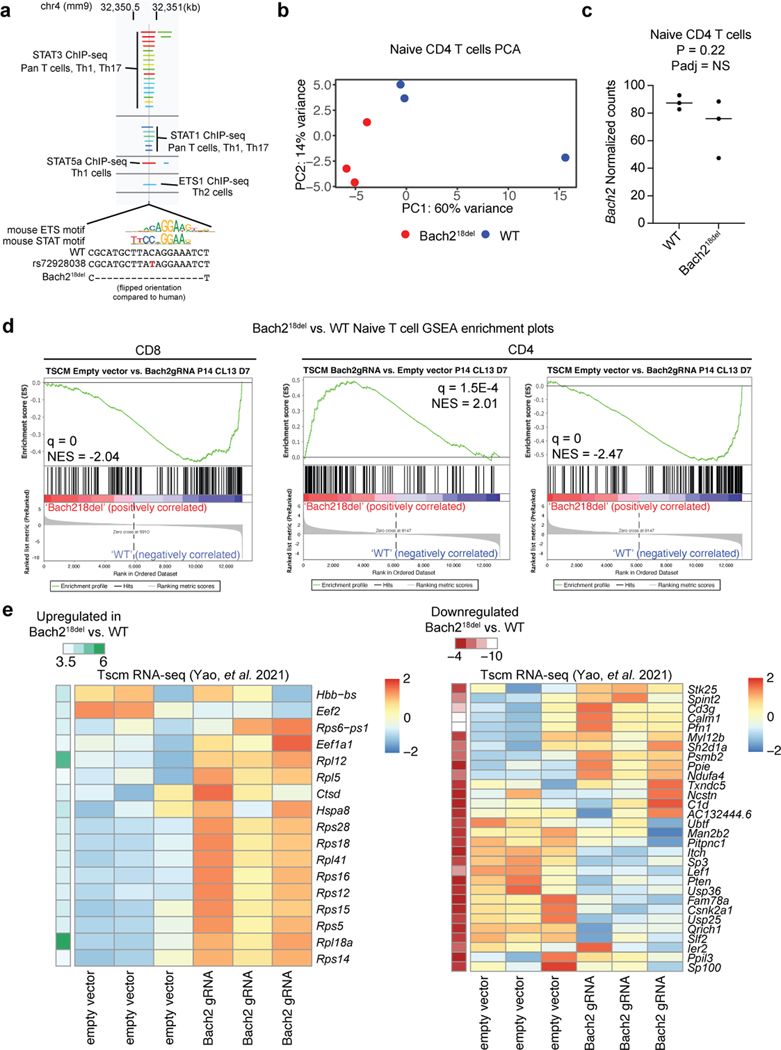
Using these mice, we performed experiments to determine if primary mouse naïve T cells containing the deletion had reduced Bach2 expression and altered expression of other important genes that play a role in T cell biology. Bach2-ablated mice have previously been shown to have aberrant CD8 T cell activation3 and reduced CD4 Treg differentiation25. To assess whether deletion of the variant alters naïve CD4 and CD8 T cell transcriptional features in mice, we sorted these cells from Bach218del and WT spleens and analyzed their transcriptomes via Bulk RNA Barcoding and sequencing (BRB-seq31). We found Bach218del cells have altered transcriptomes as compared to WT cells for both CD4 and CD8 T cell types according to principal components analysis (PCA) and a modest reduction in Bach2 expression compared to WT littermates (Fig. 5c and d, Supplementary Fig. 6b and c). Using differential expression analysis between Bach218del and WT cells, we found 18 and 47 differentially expressed genes in CD4 and CD8 T cells, respectively (Fig. 5e; Supplementary Table 14 and 15). Genes more highly expressed in Bach218del naïve CD8 T cells were enriched for KLRG1lo effector CD8 T cell gene sets (Supplementary Table 16). Interestingly, differentially expressed genes in CD4 T cells also enriched for CD8 T cell gene sets (Supplementary Table 16), suggesting that CD8 T cell gene programs are most affected by the Bach218del mutation. Differentially expressed genes from both Bach218del naïve CD4 and CD8 T cells were enriched for a gene set in which Bach2 was ablated from CD8 T stem-like memory cells (Tscms) (Fig. 5f; Supplementary Fig. 6d)26. We found 66% of the differentially expressed genes from Bach218del naïve CD8 T cells have the same directionality in Bach2 guide RNA-targeted Tscms (Supplementary Fig. 6e). Similar to Bach2-perturbed Tscms, Bach218del naïve CD8 T cells had significantly reduced CD62L surface expression (Fig. 5g), concomitant with a reduction in Lef1 and Myb expression (Fig. 5h); these TFs are required to maintain stemness of naïve T cells and Tscms, and are downregulated during effector T cell differentiation26,32–34. In addition, Bach218del naïve CD8 T cells showed a reduction in Elf4 and a significant upregulation of ribosomal protein mRNAs, both indications of early T cell stimulation35,36 (Fig. 5e and h). Bach218del naïve CD8 T cells also had reduced expression of Pten and Itch, both negative regulators of signaling that are required for suppressing effector T cell differentiation37,38 (Fig. 5h). Thus, deletion of the orthologous non-coding region containing rs72928038 in mice leads to altered gene expression of naïve T cells, including reduced transcriptional features of naïve CD8 T cell stemness and indications of early T cell activation.
Bach218del CD8 T cells are more prone to effector fates.
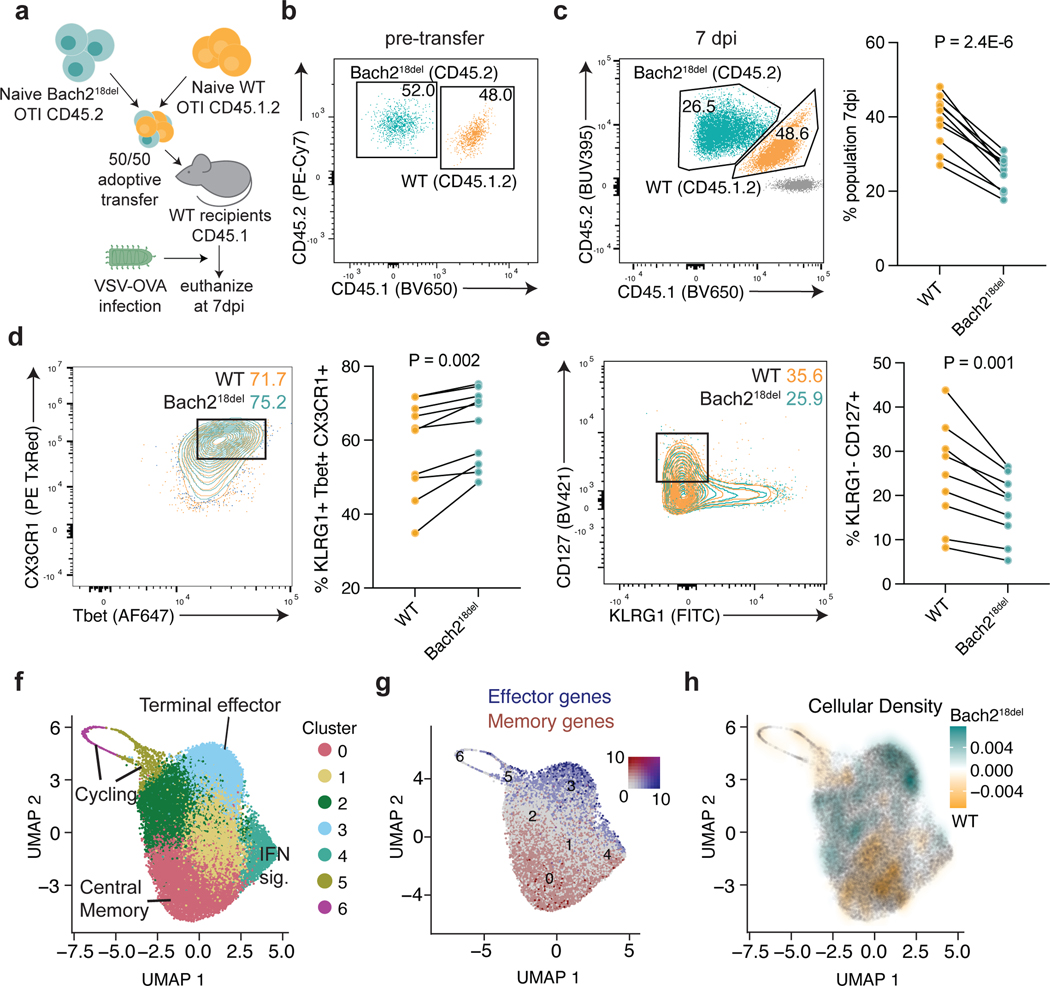
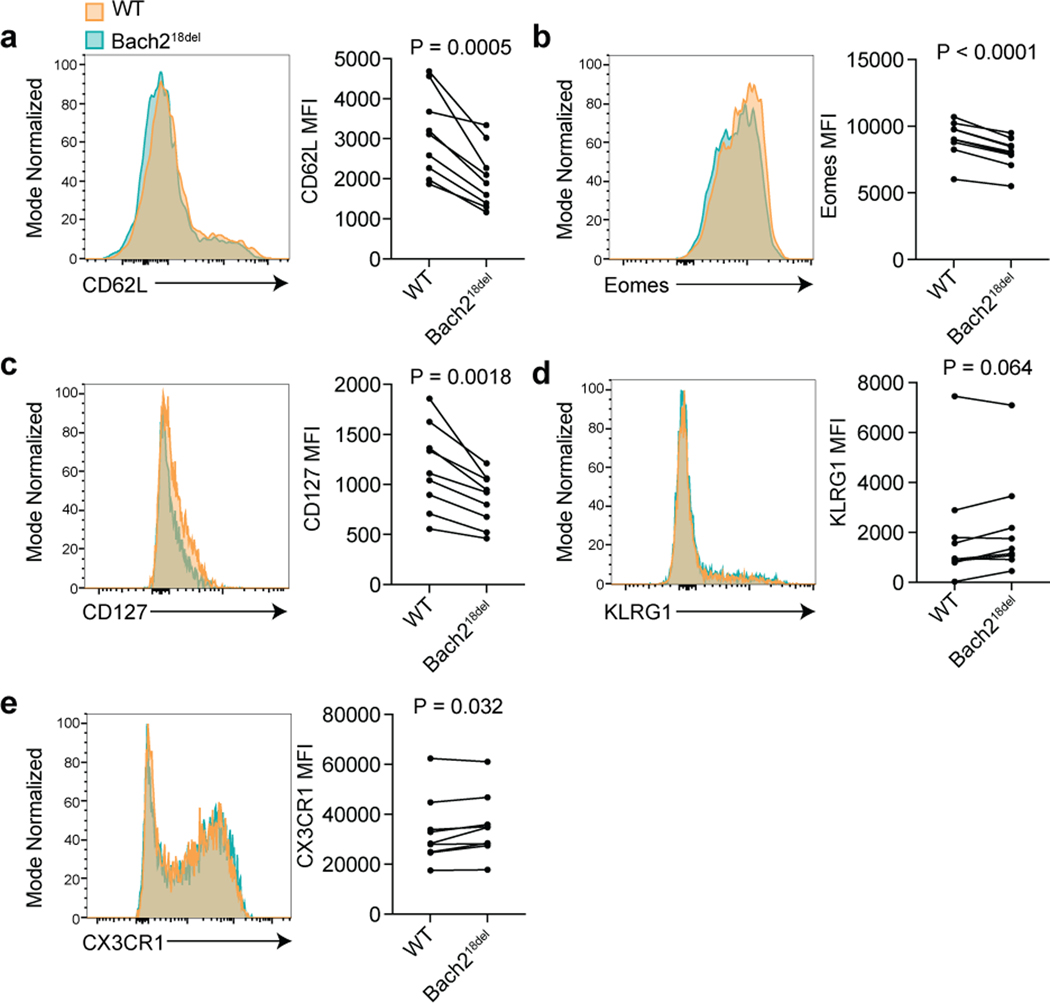
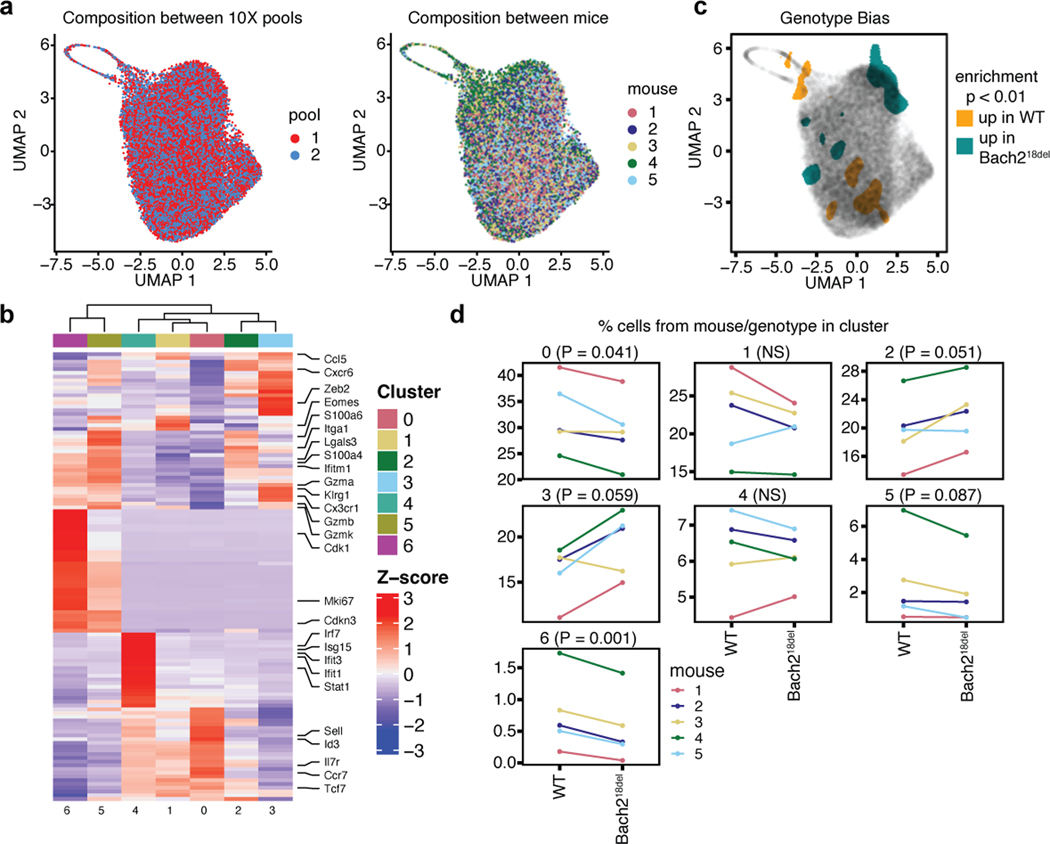
We next investigated whether Bach218del naïve T cells were more prone to effector T cell differentiation in vivo. To test this, we used a co-transfer model with a 1:1 ratio of Bach218del and WT OVA peptide-specific CD8 T cells (OTI transgenic T cells), each congenically marked (CD45.2 and CD45.1.2, respectively), and transferred into CD45.1 congenically-marked WT recipients (Fig. 6a and b). We then intranasally infected mice with vesicular stomatitis virus expressing OVA peptide (VSV-OVA; Fig. 6a). At 7 days post-infection (dpi), we found a reduced expansion of Bach218del OTI cells compared to co-transferred WT cells, consistent with previous Bach2 knockout co-transfer experiments (Fig. 6c)3. There was a higher percentage of Bach218del OTI cells that were terminal effector CD8 T cells at this time point compared to WT OTI cells, as demarcated by CD44+KLRG1+Tbet+CX3CR1+ (Fig. 6d)39–41. Conversely, Bach218del OTI cells were less prone to memory T cell differentiation (CD44+KLRG1-CD127+; Fig. 6e)39, in addition to reduced CD62L, a marker of central memory precursors, and EOMES, a TF that is required for memory formation and T cell exhaustion (Supplementary Fig. 7). We performed single cell RNA-seq on the OTI T cells from this co-transfer (5 separate recipient mice) on 8 dpi, finding that Bach218del OTI cells were more enriched in the terminal effector clusters (clusters 2 and 3) and depleted from memory clusters (0 and 1) and from cell cycle clusters (5 and 7) (Fig. 6f–h; Supplementary Fig. 8; Supplementary Table 17). Despite a proportional increase in terminal effector cells, there were few differentially expressed genes between WT and Bach218del cells within the terminal effector cluster and with generally low effect sizes (Supplementary Table 18), suggesting that the mutation confers more of its effect prior to differentiation. Thus, deletion of the orthologous region pertaining to rs72928038 leads to an increase in effector T cell differentiation following antigen stimulus in acute viral infection, suggesting that the rs72928038 risk allele promotes effector T cell differentiation through reducing Bach2 expression in naïve T cells.
Fig. 6. Bach218del CD8 T cells are more prone to effector T cell differentiation post-acute viral infection.
a) Experimental setup for OTI T cell co-transfer system. 5,000 congenically-marked naïve CD8 OTI T cells from WT and Bach218del were co-transferred into congenically-marked recipient mice, which were subsequently infected with VSV-OVA. Mice were euthanized 7 days post-infection (7 dpi) for flow cytometry analysis. b) Analysis of WT and Bach218del cell frequencies pre-transfer. c) Relative frequency of WT and Bach218del cell percentages post-transfer and 7 dpi. d) Frequency of CD8+CD44+KLRG1+CD127-Tbet+CX3CR1+ effector T cells at 7 dpi. e) Frequency of CD8+ CD44+CD127+KLRG1- memory precursors at 7 dpi. f) UMAP and cluster analysis of OTI WT and Bach218del single cell RNA-seq at 8 dpi. g) UMAP plot showing expression of effector (Klrg1, Gzmb, Zeb2) and memory (Il7r, Ccr7, Tcf7, Sell) genes in blue and red, respectively. h) UMAP plot showing relative cellular density enrichment of Bach218del vs. WT cells. For (c-e), n = 10 biologically independent animals per experiment examined over 2 experiments and P values were determined by Student’s two-sided paired t-test.
Discussion
Identifying mechanisms that drive genetic risk for autoimmunity and other complex phenotypes remains a substantial challenge. Here, using a combination of MPRA and T cell chromatin accessibility, we identify 60 variants associated with five autoimmune diseases that enrich 57.8-fold for causal variants according to statistical fine-mapping. Collectively, these data demonstrate that this combination of established methods serves as a robust prioritization scheme for identifying causal variants for disease associations. Combining MPRA and accessible chromatin was an effective strategy, possibly because chromatin accessibility, which provides an endogenous measure of cis-regulatory activity from relevant cell types, acts as a stringency filter for MPRA, which is plasmid-based. Other prioritization methodologies could also be applied in tandem such as allele-specific ATAC-seq5, CRISPR-interference29,42, and SELEX43, among others. However, requiring a variant to score for multiple methodologies may substantially increase type II error, as different methods tend to test different genomic features and have variable signal-to-noise ratios6. Thus, combining data from orthogonal tests of variant action with high signal-to-noise ratios, such as MPRA and accessible chromatin, could provide a reasonable balance between sensitivity and specificity6. Because perturbational and statistical fine-mapping are still imperfect approaches, discovery of causal variants still requires further mechanistic evaluation, ideally within systems that recapitulate the (patho)-physiological environment of the disease.
We discovered emVars for ~31% of GWAS loci studied, which explains the low sensitivity (16.4–23.4%), although high specificity (79.8–89.1%) of our assay for identifying causal variants. There are a variety of reasons why many loci did not contain an identified emVar. We found emVars to be enriched in transcription start site (TSS) regions, thus this methodology may have increased sensitivity for variants that alter promoter activity. We performed the MPRA in Jurkat T cells, and while our results enrich highly for likely causal variants, performing these experiments in primary T cells will likely improve the biological conclusions from the experiment. Similarly, we performed the experiment in unstimulated conditions, although variants may disrupt TFs that are downstream of signaling cascades following T cell stimulation or differentiation into specific effector cell subsets (e.g., Th1, Th2, Th17, Treg, Tfh). Stimulation with various ligands in eQTL studies has been crucial for identifying variants that were otherwise inactive at baseline44–46. Other cell types also play a role in these autoimmune diseases, and their active chromatin also enriches for disease-associated variants47,48,49,50. While variants in putative regulatory regions make up a substantial portion of disease-associated variants1,2, many loci may contain variants that have roles beyond disrupting cis-regulatory elements, such as coding mutations, altering the activity of untranslated regions (UTRs), or promoting alternative splicing. These actions will not be identified by MPRAs designed to test how variants modulate transcriptional activity, but alternative massively parallel methodologies have been created to address how variants may alter UTR function and alternative splicing51,52. Furthermore, our results are highly dependent on the quality of the genetic association study and the selection of variants for testing. Thus, applying the prioritization scheme of MPRA with accessible chromatin and other methodologies to a wider range of cell types (including primary cells), stimulation conditions, and improved genetic mapping could unveil additional likely causal variants.
Using our MPRA and accessible chromatin prioritization scheme, we found variants in GWAS loci that were highly relevant to T cell biology, including rs72928038 in the BACH2 locus. We selected rs72928038 for further mechanistic studies including testing its effects in a mouse model. Similar to Bach2-deficient CD8 stem-like memory cells from a separate study26, we observed that Bach218del naïve CD8 T cells have reductions in stem-associated genes. Both naïve CD4 and CD8 T cells from Bach218del vs. WT mice enriched for a Bach2-ablated CD8 stem-like memory cell gene set, suggesting that deletion of the variant recapitulates aspects of full Bach2 ablation, albeit to a much more modest degree36. However, Bach218del naïve CD8 T cells do not appear to have phenotypes of fully differentiated effector cells (e.g., increased expression of Gzmb, Klrg1 and Cd44), possibly due to only partial Bach2 reduction mediated by removing only a single regulatory element versus deletion of the gene. Indeed several TFs have been noted to act in a graded manner to promote transcription and cell fate during the differentiation of CD8 T cells40,41, and mice heterozygous for the deletion of Bach2 show intermediate effects on T cell differentiation between WT and homozygous mice25. During acute viral infection, naïve CD8 T cells from Bach218del mice differentiate more readily into effector T cells compared to WT naïve CD8 T cells, indicating that the risk allele may shift T cell programs at the naïve stage leading to more effector cell differentiation, and this could be a key mechanism for how rs72928038 promotes autoimmunity. Since Bach2 also plays an important role in CD4 T cell differentiation into Tregs25, future experiments should be performed to understand the effect of Bach218del on Treg differentiation, and furthermore, experiments are warranted to determine whether Bach218del effects on CD4 and CD8 T cells lead to an exacerbation of autoimmune phenotypes in mouse models of autoimmunity. Thus, organismic models, such as the Bach218del mice, provide rare insight into the physiological effects of variants and their regulatory elements within living systems.
In summary, this work provides a scalable and high-yield prioritization scheme to identify likely causal variants at high specificity. We find 60 likely causal variants that have significant evidence for acting in T cells, and direct evidence for a variant that reduces Bach2 expression and transcriptional hallmarks of T cell stemness to increase effector T cell differentiation. Together, this work demonstrates a clear path for addressing the long-term obstacle of defining causal variants for complex traits and their effects on gene regulation and cellular and organismal functions.
METHODS
Cell lines
For MPRA, luciferase, and base editing experiments, we used low passage aliquots of the Jurkat T cell line (ATCC TIB-152™;), maintaining the culture under 20 passages. Cells were grown at 37 °C maintaining cultures between 1×10⁵ and 1×10⁶ cells per mL.
Study subjects
The study was performed in accordance with protocols approved by the institutional review board at Partners (Brigham and Women’s Hospital, Massachusetts General Hospital, Dana-Farber Cancer Institute, Boston, USA) and Broad Institute (USA) Research Ethics Committee, as well as the Feinstein Institute for Medical Research, Northwell Health institutional review board (Manhasset New York, USA). All donors provided written informed consent for the genetic research studies and molecular testing. Healthy donors were recruited from the Sisters of Lupus Erythematosus patients (SisSLE) Research Study based in Manhasset, NY, and the Boston-based PhenoGenetic project, a resource of healthy subjects. For SisSLE subjects younger than 18 years old, parents signed an informed consent form that contained the following summarized statement: “I have read the above description of the sister of a patient with SLE Research Study. I have been informed of the risks and benefits involved and all my questions have been answered to your satisfaction. I have been assured that a member of the research team will answer any future questions that may arise. I voluntarily agree that my child’s blood, DNA and information can be stored indefinitely for the use in future research to learn about, prevent or treat health problems. By signing this form I have not given up any of my legal rights. I will be given a signed and dated copy of this informed consent form.”
Animals
All animal procedures were performed in accordance with the National Institutes of Health Guide and were approved by the Institutional Animal Care and Use Committees of The Jackson Laboratory, Broad Institute, and the Benaroya Research Institute. Bach218del mice were generated using direct delivery of CRISPR-Cas9 reagents to mouse zygotes following the protocol of Qin et al. including guide design and electroporation56 (see Supplementary Methods). Mice 8–12 weeks of both sexes were used for animal experiments. Mice were housed in a 12 h light/dark cycle with humidity 40–60%.
GWAS data
Lead SNPs were obtained from GWAS for T1D15, RA17, psoriasis16, IBD12, and MS13,14. We collected 578 GWAS lead SNPs from these studies, representing 531 distinct GWAS loci. We identified all proxy SNPs (r2 ≥ 0.8) for each lead SNP based on 1000 Genomes Phase 3 European subset. Proxy SNPs were identified using PLINK v1.90b3.3257 (www.cog-genomics.org/plink/2.0/) with parameters --r2 --ld-window-kb 2000 --ld-window 999999 --ld-window-r2 0.8. There were 20792 total proxy SNPs across the 578 GWAS loci (18324 unique proxy SNPs across these 531 distinct GWAS loci).
MPRA
MPRA oligo synthesis and cloning was adapted from refs6,8. To generate our MPRA, library alleles were synthesized as 200 bp elements centered within their genomic context. We also included 91 positive enhancer controls and 506 negative controls used in a previous MPRA study (Supplementary Table 2)8. For library generation details, see the Supplementary Methods. For all transfections, cells were grown to a density of ~1 × 10⁶ cells/mL, and 1 × 10⁸ cells were used for each experiment. Cells were collected by centrifugation at 300 × g and eluted in 1 mL of RPMI with 100 μg of mpra:minP:gfp library. Electroporation was performed in 100 μL volumes with the Neon transfection system (Life Technologies) applying three pulses of 1600V for 10 ms each on Jurkat T cells. Using separate control transfections, we achieved transfection efficiencies of 40–60% for all replicates. Cells were allowed to recover in 200 mL RPMI with 15% FBS for 24 h before being collected by centrifugation, washed once with PBS, collected and frozen at −80 °C. Total RNA was extracted from cells and GFP mRNA was pulled down (see Supplementary Methods).
First-strand cDNA was synthesized from half of the DNase-treated GFP mRNA with SuperScript III and a primer specific to the 3′ UTR (MPRA_v3_Amp2Sc_R, Supplementary Table 19) using the manufacturer’s recommended protocol, modifying the total reaction volume to 40 μL and performing the elongation step at 47 °C for 80 min. Single-stranded cDNA was purified by SPRI and eluted in 30 μL EB, followed by preparation of cDNA sequencing libraries (see Supplementary Methods).
MPRA analysis
To analyze barcodes from MPRA data, the sum of the barcode counts for each oligo was provided as input to DESeq2 and replicates were median normalized followed by an additional normalization of the RNA samples to center the RNA/DNA activity distribution over a log2 fold change of zero58. Oligos showing differential expression relative to the plasmid input were identified by modeling a negative binomial distribution with DESeq2 and applying a false discovery rate (FDR) threshold of 1%. For sequences that displayed significant MPRA activity, a paired two-sided Student’s t-test was applied on the log-transformed RNA/plasmid ratios for each experimental replicate to test whether the reference and alternate allele had similar activity. An FDR threshold of 10% was used to identify SNPs with a significant difference in MPRA activity between alleles (emVars). Barcode prevalence in plasmid and cDNA replicates was tightly correlated and some barcodes were more present in cDNA than in plasmid libraries, indicative of their higher expression (Supplementary Fig.1b; Supplementary Table 3).
Epigenetic enrichments and allele-specific predictions
Details regarding MPRA enrichment analysis for epigenetic and allele-specific predictions can be found in the Supplementary Methods.
PICS fine-mapping and enrichment analyses
For each GWAS locus, PICS1 was applied to all SNPs in LD (r2 ≥ 0.8) to the lead SNP based on the 1000 Genomes Phase 3 European subset using PLINK v1.90b3.32 with parameters --r2 --ld-window-kb 2000 --ld-window 999999 --ld-window-r2 0.8. GWAS association P values for lead SNPs were obtained from the EMBL GWAS catalog54 on August 10, 202054. If the same lead SNP was seen multiple times in the GWAS catalog for either the same disease or multiple diseases, the most significant lead SNP P value was used. Given long-range patterns of high LD, we excluded the human MHC locus (chr6:29691116–33054976 in hg19) and excluded any lead SNP where the most significant GWAS association P value did not reach 5 × 10⁻⁸. In total, 512 GWAS loci were analyzed. PICS fine-mapping PIPs were calculated using a custom PERL script. Of note, in the scenario where a lead SNP was seen multiple times (either across the same disease or shared by different diseases), all proxy SNPs to the lead SNP were assigned based on the most significant lead SNP association P value, and PICS probabilities were calculated for both this lead SNP and its proxies.
We defined a SNP as being statistically fine-mapped based on whether it had a PIP greater than a given threshold, or whether it was in a fine-mapping credible set. We used PIP thresholds of ≥ 0.01, 0.05, 0.1, 0.2, 0.3, or 0.5. We also calculated credible sets of fine-mapping variants. An X% credible set is expected to contain the true causal variant X% of the time. To generate credible sets, we summed up the highest fine-mapping PIPs at each locus until reaching a cumulative X%. We further required all credible set variants to have a fine-mapping PIP ≥ 0.01. Formulas for calculating enrichment of emVars for PICS and T1D fine-mapped SNPs can be found in the Supplementary Methods.
Visualization of GWAS loci
For visualization of gene tracks, bigWig files (Fig. 3a, 3b, Supplementary Fig. 4a and 4b) were downloaded from ENCODE. For cell types with multiple bigWig tracks, these were merged using bigWigMerge in the UCSC genome browser software suite59. bigWig tracks were then loaded into the UCSC genome browser (hg19). Track heights were adjusted to the maximum height of all tracks in a given viewing window. Gene transcripts are based on default UCSC genome browser gene annotations. To calculate the DHS score, the DHS sequencing depth in a ±10 bp window around each MPRA SNP was calculated using the multiBigwigSummary command in deepTools v3.5.060 with default options. The DHS score plot shows the maximum DHS signal observed across each of the T cell types. PCHiC loops for Figs. 3a, 3b and Supplementary Fig. 5 were plotted using data from Javierre, et al18; we created a bigInteract file and visualized loops in UCSC genome browser (http://hgw1.soe.ucsc.edu/goldenPath/help/interact.html). The visualized loops were selected from those with a CHiCAGO score ≥ 5.
Luciferase Assay
Firefly luciferase reporter constructs (pGL4.24) were generated by cloning the 300 nucleotide genomic region centered on rs72928038 (rs72928038_luc_G and rs72928038_luc_A, Supplementary Table 19) of interest upstream of the BACH2 promoter (Bach2_promoter_luc Supplementary Table 19) by using BglII and XhoI sites. The firefly luciferase constructs (500 ng) were nucleofected with a pRL-SV40 Renilla luciferase construct (50 ng) into 2 × 10⁶ Jurkat cells by using the Neon nucleofection system (Invitrogen) using the program 1600V, 3 pulses, 10 ms. After 48 h, luciferase activity was measured by Dual-Glo Luciferase assay system (Promega) according to the manufacturer’s protocol. For each sample, the ratio of firefly to Renilla luminescence was measured and normalized to the empty pGL4.24 construct. Two separate biological replicates with at least 3 technical replicates per rs72928038 allele were conducted. For comparison of luminescence conferred by rs72928038 risk and non-risk alleles in the luciferase assay, we used a two-sided Student’s t-test.
Base-editing and PrimeFlow
Base editor (evoCDAmax-SpCas9-NG) was provided by TriLink Biotechnologies. The transcription template including ORF, mammalian-optimized UTR sequences, and 120-base polyA tail were amplified by PCR using mRNA forward primer and mRNA reverse primer61
(Supplementary Table 19). mRNA was transcribed in vitro at 37°C for 2 hr in the following condition: 0.025 μg/μL transcription template, 40 mM Tris, 10 mM dithiothreitol, 2 mM spermidine, 0.002% Triton X-100, 16.5 mM magnesium acetate, 8 U/μL T7 RNA polymerase (NEB, M0251L), 0.002 U/μL inorganic pyrophosphatase (NEB, M2403L), 1 U/μL murine RNase inhibitor (NEB, M0314L), 4 mM CleanCap AG (TriLink Biotechnologies, N-7113), 5 mM ATP, 5 mM CTP, 5 mM GTP, and 5mM 5-methoxyuridine. The reaction was treated at 37°C for 15 min with 0.4 U/μL DNase I (NEB, M0303L) in 1× DNase I buffer and purified using RNeasy kit (QIAgen).
To edit Jurkat T cells, 1 × 10⁶ were centrifuged at 500 × g for 5 min, washed with 1X PBS, and centrifuged again at 500 × g for 5 min. The cells were resuspended in 12 uL of plain RPMI 1640, 3 μg of evoCDAmax, and 100 μM IDT-synthesized guide RNA was added, and cells were nucleofected using the Neon transfection system program 1600V, 3 pulses, 10ms. Cells were ejected into RPMI. rs72928038 base-edited cells were either left alone or combined with safe harbor base-edited cells (termed WT for the purposes of this study). The cells were incubated for 7 days prior to harvesting for PrimeFlow, sorting, and sequencing library preparation (see Supplementary Methods).
CRISPResso (version 2.0.29)62 was used to count the genotypes of each of the base editor-induced mutations present within the sequencing data associated with each FACS sorting bin. The read counts and genotypes for each sorting bin and the unsorted cells as output by CRIPSResso, were input into R, and MAUDE (version 0.99.3)63 was used to infer the expression levels of genotype, separately for each experiment. Here, we assumed that 10.5% of the cells were sorted into each of the sorting bins, which was the approximate number observed to fall into each bin during the experiments. We used MAUDE’s ‘findGuideHitsAllScreens’ function to identify the mean expression associated with each genotype (treating genotypes as MAUDE “guides”), using default parameters. The statistical effect of rs72928038 base edits compared to WT on BACH2 expression were calculated using a paired (by experiment) one-sided Student’s t-test with unequal variance.
ATAC-seq
We used the FAST-ATAC protocol4. Human primary T cells from female subjects (age 12–46) were isolated from blood by Ficoll, followed by flow sorting of live cell single lymphocytes, CD3+ CD4+. Cells were sorted into RPMI with 10% FBS and were immediately processed for ATAC-seq. 10,000–40,000 cells were sorted into RPMI 1640 containing 10% fetal bovine serum. The cells were centrifuged at 500 × g for 5 min at 4 °C. All of the supernatant was aspirated, ensuring that the pellet was not disturbed in the process. The pellet was then resuspended in the tagmentation reaction mix (25 μL 2X TD Buffer (Illumina, 15027866), 2.5 μL TD Enzyme (Illumina, 15038061), 0.5 μL 1% Digitonin (Promega, G9441), 22 μL H2O) and mixed at 300 RPMs at 37 °C for 30 min on an Eppendorf Thermomixer. Immediately after the incubation, samples were purified using a minElute kit (Qiagen, 28006), eluting in 10 μL. For library preparation, sequencing, and analysis, please see the Supplementary Methods.
Isolation of primary mouse T cells
Mouse primary naïve CD8 T cells were isolated from the spleens of WT or Bach218del mice through sorting on live single lymphocytes, CD3+ CD8+ CD62Lhi CD44lo into PBS containing 2% FBS (Antibody catalog numbers and dilutions can be found in Supplementary Table 19). Cells were spun at 500 × g for 5 min and lysed by RLT buffer with 40 mM DTT, followed by processing for BRB-seq.
BRB-seq
Naïve T cells were sorted from spleens collected from 21-week-old females. 5 × 10⁵ cells for each replicate were sorted by using BD FACSymphony S6 with a 70 μm nozzle. The fluorophore-conjugated antibodies and dilutions used for cell sorting are listed in Supplementary Table 19. Total RNA from sorted cells was isolated by using RNeasy plus micro (QIAGEN, 74034). 50 ng for each sample was used for the reverse transcription with barcoded primer BU3 (IDT; Supplementary Table 19) followed by the purification, second strand synthesis and tagmentation following the original BRB-seq protocol but using AMPure XP for purification31. Tagmented library was amplified with P5_BRB and BRB_Idx7N5 primers (5 μL, Supplementary Table 19) using NEBNext UltraTM II Q5 Master Mix (NEB, M0544L) which was incubated at 98 °C for 30 sec before adding DNA with the following conditions: 72 °C 3 min, 98 °C for 30 sec, and 15 cycles of (98 °C for 10 sec, 63 °C for 30 sec, 72 °C 60 sec), 72 °C for 5 min. Libraries were sequenced by NextSeq 550 High Output with 21 bp for read 1 and 72 bp for read 2 (Illumina). Sequenced reads were aligned using STAR (v2.7.6a, --outFilterMultimapNmax 1)64 followed by demultiplexing using BRB-seq Tools (v1.6)31. For BRB-seq analysis, please see Supplementary Methods.
Adoptive transfer and VSV-OVA infection
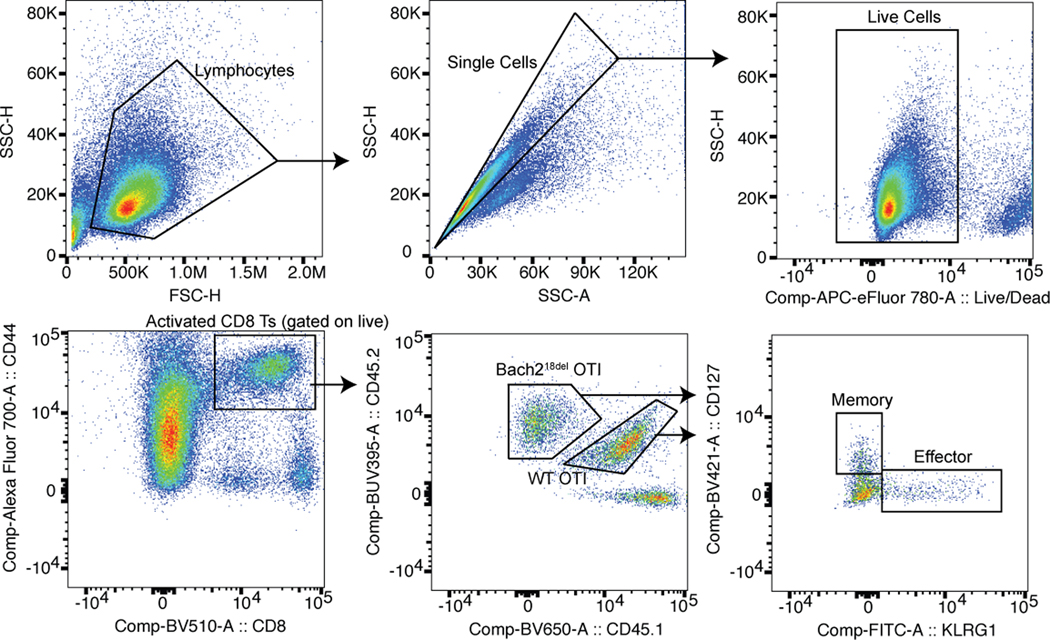
Donor OT-1 CD8 T cells from wild-type CD45.1/2+ and Bach212del CD45.2+ donor mice were isolated by mashing spleens through a 70 μm strainer, followed by red blood cell lysis with ACK lysis buffer (Gibco) for 1 min and positive selection with anti-CD8a microbeads (Miltenyi 130-117-044). Cells were stained in 200 μl total volume for 20 min at 4 °C before sorting naïve OT-1 cells (live CD44− CD62L+ CD8a+ TCR Vα2+ TCR Vβ5+, catalog number and dilution info in Supplementary Table 19). 5000 WT and 5000 Bach212del cells were co-transferred into 10 CD45.1 recipient mice by retroorbital injection, and recipient animals were intranasally infected the following day with 104 PFU of VSV-OVA. After 7 days, spleens were collected from infected mice and processed as described above. Cells were stained for surface antigens (KLRG1, CD127, CD8A, CD45.1, CD45.2, CD62L, CD44, CX3CR1, CXCR3, info in Supplementary Table 19, see Supplementary Fig. 9 for gating strategy) for 20 min at 4 °C, fixed with Intracellular Fixation & Permeabilization Buffer (eBioscience), and stained for intracellular antigens (Tbet, Eomes, info in Supplementary Table 19) for 45 min at RT. Cells were analyzed on a Cytek Aurora and counting beads (Polysciences 18328–5) were used to enumerate cells and gated using FlowJo (10.8.1). Two independent experiments were conducted.
Single-cell RNA-sequencing
Five mice were co-transferred Bach218del and WT OTI cells and infected with VSV-OVA. At 8 days post-infection, T cells were isolated from mouse spleens using a pan-T cell magnetic selection kit. T cells from each mouse were labeled with independent Hashtag antibodies for each mouse and stained for CD8, CD45.1, and CD45.2. We sorted 100K CD45.2 (Bach218del OTI T cells) and CD45.1.2 (WT T cells) and mixed them in two pools- WT and Bach218del cells from the same mouse were separated into both pools (to avoid mixing WT and mutant cells with the same Hashtag), and Bach218del and WT cells from different mice were mixed among both pools (pool 1: 3 WTs and 2 mutants; pool 2: 2 WTs and 3 mutants). 10X libraries were prepared according to manufacturer protocol. Briefly, a single cell suspension was prepared from pooled sorted cells and loaded onto two channels of the 10X Chromium Controller (10X Genomics) according to the manufacturer’s protocol, with a target capture of 30,000 cells per channel. Sequencing libraries were generated using the NextGEM Single Cell 5’ Kit v2 kit. Gene expression and feature barcoding libraries were pooled at a ratio of 8:1 and treated with Illumina Free Adapter Blocking Reagent (Illumina) to block free adapters and reduce index-hopping. Sequencing of pooled libraries was carried out on a NextSeq 2000 sequencer (Illumina), using three NextSeq P3 flowcells (Illumina) with a target depth of 25,000 raw reads per cell. For RNA-seq analysis, please see Supplementary Methods.
Data availability
Data generated in this study from all manuscript figures are available in NCBI GEO (GSE197539). 1000 Genomes Phase 3 reference panel was obtained from ftp://ftp.1000genomes.ebi.ac.uk/vol1/ftp/release/20130502/. DHS data across 733 samples were obtained from https://zenodo.org/record/3838751#.X_IA7-lKg6U. Histone ChIP-seq data were downloaded from ENCODE (encodeproject.org); the specific files utilized are listed in Supplementary Table 20. CAGE-based enhancer annotations were downloaded from https://fantom.gsc.riken.jp/5/datafiles/latest/extra/Enhancers/. chromHMM were obtained from https://egg2.wustl.edu/roadmap/data/byFileType/chromhmmSegmentations/ChmmModels/core_K27ac/jointModel/final/. HOCOMOCO transcription factor position-weighted matrices were obtained from https://hocomoco11.autosome.ru/downloads_v10. ATAC-seq allelic skew data was obtained from Calderon, et al.5 (https://www.nature.com/articles/s41588–019-0505–9; Supplementary Table 1, “significant_ASCs” tab). Chromatin accessibility QTLs were downloaded from Gate et al.65 (https://www.nature.com/articles/s41588–018-0156–2; Supplementary Table 6). DeltaSVM precomputed weights for Naive CD4 T cells and Jurkat cells were obtained from http://www.beerlab.org/deltasvm_models/downloads/deltasvm_models_e2e.tar.gz. The EMBL GWAS catalog54 (https://www.ebi.ac.uk/gwas/) was accessed on August 10, 2020. T1D GWAS fine-mapping results were obtained from Onengut-Gumuscu et al.15 (https://www.nature.com/articles/ng.3245; Supplementary Table 1). Promoter capture HiC data was obtained from Javierre, et al.18 (https://osf.io/u8tzp/). The ImmunoSigDB immunologic signatures database (v7.2) was downloaded from http://www.gsea-msigdb.org/gsea/msigdb/. Tscm Bach2-gRNA perturbed mouse RNA-seq data was obtained from NCBI GEO (GSE152379). The GRCm38 mouse transcriptome index for Kallisto RNA-seq alignments were obtained from https://github.com/pachterlab/kallisto-transcriptome-indices/releases. The Bach218del (stock #35028) mouse strain is available at the Jackson Laboratory (Bar Harbor, ME).
Code availability
Code supporting this manuscript is available at https://doi.org/10.5281/zenodo.6302248 66 (MPRA analysis), https://doi.org/10.5281/zenodo.629990567 (base editing analysis), and https://doi.org/10.5281/zenodo.603872568 (single-cell RNA-seq analysis). Data visualization, exploratory data analysis, and processing were performed using R v3.6.2.
Extended Data
Extended Data Fig. 1.
T-GWAS MPRA workflow and quality metrics T-GWAS MPRA workflow and quality metrics a) Extended MPRA workflow. i) Oligonucleotide synthesis of elements containing variants and 200 bp surrounding genomic region; ii) barcode elements through PCR; iii) sequence barcoded elements to link barcodes to elements; iv) insert minimal promoter and GFP between element and barcode; v) transfect library into Jurkat T cells; vi) harvest RNA and pull down GFP mRNA; vii) create cDNA and plasmid sequencing libraries and sequence, comparing the prevalence of barcodes in cDNA to their prevalence in plasmid libraries; viii) compare alleles for differential reporter expression. b) Correlation of barcode prevalence in separate replicates of plasmid libraries (left), biological replicates of cDNA libraries (middle), and between a cDNA library and a plasmid library (right). c) Plot of MPRA expression fold change (log2 RNA/plasmid; y-axis) against normalized plasmid tag counts for elements with putative cis-regulatory activity (active; blue) and inactive elements (black) within the T-GWAS library. d) Plot of MPRA expression fold change (log2 RNA/plasmid; y-axis) against normalized plasmid tag counts for positive controls and negative controls compared to T-GWAS elements.
Extended Data Fig. 2.
Variant locations relative to cis-regulatory features. a) Location relative to TSSs of all MPRA tested variants, active elements (pCRE), and emVars. b) Enrichment of variants within pCREs (light blue) and emVars (dark blue) within chromHMM-defined genomic regions in human T cells. * for P < 0.05; *** P < 1.4 × 10⁻³ (Bonferroni-corrected for 36 independent tests). c) Functional enrichment of variants within pCREs and emVars. *** for P < 6.3 × 10⁻³ (nominal p-value threshold of 0.05 Bonferroni-corrected for 8 independent tests). d) Proportion of inactive element and pCRE variants and emVars that have allelic bias in ATAC-seq. e) Scatter plot comparing MPRA log2 allelic bias (y-axis) with allelic bias in ATAC-seq from hematopoietic cells (x-axis)5. Red dots are emVars (n=5) and gray dots are pCRE variants (n=45). f) Proportion of MPRA inactive and pCRE variants, and emVars that are chromatin accessibility QTLs (caQTLs) from T cells65. g) Scatter plot comparing caQTL effect size (beta; x-axis) and MPRA log2 allelic bias (y-axis). Red dots are emVars (n=6) and gray dots are pCREs (n=22). h) Scatter plot comparing delta SVM score (x-axis) with MPRA log2 allelic bias (y-axis) (n=278). i) Proportion of MPRA inactive and pCRE variants and emVars that overlap TF motifs. j) Scatter plot comparing allele-specific TF binding scores (y-axis) and MPRA allelic bias (x-axis) for emVars predicted to perturb TF binding (n=11). Enrichment of emVars for TF ChIP-seq (-log10P on y-axis). Calculations for (b and c) are risk ratios (see Methods) with Fisher’s exact test P values and Bonferroni correction (see Supplementary Tables 5 and 6 for exact P values). (d, f, and i) P values calculated using two-sided two proportions z test with no multiple comparisons adjustment. (e, g, h and j) P values are from linear regression F statistic. (k) P values are from a two-sided binomial test.
Extended Data Fig. 3.
MPRA prioritizes variants in hundreds of loci. a) Total number of GWAS loci tested (green) and number of loci with at least one emVar identified (orange) for each disease GWAS. b) Histogram of the number of emVars within each GWAS locus. c) Bar plot showing enrichment (from all loci tested) of DHS alone (left), emVars (middle), and emVars in T cell DHS (right) for PICS fine-mapped variants, with the minimum posterior probability threshold indicated on the x-axis and fold enrichment shown on the y-axis and bars with darker shades of blue as probability increases. Details of PICS enrichment results are shown in Supplementary Table 10. d) Bar plot showing enrichment of emVars for fine-mapped T1D GWAS loci from Onengut-Gumuscu et al. Statistical fine-mapping posterior probability threshold is shown on the x-axis and fold enrichment shown on the y-axis and with darker shades of blue as probability increases. For both c) and d), gray numbers below each bar show the number of emVars that are statistically fine-mapped at a given PICS probability threshold. Purple numbers above each bar show the -log10 of the enrichment P value. Enrichment in (c) and (d) were calculated as a risk ratio (see Methods), and P values were determined through a two-sided Fisher’s exact test.
Extended Data Fig. 4.
Putative causal variants in the promoters of IRF5 and RASGRP. a and b) Dotplots showing DHS signal (DHS score) and statistical significance of allelic bias (log10FDR of MPRA allelic bias) for MPRA variants in the region; all tested variants on haplotype (black), significant emVars in DHS (red) (top). Position of variants that are emVars, pCREs, variants tested in MPRA, and disease associated variants for CD, MS, psoriasis, RA, T1D, and UC from the GWAS Catalog54 (middle). Genes in the locus are shown along with chromatin accessibility profiles (from in Jurkat and specific T cell subsets) and T cell pcHiC loops anchored on the region containing the emVar. Gray line depicts position of the prioritized emVar position with respect to all data types. Statistical significance of allelic biases in (a) and (b) were calculated using a paired Student’s two-sided t-test as described in Methods.
Extended Data Fig. 5.
rs72928038 reduces luciferase reporter expression and contacts the BACH2 promoter. a) Luciferase reporter activity of rs72928038 alleles (n=3, two independent experiments). b) Promoter capture HiC (pcHiC18) conducted in naïve T cells anchored on the region containing the rs72928038. For (a), statistical significance was calculated using a Student’s two-sided t-test, central tendency is shown as median, and all points are plotted to show dispersion with error bars representing standard deviation. (c) i) Schematic of installing rs72928038 using the evoCDAmax cytosine base editor, achieving 95% base editing. We also created a second condition, separately combining the 95% base edited cells with WT base-edited cells (combined 50/50) post-nucleofection. (ii) We performed PrimeFlow, staining BACH2 mRNA, and sorted cells based on high and low BACH2 expression. iii) We sequenced the amplicon containing rs72928038 in all sorted populations. iv) Mock data of expected ratios of risk vs. non-risk alleles in high and low bins of BACH2 expression. If rs72928038 reduces BACH2 expression, one would anticipate the edited risk allele to enrich in low BACH2 expression bins.
Extended Data Fig. 6.
Orthologous rs72928038 region binds STATs and ETS1 and deletion of the region in CD8 T cells partially recapitulates transcriptional phenotypes of Bach2-deficient Tscms. a) STAT and ETS1 TF ChIP-seq peaks30 overlapping mouse rs72928038 ortholog. b) PCA on RNA-seq of naïve CD4 T cells from WT and Bach218del mice. c) Bach2 expression in WT and Bach218del naïve CD4 T cells from RNA-seq normalized counts. d) GSEA enrichment of Bach218del vs. WT naïve CD8 (left) and CD4 (right) T cells. Depicted GSEA results for a gene set derived from genes upregulated in empty vector vs. Bach2 sgRNA-transduced Tscms (d left and right) and genes upregulated in Bach2 sgRNA-transduced Tscms vs. empty vector (d middle). Full GSEA results are shown in Supplementary Table 16. e) Expression of genes in Tscms that have been transduced with empty vector or a Bach2 sgRNA (same experiment as in d) for differentially expressed genes in Bach218del vs. WT naïve CD8 T cells. Genes upregulated in Bach218del T cells as compared to WT are on the left and downregulated are on the right. Normalized enrichment score (NES) in (d) was calculated based on observed enrichment as compared to enrichments from permuted data as previously described and statistical significance shown as the false discovery rate (q). P value in (b) was determined by a two-sided Wald test from normalized counts and adjusted P value was determined using Benjamini Hochberg adjustment. For (b-e), n = 3 independent animals.
Extended Data Fig. 7.
Bach218del CD8 T cells have reduced memory-precursor and enhancer effector phenotypes. (a-e) Flow cytometry histograms depicting WT (orange) and Bach218del (turquoise) expression of CD62L (a), Eomes (b), CD127 (c), KLRG1 (d), and CX3CR1 (e). For (a-e), n = 10 independent animals per experiment analyzed over 2 experiments, and statistical significance was calculated using a Student’s paired two-sided t-test with no adjustments for multiple testing.
Extended Data Fig. 8.
Single cell RNA-seq of WT and Bach218del CD8 T cells at 8 dpi with VSV-OVA. a) UMAP plots depicting the composition of cells from different pools (left) and between mice (right). b) Heatmap depicting the top genes representing each cluster in Fig. 6f. c) UMAP plot indicating regions from Fig. 6h with significant enrichment of WT or Bach218del cells. d) Line plots depicting the relative frequencies of WT and Bach218del cells, for each of 5 replicates/group, within each cluster depicted in Fig. 6f. Statistical significance for (c) was assessed using a two-sided permutation test with N = 5,000 permutations, identifying cellular enrichment outside of the 99% confidence interval (see methods). (d) was calculated using a Student’s paired two-sided t-test with no adjustments for multiple testing.
Extended Data Fig. 9.
Flow cytometry gating strategy for Bach218del and WT OTI cotransfer VSV-OVA experiment. Cells are gated on the lymphocyte population and single cells, followed by gating out dead cells, gating on activated CD8 T cells, and identifying cells from each genotype using CD45.1.2 (WT) and CD45.2 (Bach218del). Cells were further assessed for their prevalence in effector (KLRG1+) or memory precursor (CD127+) populations.
Supplementary Material
ACKNOWLEDGMENTS
We gratefully acknowledge the contribution of Richard Maser and Genetic Engineering Technologies Service, Jeniffer Kelmenson and Transgenic Genotyping Service, William Schott and Flow Cytometry Service, and Ryan Lynch and Genome Technologies Service at The Jackson Laboratory, Anton McCaffrey and Jordana Henderson at Trilink Biotechnologies, the Broad Institute vivarium, Flow Cytometry Core, and Genomics Core, and the Benaroya Research Institute vivarium, Flow Cytometry Core, Genomics Core, and Bioinformatics Core for expert assistance with the work described in this manuscript. We thank Dr. Peter Gregersen and Dr. Betty Diamond for providing genotyped human PBMCs, and Dr. Susan Malkiel for help with processing human PBMCs for ATAC-seq and for review of the manuscript. We thank Dr. Matthew Dufort and Dr. Stephan Pribitzer for contributions to single-cell RNA-seq analysis. We thank Ben Doughty for discussion on strategies for the base editing experiments. We thank Jacob C. Ulirsch and Dr. Virginia M. Green for their critical review of the manuscript. This work is funded by U.S. NIH R25NS065745 (M.H.G.), CIHR fellowship (C.G.D.), K99HG009920
(C.G.D.), T32AR007108 (M.M.L.), Helen Hay Whitney postdoctoral fellowship (G.A.N.), EMBO Long-Term Fellowship ALTF486-2018 (M.G.), Cancer Research Institute/Bristol-Myers Squibb Fellow CRI2993 (M.G.), U01AI142756 (D.R.L.), RM1HG009490 (D.R.L.), R01AI124693 (D.J.C), NHGRI R01HG008131 (N.H.), P50HG006193 (N.H.), R00HG008179 (R.T.), R35HG011329 (R.T.), R01AI151051 (R.T.), F32AI129249 (J.P.R.), and K22AI153648 (J.P.R.).
Footnotes
COMPETING INTERESTS
G.A.N. and D.R.L have filed patent applications on genome editing agents. D.R.L. is a consultant and equity owner of Beam Therapeutics, Prime Medicine, and Pairwise Plants, companies that use genome editing. N.H. holds equity in BioNTech and consults for Related Sciences. Other authors have no conflicts of interest.
REFERENCES
- 1.Farh KK-H et al. Genetic and epigenetic fine mapping of causal autoimmune disease variants. Nature 518, 337–343 (2015). [DOI] [PMC free article] [PubMed] [Google Scholar]
- 2.Maurano MT et al. Systematic localization of common disease-associated variation in regulatory DNA. Science 337, 1190–1195 (2012). [DOI] [PMC free article] [PubMed] [Google Scholar]
- 3.Roychoudhuri R. et al. BACH2 regulates CD8(+) T cell differentiation by controlling access of AP-1 factors to enhancers. Nat. Immunol 17, 851–860 (2016). [DOI] [PMC free article] [PubMed] [Google Scholar]
- 4.Corces MR et al. Lineage-specific and single-cell chromatin accessibility charts human hematopoiesis and leukemia evolution. Nat. Genet 48, 1193–1203 (2016). [DOI] [PMC free article] [PubMed] [Google Scholar]
- 5.Calderon D. et al. Landscape of stimulation-responsive chromatin across diverse human immune cells. Nat. Genet 51, 1494–1505 (2019). [DOI] [PMC free article] [PubMed] [Google Scholar]
- 6.Ray JP et al. Prioritizing disease and trait causal variants at the TNFAIP3 locus using functional and genomic features. Nat. Commun 11, 1237 (2020). [DOI] [PMC free article] [PubMed] [Google Scholar]
- 7.Finucane HK et al. Partitioning heritability by functional annotation using genome-wide association summary statistics. Nat. Genet 47, 1228–1235 (2015). [DOI] [PMC free article] [PubMed] [Google Scholar]
- 8.Tewhey R. et al. Direct Identification of Hundreds of Expression-Modulating Variants using a Multiplexed Reporter Assay. Cell 165, 1519–1529 (2016). [DOI] [PMC free article] [PubMed] [Google Scholar]
- 9.Ulirsch JC et al. Systematic Functional Dissection of Common Genetic Variation Affecting Red Blood Cell Traits. Cell 165, 1530–1545 (2016). [DOI] [PMC free article] [PubMed] [Google Scholar]
- 10.Klein JC et al. A systematic evaluation of the design and context dependencies of massively parallel reporter assays. Nat. Methods 17, 1083–1091 (2020). [DOI] [PMC free article] [PubMed] [Google Scholar]
- 11.Inoue F. et al. A systematic comparison reveals substantial differences in chromosomal versus episomal encoding of enhancer activity. Genome Res. 27, 38–52 (2017). [DOI] [PMC free article] [PubMed] [Google Scholar]
- 12.Liu JZ et al. Association analyses identify 38 susceptibility loci for inflammatory bowel disease and highlight shared genetic risk across populations. Nat. Genet 47, 979–986 (2015). [DOI] [PMC free article] [PubMed] [Google Scholar]
- 13.Beecham AH et al. Analysis of immune-related loci identifies 48 new susceptibility variants for multiple sclerosis. Nat. Genet 45, 1353–1360 (2013). [DOI] [PMC free article] [PubMed] [Google Scholar]
- 14.International Multiple Sclerosis Genetics Consortium. Multiple sclerosis genomic map implicates peripheral immune cells and microglia in susceptibility. Science 365, eaav7188 (2019). [DOI] [PMC free article] [PubMed] [Google Scholar]
- 15.Onengut-Gumuscu S. et al. Fine mapping of type 1 diabetes susceptibility loci and evidence for colocalization of causal variants with lymphoid gene enhancers. Nat. Genet 47, 381–386 (2015). [DOI] [PMC free article] [PubMed] [Google Scholar]
- 16.Tsoi LC et al. Identification of 15 new psoriasis susceptibility loci highlights the role of innate immunity. Nat. Genet 44, 1341–1348 (2012). [DOI] [PMC free article] [PubMed] [Google Scholar]
- 17.Okada Y. et al. Genetics of rheumatoid arthritis contributes to biology and drug discovery. Nature 506, 376–381 (2014). [DOI] [PMC free article] [PubMed] [Google Scholar]
- 18.Javierre BM et al. Lineage-Specific Genome Architecture Links Enhancers and Non-coding Disease Variants to Target Gene Promoters. Cell 167, 1369–1384.e19 (2016). [DOI] [PMC free article] [PubMed] [Google Scholar]
- 19.Chen J. et al. TAGAP instructs Th17 differentiation by bridging Dectin activation to EPHB2 signaling in innate antifungal response. Nat. Commun 11, 1913 (2020). [DOI] [PMC free article] [PubMed] [Google Scholar]
- 20.Tamehiro N. et al. T-cell activation RhoGTPase-activating protein plays an important role in Th17-cell differentiation. Immunol. Cell Biol 95, 729–735 (2017). [DOI] [PubMed] [Google Scholar]
- 21.Duke-Cohan JS et al. Regulation of thymocyte trafficking by Tagap, a GAP domain protein linked to human autoimmunity. Sci. Signal 11, eaan8799 (2018). [DOI] [PMC free article] [PubMed] [Google Scholar]
- 22.Yan J. et al. T Cell-Intrinsic IRF5 Regulates T Cell Signaling, Migration, and Differentiation and Promotes Intestinal Inflammation. Cell Rep. 31, 107820 (2020). [DOI] [PMC free article] [PubMed] [Google Scholar]
- 23.Daley SR et al. Rasgrp1 mutation increases naive T-cell CD44 expression and drives mTOR-dependent accumulation of Helios+ T cells and autoantibodies. Elife 2, e01020 (2013). [DOI] [PMC free article] [PubMed] [Google Scholar]
- 24.Priatel JJ et al. RasGRP1 transduces low-grade TCR signals which are critical for T cell development, homeostasis, and differentiation. Immunity 17, 617–627 (2002). [DOI] [PubMed] [Google Scholar]
- 25.Roychoudhuri R. et al. BACH2 represses effector programs to stabilize Treg-mediated immune homeostasis. Nature 498, 506–510 (2013). [DOI] [PMC free article] [PubMed] [Google Scholar]
- 26.Yao C. et al. BACH2 enforces the transcriptional and epigenetic programs of stem-like CD8+ T cells. Nat. Immunol 22, 370–380 (2021). [DOI] [PMC free article] [PubMed] [Google Scholar]
- 27.Schmiedel BJ et al. Impact of Genetic Polymorphisms on Human Immune Cell Gene Expression. Cell 175, 1701–1715.e16 (2018). [DOI] [PMC free article] [PubMed] [Google Scholar]
- 28.Thuronyi BW et al. Continuous evolution of base editors with expanded target compatibility and improved activity. Nat. Biotechnol 37, 1070–1079 (2019). [DOI] [PMC free article] [PubMed] [Google Scholar]
- 29.Fulco CP et al. Activity-by-contact model of enhancer–promoter regulation from thousands of CRISPR perturbations. Nat. Genet 51, 1664–1669 (2019). [DOI] [PMC free article] [PubMed] [Google Scholar]
- 30.Oki S. et al. ChIP-Atlas: a data-mining suite powered by full integration of public ChIP-seq data. EMBO Rep. 19, e46255 (2018). [DOI] [PMC free article] [PubMed] [Google Scholar]
- 31.Alpern D. et al. BRB-seq: ultra-affordable high-throughput transcriptomics enabled by bulk RNA barcoding and sequencing. Genome Biol. 20, 71 (2019). [DOI] [PMC free article] [PubMed] [Google Scholar]
- 32.Kakaradov B. et al. Early transcriptional and epigenetic regulation of CD8 T cell differentiation revealed by single-cell RNA sequencing. Nat. Immunol 18, 422–432 (2017). [DOI] [PMC free article] [PubMed] [Google Scholar]
- 33.Gautam S. et al. The transcription factor c-Myb regulates CD8+ T cell stemness and antitumor immunity. Nat. Immunol 20, 337–349 (2019). [DOI] [PMC free article] [PubMed] [Google Scholar]
- 34.Willinger T. et al. Human naive CD8 T cells down-regulate expression of the WNT pathway transcription factors lymphoid enhancer binding factor 1 and transcription factor 7 (T cell factor-1) following antigen encounter in vitro and in vivo. J. Immunol 176, 1439–1446 (2006). [DOI] [PubMed] [Google Scholar]
- 35.Yamada T, Park CS, Mamonkin M. & Lacorazza HD Transcription factor ELF4 controls the proliferation and homing of CD8+ T cells via the Krüppel-like factors KLF4 and KLF2. Nat. Immunol 10, 618–626 (2009). [DOI] [PMC free article] [PubMed] [Google Scholar]
- 36.Araki K. et al. Translation is actively regulated during the differentiation of CD8+ effector T cells. Nat. Immunol 18, 1046–1057 (2017). [DOI] [PMC free article] [PubMed] [Google Scholar]
- 37.Buckler JL, Liu X. & Turka LA Regulation of T-cell responses by PTEN. Immunol. Rev 224, 239–248 (2008). [DOI] [PMC free article] [PubMed] [Google Scholar]
- 38.Liu Y-C The E3 ubiquitin ligase Itch in T cell activation, differentiation, and tolerance. Semin. Immunol 19, 197–205 (2007). [DOI] [PMC free article] [PubMed] [Google Scholar]
- 39.Kaech SM & Cui W. Transcriptional control of effector and memory CD8+ T cell differentiation. Nat. Rev. Immunol 12, 749–761 (2012). [DOI] [PMC free article] [PubMed] [Google Scholar]
- 40.Herndler-Brandstetter D. et al. KLRG1+ Effector CD8+ T Cells Lose KLRG1, Differentiate into All Memory T Cell Lineages, and Convey Enhanced Protective Immunity. Immunity 48, 716–729.e8 (2018). [DOI] [PMC free article] [PubMed] [Google Scholar]
- 41.Joshi NS et al. Inflammation Directs Memory Precursor and Short-Lived Effector CD8+ T Cell Fates via the Graded Expression of T-bet Transcription Factor. Immunity 27, 281–295 (2007). [DOI] [PMC free article] [PubMed] [Google Scholar]
- 42.Reilly SK et al. Direct characterization of cis-regulatory elements and functional dissection of complex genetic associations using HCR-FlowFISH. Nat. Genet 53, 1166–1176 (2021). [DOI] [PMC free article] [PubMed] [Google Scholar]
- 43.Yan J. et al. Systematic analysis of binding of transcription factors to noncoding variants. Nature 591, 147–151 (2021). [DOI] [PMC free article] [PubMed] [Google Scholar]
- 44.Lee MN et al. Common Genetic Variants Modulate Pathogen-Sensing Responses in Human Dendritic Cells. Science 343, 1246980–1246980 (2014). [DOI] [PMC free article] [PubMed] [Google Scholar]
- 45.Ye CJ et al. Intersection of population variation and autoimmunity genetics in human T cell activation. Science 345, 1254665 (2014). [DOI] [PMC free article] [PubMed] [Google Scholar]
- 46.Fairfax BP et al. Innate immune activity conditions the effect of regulatory variants upon monocyte gene expression. Science 343, 1246949 (2014). [DOI] [PMC free article] [PubMed] [Google Scholar]
- 47.Ramos-Rodríguez M. et al. The impact of proinflammatory cytokines on the β-cell regulatory landscape provides insights into the genetics of type 1 diabetes. Nat. Genet 51,1588–1595 (2019). [DOI] [PMC free article] [PubMed] [Google Scholar]
- 48.Negron A, Robinson RR, Stüve O. & Forsthuber TG The role of B cells in multiple sclerosis: Current and future therapies. Cell. Immunol 339, 10–23 (2019). [DOI] [PMC free article] [PubMed] [Google Scholar]
- 49.Sahlén P. et al. Chromatin interactions in differentiating keratinocytes reveal novel atopic dermatitis– and psoriasis-associated genes. J. Allergy Clin. Immunol 147, 1742–1752 (2021). [DOI] [PubMed] [Google Scholar]
- 50.Boyd M. et al. Characterization of the enhancer and promoter landscape of inflammatory bowel disease from human colon biopsies. Nat. Commun 9, 1661 (2018). [DOI] [PMC free article] [PubMed] [Google Scholar]
- 51.Soemedi R. et al. Pathogenic variants that alter protein code often disrupt splicing. Nat. Genet 49, 848–855 (2017). [DOI] [PMC free article] [PubMed] [Google Scholar]
- 52.Griesemer D. et al. Genome-wide functional screen of 3’UTR variants uncovers causal variants for human disease and evolution. Cell. 184, 5247–5260.e19 (2021). [DOI] [PMC free article] [PubMed] [Google Scholar]
- 53.Ghoussaini M. et al. Open Targets Genetics: systematic identification of trait-associated genes using large-scale genetics and functional genomics. Nucleic Acids Res. 49, D1311–D1320 (2021). [DOI] [PMC free article] [PubMed] [Google Scholar]
- 54.Buniello A. et al. The NHGRI-EBI GWAS Catalog of published genome-wide association studies, targeted arrays and summary statistics 2019. Nucleic Acids Res. 47, D1005–D1012 (2019). [DOI] [PMC free article] [PubMed] [Google Scholar]
- 55.Hollenhorst PC et al. DNA specificity determinants associate with distinct transcription factor functions. PLoS Genet. 5, e1000778 (2009). [DOI] [PMC free article] [PubMed] [Google Scholar]
Methods-only references
- 56.Qin W. et al. Efficient CRISPR/Cas9-Mediated Genome Editing in Mice by Zygote Electroporation of Nuclease. Genetics 200, 423–430 (2015). [DOI] [PMC free article] [PubMed] [Google Scholar]
- 57.Chang CC et al. Second-generation PLINK: rising to the challenge of larger and richer datasets. Gigascience 4, 7 (2015). [DOI] [PMC free article] [PubMed] [Google Scholar]
- 58.Love MI, Huber W. & Anders S. Moderated estimation of fold change and dispersion for RNA-seq data with DESeq2. Genome Biol. 15, 550 (2014). [DOI] [PMC free article] [PubMed] [Google Scholar]
- 59.Kent WJ, Zweig AS, Barber G, Hinrichs AS & Karolchik D. BigWig and BigBed: enabling browsing of large distributed datasets. Bioinformatics 26, 2204–2207 (2010). [DOI] [PMC free article] [PubMed] [Google Scholar]
- 60.Ramírez F. et al. deepTools2: a next generation web server for deep-sequencing data analysis. Nucleic Acids Res. 44, W160–5 (2016). [DOI] [PMC free article] [PubMed] [Google Scholar]
- 61.Vaidyanathan S. et al. Uridine Depletion and Chemical Modification Increase Cas9 mRNA Activity and Reduce Immunogenicity without HPLC Purification. Mol. Ther. Nucleic Acids 12, 530–542 (2018). [DOI] [PMC free article] [PubMed] [Google Scholar]
- 62.Pinello L. et al. Analyzing CRISPR genome-editing experiments with CRISPResso. Nat. Biotechnol 34, 695–697 (2016). [DOI] [PMC free article] [PubMed] [Google Scholar]
- 63.de Boer CG, Ray JP, Hacohen N. & Regev A. MAUDE: inferring expression changes in sorting-based CRISPR screens. Genome Biol. 21, 134 (2020). [DOI] [PMC free article] [PubMed] [Google Scholar]
- 64.Dobin A. et al. STAR: ultrafast universal RNA-seq aligner. Bioinformatics 29, 15–21 (2013). [DOI] [PMC free article] [PubMed] [Google Scholar]
- 65.Gate RE et al. Genetic determinants of co-accessible chromatin regions in activated T cells across humans. Nat. Genet 50, 1140–1150 (2018). [DOI] [PMC free article] [PubMed] [Google Scholar]
- 66.Guo MH mhguo1/T_cell_MPRA: Release v1.0.0. (2022). doi: 10.5281/zenodo.6302248. [DOI] [Google Scholar]
- 67.de Boer CG de-Boer-Lab/MAUDE: Release including BACH2 reanalysis code and data. (2022). doi: 10.5281/zenodo.6299905. [DOI] [Google Scholar]
- 68.Pribitzer S. & Deberg HA Single-cell RNA-seq of Bach2 18del CD8 T cells. (2022). doi: 10.5281/zenodo.6038725. [DOI] [Google Scholar]
Associated Data
This section collects any data citations, data availability statements, or supplementary materials included in this article.
Supplementary Materials
Data Availability Statement
Data generated in this study from all manuscript figures are available in NCBI GEO (GSE197539). 1000 Genomes Phase 3 reference panel was obtained from ftp://ftp.1000genomes.ebi.ac.uk/vol1/ftp/release/20130502/. DHS data across 733 samples were obtained from https://zenodo.org/record/3838751#.X_IA7-lKg6U. Histone ChIP-seq data were downloaded from ENCODE (encodeproject.org); the specific files utilized are listed in Supplementary Table 20. CAGE-based enhancer annotations were downloaded from https://fantom.gsc.riken.jp/5/datafiles/latest/extra/Enhancers/. chromHMM were obtained from https://egg2.wustl.edu/roadmap/data/byFileType/chromhmmSegmentations/ChmmModels/core_K27ac/jointModel/final/. HOCOMOCO transcription factor position-weighted matrices were obtained from https://hocomoco11.autosome.ru/downloads_v10. ATAC-seq allelic skew data was obtained from Calderon, et al.5 (https://www.nature.com/articles/s41588–019-0505–9; Supplementary Table 1, “significant_ASCs” tab). Chromatin accessibility QTLs were downloaded from Gate et al.65 (https://www.nature.com/articles/s41588–018-0156–2; Supplementary Table 6). DeltaSVM precomputed weights for Naive CD4 T cells and Jurkat cells were obtained from http://www.beerlab.org/deltasvm_models/downloads/deltasvm_models_e2e.tar.gz. The EMBL GWAS catalog54 (https://www.ebi.ac.uk/gwas/) was accessed on August 10, 2020. T1D GWAS fine-mapping results were obtained from Onengut-Gumuscu et al.15 (https://www.nature.com/articles/ng.3245; Supplementary Table 1). Promoter capture HiC data was obtained from Javierre, et al.18 (https://osf.io/u8tzp/). The ImmunoSigDB immunologic signatures database (v7.2) was downloaded from http://www.gsea-msigdb.org/gsea/msigdb/. Tscm Bach2-gRNA perturbed mouse RNA-seq data was obtained from NCBI GEO (GSE152379). The GRCm38 mouse transcriptome index for Kallisto RNA-seq alignments were obtained from https://github.com/pachterlab/kallisto-transcriptome-indices/releases. The Bach218del (stock #35028) mouse strain is available at the Jackson Laboratory (Bar Harbor, ME).


