Abstract
Purpose
To develop and validate a 3D-convolutional neural network (3D-CNN) model based on chest CT for differentiating active pulmonary tuberculosis (APTB) from community-acquired pneumonia (CAP).
Materials and methods
Chest CT images of APTB and CAP patients diagnosed in two imaging centers (n = 432 in center A and n = 61 in center B) were collected retrospectively. The data in center A were divided into training, validation and internal test sets, and the data in center B were used as an external test set. A 3D-CNN was built using Keras deep learning framework. After the training, the 3D-CNN selected the model with the highest accuracy in the validation set as the optimal model, which was applied to the two test sets in centers A and B. In addition, the two test sets were independently diagnosed by two radiologists. The 3D-CNN optimal model was compared with the discrimination, calibration and net benefit of the two radiologists in differentiating APTB from CAP using chest CT images.
Results
The accuracy of the 3D-CNN optimal model was 0.989 and 0.934 with the internal and external test set, respectively. The area-under-the-curve values with the 3D-CNN model in the two test sets were statistically higher than that of the two radiologists (all P < 0.05), and there was a high calibration degree. The decision curve analysis showed that the 3D-CNN optimal model had significantly higher net benefit for patients than the two radiologists.
Conclusions
3D-CNN has high classification performance in differentiating APTB from CAP using chest CT images. The application of 3D-CNN provides a new automatic and rapid diagnosis method for identifying patients with APTB from CAP using chest CT images.
Keywords: Tuberculosis, Pulmonary, Pneumonia, Tomography, Spiral computed, Neural network, Computer
Introduction
The diagnosis and treatment of active pulmonary tuberculosis (APTB) is an important means to control the source of infection and cut off the route of infection. However, more than 50% of patients have no symptoms at the time of diagnosis [1], and even if some clinical symptoms appear, these symptoms still overlap with other diseases [2, 3]. For example, some of the APTB patients have their first health consultation because of the symptoms of community-acquired pneumonia (CAP), so the sensitivity of diagnosing APTB through symptoms is low [4]. Positive mycobacterium tuberculosis is the gold standard for APTB diagnosis, but the proportion of patients with bacteriological evidence varies greatly in various countries, about 81% in high-income countries and only 55% in low-income countries [5]. The method and quality of specimen collection in different regions of the same country also contribute to the difference of Mycobacterium tuberculosis test results, which leads to a considerable proportion of APTB patients without bacteriological evidence.
Chest CT with higher density resolution and spatial resolution is often used for the confirmation and further differential diagnosis or dynamic evaluation [2]. However, both APTB and CAP will show signs of consolidation, exudation, tree-in-bud, nodular shadow or ground glass opacity [6, 7]. The two diseases often need to be differentiated [3, 8–10], especially in those who suffer from immune damage, diabetes or non-standard antituberculosis treatment [11]. Rapid identification of these two diseases from images is conducive to the subsequent treatment and management of patients. However, radiologists with different diagnostic experience have different performances in differentiating these two diseases, and some countries with high TB burden still lack high-level radiologists to interpret and diagnose the images [12].
In recent years, convolutional neural network (CNN) in deep learning technology has played an important role in image diagnosis because it is good at image analysis, Unlike the previous radiomic research, which requires extracting massive quantitative features from lesions, CNN can directly extract more abstract features from images and use multiple deep structures and complex algorithms to analyze images with high performance [13]. In many previous studies, CNN has achieved exciting performance in the classification task of distinguishing APTB from normal X-ray chest radiographs [14–16], and a few studies have further included the X-ray chest radiographs of CAP patients as a control [17]. However, there are few studies on differential diagnosis of lung diseases using three-dimensional CT images. Therefore, our study intended to use CAP as a control group, to train a 3D-CNN model based on chest CT images for differentiating APTB from CAP and validate its performance for the automatic rapid diagnosis of these two pulmonary infectious diseases using internal and external test sets.
Methods
Patients
This was a multicenter, retrospective study approved by the institutional review board and patient informed consent was waived. The chest CT images of APTB and CAP patients diagnosed in imaging center A (Affiliated Hospital of Shaanxi University of Chinese Medicine) from July 2019 to November 2021 were retrospectively collected and divided into training set, validation set and test set for the training, optimal parameter selection and testing of 3D-CNN model, respectively. In addition, the chest CT images of the same type of patients in another imaging center B (Baoji Central Hospital) from January 2020 to December 2021 were collected for the external test of the selected 3D-CNN model. These two image centers are both comprehensive Grade IIIA hospitals in different regions and provide relatively high-level medical and health services in corresponding regions. Patients in the two imaging centers all met the following inclusion and exclusion criteria. Inclusion criteria: (a). APTB patients with etiological or pathological evidence (The diagnosis of APTB was based on the "Expert consensus on a standard of activity judgment of pulmonary tuberculosis and its clinical implementation" issued by the National Clinical Research Center for Infectious Diseases [18].); (b). CAP patients with etiological evidence; (c). CAP patients without etiological evidence were diagnosed according to the "guidelines for the diagnosis and treatment of community-acquired pneumonia" issued by the Respiratory Society of Chinese Medical Association [19], and antibiotic treatment was confirmed to be effective in follow-up review. (d). Chest CT image data were complete. Exclusion criteria: (a). Respiratory motion artifacts existed in CT images; (b). X-ray beam hardening artifacts caused by internal metal fixators or body surface devices were seen in lungs on CT images (such as thoracic internal fixation or ECG electrode); (c). Severe pulmonary interstitial fibrosis; (d). Atelectasis; (e). Pulmonary edema; (f). Lung neoplasms.
Data set division
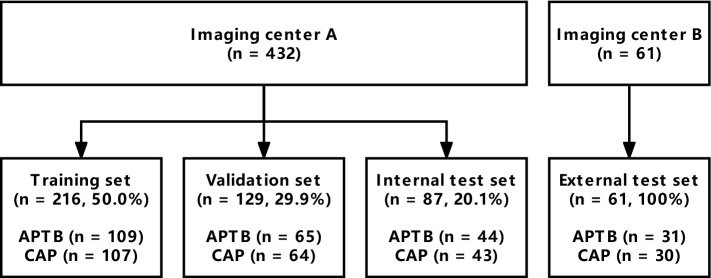
Four hundred and thirty-two patients were finally included from imaging center A, including 218 in APTB group and 214 in CAP group. There were 196 females and 236 males. The median age was 39 years, and the age range was 1–84 years. Sixty-one patients were finally included from imaging center B, including 31 in APTB group and 30 in CAP group. There were 23 females and 38 males with median age of 45 years, and the age range of 11–81 years for patients in center B. There were no HIV infected patients in both imaging centers. All images from imaging center A were randomly divided into training set, validation set or test set according to the ratio of 5:3:2. The training set was used for model training, the validation set was used for optimizing hyper-parameters, and the test set in imaging center A was used for the internal independent test of the model, while all images in imaging center B were used for the external independent test of the model, as shown in Fig. 1. The basic characteristics and diagnostic basis of patients in the two imaging centers are shown in Table 1.
Fig. 1.
Data set division
Table 1.
The basic characteristics and diagnostic basis of patients in the two imaging centers
| Parameters | Institutions A (n = 432) | Institutions B (n = 61) | ||
|---|---|---|---|---|
| APTB (n = 218) | CAP (n = 214) | APTB (n = 31) | CAP (n = 30) | |
| Gender (female) | 102 (46.8) | 94 (43.9) | 9 (29.0) | 14 (46.7) |
| Age (years) | 41.5 (25, 58) | 34.5 (16, 56) | 37 (21, 55) | 51 (20.5, 65) |
| Fever/chills | 53 (24.3) | 61 (28.5) | 7 (22.6) | 6 (20.0) |
| Cough/expectoration | 103 (47.2) | 114 (53.3) | 11 (35.5) | 7 (23.3) |
| Muscle ache/chest pain | 22 (10.1) | 17 (7.9) | 3 (9.7) | 4 (13.3) |
| Pharyngalgia | 15 (6.9) | 34 (15.9) | 1 (3.2) | 5 (16.7) |
| Hemoptysis | 36 (16.5) | 3 (1.4) | 5 (16.1) | 0 (0) |
| Night sweats | 27 (12.4) | 16 (7.5) | 5 (16.1) | 3 (10.0) |
| Asymptomatic | 76 (34.9) | 59 (27.6) | 12 (38.7) | 7 (23.3) |
| Diagnostic basis | Sputum specimen (n = 103); Transthoracic needle biopsy specimen (n = 44); Bronchial flushing or alveolar lavage fluid specimens (n = 37); Transbronchial lung biopsy specimens (n = 21); Surgical specimen (n = 13) | Streptococcus pneumoniae (n = 29); Mycoplasma pneumoniae (n = 27); Chlamydia pneumonia (n = 9); Staphylococcus aureus (n = 9); Klebsiella pneumoniae (n = 7); Hemophiles influenzae (n = 6); Influenza virus (n = 13); Respiratory syncytial virus (n = 11); Parainfluenza virus (n = 9); Unknown (n = 94) | Sputum specimen (n = 10); Bronchial flushing or alveolar lavage fluid specimens (n = 9); Transthoracic needle biopsy specimen (n = 7); Transbronchial lung biopsy specimens (n = 4); Surgical specimen (n = 1) | Streptococcus pneumoniae (n = 8); Chlamydia pneumonia (n = 5); Chlamydia pneumonia (n = 1); Influenza virus (n = 9); respiratory syncytial virus (n = 2); unknown (n = 6) |
Age was expressed as median and inter-quartile range
APTB Active pulmonary tuberculosis, CAP Community-acquired pneumonia
Chest CT data acquisition and evaluation by the radiologists
The chest CT scan of each patient ranged from the thoracic inlet to the costophrenic angle. Scans were performed with breath holding after deep inhalation. The CT scanning parameters of the two image centers are shown in Table 3. Finally, 1.25-mm-thick images were obtained. To compare the diagnostic performance of the 3D-CNN model with that of radiologists, the images in the test data sets were independently diagnosed by two off-site chest radiologists (with 5 and 8 years of experience dedicated to CT chest imaging). The CT images (in DICOM format) in the two test sets were saved in the same folder, renamed with unique random number. The two radiologists were informed that there were only two diseases of either APTB or CAP in the folder before reviewing images and were blinded to the real diagnosis but were allowed to obtain the main symptoms or signs of the patients.
Table 3.
CT scanning parameters of two image centers
| CT Scanning parameters | Institutions A | Institutions B |
|---|---|---|
| Equipment | GE Discovery 750HD | GE Revolution |
| Tube voltage (kVp) | 120 kV | 120 kV |
| Tube current (mA) | smart mA (NI = 12) | smart mA (NI = 14) |
| Pitch | 1.375:1 | 0.992:1 |
| Rotation rate (s/r) | 0.6 | 0.5 |
| Thickness (mm) | 1.25 | 1.25 |
| Matrix | 512 × 512 | 512 × 512 |
| Algorithm | 50% ASiR | 50% pre- & post- ASiR-V |
| Window width/level | 1200/-600 | 1200/-600 |
Image preprocessing and 3D-CNN training
The DICOM format chest CT lung window images of multi-slice files were transformed into a NIFTI image file by SimpleITK library (version: 2.1.1) [20]. According to our clinical knowledge, the CT value thresholds of each voxel in the CT image were set to [-1000HU, 100HU], with the CT value of voxels greater than 100HU being set to zero, and then the CT values of other voxels were standardized to the range of [0, 1]. Images were further adjusted to a uniform size (128 × 128 × 64 × 1: Width × Weight × Depth × Channel) as the input to 3D-CNN.
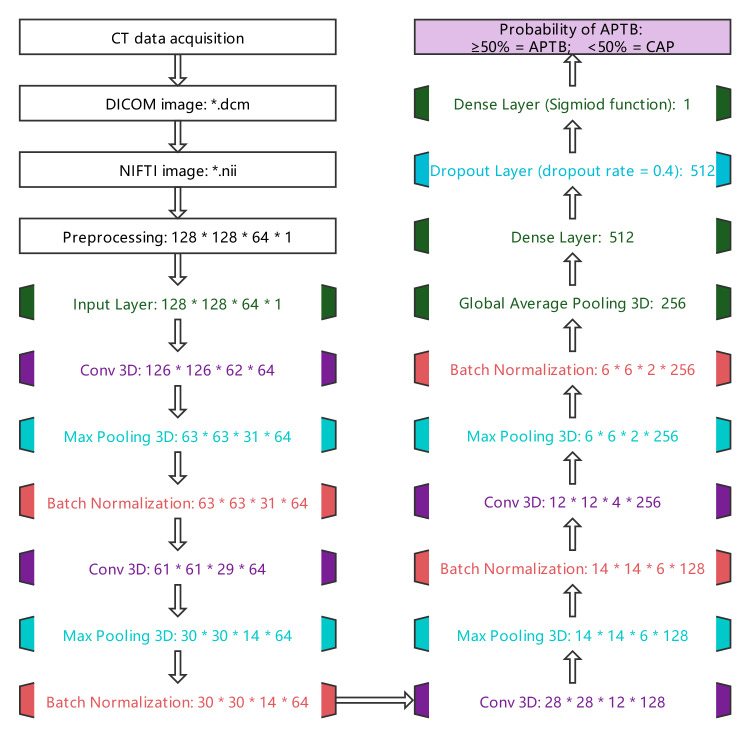
Before 3D-CNN training, data enhancement was used to prevent over-fitting. The data enhancement methods include randomly rotating the image horizontally [− 20°, 20°], randomly scaling [− 20%, 20%] and turning half of the image horizontally. The structure of 3D-CNN used for training was optimized and adjusted with reference to the research results of Zunair et al. [21], and its parameters were initialized in the form of GLOROT uniform distribution (Glorot uniform initializer). The last activation function used the sigmoid function to output the probability of APTB. If the probability was greater than or equal to 50%, it was considered that the predicted value is APTB, otherwise it is CAP, as shown in Fig. 2.
Fig. 2.
CT image processing flowchart. The flowchart shows the process of chest CT data acquisition, image format conversion, image preprocessing, and finally the probability of output APTB through 3D-CNN. The disease was considered APTB when the probability ≥ 50% and CAP when < 50%
The optimizer of 3D-CNN model training adopted an adaptive moment estimation algorithm, and its learning rate attenuation adopted an exponential decay strategy. The initial learning rate was 10–4, attenuated once every 106 steps, and the attenuation rate was 0.96. The binary_crossentropy was used for the lose function, and accuracy was used for the evaluation index. A maximum of 100 epochs was set up for the training. In addition, an early stop strategy was used in the training, that is, terminate the training if the accuracy of the validation set has not improved in 15 epochs.
The hardware platform in our research was Intel i7-11700/32G RAM, GPU NVIDIA-GeForce-RTX-3060 Ti (8 GB), and Windows 10 (64bit) operating system. The Keras (version: 2.7.0) deep learning framework was adopted.
Statistical analysis
The counting data were described using frequency and percentages, and the measurement data were expressed using median and inter-quartile range. The Kappa test was used to evaluate the agreement between the two radiologists. The Kappa values were defined as follows: > 0.75, excellent agreement; 0.60–0.74, good agreement; 0.40–0.59, fair agreement; and < 0.40, poor agreement. In the training process, the model with the highest accuracy in the validation set was selected as the optimal model, which was applied to the internal test set as well as the external test set. The receiver operating characteristic (ROC) curves of the 3D-CNN optimal model and the two radiologists were drawn separately. The accuracy, area-under-the-curve (AUC), sensitivity (recall), specificity, positive predictive value (PPV/precision), negative predictive value (NPV) and F1-score were calculated to evaluate the discrimination of diagnostic tests. The comparison of AUC was performed by the Delong test with test level α = 0.05. In addition, the corrected AUC of the 3D-CNN optimal model and the two radiologists were calculated by bootstrapping repeated sampling 1000 times, and the calibration curve was drawn to evaluate the calibration degree. The decision curve analysis was used to compare the net benefits of the 3D-CNN optimal model and the two radiologists.
To further test the generalization ability of 3D-CNN optimal model for images under different CT devices and different imaging protocols, we also collected two public COVID-19 chest CT data sets (anonymized) as CAP for testing. One data set was from the municipal hospitals in Moscow, Russia (n = 100; https://www.medrxiv.org/content/10.1101/2020.05.20.20100362v1), and the other was from GitHub (n = 20; https://github.com/ieee8023/covid-chestxray-dataset). The demographic characteristics, CT equipment information and image reconstruction protocols of these 120 cases are unknown.
Results
3D-CNN training process
The training process of 3D-CNN is shown in Fig. 3. With the training, the accuracy of training set and validation set gradually increased, and the loss value gradually decreased. In the 11th epoch of training, the accuracy of the validation set reached the highest, which was 1.000 and the corresponding loss value was 0.029. Meanwhile, the accuracy of the training set was 0.917 and the corresponding loss value was 0.189. This model was taken as the optimal model.
Fig. 3.
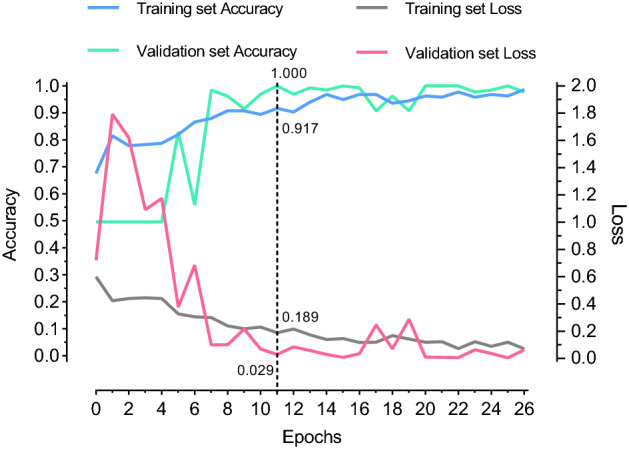
3D-CNN training process. The accuracy of the validation set was 1.000 during the 11th epoch of training, which was the highest. After 15 rounds of additional training (at 26th round), the accuracy of the validation set failed to improve, so the training ended
Performance of the 3D-CNN optimal model in the test set
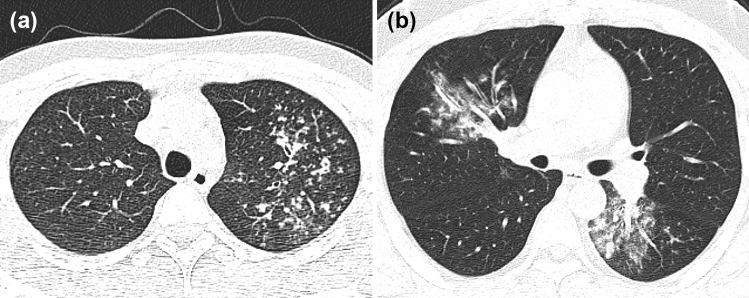
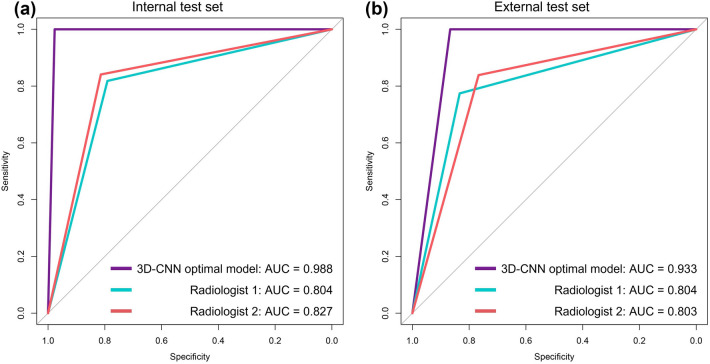
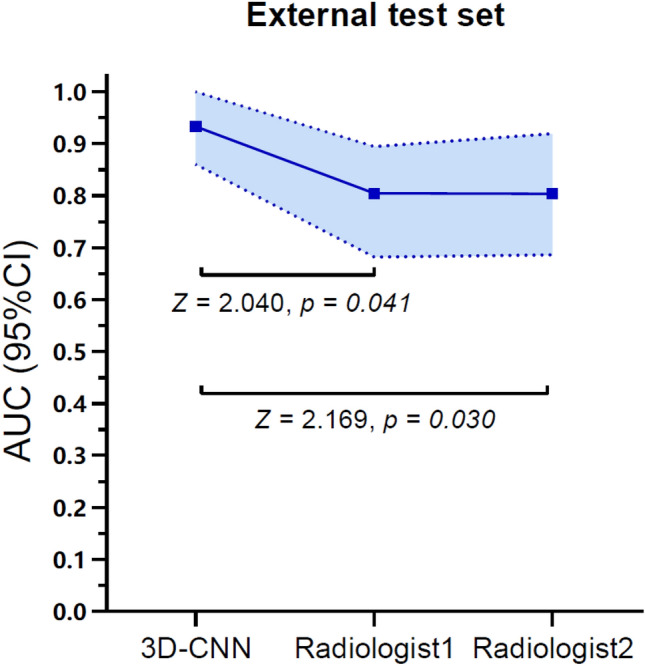
The accuracy of 3D-CNN optimal model in the internal test set was 0.989 and that in the external test set was 0.934, as shown in Fig. 4. It takes about 3 s to predict one patient. The agreement between the two radiologists was excellent, and Kappa values were 0.770 and 0.804 in the internal test set and external test set, respectively, with p < 0.001. The performance of the 3D-CNN optimal model and two radiologists in the internal test set and external test set are shown in Table 2. ROC curves are shown in Fig. 5. The AUC of the 3D-CNN optimal model in both test sets was higher than that of the two radiologists, with statistically significant differences (all p < 0.05), as shown in Appendix 2. The calibration curves of the 3D-CNN optimal model and two radiologists in the two test sets almost coincided with the diagonal, indicating that the calibration was high, as shown in Appendix 3.
Fig. 4.
a A patient with APTB from an internal test set, male, 20 years old, weak for 1 month. Chest CT images showed multiple small nodules distributed along the bronchus in the upper lobe of the left lung, with blurred boundary and uneven thickening of some bronchial walls. The probability of diagnosing APTB output from the 3D-CNN optimal model was 1.000. b A patient with CAP from an external test set, male, 30 years old, fever for 6 days, cough and expectoration for 4 days. Chest CT images showed patchy high-density shadows in the middle lobe of the right lung and the lower lobe of the left lung, with blurred boundaries, and air bronchogram sign. The probability of diagnosing APTB output from the 3D-CNN optimal model was 0
Table 2.
The performance of the 3D-CNN optimal model in internal test set and external test set
| Parameters | Internal test set | External test set | ||||
|---|---|---|---|---|---|---|
| 3D-CNN optimal model | Radiologist1 | Radiologist2 | 3D-CNN optimal model | Radiologist1 | Radiologist2 | |
| Accuracy | 0.989 | 0.805 | 0.828 | 0.934 | 0.803 | 0.803 |
| AUC (95%CI) |
0.988 (0.962–1.000) |
0.804 (0.708–0.901) |
0.827 (0.735–0.920) |
0.933 (0.860–1.000) |
0.804 (0.682–0.894) |
0.803 (0.686–0.919) |
| Corrected AUC | 0.989 | 0.806 | 0.829 | 0.932 | 0.802 | 0.800 |
| Sensitivity/recall | 1.000 | 0.818 | 0.841 | 1.000 | 0.774 | 0.839 |
| Specificity | 0.977 | 0.791 | 0.814 | 0.867 | 0.833 | 0.767 |
| PPV/precision | 0.978 | 0.800 | 0.822 | 0.886 | 0.828 | 0.788 |
| NPV | 1.000 | 0.810 | 0.833 | 1.000 | 0.781 | 0.821 |
| F1-score | 0.989 | 0.809 | 0.831 | 0.939 | 0.800 | 0.813 |
AUC Area-sunder-the-curve, PPV Positive predictive value, NPV Negative predictive value
Fig. 5.
ROC curve of the 3D-CNN optimal model in internal test set and external test set
The accuracy of the 3D-CNN optimal model for the 120 COVID-19 data sets was 0.908 (109/120).
Decision curve analysis
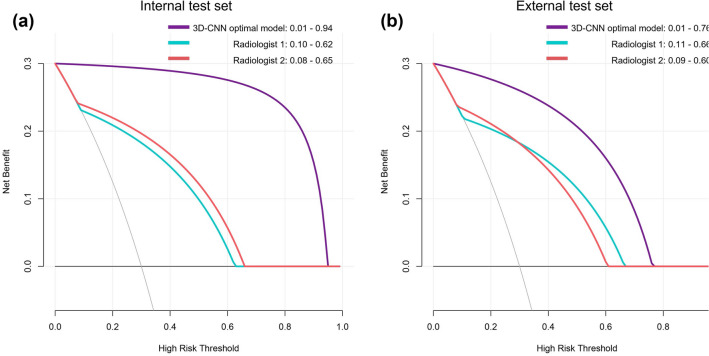
As shown in Fig. 6, in the internal test set, decision curve analysis showed that the 3D-CNN optimal model and the two radiologists could bring net benefits to all patients within the probability threshold range of 0.01–0.94, 0.10–0.62 and 0.08–0.65, respectively. The probability threshold range of the 3D-CNN optimal model for the net benefit of patients was larger than that of the two radiologists, and the degree of net benefit of all patients was higher than that of the two radiologists.
Fig. 6.
Decision curve analysis of the 3D-CNN optimal model in internal test set and external test set. The horizontal black line in both figures represents a net benefit of zero, which means all patients are diagnosed negative (CAP). The oblique gray line represents the benefit change of all patients diagnosed as positive (APTB)
In the external test set, decision curve analysis showed that the 3D-CNN optimal model and the two radiologists could bring net benefit to all patients within the probability threshold range of 0.01–0.76, 0.11–0.66 and 0.09–0.60, respectively. The probability threshold range of the 3D-CNN optimal model for the net benefit of patients was larger than that of two radiologists, and the degree of net benefit of all patients was higher than that of two radiologists, but it was lower than that of the internal test set.
Discussion
In our study, the optimal model obtained after 3D-CNN training was used to differentiate APTB from CAP based on the chest CT images. High discrimination was obtained in both the internal test set and external test set. The AUC was significantly higher than the two radiologists and showed high degree of calibration. Further decision curve analysis results showed that the optimal model provided net benefit for all patients within a larger probability threshold range, and the net benefit for all patients was significantly higher than that for the two radiologists in both test sets. The optimal model only took 3 s to diagnose one patient. These results indicated that the 3D-CNN optimal model could quickly and accurately distinguish APTB from CAP using chest CT images.
Previous studies on predicting pulmonary tuberculosis based on clinical factors have been reported. Cavallazzi et al. [4] conducted a secondary analysis of 6976 hospitalized patients in the Community-Acquired Pneumonia Organization cohort study, attempting to construct a model for predicting pulmonary tuberculosis patients based on the 22 risk factors proposed by the USA Centers for Disease Control and Prevention. The final model (risk factors including night sweats, hemoptysis, weight loss, tuberculosis exposure and upper lobe infiltrate) obtained an AUC of 0.89 (95%CI: 0.85—0.93), which was a better prediction model for pulmonary tuberculosis based on clinical information at present. In laboratory studies, Sun et al. [22] used multiple parameters of cell population data used to characterize white blood cells morphology to identify APTB and CAP. Their results showed that neutrophil mean conductivity, monocyte mean volume and monocyte mean conductivity had high discrimination ability in identifying the two diseases, and AUC could reach 0.99 when used in combination.
In terms of imaging, most imaging findings of APTB and CAP were similar. The research results of Lin et al. showed that pneumonia was more prone to bronchial inflation sign than pulmonary tuberculosis on X-ray chest radiographs, but no significant difference in other imaging findings [23]. In a recent study, researchers focused on the potential of cavity features in chest CT images in identifying Mycobacterium tuberculosis and non-Mycobacterium tuberculosis infection. The six machine learning models established by radiomic analysis method have achieved good performance in both internal and external validation sets, which showed that the radiomic quantitative features used to characterize cavities can help to identify the two lesions [24]. Carlesi et al. [6] evaluated the 10 CT findings of pulmonary parenchymal in 49 patients with pulmonary tuberculosis, and the results showed that there was a statistically significant difference between the positive and negative of acid-fast bacilli in consolidation, tree-in-bud and cavity. Further multivariate logistic regression analysis showed that only cavity was the independent risk factor (OR = 44.4, p = 0.001). The above results show that some image features can provide a structural basis for the differential diagnosis of the two diseases. Komiya et al. [25] compared the high-resolution CT findings of pulmonary tuberculosis and CAP in the elderly population (age > 65 years). These CT findings were obtained from the visual evaluation of two respiratory physicians. The multivariate analysis results showed that the AUC was only 0.711, 0.722 and 0.703 for the diagnosis of pulmonary tuberculosis with centrilobular nodules, air bronchogram and cavity, respectively (Only negative predictive value and positive predictive value were reported in the original study. We recalculated AUC according to the table data in the paper for comparison purpose), but the authors of the literature did not report the performance of the combined model. Part of the study results of Wang et al. [26] showed that the AUC values of two radiologists with different diagnostic experience in differentiating primary pulmonary tuberculosis from CAP in children based on chest CT images were 0.700–0.799, similar to the performance of the two radiologists in our study.
In the past, CNN has achieved good results in the classification task of identifying the two-dimensional images of APTB and normal X-ray chest radiographs, and available artificial intelligence tools have been developed and applied [14–16]. Some CNN models have also achieved good test performance in two famous external public data sets (Department of Health and Human Services, Montgomery County, Maryland, USA, and Shenzhen No. 3 People's Hospital in China) [27]. However, the trained model with normal X-ray chest radiographs as the control group may have potential risks in the actual complex clinical working environment [28]. Because the weights were constantly optimized with the training, the mapping learned by CNN may be to distinguish between abnormal and normal X-ray chest radiographs, rather than between APTB and normal. Recently, our team further added the CAP X-ray chest radiographs data set and obtained an accuracy of 0.945 in the three-classification tasks of identifying healthy people, APTB and CAP using transfer learning, with AUC higher than 0.950 in the further two-classification tasks [17]. It showed that CNN had great potential for automatic classification of chest imaging.
Our current study referred to the 3D-CNN structure recommended by previous researchers and made some optimization. We set the threshold of CT value for Chest CT images as [ − 1000HU, 100HU] based on our clinical knowledge, because the densities of either APTB or CAP lesions are rarely higher than 100HU. In addition, we make full use of the validation set to select hyper-parameters, such as choosing the model with the highest accuracy in the validation set as the optimal model, and 0.4 as the optimal dropout rate of the Dropout layer. The study of Blazis et al. showed that different scanning equipment or image reconstruction parameters will affect the sensitivity/recall and PPV/precision of deep learning model for the detection of pulmonary nodules in chest CT images [29]. However, the reported CNN model for COVID-19 diagnosis still achieved good performance by using chest CT images with different imaging parameters in different hospitals [30, 31]. We tested the optimal model again with additional public COVID-19 data sets with unknown CT imaging parameters and still achieved high accuracy. This result indicated that imaging parameters may have little impact on the qualitative identification task of APTB and CAP.
In the difference test of clinical data of APTB and CAP, we found that only age, pharyngalgia and hemoptysis were statistically significant in the internal test set between the two diseases, while other clinical data were not statistically significant. All clinical data in the external test set had no significant difference between the two diseases. These clinical data in the two test sets provided the discrimination equivalent to coin tossing (AUC was about 0.5). In a study [32] that differentiates APTB from normal population using chest radiographs, the authors found no significant improvement in model performance for each additional demographic variable. After further combination of demographic variables into the training, the optimal model only increased the AUC from 0.9075 to 0.9213. The data of Wang et al. [26] also showed that there was no statistically significant difference in clinical data and laboratory results between primary pulmonary tuberculosis and CAP in children. It shows that the contribution of demographic variable to the model is very limited. Moreover, on the one hand, collecting the variable of clinical symptoms is a cumbersome process for large-scale screening. For multicenter research, the subjective differences of collectors will also affect the determination of clinical symptoms and will undoubtedly reduce the use efficiency of deep learning model in clinical work. On the other hand, over 50% of tuberculosis patients had no symptoms at diagnosis and had overlapping with normal population. The symptoms of tuberculosis patients with symptoms overlap with the symptoms of CAP patients. In addition, the optimal CNN model based on CT images in our study had achieved high performance. Therefore, demographic data and clinical data were not used in the training of the deep learning model in our study.
In medical image analysis, another common analysis method was to segment the region of interest in the image. The purpose of segmentation was to simplify the image and obtain highly specific features from the segmented region for analysis [13]. In our study, lesions or lung tissue were not segmented from chest CT images because it is considered that some extrapulmonary lesions of the chest may also provide a structural basis for the diagnosis of two diseases, such as pleural effusion, pleural thickening and mediastinal lymph node enlargement. On the other hand, the segmentation result of deep learning technology was not good because the edges of the two lesions were blurred. In addition, Wang et al. [33] used a 3D-ResNet network based on chest CT images to distinguish mycobacterium tuberculosis and non-mycobacterium tuberculosis infection without segmentation, and the results showed that the suspected lesions found by CNN were highly consistent with the actual lesion range observed by radiologists. This may benefit from automatic learning of features highly relevant to tasks from unsegmented images because CNN itself has the function of filtering image redundant information and amplifying or refining features useful for classification.
Our study still has the following limitations: First, our study only selected CAP as the control group, and other chest lesions may have a potential impact on the application of the model, such as severe pulmonary interstitial fibrosis, atelectasis and pulmonary edema. These lesions will also have different degrees of patchy shadows, like APTB and CAP images. Therefore, imaging data sets of these patients should be added for further analysis in the future. Second, some patients with APTB had immune impairment and may be associated with pulmonary infection, but these patients were still assigned to the APTB group, so there was potential grouping bias. Third, the etiological results of some patients were not obtained before antibiotic treatment, because the use of antibiotics may lead to atypical changes in the chest CT findings of CAP and affect the CNN performance.
Conclusions
3D-CNN has high classification performance in differentiating APTB from CAP using chest CT images, which provides a new automatic and rapid diagnosis method for identifying such patients from the perspective of imaging.
Acknowledgements
We would like to thank Dr. Jian Ying Li of GE Healthcare, China, for his technique support and editing the article.
Abbreviations
- TB
Tuberculosis
- PTB
Pulmonary tuberculosis
- APTB
Active pulmonary tuberculosis
- CAP
Community-acquired pneumonia
- CNN
Convolutional neural network
- ROC
Receiver operating characteristic
- AUC
Area-under-the-curve
- PPV
Positive predictive value
- NPV
Negative predictive value
Appendix 1
See Table
Appendix 2
Comparison of AUC between the optimal 3D-CNN optimal model and the two radiologists in two test sets (The shaded area was the 95% confidence interval of the AUC)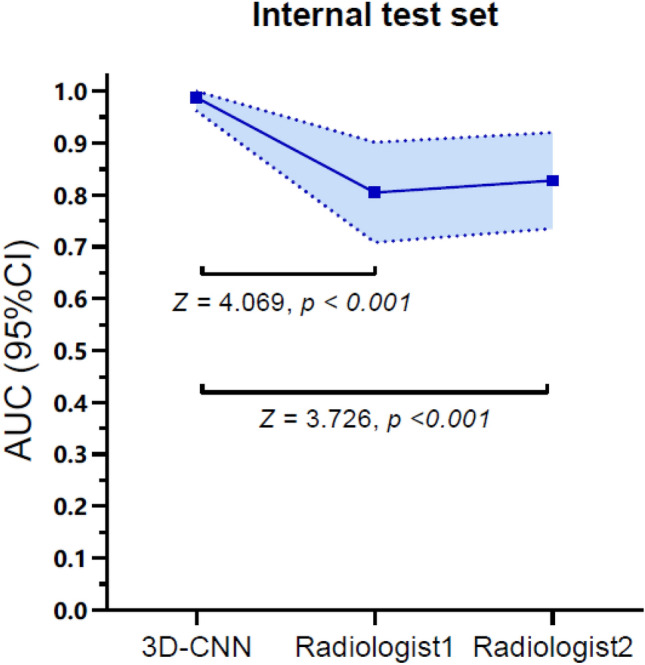
Appendix 3
The calibration curves of the 3D-CNN optimal model and the two radiologists in two test sets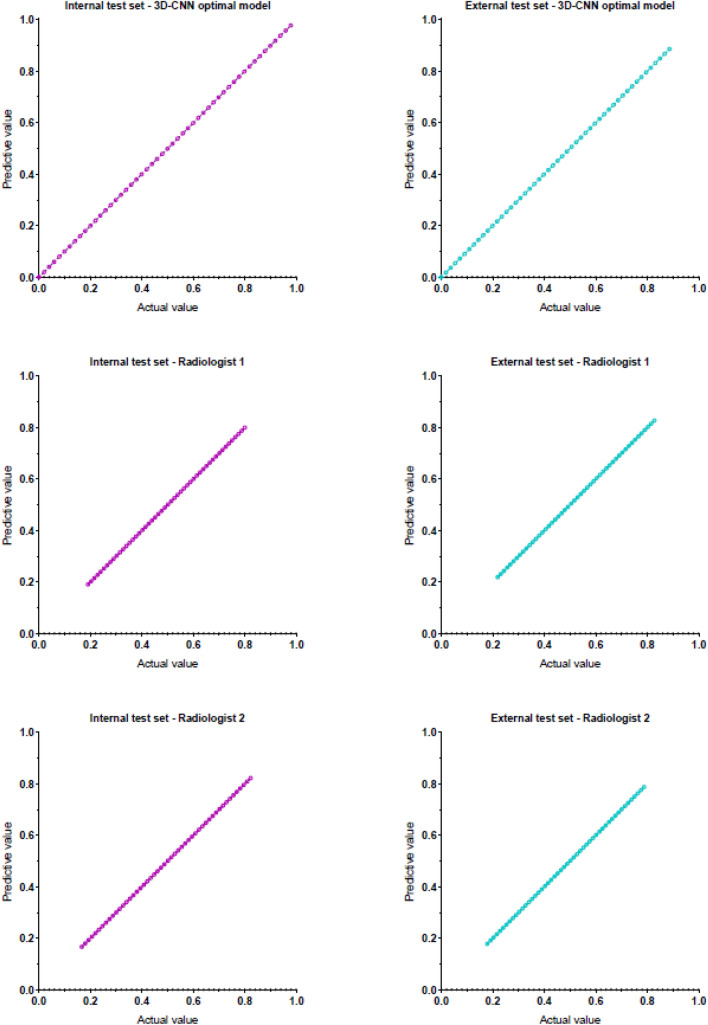
Author contributions
All authors contributed to the study conception and design. DH, TH and NY involved in conceptualization; YC, XL and YY involved in methodology and software; DH and NY involved in writing original draft; WL, XZ, TH, YD and HD contributed to resources; DH, XL, NY, YY, TH and HD involved in review and editing.
Funding
Key industrial innovation chain project of Shaanxi Provincial Department of science and technology (2021ZDLSF04-10); Subject Innovation Team of Shaanxi University of Chinese Medicine (2019-QN09; 2019-YS04).
Declarations
Conflict of interest
All authors of this manuscript declared that there was no conflict of interest.
Ethical approval
This retrospective study was approved by the Affiliated Hospital of Shaanxi University of Chinese Medicine Institutional Ethics Committee (the approval document no.: SZFYIEC-PF-2020 no. [74]), and the consents from patients were waived.
Footnotes
Publisher's Note
Springer Nature remains neutral with regard to jurisdictional claims in published maps and institutional affiliations.
References
- 1.Lee JH, Park S, Hwang EJ, Goo JM, Lee WY, Lee S, et al. Deep learning-based automated detection algorithm for active pulmonary tuberculosis on chest radiographs: diagnostic performance in systematic screening of asymptomatic individuals. Eur Radiol. 2021;31:1069–1080. doi: 10.1007/s00330-020-07219-4. [DOI] [PubMed] [Google Scholar]
- 2.Skoura E, Zumla A, Bomanji J. Imaging in tuberculosis. Int J Infect Dis. 2015;32:87–93. doi: 10.1016/j.ijid.2014.12.007. [DOI] [PubMed] [Google Scholar]
- 3.Liu Y, Wang Y, Shu Y, Zhu J. Magnetic resonance imaging images under deep learning in the identification of tuberculosis and pneumonia. J Healthc Eng. 2021 doi: 10.1155/2021/6772624. [DOI] [PMC free article] [PubMed] [Google Scholar] [Retracted]
- 4.Cavallazzi R, Wiemken T, Peyrani CDP, BlasiLevy FG, et al. Predicting mycobacterium tuberculosis in patients with community-acquired pneumonia. Eur Respir J. 2014;43:178–184. doi: 10.1183/09031936.00017813. [DOI] [PubMed] [Google Scholar]
- 5.World Health Organization (2021) Global tuberculosis report 2021. https://www.who.int/publications/i/item/9789240037021. Accessed 07 Dec 2022.
- 6.Carlesi E, Orlandi M, Mencarini J, Bartalesi F, Lorini C, Bonaccorsi G. How radiology can help pulmonary tuberculosis diagnosis: analysis of 49 patients. Radiol Med. 2019;124:838–845. doi: 10.1007/s11547-019-01040-w. [DOI] [PubMed] [Google Scholar]
- 7.Lange C, Mori T. Advances in the diagnosis of tuberculosis. Respirology. 2010;15:220–240. doi: 10.1111/j.1440-1843.2009.01692.x. [DOI] [PubMed] [Google Scholar]
- 8.Dheda K, Makambwa E, Esmail A. The Great Masquerader: Tuberculosis presenting as community-acquired pneumonia. Semin Respir Crit Care Med. 2020;41:592–604. doi: 10.1111/j.1440-1843.2009.01692.x. [DOI] [PubMed] [Google Scholar]
- 9.Nambu A, Ozawa K, Kobayashi N, Tago M. Imaging of community-acquired pneumonia: roles of imaging examinations, imaging diagnosis of specific pathogens and discrimination from noninfectious diseases. World J Radiol. 2014;6:779–793. doi: 10.4329/wjr.v6.i10.779. [DOI] [PMC free article] [PubMed] [Google Scholar]
- 10.van Cleeff MR, Kivihya-Ndugga LE, Meme H, Odhiambo JA, Klatser PR. The role and performance of chest X-ray for the diagnosis of tuberculosis: a cost-effectiveness analysis in Nairobi. Kenya BMC Infect Dis. 2005;5:111. doi: 10.1186/1471-2334-5-111. [DOI] [PMC free article] [PubMed] [Google Scholar]
- 11.Rajpurkar P, O'Connell C, Schechter A, Asnani N, Li J, Kiani A, et al. CheXaid: deep learning assistance for physician diagnosis of tuberculosis using chest x-rays in patients with HIV. NPJ Digit Med. 2020;3:115. doi: 10.1038/s41746-020-00322-2. [DOI] [PMC free article] [PubMed] [Google Scholar]
- 12.Nash M, Kadavigere R, Andrade J, Sukumar CA, Chawla K, Shenoy VP, et al. Deep learning, computer-aided radiography reading for tuberculosis: a diagnostic accuracy study from a tertiary hospital in India. Sci Rep. 2020;10:210. doi: 10.1038/s41598-019-56589-3. [DOI] [PMC free article] [PubMed] [Google Scholar]
- 13.Scapicchio C, Gabelloni M, Barucci A, Cioni D, Saba L, Neri E. A deep look into radiomics. Radiol Med. 2021;126:1296–1311. doi: 10.1007/s11547-021-01389-x. [DOI] [PMC free article] [PubMed] [Google Scholar]
- 14.Khan FA, Majidulla A, Nazish TGA, Abidi SK, Benedetti A, et al. Chest x-ray analysis with deep learning-based software as a triage test for pulmonary tuberculosis: a prospective study of diagnostic accuracy for culture-confirmed disease. Lancet Digit Health. 2020;2:e573–581. doi: 10.1016/S2589-7500(20)30221-1. [DOI] [PubMed] [Google Scholar]
- 15.Hwang EJ, Park S, Jin KN, Kim JI, Choi SY, Lee JH, et al. Development and validation of a deep learning-based automatic detection algorithm for active pulmonary tuberculosis on chest radiographs. Clin Infect Dis. 2019;69:739–747. doi: 10.1093/cid/ciy967. [DOI] [PMC free article] [PubMed] [Google Scholar]
- 16.Lakhani P, Sundaram B. Deep learning at chest radiography: automated classification of pulmonary tuberculosis by using convolutional neural networks. Radiology. 2017;284:574–582. doi: 10.1148/radiol.2017162326. [DOI] [PubMed] [Google Scholar]
- 17.Han D, He T, Yu Y, Guo Y, Chen Y, Duan H, et al. Diagnosis of active pulmonary tuberculosis and community acquired pneumonia using convolution neural network based on transfer learning. Acad Radiol. 2022;29:1486–1492. doi: 10.1016/j.acra.2021.12.025. [DOI] [PubMed] [Google Scholar]
- 18.National Clinical Research Center for Infections Disease, the Third People’s Hospital of Shenzhen, Editorial Board of Chinese Journal of Antituberculosis Expert consensus on a standard of activity judgment of pulmonary tuberculosis and its clinical implementation. Chinese Journal of Antituberculosis. 2020;42:301–307. doi: 10.3969/j.issn.1000-6621.2020.04.001. [DOI] [Google Scholar]
- 19.Chinese Thoracic Society Guidelines for the diagnosis and treatment of community-acquired pneumonia. Chinese Practical Journal of Rural Doctor. 2013;20:11–15. doi: 10.3969/j.issn.1672-7185.2013.02.006. [DOI] [Google Scholar]
- 20.Yaniv Z, Lowekamp BC, Johnson HJ, Beare R. SimpleITK image-analysis notebooks: a collaborative environment for education and reproducible research. J Digit Imaging. 2018;31:290–303. doi: 10.1007/s10278-017-0037-8. [DOI] [PMC free article] [PubMed] [Google Scholar]
- 21.Zunair H, Rahman A, Mohammed N, Cohen JP (2020) Uniformizing techniques to process CT scans with 3D CNNS for tuberculosis prediction. International workshop on predictive intelligence in medicine 156–168. https://arxiv.org/abs/2007.13224v1. Accessed 07 Dec 2022.
- 22.Sun T, Wu B, Wang LZJ, Deng S, Huang Q. Cell population data in identifying active tuberculosis and community-acquired pneumonia. Open Med (Wars) 2021;16:1143–1149. doi: 10.1515/med-2021-0322. [DOI] [PMC free article] [PubMed] [Google Scholar]
- 23.Lin CH, Chen TM, Chang CC, Tsai CH, Chai WH, Wen JH. Unilateral lower lung field opacities on chest radiography: a comparison of the clinical manifestations of tuberculosis and pneumonia. Eur J Radiol. 2012;81:e426–430. doi: 10.1016/j.ejrad.2011.03.028. [DOI] [PubMed] [Google Scholar]
- 24.Yan Q, Wang W, ZuoWangChai ZWLDX, et al. Differentiating nontuberculous mycobacterium pulmonary disease from pulmonary tuberculosis through the analysis of the cavity features in CT images using radiomics. BMC Pulm Med. 2022;22:4. doi: 10.1186/s12890-021-01766-2. [DOI] [PMC free article] [PubMed] [Google Scholar]
- 25.Komiya K, Yamasue M, Goto A, Nakamura Y, Hiramatsu K, Kadota JI, et al. High-resolution computed tomography features associated with differentiation of tuberculosis among elderly patients with community-acquired pneumonia: a multi-institutional propensity-score matched study. Sci Rep. 2022;12:7466. doi: 10.1038/s41598-022-11625-7. [DOI] [PMC free article] [PubMed] [Google Scholar]
- 26.Wang B, Li M, Ma H, Han F, Wang Y, Zhao S, et al. Computed tomography-based predictive nomogram for differentiating primary progressive pulmonary tuberculosis from community-acquired pneumonia in children. BMC Med Imaging. 2019;19:63. doi: 10.1186/s12880-019-0355-z. [DOI] [PMC free article] [PubMed] [Google Scholar]
- 27.Kim TK, Yi PH, Hager GD, Lin CT. Refining dataset curation methods for deep learning-based automated tuberculosis screening. J Thorac Dis. 2020;12:5078–5085. doi: 10.21037/jtd.2019.08.34. [DOI] [PMC free article] [PubMed] [Google Scholar]
- 28.Sathitratanacheewin S, Sunanta P, Pongpirul K. Deep learning for automated classification of tuberculosis-related chest X-Ray: dataset distribution shift limits diagnostic performance generalizability. Heliyon. 2020;6:e04614. doi: 10.1016/j.heliyon.2020.e04614. [DOI] [PMC free article] [PubMed] [Google Scholar]
- 29.Blazis SP, Dickerscheid DBM, Linsen PVM, Martins Jarnalo CO. Effect of CT reconstruction settings on the performance of a deep learning based lung nodule CAD system. Eur J Radiol. 2021;136:109526. doi: 10.1016/j.ejrad.2021.109526. [DOI] [PubMed] [Google Scholar]
- 30.Bai HX, Wang R, Xiong Z, Hsieh B, Chang K, Halsey K, et al. Artificial intelligence augmentation of radiologist performance in distinguishing COVID-19 from pneumonia of other origin at chest CT. Radiology. 2021;299:e225. doi: 10.1148/radiol.2021219004. [DOI] [PMC free article] [PubMed] [Google Scholar]
- 31.Li L, Qin L, Xu Z, Yin Y, Wang X, Kong B, et al. Using artificial intelligence to detect COVID-19 and community-acquired pneumonia based on pulmonary CT: evaluation of the diagnostic accuracy. Radiology. 2020;296:e65–71. doi: 10.1148/radiol.2020200905. [DOI] [PMC free article] [PubMed] [Google Scholar]
- 32.Heo SJ, Kim Y, Yun S, Lim SS, Kim J, Nam CM, et al. Deep learning algorithms with demographic information help to detect tuberculosis in chest radiographs in annual workers' health examination data. Int J Environ Res Public Health. 2019;16:250. doi: 10.3390/ijerph16020250. [DOI] [PMC free article] [PubMed] [Google Scholar]
- 33.Wang L, Ding W, Mo Y, Shi D, Zhang S, Zhong L, et al. Distinguishing nontuberculous mycobacteria from Mycobacterium tuberculosis lung disease from CT images using a deep learning framework. Eur J Nucl Med Mol Imaging. 2021;48:4293–4306. doi: 10.1007/s00259-021-05432-x. [DOI] [PMC free article] [PubMed] [Google Scholar]


