

Abstract
This study examined the effect of buffer salts on the physical stability of spray-dried and lyophilized formulations of a model protein, bovine serum albumin (BSA). BSA formulations with various buffers were dried by either lyophilization or spray drying. The protein powders were then characterized using solid-state Fourier transform infrared spectroscopy (ssFTIR), powder X-ray diffraction (PXRD), size exclusion chromatography (SEC), solid-state hydrogen/deuterium exchange with mass spectrometry (ssHDX-MS), and solid-state nuclear magnetic resonance spectroscopy (ssNMR). Particle characterizations such as Brunauer-Emmett-Teller (BET) surface area, particle size distribution, and particle morphology were also performed. Results from conventional techniques such as ssFTIR did not exhibit correlations with the physical stability of studied formulations. Deconvoluted peak areas of deuterated samples from the ssHDX-MS study showed a satisfactory correlation with the loss of the monomeric peak area measured by SEC (R2 of 0.8722 for spray-dried formulations and 0.8428 for lyophilized formulations) in the 90-day accelerated stability study conducted at 40°C. mDSC and PXRD was unable to measure phase separation in the samples right after drying. In contrast, ssNMR successfully detected the occurrence of phase separation between the succinic buffer component and protein in the lyophilized formulation, which results in a distribution of microenvironmental acidity and the subsequent loss of long-term stability. Moreover, our results suggested that buffer salts have less impact on physical stability for the spray-dried formulations than the lyophilized solids.
Keywords: Spray drying, lyophilization, protein structure, buffers, solid formulation, physical stability, miscibility, microenvironmental acidity
Introduction
Solid-state protein formulations are developed to offer better physical and chemical stability as compared to the formulations in solution-state (1). Lyophilization is the most commonly used drying technique to produce protein solids (2). However, lyophilization is a batch process that is time- and energy-intensive (3); other alternative drying techniques are being considered to produce solid protein formulations such as spray drying (4).
Spray drying is a technique to produce solid formulations where the solution is atomized into small droplets followed by drying of the droplets to form solid particles (5). Due to the high throughput nature and short processing time, there is an increasing interest in using spray drying to produce protein formulations (6). Pharmaceutical products such as Exubera® (inhalable insulin) and Raplixa® (a blend of thrombin and fibrinogen powder) have been developed using spray drying (7, 8). While spray drying offers advantages in terms of material properties and processing time, process stresses such as high temperature, atomization stresses, and air-liquid interfacial stresses may have an impact on the stability of the spray-dried protein solids (4). It is important to understand the effect of different excipients on the stability of the formulation (9). The impact of components such as sugars and surfactants has been previously studied (10–12).
Buffers have been added into protein formulation to maintain pH (2, 13–15). pH is an important factor to maintain the stability of protein formulations as many proteins are stable only over a range of pH values (16, 17). Apart from maintaining the pH of the formulations, the role of buffers in protein conformational and colloidal stability in the solution state has been reviewed (18, 19). Buffers are also shown to interact with other excipients in the formulations such as sugars (20). Such interactions have been shown to influence the solid-state properties such as glass transition temperature (Tg) (20). Various studies have demonstrated that buffers have a tendency to phase separate either by precipitation (21) or subsequent crystallization (22–24), which causes abrupt pH change during the freezing step of the lyophilization process. However, interactions of buffers with other components and their impact on protein stability for spray-dried protein formulations are not well studied.
This study aimed to understand the impact of different buffers on the structural and physical stability of spray-dried protein solid formulations. While there are many buffers available, commonly used buffers such as phosphate, succinate, and citrate buffers with sodium and potassium counter-ions were used in this study. Formulations were prepared with a model protein Bovine Serum Albumin (BSA) and a sugar-trehalose dihydrate in 200 mM buffers at a pH of 6.0. The formulation details are presented in Table 1. The concentrations of each component were kept similar among different formulations for a direct comparison on the effect of different buffer, which may not reflect a commercial product. Many critical attributes impact the long-term stability of biologicals in the solid state. For example, excipient crystallization during the drying process can result in the phase separation which jeopardizes the interaction between protein and protectant excipient (25). Moreover, protein-sugar miscibility or spatial homogeneity plays a critical role in product stability and performance, especially in protein aggregation in the dried formulation (25–29). Besides, the change in microenvironmental acidity caused by buffer crystallization can result in loss of protein activities (30, 31). Therefore, we firstly utilized powder X-ray diffraction (PXRD) to characterize the crystallinity, solid-state Fourier transform infrared spectroscopy (ssFTIR) to study the structural conformation, and modulated differential scanning calorimetry (mDSC) to assess the miscibility. To further probe the molecular properties at a higher resolution and sensitivity, solid-state hydrogen/deuterium exchange with mass spectrometry (ssHDX-MS) was used to characterize the protein-excipient interaction and conformational heterogeneity, and solid-state nuclear magnetic resonance spectroscopy (ssNMR) was utilized to understand the protein-excipient conformation, miscibility, and potential microenvironment pH shift. Results from these measurements were correlated with physical stability that was determined by measuring the loss of monomeric peak area using size exclusion chromatography (SEC) after storage at 40°C over 90 days.
Table 1:
Formulation details
| Formulation | Content (mg/mL) | ||||
|---|---|---|---|---|---|
| Protein (BSA) | Sugar (Trehalose dihydrate) | Buffer (Counter-ion) | Buffer (pH 6.0) 200 mM concentration | Total solids content | |
| BSA with trehalose and sodium phosphate buffer (BSA_Pho_Na) | 10 | 10 | Phosphate (Na) | 23.36 | 43.36 |
| BSA with trehalose and potassium phosphate buffer (BSA_Pho_K) | 10 | 10 | Phosphate (K) | 22.38 | 42.38 |
| BSA with trehalose and sodium succinate buffer (BSA_Suc_Na) | 10 | 10 | Succinate (Na) | 29.86 | 49.85 |
| BSA with trehalose and potassium succinate buffer (BSA_Suc_K) | 10 | 10 | Succinate (K) | 29.28 | 49.28 |
| BSA with trehalose and sodium citrate buffer (BSA_Cit_Na) | 10 | 10 | Citrate (Na) | 24.85 | 44.85 |
| BSA with trehalose and potassium citrate buffer (BSA_Cit_K) | 10 | 10 | Citrate (K) | 33.40 | 53.40 |
| BSA with trehalose and no buffer (BSA_Buffer free) | 10 | 10 | Buffer free | 0 | 20 |
Materials and Methods
Materials
Sodium phosphate monobasic, sodium phosphate dibasic heptahydrate, succinic acid, sodium hydroxide, potassium hydroxide, citric acid, sodium succinate, and potassium succinate were purchased from Millipore Sigma (St. Louis, MO, USA). A supersaturated solution of lithium chloride (Thermo Fisher Scientific, Waltham, MA, USA) in D2O (Cambridge Isotope Laboratories, Inc., Andover, MA, USA) was used to maintain the relative humidity (RH) at 11% in the desiccator for ssHDX studies. BSA formulations (containing 10 mg/mL of BSA) with trehalose dihydrate (10 mg/mL) and buffer (200 mM concentration) were prepared and filtered using a 0.22 μm filter, and then subjected to lyophilization or spray drying.
Spray Drying
A Büchi Mini Spray Dryer B290 (New Castle, DE, USA) was used to produce spray-dried formulations. The formulations were fed into the spray drier at a flow rate of 2 mL/min and dried at an inlet temperature of 120°C with an outlet temperature of 55–60°C. Air was used as the atomizing gas at a volumetric flow of 600 L/h. This study aims to examine the effect of buffer interactions on solid protein formulation; therefore, the spray-dried samples were collected into 20 mL 2R borosilicate glass vials and subjected to additional drying in a vacuum oven at 25°C for 12 hours at 100 mTorr to attain a moisture content of <2% which is comparable to their lyophilized counterparts.
Lyophilization
Lyophilization was conducted by placing 20 mL 2R borosilicate glass vials with a fill volume of 7.5 ml in a LyoStar® 3.0 laboratory-scale lyophilizer (SP Scientific, Gardiner, NY, USA). The shelf temperature was maintained at 5°C until the vials were loaded onto the shelf. The vials were then equilibrated for 1 h at 5°C and the temperature was then ramped to −35°C in 2h and held at −35°C for 5h. The primary drying cycle was initiated by decreasing the chamber pressure to 100 mTorr over 1h, and ramping the temperature to −20°C for another hour. The temperature was held at −20°C for 36h. The pressure of 100 mTorr was maintained in the chamber and the temperature was raised to 20°C over 5h and held for 10h during secondary drying.
Karl Fischer Titration for Moisture Content Analysis
A 917 KF Coulometer (Metrohm, Riverview, FL, USA) was used to determine the moisture content of the dried powders. Triplicates of the dried samples were prepared for each formulation and samples were reconstituted in 1 mL of anhydrous methanol (septum sealed bottle DriSolv®, Millipore Sigma St. Louis, MO, USA) and injected into the measurement cell. The titration endpoint was determined using the Riedel-de Haën Hydranal® Coulomat reagent (Honeywell Research Chemicals, Seelze, Germany). The weight of injected amount and moisture content in ppm were recorded and converted to w/w%.
pH Study
In this study, the pH of formulations was measured using an InLab Micro pH electrode (Mettler Toledo, Columbus, OH, USA). The pH was measured in the initial solution state before drying as well as after reconstituting the dried formulations.
Powder X-ray Diffraction (PXRD)
Powder crystallinity was tested using a Rigaku SmartLab X-ray diffractometer (The Woodlands, TX, USA) consisting of a Cu Kα X-ray source and Bragg-Brentano geometry. The diffraction intensity as a function of 2θ was obtained at a step size of 0.02° at a scanning rate of 4°/min between 4 and 40 degrees.
Solid-State Fourier Transform Infrared Spectroscopy (ssFTIR)
Attenuated total reflectance (ATR) mode on a Nicolet Nexus spectrometer (Thermo Scientific, Waltham, MA, USA) equipped with Smart iTR accessory was used to obtain the ssFTIR spectra for the protein secondary structural analysis. A range of 800 to 4000 cm−1 in absorbance mode at 4 cm−1 resolution was used to collect the data. All spectra were corrected for moisture content and CO2. OPUS 6.5 analysis software (Bruker, Billerica, MA, USA) was used to process the spectra with baseline correction, smoothing, normalization, and second derivatization.
Modulated Differential Scanning Calorimetry (mDSC)
Samples for modulated differential calorimetry were prepared as triplicates for each formulation inside a nitrogen glovebox and maintained at an RH of less than 10%. Each Tzero aluminum pan (TA Instruments, New Castle, DE, USA) was loaded with 2–4 mg of dried sample and sealed using Tzero hermetic lids (TA Instruments, New Castle, DE, USA). A Discovery Series DSC 25 differential scanning calorimeter (TA Instruments, New Castle, DE, USA) was operated with a heating ramp rate of 2°C/min from −5°C to 180°C and modulation of ±1°C every 60 s. An in-built TRIOS software package (v4.3.0, TA instruments, New Castle, DE, USA) was used to determine glass transition temperature (Tg).
Particle Size Distribution
An Aero S equipped Mastersizer 3000 (Malvern Panalytical, Malvern, United Kingdom) was used to measure particle size distributions of the spray-dried samples. Each sample (approximately 50 mg) was dispersed using compressed air at 4 bars. The sizes below which 10% (D10), 50% (D50), 90% (D90), and Span (calculated as [D90-D10]/D50) were determined by the built-in software.
Scanning Electron Microscopy (SEM)
Morphology of the dried samples was visualized using a Teneo Volumescope (Fei, Hillsboro, OR, USA). Samples were sputter-coated with platinum for 1 min and analyzed under a vacuum to determine morphological properties. A voltage of 2 kV at a working distance between 9.3 – 10.2 mm was used.
Surface Area Measurement using BET
Surface area may affect protein stability of solid formulations due to the stress of air-liquid interface (32). Specific surface area of the samples was measured using a Tristar II 3020 (Micromeritics, Norcross, GA, USA). Samples were degassed at room temperature for 12 hours with nitrogen. A 6-point BET method (33) using nitrogen adsorption was used to determine surface area.
Stability Studies by Size Exclusion Chromatography (SEC)
Protein aggregation i.e., the formation of higher molecular weight species in the dried samples upon storage at the accelerated stability conditions of 40°C was measured using SEC. Four replicates of each dried formulation were prepared for each time point with each replicate containing 2–4 mg of the sample. Samples were prepared in a nitrogen glove box at an RH of less than 10% to avoid additional moisture uptake. At different time points (0,15, 30, 60, and 90 days), samples were collected and reconstituted to obtain a protein concentration of 1 mg/mL. An aliquot (0.1mL) of each reconstituted sample was subjected to analysis using a 1260 Infinity II series high-performance liquid chromatography (HPLC) system (Agilent Technologies, Santa Clara, CA, USA) equipped with a TSK gel G3000SWXL column (Tosoh Bioscience LLC, King of Prussia, PA, USA). Sodium phosphate buffer (100 mM concentration at pH 6.8, made with sodium phosphate monobasic and sodium phosphate dibasic heptahydrate) with a flow rate of 1 mL/min was used as the mobile phase. Percentage loss of area under the curve for the monomeric peak was used to determine physical instability of the sample.
Solid-State Hydrogen Deuterium Exchange with Mass Spectrometric Analysis (ssHDX-MS)
Deuterium uptake has been used to measure protein interactions with excipients and effect of different buffers on the solid matrix of the dried formulations (34–36). Three replicates of each dried formulation at specific time points (0, 4, 12, 24, 48, 120, and 240 h) were prepared with each replicate containing 2–4 mg of the sample. The uncapped vials with samples were exposed to D2O vapors by placing them in a sealed desiccator stored at 25°C and maintained at 11% RH using a saturated lithium chloride in D2O solution. After each time point, sample vials were submerged in liquid nitrogen to prevent back exchange of the deuterium and then stored at −80°C until analysis.
Samples subjected to hydrogen-deuterium exchange were reconstituted using an ice-cold quench buffer (a solution containing 0.1% formic acid in MS water with a pH of 2.5) to obtain a concentration of 0.2 mg/ml. Ten μL of the reconstituted solution was injected into a protein microtrap (Michrom Bioresources, Inc., Auburn, CA, USA) and kept in a custom-built refrigeration unit held at 4°C (37) to limit the back exchange of the deuterons within the samples. A high-pressure liquid chromatography system (1200 series, Agilent Technologies, Santa Clara, CA, USA) was used to desalt the samples using a 1:9 ratio of acetonitrile and water (both containing 0.1% formic acid) for 2 min followed by elution over 7.2 min using a ratio of 9:1 of acetonitrile and water (both containing 0.1% formic acid). A 6230 TOF LC/MS (Agilent Technologies, Santa Clara, CA, USA) was tuned to operate in the mass range of 200–3200 m/z to obtain mass spectra of the sample. Deconvoluted peaks, protein mass, and change in protein mass of the samples subjected to hydrogen-deuterium exchange were obtained by analyzing the spectra using the MassHunter Workstation software (Agilent Technologies, Santa Clara, CA, USA). A mono-exponential kinetics model was used to fit the deuterium uptake data:
| (1) |
where D(t) is the total amount of deuterons incorporated at time t, Dmax is the maximum number of deuterons that can be incorporated in the sample as determined experimentally, and k is the observed hydrogen-deuterium exchange rate constant.
Solid-State Nuclear Magnetic Resonance (ssNMR)
Miscibility of formulation components was evaluated using ssNMR by measuring the heteronuclear-detected 1H (i.e., 13C-detected) relaxation time of different components in dried protein formulations, including spin-lattice relaxation in the laboratory (T1) and rotating frame (T1ρ). If the T1 and/or T1ρ values of different components are statistically similar, the formulation is assumed to have a good homogeneity between multiple components with a domain size from several to hundreds of nanometers (25, 38). Such criterion is constructed based on the spin diffusion theory. Typically, 1H-1H spin diffusion is very fast, and 1H magnetization can be transferred between 1H nuclear spins that are spatially close. For major pharmaceutical components, the 1H magnetization usually can be effectively transferred over a distance of 20–100 nm in cases of several seconds of 1H diffusion (38). Therefore, if the T1 1H relaxation times are statistically different in a multi-component system, the inhomogeneous mixing is identified at a domain size of approximately 20–100 nm. Similarly, T1ρ experiments can probe the homogeneity of the domain sizes of several nanometers to tens of nanometers considering the T1ρ for most pharmaceutical components is on the order of 10 ms (38).
All ssNMR experiments were conducted on a Bruker AVANCE III HD 400 spectrometer (Bruker BioSpin Corporation, Billerica, MA) with a 1H frequency of 400.13 MHz in Materials and Biophysical Characterization NMR (MBC-NMR) laboratory at Merck & Co., Inc. (West Point, PA). A 4 mm H/X double-channel Magic angle spinning (MAS) probe was tuned to 1H and 13C resonances and the samples were spun at a MAS frequency of 12 kHz. Three types of experiments were performed in the present study, including 1D 1H-13C cross polarization (CP) and 13C-detected 1H T1 and T1ρ measurements. In the spectral acquisition, the 1H magnetization was excited by a 1H 90° pulse with a length of 2.5 μs and then transferred to 13C via CP transfer by matching Hartmann−Hahn condition. To enhance the CP transfer efficiency, a 50–100% ramped CP was used on the 1H channel and the CP contact time was set to 1 ms. A high-power decoupling of 100 kHz on the 1H channel was applied during data acquisition. 1D 1H-13C CP spectra were acquired with 1.5 s of recycle delay and averaged for 10 to 20k scans, which corresponds to the experimental times of 4 to 8 h. 13C-detected 1H spin-lattice relaxation (T1) measurements were performed using a saturation-recovery sequence in a pseudo-2D mode, in which a delay time (τ1) was purposely applied on 1H channel after saturation pulse to allow the 1H magnetization relax towards equilibrium value. Pseudo-2D experiments were acquired with 7 different τ1 delays in the range of 0.5−8 s. 13C-detected 1H spin-lattice relaxation in the rotating frame (T1ρ) measurements employed a spinlock pulse sequence with a variable spinlock period (τ2) applied on 1H channel before the 1H-13C CP transfer. A relatively strong spinlock field strength of 100 kHz was utilized, and the τ2 was varied from 1 to 40 ms. Pseudo-2D experiments were collected with 8 different τ2 delays. All ssNMR data were analyzed using Bruker Topspin software. The 1D 13C CP spectra were processed with Fourier transformation, Gaussian multiplication, and zero filling. 1H T1 and T1ρ values of BSA, trehalose, and buffer acids were obtained by fitting the integrated peak areas of each component as a function of respective τ1 and τ2 values into the T1 and T1ρ exponential functions. All 13C chemical shifts were referenced to the α-glycine 13C’ carboxyl carbon resonance signal at 176.49 ppm on the tetramethylsilane (TMS) scale.
Statistical Analysis
GraphPad Prism software version 9 (GraphPad, La Jolla, CA, USA) was used for statistical analysis of the data. Welch’s t-test was used to compare the data sets and a p-value of <0.05 is determined as statistically different.
Results
Moisture Content
Moisture content plays a key role in determining the stability of the dried samples as high moisture content has been directly correlated to poor stability within solid-state protein formulations (39). While differences in moisture content were observed among the formulations produced by the same drying method, there were no statistically significant differences (p > 0.05) observed in moisture content between two processes for a specific formulation except for formulation with potassium citrate buffer (Table 2).
Table 2:
Moisture content, pH, and Glass transition temperature of spray-dried and lyophilized formulations (n=3).
| Formulation | Spray Drying | Lyophilization | Spray Drying | Lyophilization | Spray Drying | Lyophilization | ||||||
|---|---|---|---|---|---|---|---|---|---|---|---|---|
| Moisture Content (%) | Moisture Content (%) | pH | pH | Glass Transition Temperature (°C) | Glass Transition Temperature (°C) | |||||||
| Mean | SD | Mean | SD | Pre-processing | Post reconstitution | Pre-processing | Post reconstitution | Mean | SD | Mean | SD | |
| BSA_Pho_Na | 0.75 | 0.16 | 0.88 | 0.22 | 6.10 | 6.03 | 6.10 | 6.10 | 67.08 | 0.64 | 69.33 | 1.75 |
| BSA_Pho_K | 0.94 | 0.14 | 0.62 | 0.34 | 6.10 | 6.10 | 6.10 | 6.10 | 64.01 | 1.99 | 61.45 (*) | 0.15 |
| BSA_Suc_Na | 1.03 | 0.36 | 1.29 | 0.15 | 6.10 | 6.07 | 6.10 | 6.07 | 86.13 | 5.05 | 82.08 | 0.53 |
| BSA_Suc_K | 1.36 | 0.11 | 1.50 | 0.09 | 6.10 | 6.06 | 6.10 | 6.04 | 73.68 | 7.26 | 48.10** | 0.83 |
| BSA_Cit_Na | 1.6 | 0.45 | 1.45 | 0.13 | 6.10 | 5.74 | 6.10 | 6.38 | 110.62 | 4.84 | 113.42 | 1.65 |
| BSA_Cit_K | 1.54 | 0.35 | 0.81* | 0.14 | 6.10 | 6.10 | 6.10 | 6.10 | 101.53 | 2.87 | 92.13* | 2.33 |
| BSA_Buffer free | 1.41 | 0.19 | 1.63 | 0.45 | 6.45 | 6.45 | 6.45 | 6.45 | 92.39 | 0.31 | 85.83* | 1.02 |
p < 0.05 as compared to spray drying of the corresponding formulation.
p < 0.01 as compared to spray drying of the corresponding formulation.
pH
Since proteins may be only viable over a small range of pH values, it is important to measure the pH of the formulations pre-processing and post reconstitution to understand the effects of the processing conditions on the pH values of the formulations. None of the formulations except for the formulation with sodium citrate buffer showed change in the pH post reconstitution as compared to the pH before drying (Table 2).
mDSC Analysis
Tg values showed differences among the formulations produced by the same drying method. Between the two drying methods, the formulations containing potassium buffers along with the buffer-free formulations showed significantly lower (p < 0.05) Tg for lyophilization as compared to spray drying. No statistically significant difference in Tg value was observed between spray drying and lyophilization for the formulations with sodium buffers.
Particle Size Distribution
Particle size distributions of the spray-dried samples are reported in Table 3. All the formulations except those with potassium succinate buffer have similar D10, D50, and D90 values. The formulation with potassium succinate buffer showed a significantly higher particle size distribution.
Table 3:
Particle size distribution of spray-dried formulations (n=3).
| Formulation | D10 (μm) | D50 (μm) | D90 (μm) | Span | ||||
|---|---|---|---|---|---|---|---|---|
| Mean | S.D. | Mean | S.D. | Mean | S.D. | Mean | S.D. | |
| BSA_Pho_Na | 0.435 | 0.074 | 3.26 | 0.19 | 7.73 | 0.59 | 2.233 | 0.027 |
| BSA_Pho_K | 0.436 | 0.105 | 3.39 | 0.23 | 7.44 | 0.21 | 2.070 | 0.127 |
| BSA_Suc_Na | 0.471 | 0.058 | 3.24 | 0.39 | 7.15 | 0.89 | 2.064 | 0.078 |
| BSA_Suc_K | 1.165** | 0.176 | 5.63* | 0.74 | 13.10** | 1.78 | 2.106 | 0.090 |
| BSA_Cit_Na | 0.446 | 0.018 | 3.05 | 0.32 | 7.50 | 0.63 | 2.326 | 0.217 |
| BSA_Cit_K | 0.413 | 0.010 | 2.98 | 0.30 | 7.24 | 0.34 | 2.303 | 0.172 |
| BSA_Buffer free | 0.820* | 0.024 | 4.83* | 0.33 | 10.53** | 0.40 | 2.010 | 0.068 |
p < 0.05 as compared to the formulations of BSA_Pho_Na, BSA_Pho_K, BSA_Suc_Na, BSA_Cit_Na, and BSA_Cit_K
p < 0.01 as compared to the formulations of BSA_Pho_Na, BSA_Pho_K, BSA_Suc_Na, BSA_Cit_Na, and BSA_Cit_K
Particle Morphology
All spray-dried samples had raisin-like structures. Some particles in the formulations with potassium succinate and without any buffer have a more spherical shape with a smoother surface (Fig. 1). The lyophilized formulation with potassium succinate has a distinctive rounded fibrous structure (Fig. 2), while all other lyophilized formulations had a sheet-like structure.
Figure 1:
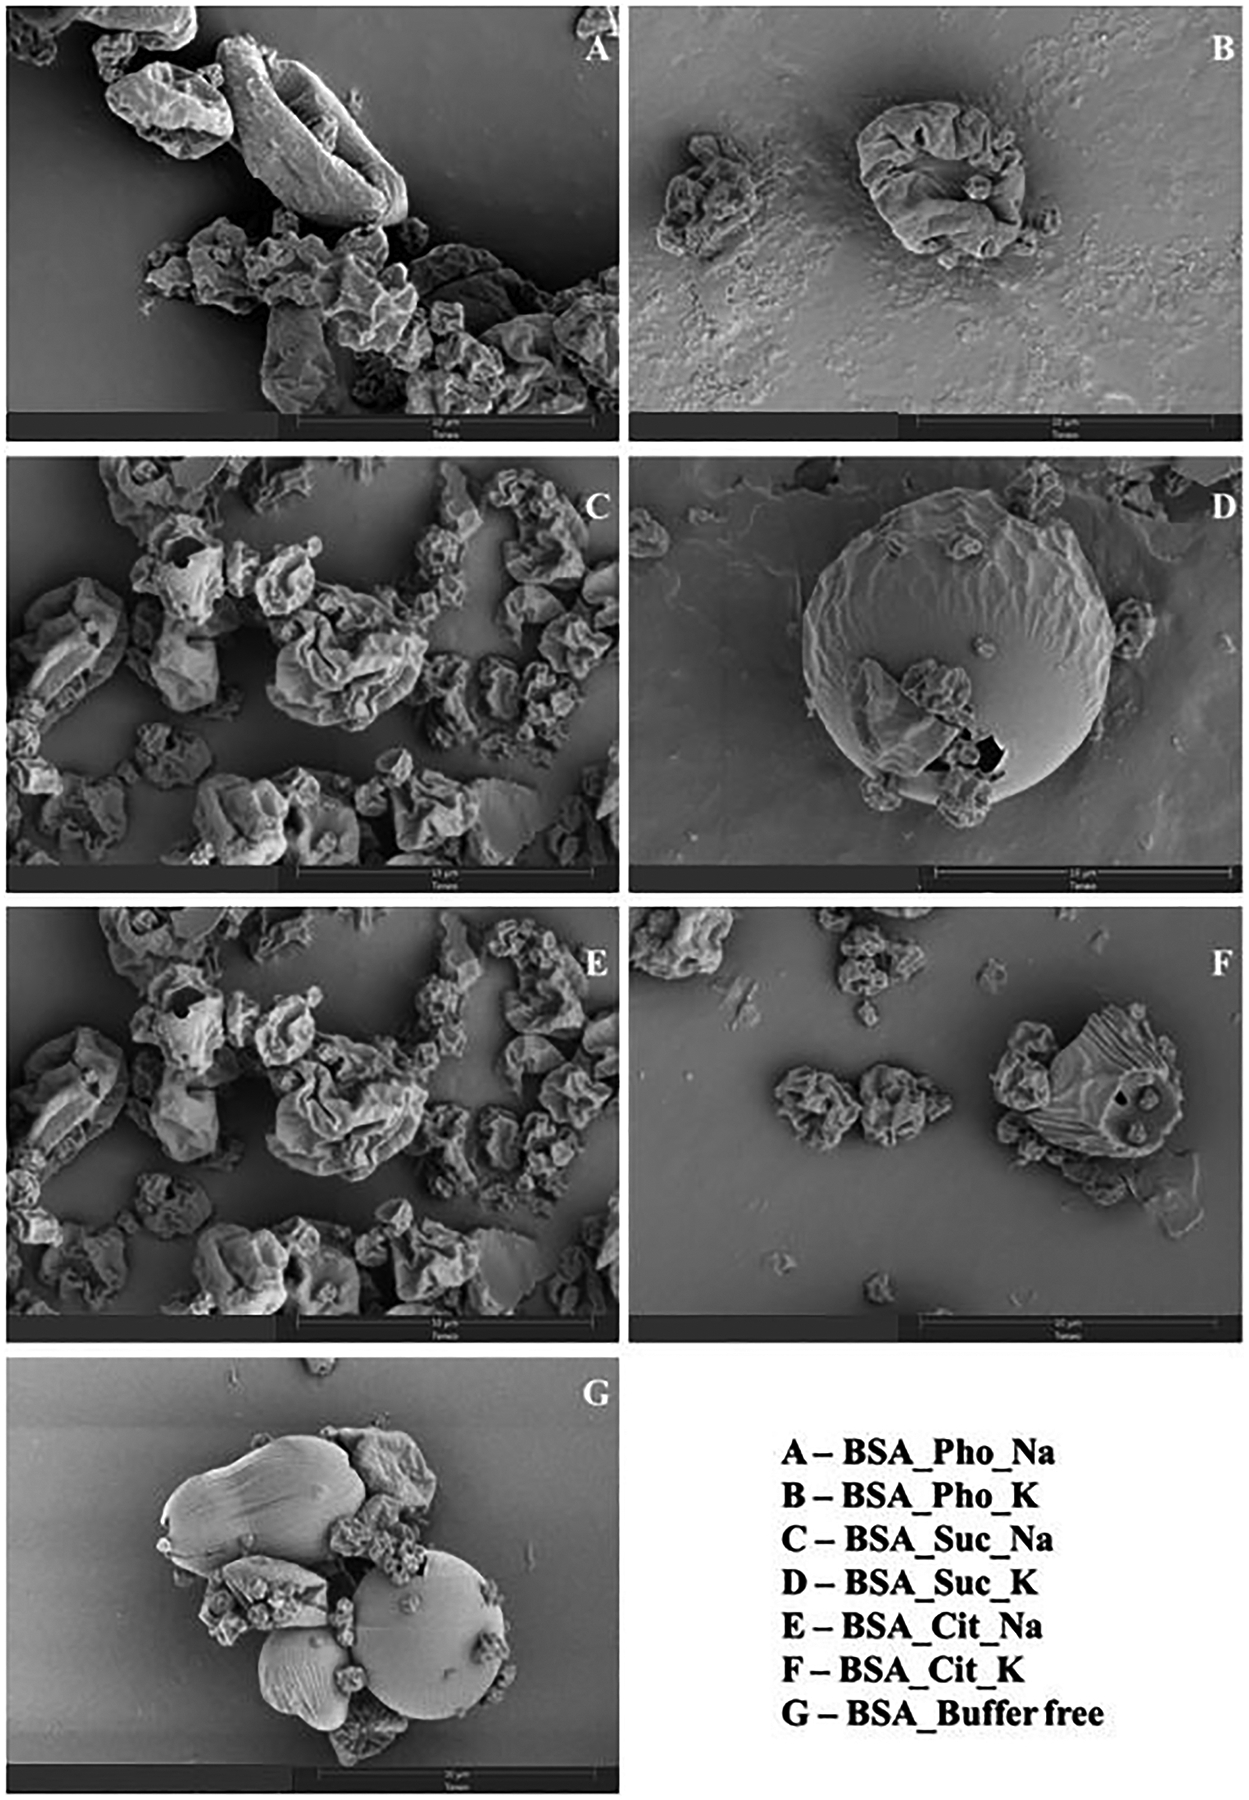
SEM images of spray-dried formulations (Scale bar 10 μm).
Figure 2:

SEM images of lyophilized formulations (Scale bar 100 μm).
Powder X-ray Diffraction
The presence of crystallinity is often an indication of phase separation of components as proteins stay amorphous in the solid state. Therefore, PXRD is used to detect the presence of any crystallinity within the dried samples. All dried formulations showed no apparent crystalline peaks after drying (Fig. 3). However, the formulation with potassium phosphate buffer showed crystalline peaks after storage starting from 15 days (Fig. 4). For the lyophilized formulation with potassium succinate buffer, minor peaks started to appear at 30 days (Fig. 4B). For the spray-dried formulation with potassium succinate buffer, minor crystalline peaks started to appear at 60 days (Fig. 4C). For the lyophilized formulation with sodium phosphate, minor peaks started to appear at 90 days (Fig. 4D) All other formulations did not show apparent peaks after storage.
Figure 3:
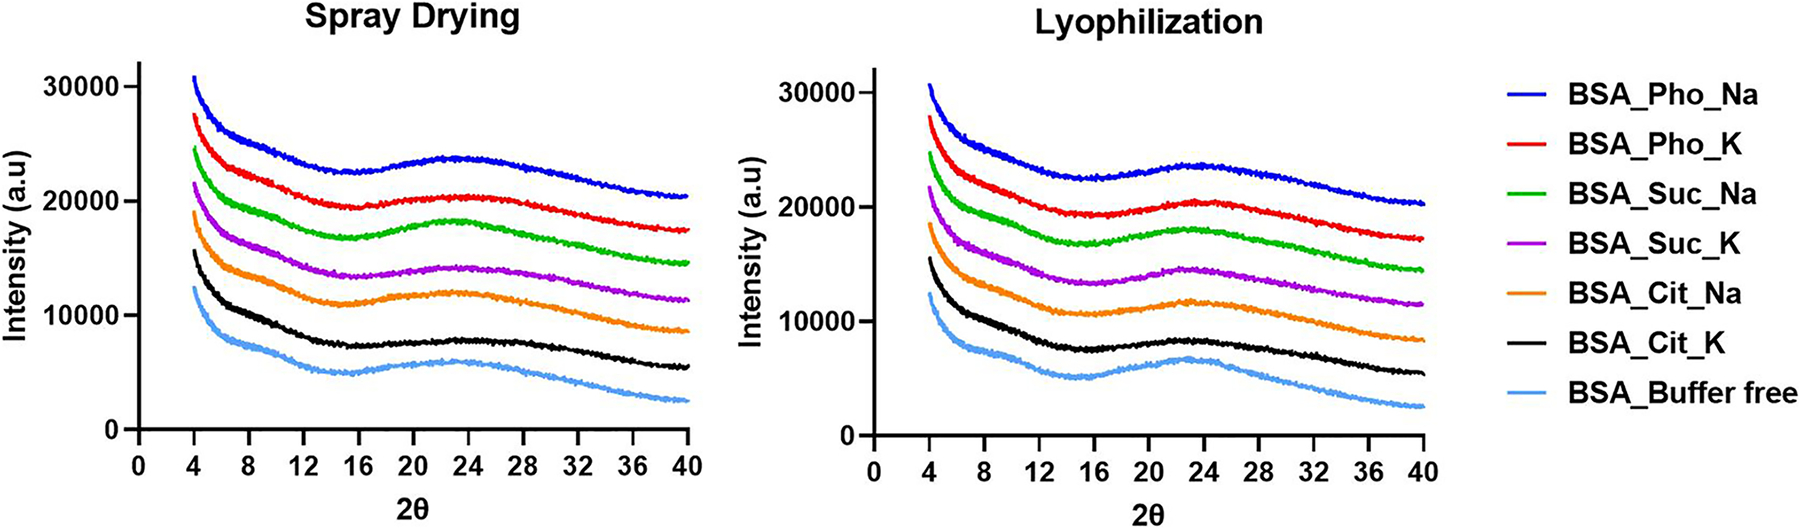
PXRD diffractograms of the spray-dried and lyophilized formulations right after drying.
Figure 4:

PXRD diffractograms of the spray-dried and lyophilized formulations after storage.
Secondary Structural Analysis by ssFTIR
ssFTIR spectrum was analyzed in the Amide I region and the 2nd derivative has been plotted (Fig. 5). FTIR bands were observed at ~1656 cm−1, suggesting the presence of α-helix loops (40, 41). While a reduction in peak intensity has been observed among formulations, there is no significant difference in peak locations between the dried samples.
Figure 5:

Solid-state FTIR spectra of the spray-dried and lyophilized formulations.
Surface area measurement using BET
Surface area of the spray-dried or lyophilized formulations is similar to all the formulations produced by the same process, except potassium succinate buffer. The spray-dried formulation with potassium succinate buffer showed a significantly lower (p<0.001) surface area than all other spray-dried formulations; while the lyophilized formulation with potassium succinate buffer showed a significantly higher surface area (p<0.0001) than all other lyophilized formulations.
ssHDX-MS
Deuterium uptake as a function of time was plotted using a mono-exponential model (Eqn. 1) (Fig. 6). Within spray-dried samples, the potassium succinate formulation showed significantly higher (p<0.001) deuterium uptake compared to all other formulations; no significant difference in deuterium uptake kinetics (p>0.05) was observed among the spray-dried formulations except for potassium succinate. Within lyophilized samples, the formulations with potassium succinate and potassium phosphate buffers, as well as the buffer-free formulation showed higher deuterium uptake than all other lyophilized samples (p < 0.001, p<0.01, and p<0.05, respectively). The rate of deuterium uptake (k) and the maximum deuterium uptake (Dmax) values determined from the mono-exponential model are reported in Table 5. Within spray-dried formulations, the formulation containing potassium succinate buffer showed a significantly higher rate of deuterium uptake (p<0.001) as well as a higher maximum deuterium uptake (p<0.001) as compared to other spray-dried formulations. The lyophilized formulations with potassium succinate and potassium phosphate buffers and buffer-free formulations showed a significantly higher rate of deuterium uptake (p<0.001) and higher maximum deuterium (p<0.001) than other lyophilized formulations.
Figure 6:

Hydrogen/deuterium exchange kinetics of the spray-dried and lyophilized formulations (n = 3, mean ± SD; error bars cannot be shown when smaller than the height of symbols).
Table 5:
Rate of deuterium uptake (k) and maximum deuterium uptake (Dmax) of the spray-dried and lyophilized samples (n=3).
| Formulation | Spray Drying | Lyophilization | ||||||
|---|---|---|---|---|---|---|---|---|
| k (h−1) | Dmax | k (h−1) | Dmax | |||||
| Mean | SD | Mean | SD | Mean | SD | Mean | SD | |
| BSA_Pho_Na | 0.0285 | 0.0054 | 53 | 4 | 0.0339 | 0.0014 | 59 | 0 |
| BSA_Pho_K | 0.0337 | 0.0032 | 81 | 2 | 0.0565 | 0.0052 | 94 | 1 |
| BSA_Suc_Na | 0.031 | 0.0045 | 68 | 5 | 0.0369 | 0.0071 | 64 | 4 |
| BSA_Suc_K | 0.0454 | 0.0036 | 156 | 2 | 0.0594 | 0.0037 | 143 | 2 |
| BSA_Cit_Na | 0.0194 | 0.0012 | 61 | 0 | 0.0237 | 0.0009 | 68 | 1 |
| BSA_Cit_K | 0.0249 | 0.0016 | 67 | 4 | 0.0258 | 0.0034 | 58 | 2 |
| BSA_Buffer free | 0.0375 | 0.0047 | 74 | 2 | 0.0492 | 0.0029 | 79 | 1 |
Samples subjected to 240h of ssHDX were deconvoluted using the mass spectrometer (Fig.7). The spectra were then compared with the undeuterated BSA samples as well as the experimentally determined fully deuterated samples. For both spray drying and lyophilization processes, the formulations with potassium succinate buffer showed greater peak shifts and higher peak broadening than all other formulations. This suggests that the heterogeneity among the protein population was higher for the formulation with potassium succinate buffer.
Figure 7:

Deconvoluted mass spectra of the spray-dried and lyophilized formulations.
Physical Stability
Accelerated stability studies to measure loss in monomer content were conducted at 40°C over 90 days (Fig. 7). The formulation with potassium succinate buffer showed slightly higher monomer loss for both processes; however, there is no statistically significant difference among all spray-dried samples (p>0.05). For lyophilized samples, the formulation with potassium succinate buffer showed significantly higher monomer loss (p<0.001) than all other lyophilized formulations. No statistically significant difference was observed among the rest of the lyophilized formulations.
Molecular Miscibility and Microenvironmental Acidity from ssNMR
The molecular mixing of protein and sugar has been regarded as a critical factor for long-term stability of solid protein formulations. Besides, the microenvironmental acidity as controlled by the distribution of buffer components may also modulate the protein stability (30, 42, 43). In recent years, ssNMR has been increasingly recognized as an advanced technique to evaluate the miscibility and homogeneity between small-molecule drugs and excipients in solid dispersions (44–46), and between protein and excipients in solid protein formulations (25, 28, 47). In general, the ssNMR-based miscibility tests are carried out by measuring the heteronuclear-detected 1H (e.g., 13C-detected) relaxation time of different components in drug and protein formulations, including spin-lattice relaxation in the laboratory (T1) and rotating frame (T1ρ). If the T1 and/or T1ρ values of different components are statistically similar, the formulation is considered to have a good homogeneity between multiple components with a domain size from several to hundreds of nanometers (25, 38). For instance, recently our group has applied such spin diffusion ssNMR method to assess the homogeneity of BSA and various excipients such as mannitol and trehalose in the spray-dried protein samples (25). The BSA-trehalose formulation demonstrated an excellent homogeneity while a significant phase separation with a heterogeneous domain size at the 20–100 nm scale was observed in the BSA-mannitol formulation.
In the present study, the 13C-detected 1H relaxation method was utilized to evaluate the homogeneity of BSA formulations in order to examine the effect of buffer salts on protein stability. The mixing of protein, sugar, and buffer components has been evaluated. Fig. 9A presents the 1D 13C CPMAS spectra of pure BSA and lyophilized and spray-dried BSA formulations with three different buffer salts (i.e., phosphate, citrate, and succinate buffer). No significant alternation of chemical shifts and peak linewidths of BSA peaks was observed by the addition of trehalose and buffer salts. Moreover, no significant spectral difference was observed for BSA formulations produced by two different drying methods except formulations with succinate buffer. Fig. 9B presents the expanded regime of carbonyl peak of succinic acid for neat crystalline succinic acid and lyophilized and spray-dried BSA formulations. The carboxyl peak of succinic acid in the lyophilized formulation is much narrower than that in the spray-dried formulation and displays a distribution of multiple resonances. Meanwhile, the linewidth of the sharpest carboxyl peak of succinic acid in lyophilized BSA is roughly two-fold than that of the pure crystalline counterpart. An instinct hypothesis for these two observations is that the amorphous succinic acid was partially converted to a crystalline form in lyophilized BSA, which results in the peak sharpness for the carboxyl peak. However, we did not observe PXRD peaks of crystalline succinic acid at T0.
Figure 9:

1D 13C CP-MAS NMR spectra of pure lyophilized BSA and spray-dried and lyophilized BSA formulations with trehalose, buffers, and potassium counter-ion at T0: (A) full spectral comparison; and (B) expanded carboxyl peaks of succinic acid for spray-dried and lyophilized BSA formulations and crystalline succinic acid. Lyo: lyophilization; SD: spray drying; K: potassium; Tre: trehalose; Pho: phosphate buffer; Suc: succinate buffer; Cit: citrate buffer; Xtal: crystalline; FWHM: full width at half maximum.
To understand the state of succinic acid in lyophilized BSA formulation, we further measured the 13C-detected 1H T1 of neat crystalline succinic acid, and the results were presented in Table S2. The two peaks of crystalline succinic acid both exhibit 1H T1 values of >200 s. The drastic decrease of 1H T1 of succinic acid from >200 s for pure crystalline to ~2.9 s (Table S3) in lyophilized BSA formulations indicates the presence of the amorphous phase of succinic acid in lyophilized BSA formulations, although it does not exclude the possibility of presence of nano- or microcrystalline forms. The wide distribution of carboxyl resonances in lyophilized BSA formulations likely results from the chemical shift change, which may suggest a distribution of microenvironmental acidity.
To evaluate miscibility of the formulation, Table S3 lists the respective 13C-detected 1H T1 and T1ρ values for BSA, trehalose, and buffer salts. All formulations showed similar T1 for three components in the range of 2–3 s, indicating good miscibility on the scale of 20–100 nm (excluding formulation with phosphate buffer where the 1H T1 cannot be measured for phosphate due to the lack of 13C nucleus). Fig. 10 plots the T1ρ values for multiple components in all BSA formulations. For spray-dried formulations, the differences in T1ρ are statistically small. Moreover, a similar level of T1ρ was also observed in lyophilized BSA with citrate buffer. In contrast, a distinct T1ρ difference was seen for BSA/trehalose and succinic acid, where the T1ρ of succinic acid is almost two-fold and three-fold longer than BSA and trehalose, respectively. Such heterogeneity imparted by succinic acid can have a notable effect on protein physical stability. As the SEC results shown previously, the lyophilized BSA with potassium succinate buffer delivers the highest monomer loss, which can be ascribed to the poor miscibility between succinic acid and BSA/trehalose in the formulation. In addition, the similar physical stabilities of BSA in other formulations were also evidenced by the similar levels of T1ρ.
Figure 10:

13C-detected 1H T1ρ of BSA, trehalose, and buffer salt in lyophilized (A) and spray-dried (B) BSA formulations with potassium counter-ion at T0. Tre: trehalose; Pho: phosphate buffer; Suc: succinate buffer; Cit: citrate buffer; K: potassium.
Discussion
In this study, seven different formulations were dried using either lyophilization or spray drying to study the effect of buffer on the physical stability of protein solids. Our SEC data (Fig. 8) indicated that the choice of acids and counter-ions has a significant impact on the physical stability of the protein solid. In particular, the potassium succinate formulation has significantly poorer physical stability for lyophilization process. To understand the mechanism of such protein instability, we have performed several characterization studies. First, we excluded the impact from the moisture content because all formulations had similar moisture content levels.
Figure 8:

Physical stability measured by SEC for the spray-dried and lyophilized formulations upon storage at 40°C (n = 4, mean ± SD; error bars cannot be shown when smaller than the height of the symbol.)
Since the pH of the formulation may affect protein stability (16, 17), we compared the pH of the original prepared feed solutions with those reconstituted from the dried formulations (Table 2), with a purpose to investigate if pH change after drying processes contributes to the different physical stability behavior. All the formulations except the formulation with sodium citrate buffer showed no change in pH. It has been reported previously that temperature changes during the freezing step increased the pH of various buffers including sodium citrate buffer (48). While such a change in pH has been observed in our study as well for the sodium citrate formulation, it did not lead to the physical instability of the sodium citrate formulation. Further studies are warranted to understand the mechanism behind pH changes observed in sodium citrate buffer for both spray drying and lyophilization processes. In addition, the instability of the potassium succinate formulation was not attributed to pH change.
The potassium succinate formulation showed differences in the morphology (Fig. 1D and Fig. 2D) and surface area (Table 4) for both spray drying and lyophilization processes. The lyophilized formulation with potassium succinate buffer had a significantly higher surface area (p<0.0001). As for the spray-dried formulations, the morphology of the potassium succinate formulation and the buffer-free formulation was smoother and more spherical as compared to the rest of the formulations that had a raisin-like appearance (Fig. 1 D, G). For the spray-dried formulation with potassium succinate buffer, the particle sizes were significantly larger (p<0.001) than in other spray-dried formulations. In contrast to the lyophilization, the surface area of the potassium succinate formulation was significantly lower than other spray-dried formulations (p<0.05). This may be due to the larger particle sizes as well as the smoother morphology observed. Therefore, the impact of particle morphology on protein instability is not clear in this study.
Table 4:
Surface area of spray-dried and lyophilized samples (m2/g) (n=6).
| Formulation | Spray Drying | Lyophilization | ||
|---|---|---|---|---|
| Mean | SD | Mean | SD | |
| BSA_Pho_Na | 4.93 | 0.48 | 0.68 | 0.07 |
| BSA_Pho_K | 4.81 | 0.03 | 0.74 | 0.09 |
| BSA_Suc_Na | 5.16 | 0.38 | 0.71 | 0.05 |
| BSA_Suc_K | 3.08 | 0.08 | 4.67 | 0.12 |
| BSA_Cit_Na | 5.14 | 0.07 | 0.62 | 0.11 |
| BSA_Cit_K | 5.21 | 0.13 | 0.72 | 0.08 |
| BSA_Buffer free | 5.14 | 0.22 | 0.64 | 0.13 |
We applied ssFTIR to investigate potential changes in the protein structure. The wavenumber of 1656 cm−1 (Fig. 5) corresponds to the dominant α-helix structure (32)of BSA as observed in the Amide I region. Our results demonstrated that the peak intensities at 1656 cm−1 varied between the formulations, suggesting a change in the hydrogen-bonding interactions of the protein within the formulations. Lyophilized buffer-free formulations showed slight structural perturbations (Fig. 5) i.e., the formation of random coils at 1630 cm−1. While differences in ssFTIR spectra have been observed, the spectra could not be correlated with the storage instability (Fig. S1-A).
Tg has been widely used to predict the storage stability of the protein solids (23). Usually, a lower Tg suggests higher molecular mobility of the protein in the solid state, which may increase the aggregation tendency of the protein (49). In this study, the Tg values of the spray-dried and lyophilized formulations were similar for a given formulation except for the formulation with potassium succinate buffer. It is interesting that Tg showed a good correlation with stability for the lyophilized formulations (Fig. S1-B), but not for the spray-dried formulations (Fig. S1-B).
ssHDX-MS has been used recently to detect the presence of population heterogeneity and change in the intermolecular and intramolecular interactions of the protein in the solid matrix (35, 36, 50). The deuterium uptake kinetics (Fig. 6) data showed that the formulation with potassium succinate buffer had higher deuterium uptake for both processes. Moreover, the deconvoluted mass spectra (Fig. 7) indicated a higher peak broadening and greater peak shift for this formulation. HDX results explained the poor stability behavior of potassium succinate formulation from the aspect of intermolecular and intramolecular interactions of the protein in the solid matrix.
We further explored the source of instability for the potassium succinate formulation. For example, high-level miscibility between multiple components in protein formulations is critical for ensuring protein’s long-term stability in the solid state (1, 51, 52). A large number of studies have reported that phase separation between protein and protective sugars, bulking agents, or buffer salts can result in higher rates of protein unfolding, aggregation, or protein structural damage (26–28). In fact, phase separation can readily occur during the lyophilization and spray drying processes in response to the stresses such as crystallization, pH changes, dehydration, ionic strength change, interfacial stress (ice-liquid), and ice crystal formation (24, 47, 51, 53–55). Given the negative effect of phase separation on protein stability, miscibility is an important factor to consider regarding interpreting the stability of lyophilized and spray-dried protein formulations. The PXRD results (Fig. 3) showed the potassium phosphate and potassium succinate formulations crystallized during the storage, while all other formulations remained amorphous. Crystallization of excipients generally leads to phase separation of the excipients from the proteins in the solid matrix resulting in a direct negative impact on the stability of the proteins (56, 57). Interestingly, the negative impact of buffer crystallization on the physical stability of the protein solids is much less for the spray-dried formulation as compared to the lyophilized formulation. Sundaramurthi et al. has examined the mechanism of crystallization of succinate buffer during the freeze drying process (23). They demonstrated that when succinate buffer prepared at pH > pKa2, there is a decrease in the freeze-concentrate pH attributable to the sequential crystallization of the basic (disodium succinate) followed by an increase in pH due to the crystallization of the acidic (monosodium succinate and succinic acid) buffer components. It was indicated that pH and the buffer concentration of the pre-lyophilized solution had a significant impact on the content of crystalline salts in the final lyophile. However, during the spray drying process, droplets are dried very rapidly without prolonged freezing and sublimation steps, which may result in a less negative effect on the physical stability of the solid protein formulation.
In the present study, ssNMR has been utilized as a high-resolution method to quantify the molecular miscibility in these multi-component BSA formulations. All formulations exhibit similar amplitude of 13C-detected 1H T1 (Table S3) Therefore, these ternary systems were considered homogenous on a length scale of 20–100 nm. Interestingly, the 13C-detected 1H T1ρ values are significantly different for trehalose/BSA and succinic acid in lyophilized formulations (Fig. 10). Particularly, succinic acid exhibits a distinct T1ρ value from trehalose and BSA. This provides strong evidence of heterogeneity at a domain size of less than tens of nanometers. Moreover, relatively narrow, and multiple carboxyl peaks of succinic acid in this sample have been observed (Fig. 9B). Such a distribution of chemical shifts suggests the different microenvironmental acidity. For example, a change of acidity in frozen solution or lyocake of protein formulations has been shown to negatively impact the stability (30, 42, 43). 13C and 15N chemical shifts of the buffer component, histidine, have been utilized as a molecular probe of the microenvironmental pH. Indeed, this distribution of solid-state acidity from the observed immiscibility well correlates with the physical stability of BSA formulations, where the highest monomer loss was detected by SEC in lyophilized BSA with succinate buffer (Fig. 8). These results have further demonstrated ssNMR as a method to probe protein-excipient miscibility and microenvironmental acidity (25, 30). Increasing the concentration of trehalose or use of additional protective excipients such as sucrose may reduce protein-excipient and excipient-excipient immiscibility, and therefore alleviate or circumvent the instability issues caused by succinate buffer. Further studies are warranted to optimize the formulations further and examine the impact of various buffers on other proteins with different molecular weights and structures.
Conclusions
This study highlights that various buffer salts may have different impacts on the physical stability of the solid protein formulations, as exampled by significant higher levels of protein aggregation in the lyophilized succinate potassium formulation. Another interesting finding is that succinate potassium buffer salt has a less impact on protein stability for the spray-dried formulations than the lyophilized solids. While the effect of different counter-ions was not observed for the protein formulations with citrate and phosphate buffers, potassium succinate buffer showed poorer physical stability of proteins after storage under accelerated stability conditions as compared to sodium ions. ssHDX-MS data suggested that intermolecular and intramolecular interactions of the protein in the solid matrix may contribute to the physical instability of the potassium succinate formulation. ssNMR data demonstrated that the phase separation of the buffer components, which was not measurable by mDSC and PXRD, played a significant role in the instability of the lyophilized potassium succinate formulation.
Supplementary Material
Acknowledgment
Qi (Tony) Zhou and Tarun Tejasvi Mutukuri were supported by the National Institute of Allergy and Infectious Diseases of the National Institute of Health under Award Number R01AI146160. The content is solely the responsibility of the authors and does not necessarily represent the official views of the National Institute of Health. Yong Du appreciates MRL postdoctoral research program. The authors are grateful for the helpful discussion and MS access from Dr. Elizabeth M. Topp.
Footnotes
Conflict of interest
The authors have no conflict of interest in this work.
References
- 1.Cicerone MT, Pikal MJ, Qian KK. Stabilization of proteins in solid form. Adv Drug Deliv Rev. 2015;93:14–24. [DOI] [PMC free article] [PubMed] [Google Scholar]
- 2.Carpenter JF, Chang BS, Garzon-Rodriguez W, Randolph TW. Rational design of stable lyophilized protein formulations: theory and practice. Pharm Biotechnol. 2002;13:109–133. [DOI] [PubMed] [Google Scholar]
- 3.Langford A, Bhatnagar B, Walters R, Tchessalov S, Ohtake S. Drying technologies for biopharmaceutical applications: Recent developments and future direction. Drying Technology. 2018;36(6):677–684. [Google Scholar]
- 4.Chen Y, Tejasvi Mutukuri T, Wilson NE, Zhou Q. Pharmaceutical protein solids: drying technology, solid-state characterization and stability. Adv Drug Deliv Rev. 2021;172:211–233. [DOI] [PMC free article] [PubMed] [Google Scholar]
- 5.Ameri M, Maa Y-F. Spray drying of biopharmaceuticals: stability and process considerations. Drying technology. 2006;24(6):763–768. [Google Scholar]
- 6.Cun D, Zhang C, Bera H, Yang M. Particle engineering principles and technologies for pharmaceutical biologics. Advanced Drug Delivery Reviews. 2021;174:140–167. [DOI] [PubMed] [Google Scholar]
- 7.Lee G Spray-drying of proteins. Pharm Biotechnol. 2002;13:135–158. [DOI] [PubMed] [Google Scholar]
- 8.White S, Bennett DB, Cheu S, Conley PW, Guzek DB, Gray S, Howard J, Malcolmson R, Parker JM, Roberts P. EXUBERA®: pharmaceutical development of a novel product for pulmonary delivery of insulin. Diabetes technology & therapeutics. 2005;7(6):896–906. [DOI] [PubMed] [Google Scholar]
- 9.Ferrati S, Wu T, Fuentes O, Brunaugh AD, Kanapuram SR, Smyth HDC. Influence of Formulation Factors on the Aerosol Performance and Stability of Lysozyme Powders: a Systematic Approach. AAPS PharmSciTech. 2018;19(7):2755–2766. [DOI] [PubMed] [Google Scholar]
- 10.Wilson NE, Topp EM, Zhou QT. Effects of drying method and excipient on structure and stability of protein solids using solid-state hydrogen/deuterium exchange mass spectrometry (ssHDX-MS). Int J Pharm. 2019;567:118470. [DOI] [PMC free article] [PubMed] [Google Scholar]
- 11.Wilson NE, Mutukuri TT, Zemlyanov DY, Taylor LS, Topp EM, Zhou QT. Surface Composition and Formulation Heterogeneity of Protein Solids Produced by Spray Drying. Pharm Res-Dordr. 2020;37(1):14. [DOI] [PMC free article] [PubMed] [Google Scholar]
- 12.Wilson NE, Mutukuri TT, Zemlyanov DY, Topp EM, Zhou QT Effects of Surfactant Inclusion in Heterogeneity of Spray-dried Protein Formulations Determined by X-ray Photoelectron Spectroscopy and Solid-state Hydrogen/Deuterium Exchange with Mass Spectrometry. In.; 2020.
- 13.Instability Wang W., stabilization, and formulation of liquid protein pharmaceuticals. Int J Pharm. 1999;185(2):129–188. [DOI] [PubMed] [Google Scholar]
- 14.Cleland JL, Powell MF, Shire SJ. The Development of Stable Protein Formulations - a Close Look at Protein Aggregation, Deamidation, and Oxidation. Crit Rev Ther Drug. 1993;10(4):307–377. [PubMed] [Google Scholar]
- 15.Manning MC, Chou DK, Murphy BM, Payne RW, Katayama DS. Stability of protein pharmaceuticals: an update. Pharm Res. 2010;27(4):544–575. [DOI] [PubMed] [Google Scholar]
- 16.Trissel LA. Handbook on injectable drugs. In. Handbook on Injectable Drugs; 2007. p. 1720–1720. [Google Scholar]
- 17.Park J, Nagapudi K, Vergara C, Ramachander R, Laurence JS, Krishnan S. Effect of pH and excipients on structure, dynamics, and long-term stability of a model IgG1 monoclonal antibody upon freeze-drying. Pharm Res. 2013;30(4):968–984. [DOI] [PubMed] [Google Scholar]
- 18.Ugwu SO, Apte SP. The effect of buffers on protein conformational stability. Pharmaceutical Technology. 2004;28(3):86–109. [Google Scholar]
- 19.Zbacnik TJ, Holcomb RE, Katayama DS, Murphy BM, Payne RW, Coccaro RC, Evans GJ, Matsuura JE, Henry CS, Manning MC. Role of Buffers in Protein Formulations. J Pharm Sci. 2017;106(3):713–733. [DOI] [PubMed] [Google Scholar]
- 20.Ohtake S, Schebor C, Palecek SP, de Pablo JJ. Effect of pH, counter ion, and phosphate concentration on the glass transition temperature of freeze-dried sugar-phosphate mixtures. Pharm Res. 2004;21(9):1615–1621. [DOI] [PubMed] [Google Scholar]
- 21.Gomez G, Pikal MJ, Rodriguez-Hornedo N. Effect of initial buffer composition on pH changes during far-from-equilibrium freezing of sodium phosphate buffer solutions. Pharm Res. 2001;18(1):90–97. [DOI] [PubMed] [Google Scholar]
- 22.Sundaramurthi P, Suryanarayanan R. Predicting the Crystallization Propensity of Carboxylic Acid Buffers in Frozen Systems-Relevance to Freeze-Drying. J Pharm Sci-Us. 2011;100(4):1288–1293. [DOI] [PubMed] [Google Scholar]
- 23.Sundaramurthi P, Shalaev E, Suryanarayanan R. Calorimetric and diffractometric evidence for the sequential crystallization of buffer components and the consequential pH swing in frozen solutions. J Phys Chem B. 2010;114(14):4915–4923. [DOI] [PubMed] [Google Scholar]
- 24.Sundaramurthi P, Shalaev E, Suryanarayanan R. “pH Swing” in Frozen Solutions-Consequence of Sequential Crystallization of Buffer Components. J Phys Chem Lett. 2010;1(1):265–268. [DOI] [PubMed] [Google Scholar]
- 25.Chen Y, Ling J, Li M, Su Y, Arte KS, Mutukuri TT, Taylor LS, Munson EJ, Topp EM, Zhou QT. Understanding the Impact of Protein–Excipient Interactions on Physical Stability of Spray-Dried Protein Solids. Mol Pharm. 2021;18(7):2657–2668. [DOI] [PMC free article] [PubMed] [Google Scholar]
- 26.Sun WQ, Davidson P. Protein inactivation in amorphous sucrose and trehalose matrices: effects of phase separation and crystallization. Biochimica et Biophysica Acta (BBA) - General Subjects. 1998;1425(1):235–244. [DOI] [PubMed] [Google Scholar]
- 27.Heller MC, Carpenter JF, Randolph TW. Protein formulation and lyophilization cycle design: Prevention of damage due to freeze-concentration induced phase separation. Biotechnology and Bioengineering. 1999;63(2):166–174. [DOI] [PubMed] [Google Scholar]
- 28.Mensink MA, Nethercott MJ, Hinrichs WLJ, van der Voort Maarschalk K, Frijlink HW, Munson EJ, Pikal MJ. Influence of Miscibility of Protein-Sugar Lyophilizates on Their Storage Stability. Aaps j. 2016;18(5):1225–1232. [DOI] [PubMed] [Google Scholar]
- 29.Nguyen KT, Frijlink HW, Hinrichs WLJJoPS. Inhomogeneous Distribution of Components in Solid Protein Pharmaceuticals: Origins, Consequences, Analysis, and Resolutions. 2020;109(1):134–153. [DOI] [PubMed] [Google Scholar]
- 30.Li M, Koranne S, Fang R, Lu X, Williams DM, Munson EJ, Bhambhani A, Su Y. Probing Microenvironmental Acidity in Lyophilized Protein and Vaccine Formulations Using Solid-state NMR Spectroscopy. J Pharm Sci-Us. 2021;110(3):1292–1301. [DOI] [PubMed] [Google Scholar]
- 31.Krausková Ľ, Procházková J, Klašková M, Filipová L, Chaloupková R, Malý S, Damborský J, Heger DJIjop. Suppression of protein inactivation during freezing by minimizing pH changes using ionic cryoprotectants. 2016;509(1–2):41–49. [DOI] [PubMed] [Google Scholar]
- 32.Mutukuri TT, Wilson NE, Taylor LS, Topp EM, Zhou QT. Effects of drying method and excipient on the structure and physical stability of protein solids: Freeze drying vs. spray freeze drying. International Journal of Pharmaceutics. 2021;594:120169. [DOI] [PMC free article] [PubMed] [Google Scholar]
- 33.Brunauer S, Emmett PH, Teller E. Adsorption of Gases in Multimolecular Layers. Journal of the American Chemical Society. 1938;60(2):309–319. [Google Scholar]
- 34.Iyer LK, Sacha GA, Moorthy BS, Nail SL, Topp EM. Process and Formulation Effects on Protein Structure in Lyophilized Solids Using Mass Spectrometric Methods. J Pharm Sci-Us. 2016;105(5):1684–1692. [DOI] [PMC free article] [PubMed] [Google Scholar]
- 35.Moorthy BS, Schultz SG, Kim SG, Topp EM. Predicting Protein Aggregation during Storage in Lyophilized Solids Using Solid State Amide Hydrogen/Deuterium Exchange with Mass Spectrometric Analysis (ssHDX-MS). Mol Pharm. 2014;11(6):1869–1879. [DOI] [PMC free article] [PubMed] [Google Scholar]
- 36.Moorthy BS, Zarraga IE, Kumar L, Walters BT, Goldbach P, Topp EM, Allmendinger A. Solid-State Hydrogen–Deuterium Exchange Mass Spectrometry: Correlation of Deuterium Uptake and Long-Term Stability of Lyophilized Monoclonal Antibody Formulations. Mol Pharm. 2018;15(1):1–11. [DOI] [PubMed] [Google Scholar]
- 37.Keppel TR, Jacques ME, Young RW, Ratzlaff KL, Weis DD. An efficient and inexpensive refrigerated LC system for H/D exchange mass spectrometry. Journal of the American Society for Mass Spectrometry. 2011;22(8):1472–1476. [DOI] [PubMed] [Google Scholar]
- 38.Li M, Xu W, Su Y. Solid-state NMR spectroscopy in pharmaceutical sciences. TrAC Trends in Analytical Chemistry. 2021;135:116152. [Google Scholar]
- 39.Breen ED, Curley JG, Overcashier DE, Hsu CC, Shire SJ. Effect of Moisture on the Stability of a Lyophilized Humanized Monoclonal Antibody Formulation. Pharm Res-Dordr. 2001;18(9):1345–1353. [DOI] [PubMed] [Google Scholar]
- 40.Kumosinski TF, Farrell HM. Determination of the global secondary structure of proteins by Fourier transform infrared (FTIR) spectroscopy. Trends in Food Science & Technology. 1993;4(6):169–175. [Google Scholar]
- 41.Fu F-N, Deoliveira DB, Trumble WR, Sarkar HK, Singh BR. Secondary Structure Estimation of Proteins Using the Amide III Region of Fourier Transform Infrared Spectroscopy: Application to Analyze Calcium-Binding-Induced Structural Changes in Calsequestrin. Applied Spectroscopy. 1994;48(11):1432–1441. [Google Scholar]
- 42.Thorat AA, Munjal B, Geders TW, Suryanarayanan R. Freezing-induced protein aggregation - Role of pH shift and potential mitigation strategies. Journal of Controlled Release. 2020;323:591–599. [DOI] [PubMed] [Google Scholar]
- 43.Roessl U, Humi S, Leitgeb S, Nidetzky B. Design of experiments reveals critical parameters for pilot-scale freeze-and-thaw processing of L-lactic dehydrogenase. Biotechnol J. 2015;10(9):1390–1399. [DOI] [PubMed] [Google Scholar]
- 44.Li N, Cape JL, Mankani BR, Zemlyanov DY, Shepard KB, Morgen MM, Taylor LS. Water-Induced Phase Separation of Spray-Dried Amorphous Solid Dispersions. Mol Pharm. 2020;17(10):4004–4017. [DOI] [PMC free article] [PubMed] [Google Scholar]
- 45.Duan P, Lamm MS, Yang F, Xu W, Skomski D, Su Y, Schmidt-Rohr K. Quantifying Molecular Mixing and Heterogeneity in Pharmaceutical Dispersions at Sub-100 nm Resolution by Spin Diffusion NMR. Mol Pharm. 2020;17(9):3567–3580. [DOI] [PubMed] [Google Scholar]
- 46.Sarpal K, Munson EJ. Amorphous Solid Dispersions of Felodipine and Nifedipine with Soluplus®: Drug-Polymer Miscibility and Intermolecular Interactions. J Pharm Sci-Us. 2021;110(4):1457–1469. [DOI] [PubMed] [Google Scholar]
- 47.Suihko EJ, Forbes RT, Apperley DC. A solid-state NMR study of molecular mobility and phase separation in co-spray-dried protein-sugar particles. Eur J Pharm Sci. 2005;25(1):105–112. [DOI] [PubMed] [Google Scholar]
- 48.Kolhe P, Amend E, K. Singh S. Impact of freezing on pH of buffered solutions and consequences for monoclonal antibody aggregation. Biotechnology Progress. 2010;26(3):727–733. [DOI] [PubMed] [Google Scholar]
- 49.Duddu SP, Dal Monte PR. Effect of Glass Transition Temperature on the Stability of Lyophilized Formulations Containing a Chimeric Therapeutic Monoclonal Antibody. Pharm Res-Dordr. 1997;14(5):591–595. [DOI] [PubMed] [Google Scholar]
- 50.Moussa EM, Wilson NE, Zhou QT, Singh SK, Nema S, Topp EM. Effects of Drying Process on an IgG1 Monoclonal Antibody Using Solid-State Hydrogen Deuterium Exchange with Mass Spectrometric Analysis (ssHDX-MS). Pharm Res. 2018;35(1):12. [DOI] [PubMed] [Google Scholar]
- 51.Randolph TW. Phase Separation of Excipients during Lyophilization: Effects on Protein Stability. J Pharm Sci-Us. 1997;86(11):1198–1203. [DOI] [PubMed] [Google Scholar]
- 52.Mensink MA, Frijlink HW, van der Voort Maarschalk K, Hinrichs WL. How sugars protect proteins in the solid state and during drying (review): Mechanisms of stabilization in relation to stress conditions. Eur J Pharm Biopharm. 2017;114:288–295. [DOI] [PubMed] [Google Scholar]
- 53.Dong J, Hubel A, Bischof JC, Aksan A. Freezing-induced phase separation and spatial microheterogeneity in protein solutions. J Phys Chem B. 2009;113(30):10081–10087. [DOI] [PubMed] [Google Scholar]
- 54.Piedmonte DM, Summers C, McAuley A, Karamujic L, Ratnaswamy G. Sorbitol crystallization can lead to protein aggregation in frozen protein formulations. Pharm Res. 2007;24(1):136–146. [DOI] [PubMed] [Google Scholar]
- 55.Butreddy A, Janga KY, Ajjarapu S, Sarabu S, Dudhipala N. Instability of therapeutic proteins - An overview of stresses, stabilization mechanisms and analytical techniques involved in lyophilized proteins. Int J Biol Macromol. 2021;167:309–325. [DOI] [PubMed] [Google Scholar]
- 56.Izutsu K-i, Yoshioka S, Terao T. Decreased Protein-Stabilizing Effects of Cryoprotectants Due to Crystallization. Pharm Res-Dordr. 1993;10(8):1232–1237. [DOI] [PubMed] [Google Scholar]
- 57.Costantino HR, Andya JD, Nguyen P-A, Dasovich N, Sweeney TD, Shire SJ, Hsu CC, Maa Y-F. Effect of mannitol crystallization on the stability and aerosol performance of a spray-dried pharmaceutical protein, recombinant humanized anti-IgE monoclonal antibody. J Pharm Sci-Us. 1998;87(11):1406–1411. [DOI] [PubMed] [Google Scholar]
Associated Data
This section collects any data citations, data availability statements, or supplementary materials included in this article.