Abstract
Inherited non-coding genetic variants confer significant disease susceptibility to childhood acute lymphoblastic leukemia (ALL), but the molecular processes linking germline variants with somatic lesions in this cancer are poorly understood. Through targeted sequencing in 5,008 patients, we identified a key regulatory germline variant in GATA3 associated with Philadelphia chromosome-like ALL (Ph-like ALL). Using CRISPR-Cas9 editing and Ph-like ALL patient samples, we showed that this variant activated a strong enhancer that upregulated GATA3 transcription. This, in turn, reshaped the global chromatin accessibility and 3D genome organization, including regions proximal to ALL oncogene CRLF2. Finally, we showed that GATA3 directly regulated CRLF2 and potentiated the JAK-STAT oncogenic effects during leukemogenesis. Taken together, we provide evidence for a distinct mechanism by which a germline non-coding variant contributes to oncogene activation, epigenetic regulation and 3D genome reprogramming.
Editor summary:
A germline variant associated with acute lymphoblastic leukemia activates an enhancer element resulting in increased GATA3 expression, altered chromatin accessibility, and changes in 3D genome organisation.
Introduction
Acute lymphoblastic leukemia (ALL) is the most common cancer in children and there is growing evidence of inherited susceptibility to this hematological malignancy1–3. In particular, genome-wide association studies (GWAS) have identified at least 9 genomic loci (i.e., CDKN2A/2B, IKZF1, ARID5B, CEBPE, PIP4K2A-BMI1, GATA3, TP63, LHPP, and ELK3) with common variants that influence ALL risk4–9. These variants cumulatively confer a substantial increase of ALL risk9, and explain a large proportion of the estimated heritability of this leukemia10. Interestingly, some ALL germline risk variants also co-segregate with specific acquired genomic abnormalities in leukemia5,7,11, suggesting intricate interactions between somatic and germline mutations during leukemogenesis. In particular, we have previously reported germline intronic variants in the GATA3 gene associated with the risk of developing Philadelphia chromosome (Ph)-like ALL7, a subtype characterized by a leukemia gene expression profile resembling that of Ph-positive ALL with BCR-ABL1 fusion12,13. Each copy of the GATA3 risk allele increases the risk of Ph-like ALL by 3.25-fold7. Because Ph-like ALL is associated with distinctive genomic lesions in the cytokine signaling pathway genes (e.g., 50% of cases harbor CRLF2-rearrangements)12, it raises the question whether germline genetic variation in GATA3 is directly or indirectly involved in the deregulation of this pathway in ALL. So far, the exact variant that determines GWAS signaling at the GATA3 locus remains unknown and the exact molecular process by which the variant(s) contribute to Ph-like ALL pathogenesis is also unclear.
Even though GWAS have identified a plethora of variants associated with diverse human traits and diseases with varying degree of effects14, there is still an extreme paucity of examples that clearly demonstrate the molecular mechanisms linking risk alleles to disease pathogenesis. The main challenge is that the majority (>90%) of the disease or trait-associated variants are located in non-coding (intronic and/or intergenic) regions of the genome whose function remains largely uncharacterized. A recent work systematically analyzed ENCODE15 and Epigenome Roadmap16 data and showed that the majority of the non-coding variants are located inside regulatory elements (e.g., promoter, enhancer, and silencer)17, raising the possibility that genetic variants at these sites may play a regulatory role and modulate local and/or distal gene transcription. Another challenge in dissecting the regulatory roles of the non-coding elements is how to identify their target genes, as it has been shown that enhancers can function either upstream or downstream of their target genes, from as far as 1 million base pairs away through chromatin looping18. Recent high-throughput methods based on chromatin conformation capture such as Hi-C presented an unprecedented opportunity to study the effects of the non-coding elements on higher-order chromatin structure in a genome-wide fashion19,20.
In this work, we sought to systematically identify GATA3 variants in Ph-like ALL by targeted sequencing in 5,008 ALL patients and functionally investigate the mechanism by which the causal variant affects chromatin 3-dimensional structure, influence cell signaling, and contribute to leukemogenesis.
Results
Identification of regulatory GATA3 variants in Ph-like ALL
To comprehensively identify ALL risk variants at the GATA3 locus, we performed targeted sequencing of a ~27 Kb genomic region at 10q14, encompassing exons, introns, and upstream/downstream flanking regions of GATA3, in 5,008 children with ALL (including 985 patients with Ph-like ALL status ascertained, Supplementary Table 1, Extended Data fig. 1a–b). A total of 1,088 variants were identified, of which 127 variants had a minor allele frequency >1% and were included in subsequent analyses (Extended Data fig. 1a–b). Comparing the frequency of each variant in Ph-like ALL (n = 141) vs. non-Ph-like ALL (n = 844), we identified three variants that were significantly associated with susceptibility to Ph-like ALL after correcting for multiple tests (P<1×10⁻⁵), all of which are non-coding. Variant rs3824662 in intron 3 showed the strongest association (p-value = 1.2×10⁻⁸, Fig. 1a), and multivariate analysis conditioning on this SNP revealed no independent signals (Extended Data fig. 1c). Comparing across species, we also noted that the reference C allele is ancestral to the leukemia risk allele A (Extended Data fig. 1d). Examining the chromatin state annotations of this genomic region across 42 cell and tissue types from the Roadmap Epigenomics Project21, we observed that rs3824662 is aligned with a putative enhancer in the hematopoietic tissues, including CD8+ and CD4+ T cells (i.e., enrichment of H3K27ac and H3K4me1 marks with an under-representation of H3K27me3 mark, Fig. 1b, Extended Data fig. 2a–b). Taken together, these results pointed to rs3824662 as the likely functional and causal variant within an enhancer element that drives the association with Ph-like ALL at the GATA3 locus.
Figure. 1. rs3824662 is associated with Ph-like ALL susceptibility and the risk allele (A) is associated with enhancer activity and open chromatin status.
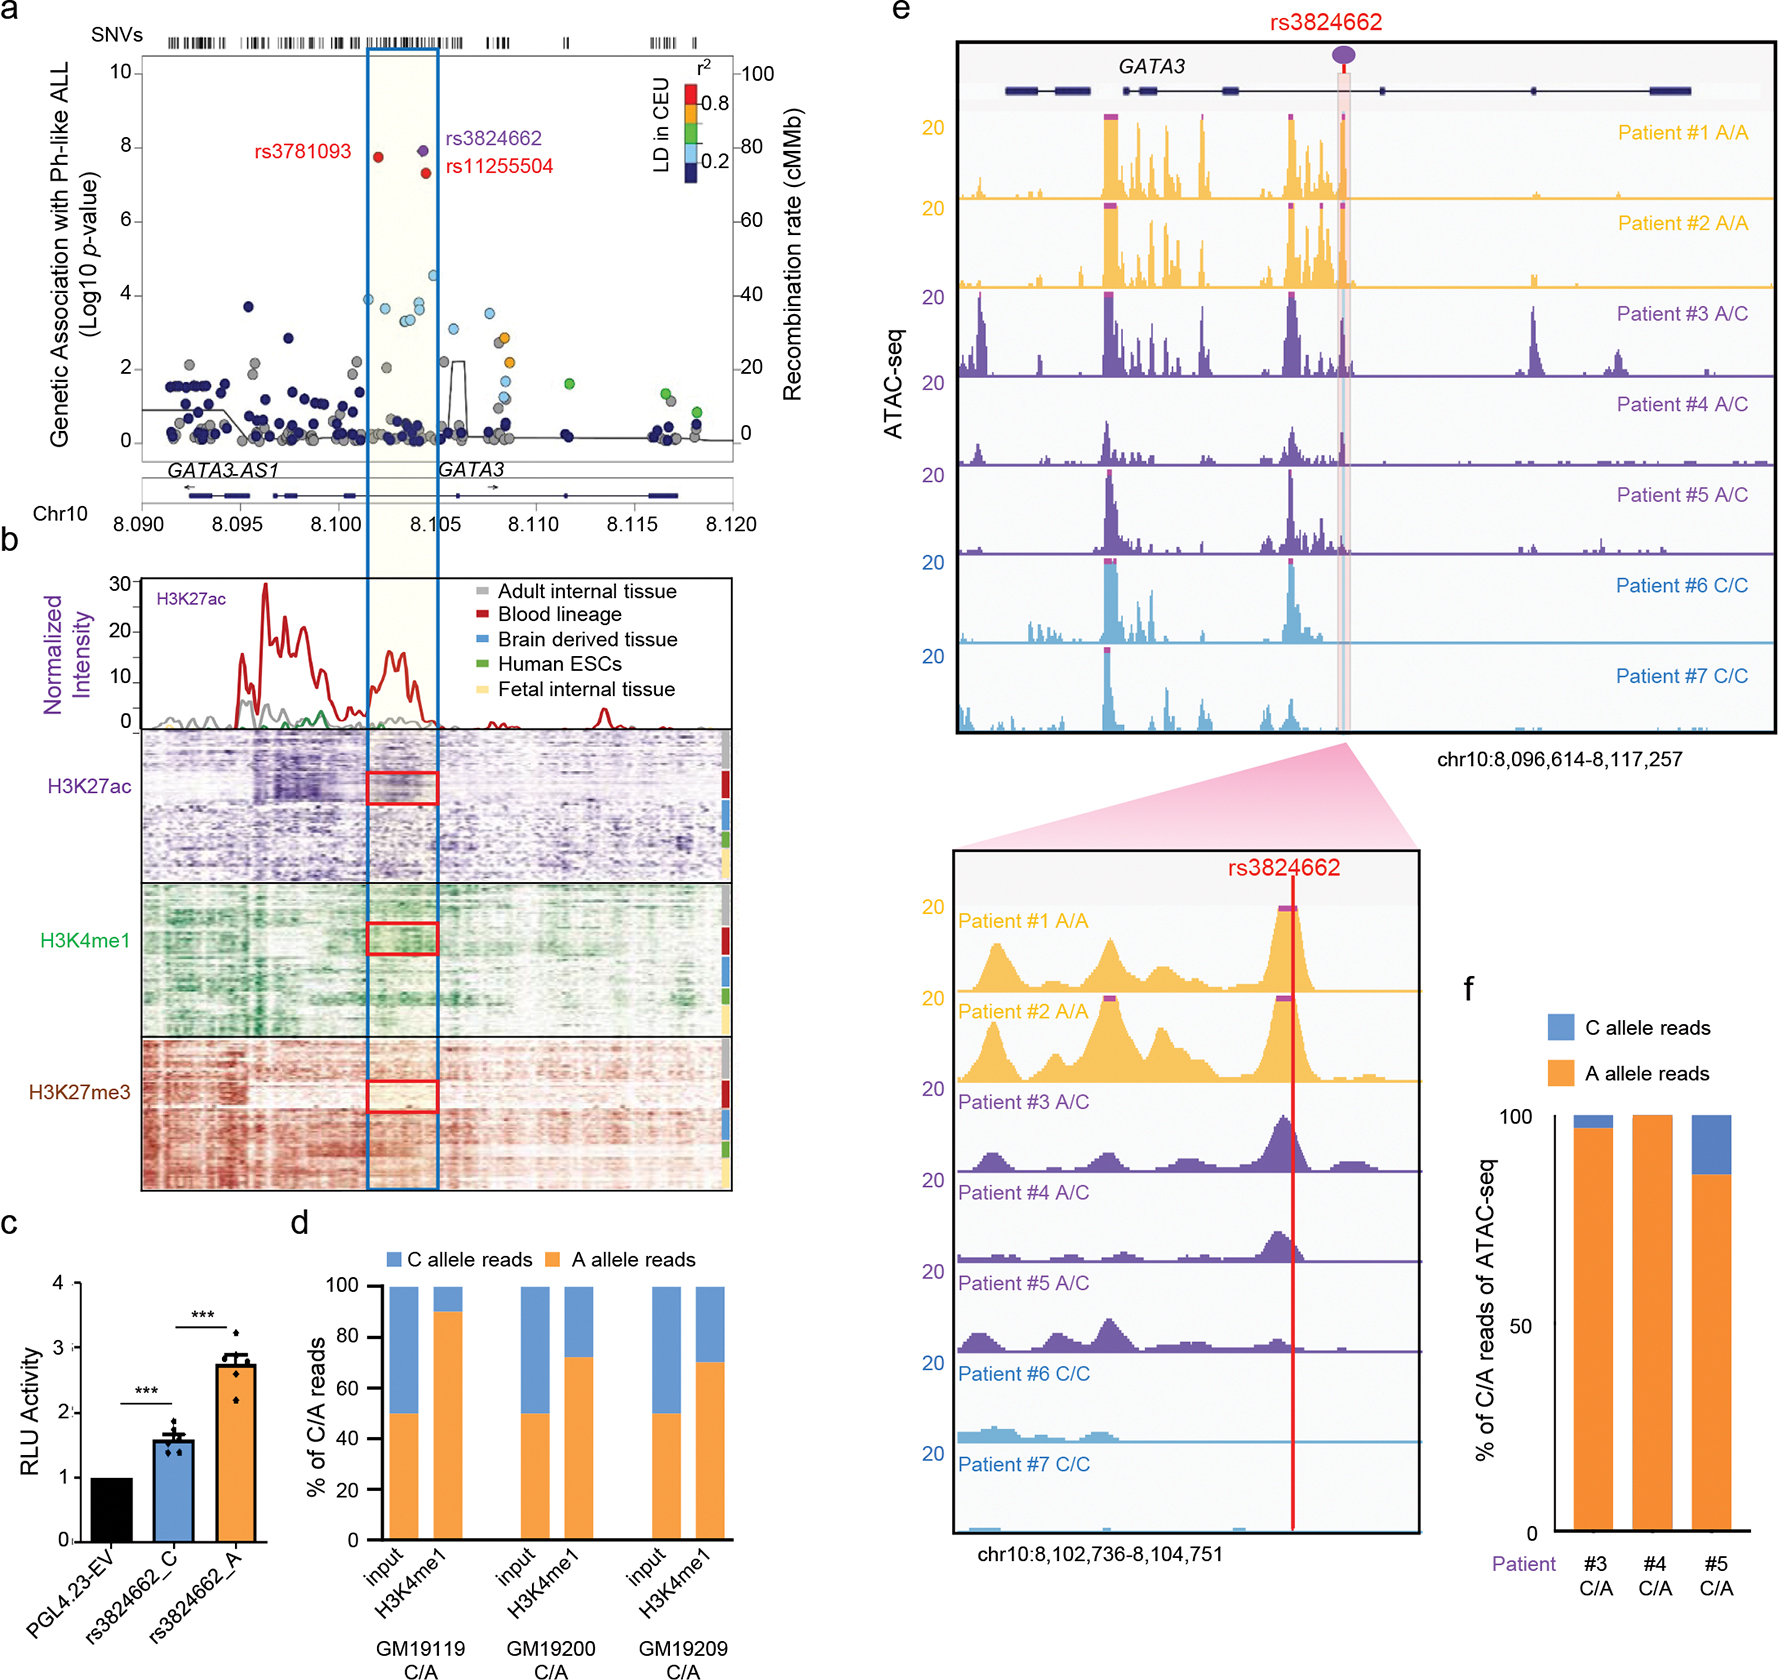
a, Ph-like ALL risk variant discovery at the GATA3 locus by targeted sequencing. The purple dot indicates the top variant, and the blue box represents the 2.7 kb flanking region. P values were estimated using logistic regression. Actual frequency: rs3824662: Ph-like 105/141 vs Non-Ph-like 383/844, adjusted P value: 1.21E-08; rs3781093: Ph-like 100/141 vs Non-Ph-like 363/844, adjusted P value: 1.821E-08; rs11255504: Ph-like 99/141 vs Non-Ph-like 378/844, adjusted P value: 4.953E-08. b, Chromatin state annotations from the Roadmap Epigenomics Project. H3K4me1, H3K27ac, and H3K27me3 marks are plotted across 42 cell and tissue types for the GATA3 locus, with the red boxes indicating the hematopoietic cell-specific enhancer element. The upper panel shows the H3K27ac signals (averaged by different tissue-types and plotted in 100bp bins). c, Reporter assay comparing activity of enhancer element with A allele or C allele at rs3824662 in B lymphoblastoid cell line GM12878. T bars indicate standard deviations (n = 6). Two-sided unpaired T test, rs3824662_C vs. rs3824662_A p-value = 9.389e-05; pGL4.23-EV vs. rs3824662_C p-value = 0.0007301. d, Allelic analysis of H3K4me1 ChIP-seq data in three lymphoblastoid cell lines with heterozygous genotype at rs3824662 (GM12119, GM19200, and GM19219). Orange and blue bars indicate the percentage of ChIP-seq reads from the A or C allele, respectively. e, Open chromatin status at rs3824662 in seven ALL PDX samples of different genotypes, as determined using ATAC-seq. The bottom panel represents a 2.8 kb region flanking rs3824662. f, Allelic analysis of ATAC-seq data in three Ph-like ALL samples with the heterozygous genotype at rs3824662. Orange and blue bars indicate the percentage of ATAC-seq reads from the A vs C allele. For bar plots, data are presented as mean +/− SEM. *, ** and, *** represent p-value<0.01, p-value <0.001, and p-value<0.0001, respectively.
To validate the enhancer function of this regulatory DNA element and investigate how its activity is influenced by rs3824662 genotype, we first tested the 1,120-bp fragment surrounding rs3824662 using a reporter gene assay in lymphoblastoid cells GM12878. The wildtype fragment (with the C allele) showed a modest enhancer effect, while the same fragment with the risk A allele robustly activated reporter gene transcription with three-fold increase over the vector control (Fig. 1c, and similar results in other cell lines shown in Extended Data fig. 2c), suggesting that the A allele is a gain-of-function variant. Similarly, in lymphoblastoid cell lines with the heterozygous genotype at rs3824662 (i.e., GM19119, GM19200, GM1920922), we also observed a significant allele-biased histone modification, linking the A allele with an over-representation of the enhancer-associated H3K4me1 chromatin mark (Fig. 1d). We then performed ATAC-Seq to profile open chromatin regions in seven primary leukemia samples from patient-derived xenografts of ALL with different rs3824662 genotypes (n = 2, 3, and 2 for cases with A/A, A/C, and C/C genotypes, respectively, Extended Data table 2). We observed that samples with the A/A genotype showed higher levels of open chromatin signals than those with A/C or C/C genotypes (Fig. 1e). Furthermore, in three patients with heterozygous genotypes at rs3824662, open chromatin signals at this locus exhibited clear allelic imbalance with the A allele preferentially linked to more chromatin accessibility (Fig. 1f). Similarly, in a panel of B-ALL cell lines of diverse molecular subtypes, we observed that samples with the A/A genotype showed higher levels of open chromatin signals than those with the C/C genotype (Extended Data fig. 2d). In fact, the strongest ATAC-seq signals at this locus were observed in two Ph-like ALL cell lines (MHH-CALL4 and MUTZ5), both of which have the A/A genotype at rs3824662, again suggesting that the A allele was associated with a more transcriptionally active chromatin state.
rs3824662 risk A-allele upregulates GATA3 expression
To directly assess the effects of the rs3824662 genotype, we specifically knocked in the A allele at rs3824662 in the wildtype lymphoblastoid cell line GM12878 using CRISPR-Cas9 genome editing (Extended Data fig. 3a–c). Engineered GM12878 cells with the variant allele (A/C or A/A genotype) showed a 3.7- and 3.8-fold increase of GATA3 expression compared to isogenic cells with the wildtype C/C genotype (Extended Data fig. 3d). We then performed RNA-Seq and qPCR experiments to determine whether this variant can influence gene transcription in cis, and focused on genes located within the same topologically associated domains (TADs) because it has been shown that effects of cis-regulatory elements are usually confined by the TAD boundaries19,23. Of the four genes within the rs3824662-containing TAD, only the expression of GATA3 was significantly altered upon genome editing (Fig. 2a, upper panel), further indicating that this variant specifically regulates GATA3 transcription. Additionally, by analyzing the RNA-seq results of the engineered GM12878 cells with the heterozygous genotype at rs3824662, we noted significant allele-biased transcription of GATA3 (in favor of the T allele at coding variant rs2229359 in cis with the A allele at rs3824662, Extended Data fig. 3e–g). The effects of rs3824662 genotype on GATA3 expression were also confirmed at the protein level, using these isogenic cell lines (Extended Data fig. 3h–i). Further, we performed RNA-Seq in seven primary leukemia samples from ALL PDX and again confirmed that patients with the A allele at rs3824662 are associated with higher GATA3 expression (Fig. 2a, bottom panel). This A allele expression pattern is also found in non Ph-like ALL patient samples (Extended Data fig. 4a–d). To define the target gene for this regulatory variant, we also performed Capture-C and 3-C experiments to directly identify the regions that interact with this enhancer and observed that it forms a strong chromatin loop with the GATA3 promoter (Fig. 2b and Extended Data fig. 4e). To pinpoint the transcription factor that preferentially binds to the rs3824662 risk A allele, we performed footprint analysis using the high-depth ATAC-seq data from MHH-CALL4 cells (rs3824662 A/A allele), and identified the NFIC motif proximal to the variant (chr10: 8,104,196–8,104,208, Extended Data fig. 4f). ChIP-qPCR of NFIC in GM12878 (WT) and GM12878 (A/A) cells also confirmed that this transcription factor preferentially bound to the A allele at a level of 15-fold higher when compared with the C allele (Extended Data fig. 4g). Furthermore, in the engineered heterozygous C/A GM12878 cells, NFIC preferentially bound to the A allele over the C allele (Extended Data fig. 4h). In accordance with the ChIP findings, ectopic expression of NFIC significantly increased the activity of rs3824662 enhancer containing the A allele, with much more modest effects on the same enhancer element harboring the C allele (Fig. 2d). To further confirm that NFIC modulates the activity of this GATA3 enhancer, we performed NFIC knockdown experiments using shRNA in the engineered GM12878 (A/A) cells. GATA3 expression were suppressed by NFIC knockdown as evidenced at the mRNA and protein level (Fig. 2e and Extended Data fig. 4i–j).
Figure. 2. The rs3824662 A allele increases GATA3 expression and induces global expression changes in GM12878 cells and ALL PDX samples.
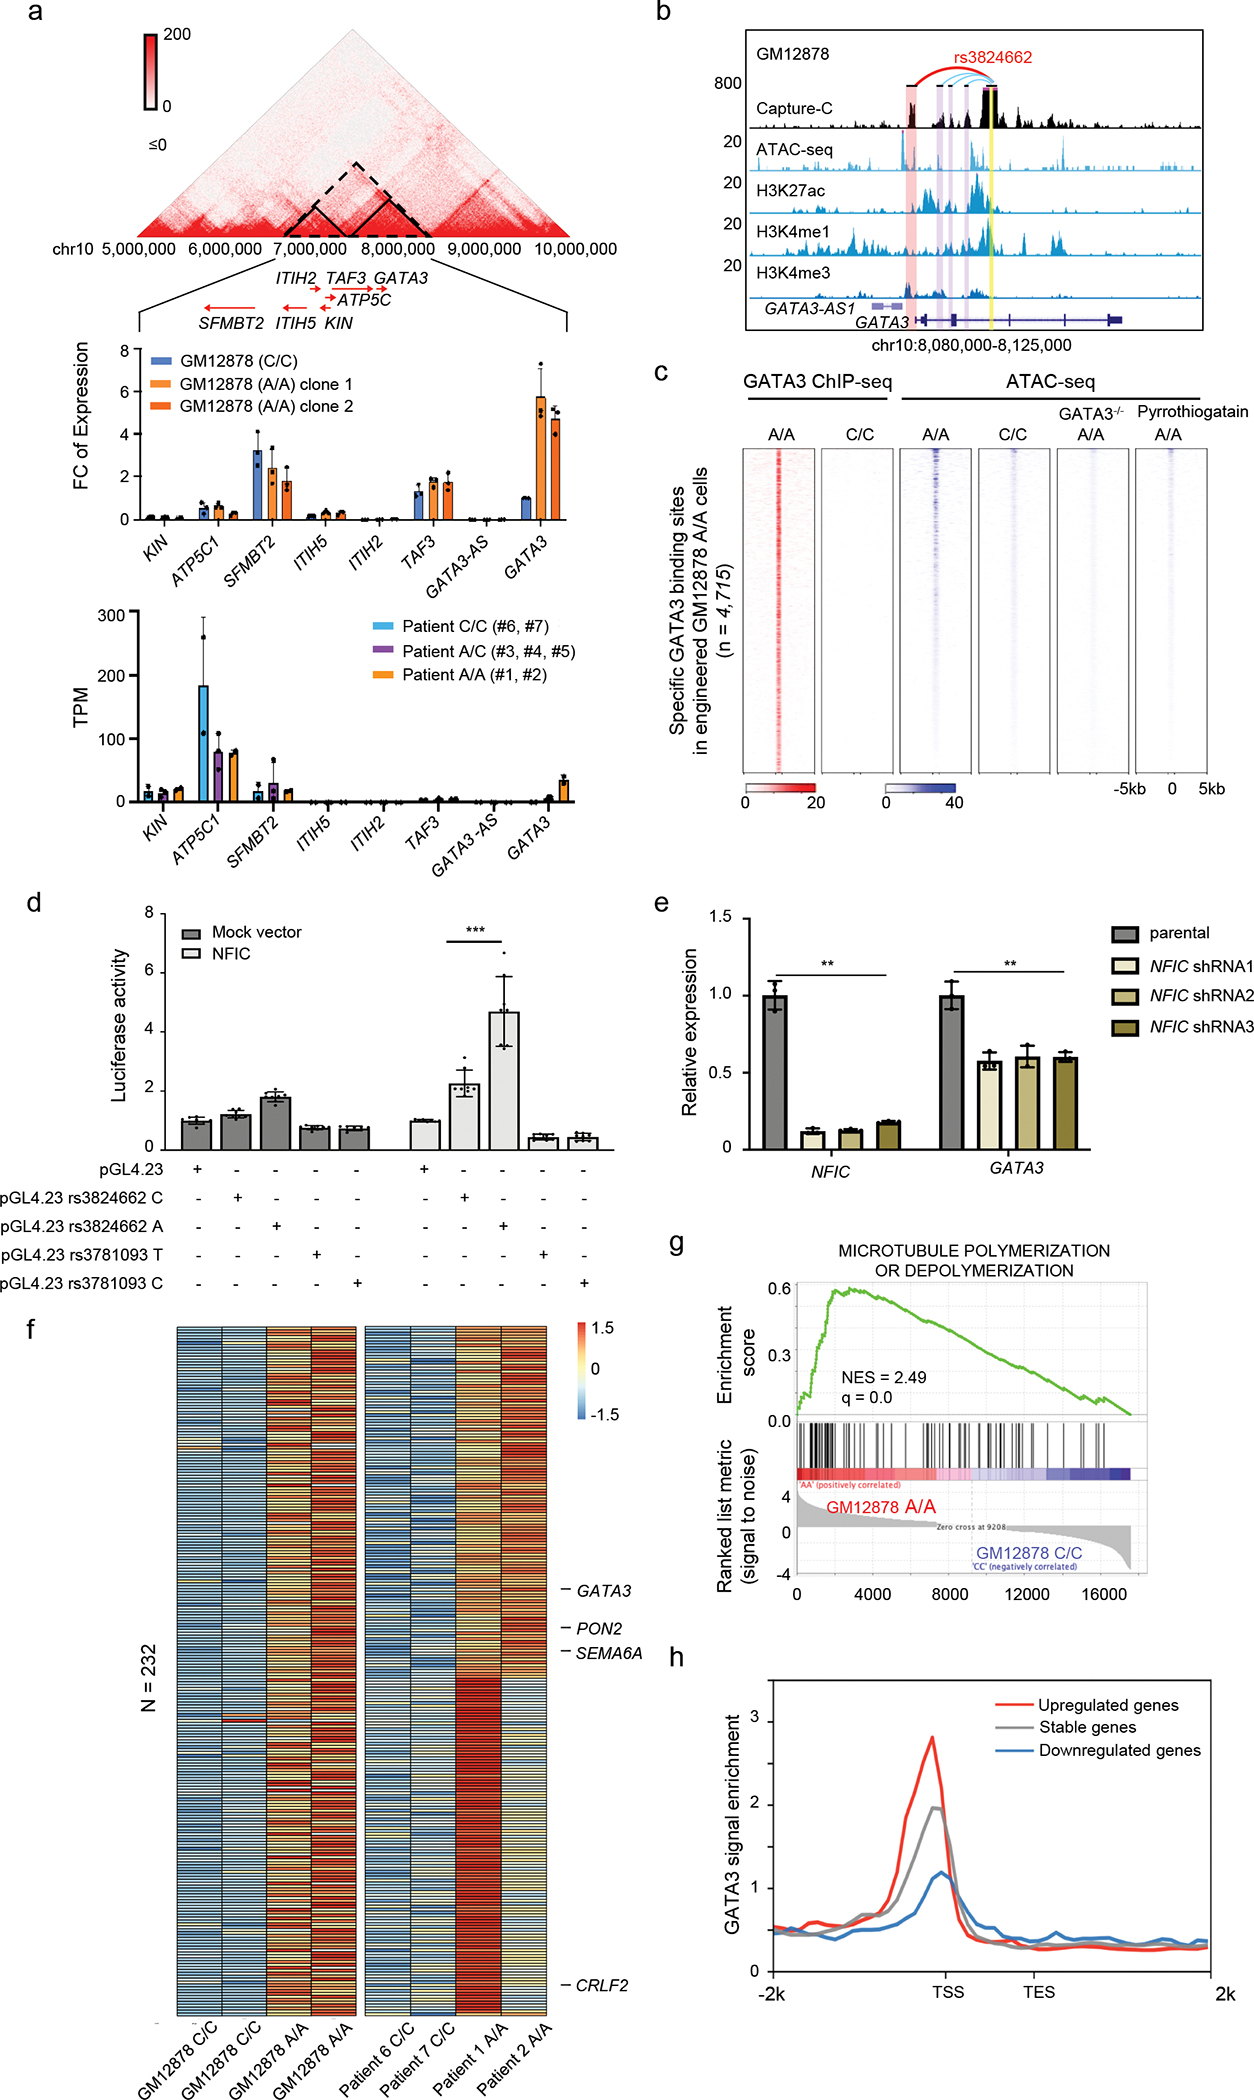
a, Effects of rs3824662 on gene expression within the local topologically associating domain (TAD). Gene expression was quantified by qPCR in wildtype (C/C) and engineered GM12878 cells (A/A), normalized to ACTB (n=3). TAD was defined using the GM12878 wildtype Hi-C data. Bottom panel shows results of ALL PDX samples (n=2, 3, and 2 for those with AA, AC, and CC genotype). Data are presented as mean values +/− SEM. b, Chromatin interactions between the rs3824662 (yellow bar) and GATA3 promoter (red bar) as determined by Capture-C. c, Heatmap of GATA3 ChIP-seq and ATAC-seq in GM12878 (WT) and engineered GM12878 (A/A) cells. Each row represents a 6kb genomic region flanking a GATA3 binding site that is specific in engineered GM12878 (A/A) cells. d, Luciferase reporter assay showed that rs3824662 enhancer activity increased with co-expression of NFIC, particularly with the enhancer element harboring the A allele (n = 8), two-sided unpaired T test, pGL4.23 rs3824662 A vs. pGL4.23 rs3824662 C, p-value = 0.0003997. e, shRNA-mediated knockdown of NFIC in GM12878 (A/A) cells resulted in significant reduction of GATA3 expression, n = 3 for each bar, two-sided unpaired T test, In the NFIC group, Parental vs. NFIC shRNA1 p-value = 0.002738, Parental vs. NFIC shRNA2 p-value = 0.003499, Parental vs. NFIC shRNA3 p-value = 0.003998. For the GATA3 group, Parental vs. NFIC shRNA1 p-value = 0.004096, Parental vs. NFIC shRNA2 p-value = 0.004434, Parental vs. NFIC shRNA3 p-value = 0.009699. Data are presented as mean values +/− SEM. f, 232 Differential gene expression between GM12878 (A/A) and GM12878 (WT) cell lines were also validated in PDX samples with different genotype at rs3824662. g, Gene Set Enrichment Analysis of genes upregulated with the A allele at 3824662 in the Molecular Signatures Database (MSigDB) shows enrichment of microtubule polymerization. h, Genes up-regulated in the GM12878 (A/A) cell line are showed more significant enrichment of GATA3 binding than those not affected or up-regulated in the GM12878 (WT) cells.
rs3824662 alters chromatin accessibility and GATA3 binding pattern
Having established that the rs3824662 risk allele upregulates GATA3 gene expression, we next sought to determine the effects of increased GATA3 on global gene transcription and chromatin organization. Comparing genome-wide GATA3 ChIP-Seq in engineeered GM12878 cells (genotype C/C vs. A/A), we found that there was an overall increase in GATA3 binding, with 4,715 novel binding sites in the engineered A/A clones compared to isogenic cells with the wildtype C/C genotype (Fig. 2c). These GATA3 binding sites co-localized with regions that became accessible in GM12878 (A/A) cells, as determined by ATAC-seq (Fig. 2c): of the 4,715 gained GATA3 binding sites, 2,650 were also identified as novel open chromatin regions created by the A allele in GM12878. In fact, these new GATA3 binding sites were devoid of nucleosomes (Extended Data fig. 5a), consistent with the notion that GATA3 functions as a pioneer factor24,25 and may be driving the open chromatin status at these loci. More importantly, GATA3 knockout in the engineered GM12878 (A/A) cells significantly reduced the open chromatin signals at these sites (Fig. 2c, column 5). Similarly, pharmacological inhibition of GATA3 DNA binding by small molecule inhibitor pyrrothiogatain also decreased the open chromatin signal in the engineered GM12878 A/A cells, (Fig. 2c, column 6). The GATA3 binding sites of the engineered GM12878 (A/A) cells are also enriched with GATA3 binding in patient PDX samples (Extended Data fig. 5b). Strikingly, these novel GATA3 binding sites were also more likely to locate close to important Ph-like ALL genes, whose expression most strongly distinguished Ph-like ALL from other ALL subtypes26 (Extended Data fig. 5c, p-value = 2.668e-08, Wilcoxon test and Extended Data fig. 5d–h). Furthermore, in the engineered GM12878 (A/A) cells, GATA3 bound to genomic loci was frequently targeted by chromosomal translocations in Ph-like ALL12 (e.g., CSF1R, PDGFRB, IKZF1) (Extended Data fig. 6a–c). Globally, there were 2,217 genes differentially expressed in the GM12878 (A/A) cell line, with 1,209 upregulated and 1,008 downregulated genes. 232 DEGs are also upregulated in patient PDX samples with the risk A alleles (Fig. 2f). GO term analysis showed that genes in the migration related pathways and T cell activation/maturation are preferentially activated in GM12878 cell lines with the A/A genotype (Fig. 2g and Extended Data fig. 6d–g). GATA3 binding was also significantly higher in upregulated genes, compared to downregulated genes in the GM12878 (A/A) cells (Fig. 2h, p-value<2.2e-16, Kolmogorov-Smirnov test).
Up-regulated GATA3 leads to 3D genome organization changes
Recent analyses using Hi-C data identified two types of compartments in the human genome with distinctive patterns of chromatin interactions: compartment A (active) and compartment B (repressive) 19,20, where A-to-B compartment switching is associated with extensive gene expression changes. Given the role of GATA3 as a pioneer factor, we postulated that elevated GATA3 expression (as a result of the rs3824662) would also influence 3D chromatin organization on a genome-wide scale. Therefore, we performed Hi-C experiments in GM12878 (WT) and also the engineered isogenic GM12878 (A/A) cells, and found that 4.07% of the genome underwent B-to-A compartment switching when the C allele at rs3824662 was replaced with the A allele (Fig. 3a and Extended Data fig. 5f–h). Globally, B-to-A compartment switching is associated with upregulation of genes located in these regions (Fig. 3b). Particularly notable was the PON2 gene, which was among the most differentially expressed genes between Ph-like vs non-Ph-like ALL26. The PON2 genomic locus underwent dramatic B-to-A compartment switching with a 6.26-fold increase in its expression (Fig. 3c, upper panel), following the C-to-A allele substitution at rs3824662 in the GM12878 cell line. To further examine the functional consequences of the A allele in human primary leukemia cells, we performed Hi-C experiments in seven ALL PDX samples with different rs3824662 genotypes. Similar to what we observed in the GM12878 cell lines, we found that B-to-A compartment switching at the PON2 locus was prominent in leukemia samples with the A/A genotype, along with transcription activation of the PON2 gene (Fig. 3c, bottom panel), whereas this region appeared transcriptionally inactive in WT patients. Leukemia cells with the heterozygous genotype at rs3824662 exhibited intermediate phenotypes in this regard. Interestingly, Patient #4 who has a heterozygous genotype at rs3824662 showed a dramatic A compartment expansion, likely due to acquired translocation events in chr7 (Extended Data fig. 7a–b). We also examined previously reported ALL-specific MYC enhancers but did not observe any association with rs3824662 in PDX samples of Ph-like ALL (Extended Data fig. 7c). Finally, ALL PDX samples containing the A allele clustered together, based on whole-genome A/B compartment states (Fig. 3d).
Figure 3. Upregulation of GATA3 expression leads to genome-wide A-B compartment reorganization.
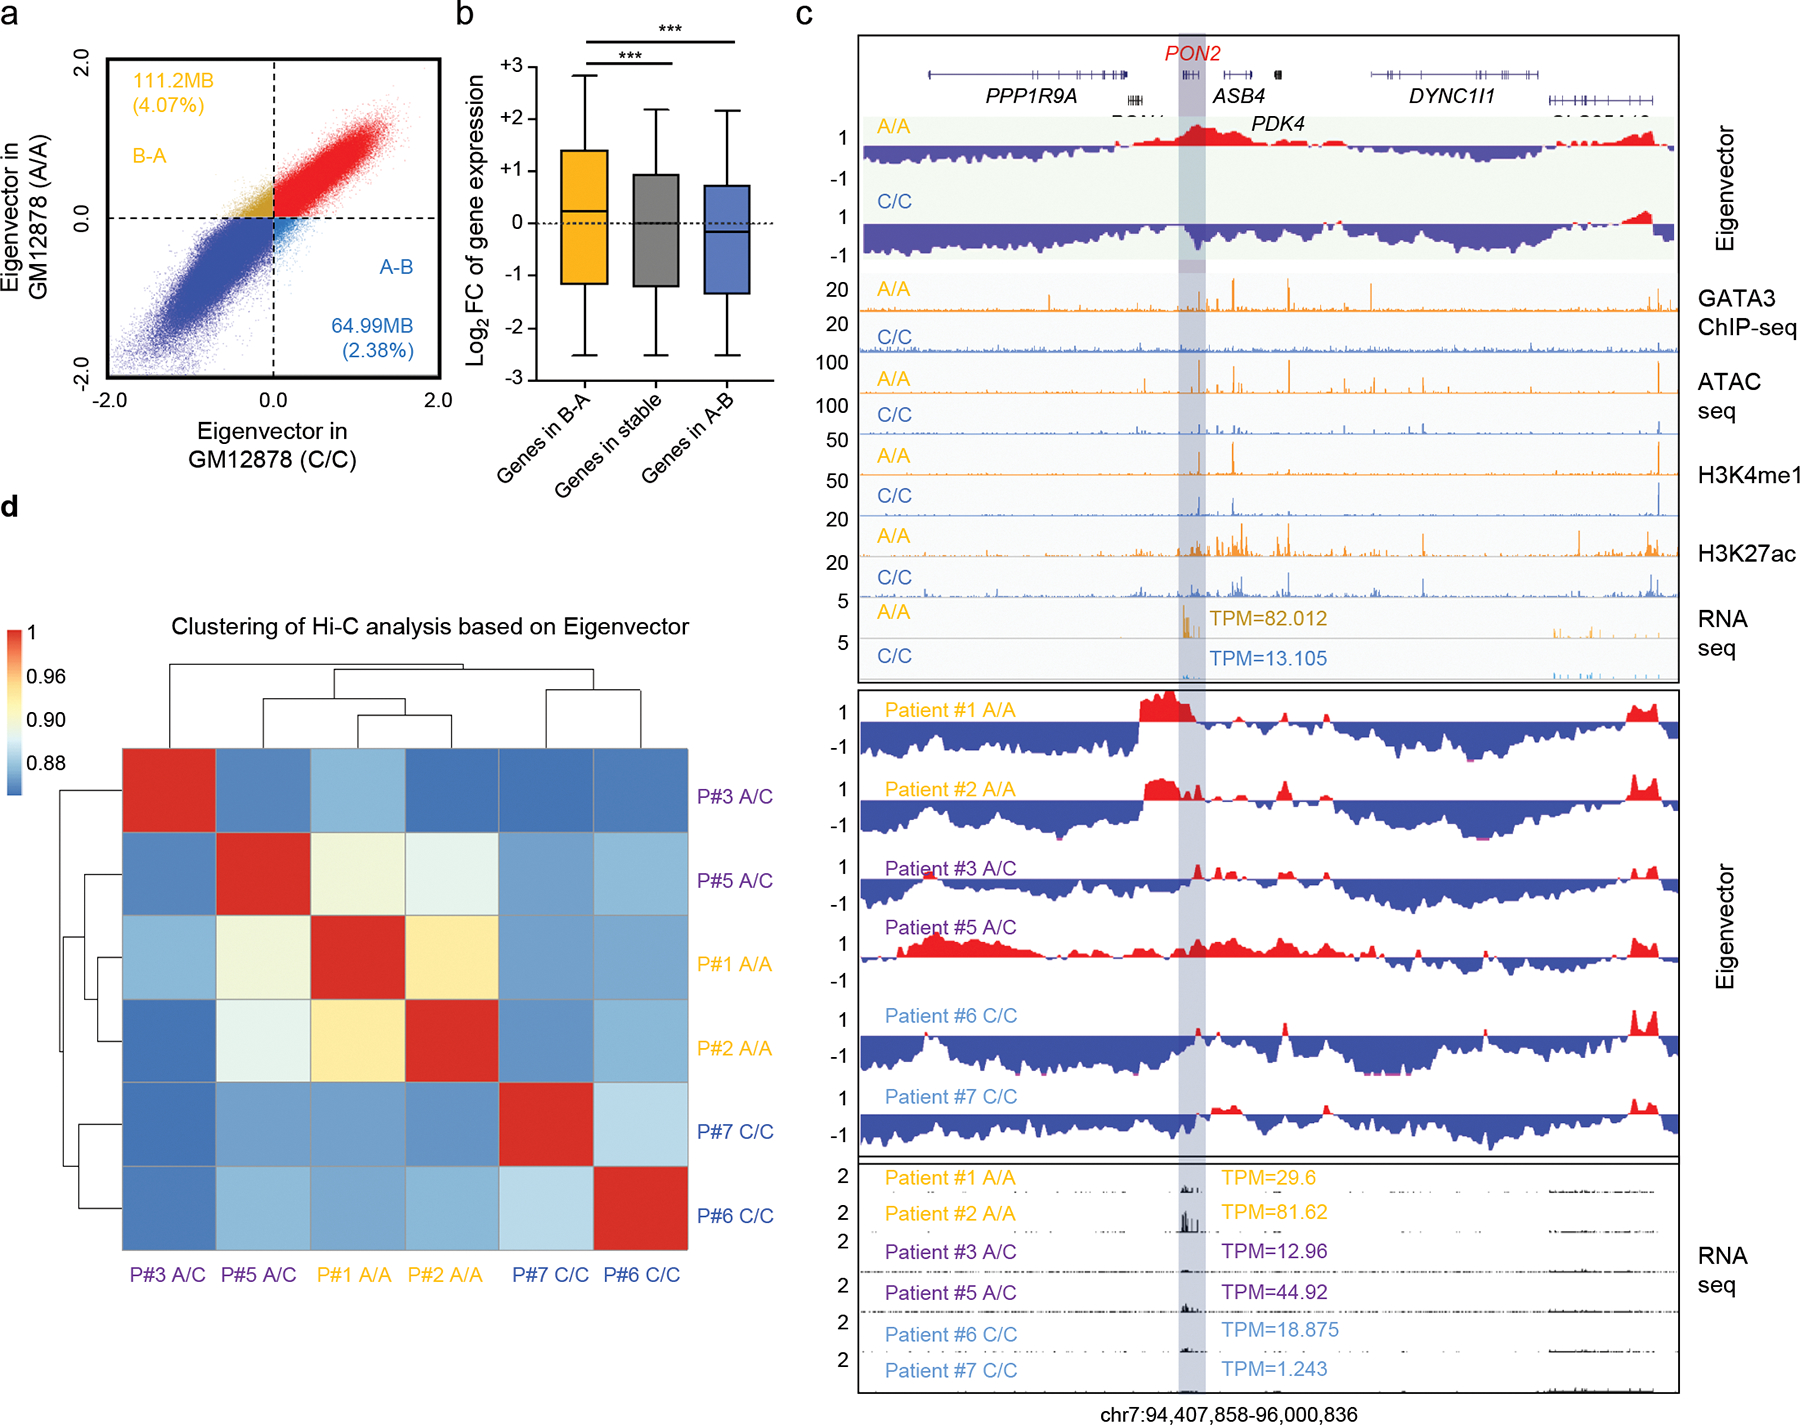
a, Engineered GM12878 (A/A) cells contain more active domains (Compartment A) than GM12878 (WT) cells (1,192,100,000 bp vs 1,145,890,000 bp). b, Genes located within regions that underwent the B-to-A compartment switch (n = 532) showed increased expression (wildtype vs A/A genotype, p value < 2.2e-16 by two-sided Wilcoxon test), compared to genes in stable region (n = 20311) and A-to-B switched region (n = 392). The horizontal line shows the median, the box encompasses the interquartile range, and whiskers extend to 5th and 95th percentiles. c, Ph-like ALL associated gene PON2 locus underwent B-to-A switch in the engineered GM12878 (A/A) cells, with a 6.258-fold increase in PON2 expression (upper panel). ALL PDX samples with risk A alleles also show similar B-to-A switch in PON2 locus (bottom panel). d, Genome-wide pattern of A/B compartment states in ALL PDX samples clustered according to genotype at rs3824662 (Pearson correlation coefficient). Pearson Correlation Coefficient matrix was generated based on the A/B compartment states using 10kb resolution. A compartments were defined as 1, and B compartments were defined as −1. Grey bar indicates PON2 gene. For bar plots, data are presented as mean +/− SEM. *, ** and, *** represent p-value<0.01, p-value <0.001, and p-value<0.0001, respectively.
Although there was no significant genome-wide change at the TAD level (Extended Data fig. 8a–b), we observed a set of chromatin loops in engineered GM12878 cells (A/A allele) and these loops were significantly enriched for GATA3 binding sites (Fig. 4a, Extended Data fig. 8c). These novel interactions in GM12878 (A/A) cells also have a longer interaction distance and are enriched with higher enhancer-promoter and promoter-promoter interaction, compared to GM12878 (WT) cells (Fig. 4b, 4c, and examples provided in Extended Data fig. 5f–h, 6a–c and 8c), although the number of gained and lost E-P interactions were similar between A/A cells and WT cells (118 vs 102). Next, we specifically examined the chromatin interactions at the CRLF2 locus because genomic abnormalities involving this gene is a hallmark in the majority of Ph-like ALL12,13. We found that they formed a new loop that brought the CRLF2 promoter in close proximity to a distal super enhancer in P2RY8 with concomitant GATA3 binding (Fig. 4d), which may have contributed to the increase of CRLF2 transcription in the engineered A allele cells. This new interaction between P2RY8 and CRLF2 is also specifically detected in ALL patient PDX samples with risk-A alleles (Fig. 4e). 3C experiments showed that two enhancers inside the P2RY8 locus had a stronger interaction with the CRLF2 promoter in engineered GM12878 (A/A) cells (Extended Data fig. 8d). Strikingly, this new linkage between the CRLF2 promoter and distal enhancer echos an enhancer hijacking event induced by an intrachromosomal rearrangment, which is one of the main mechanisms of CRLF2 overexpression observed in ~25% of Ph-like ALL cases12.
Figure. 4. GATA3 expression leads to increased enhancer-promoter interaction, particularly in genes related to Ph-like ALL.
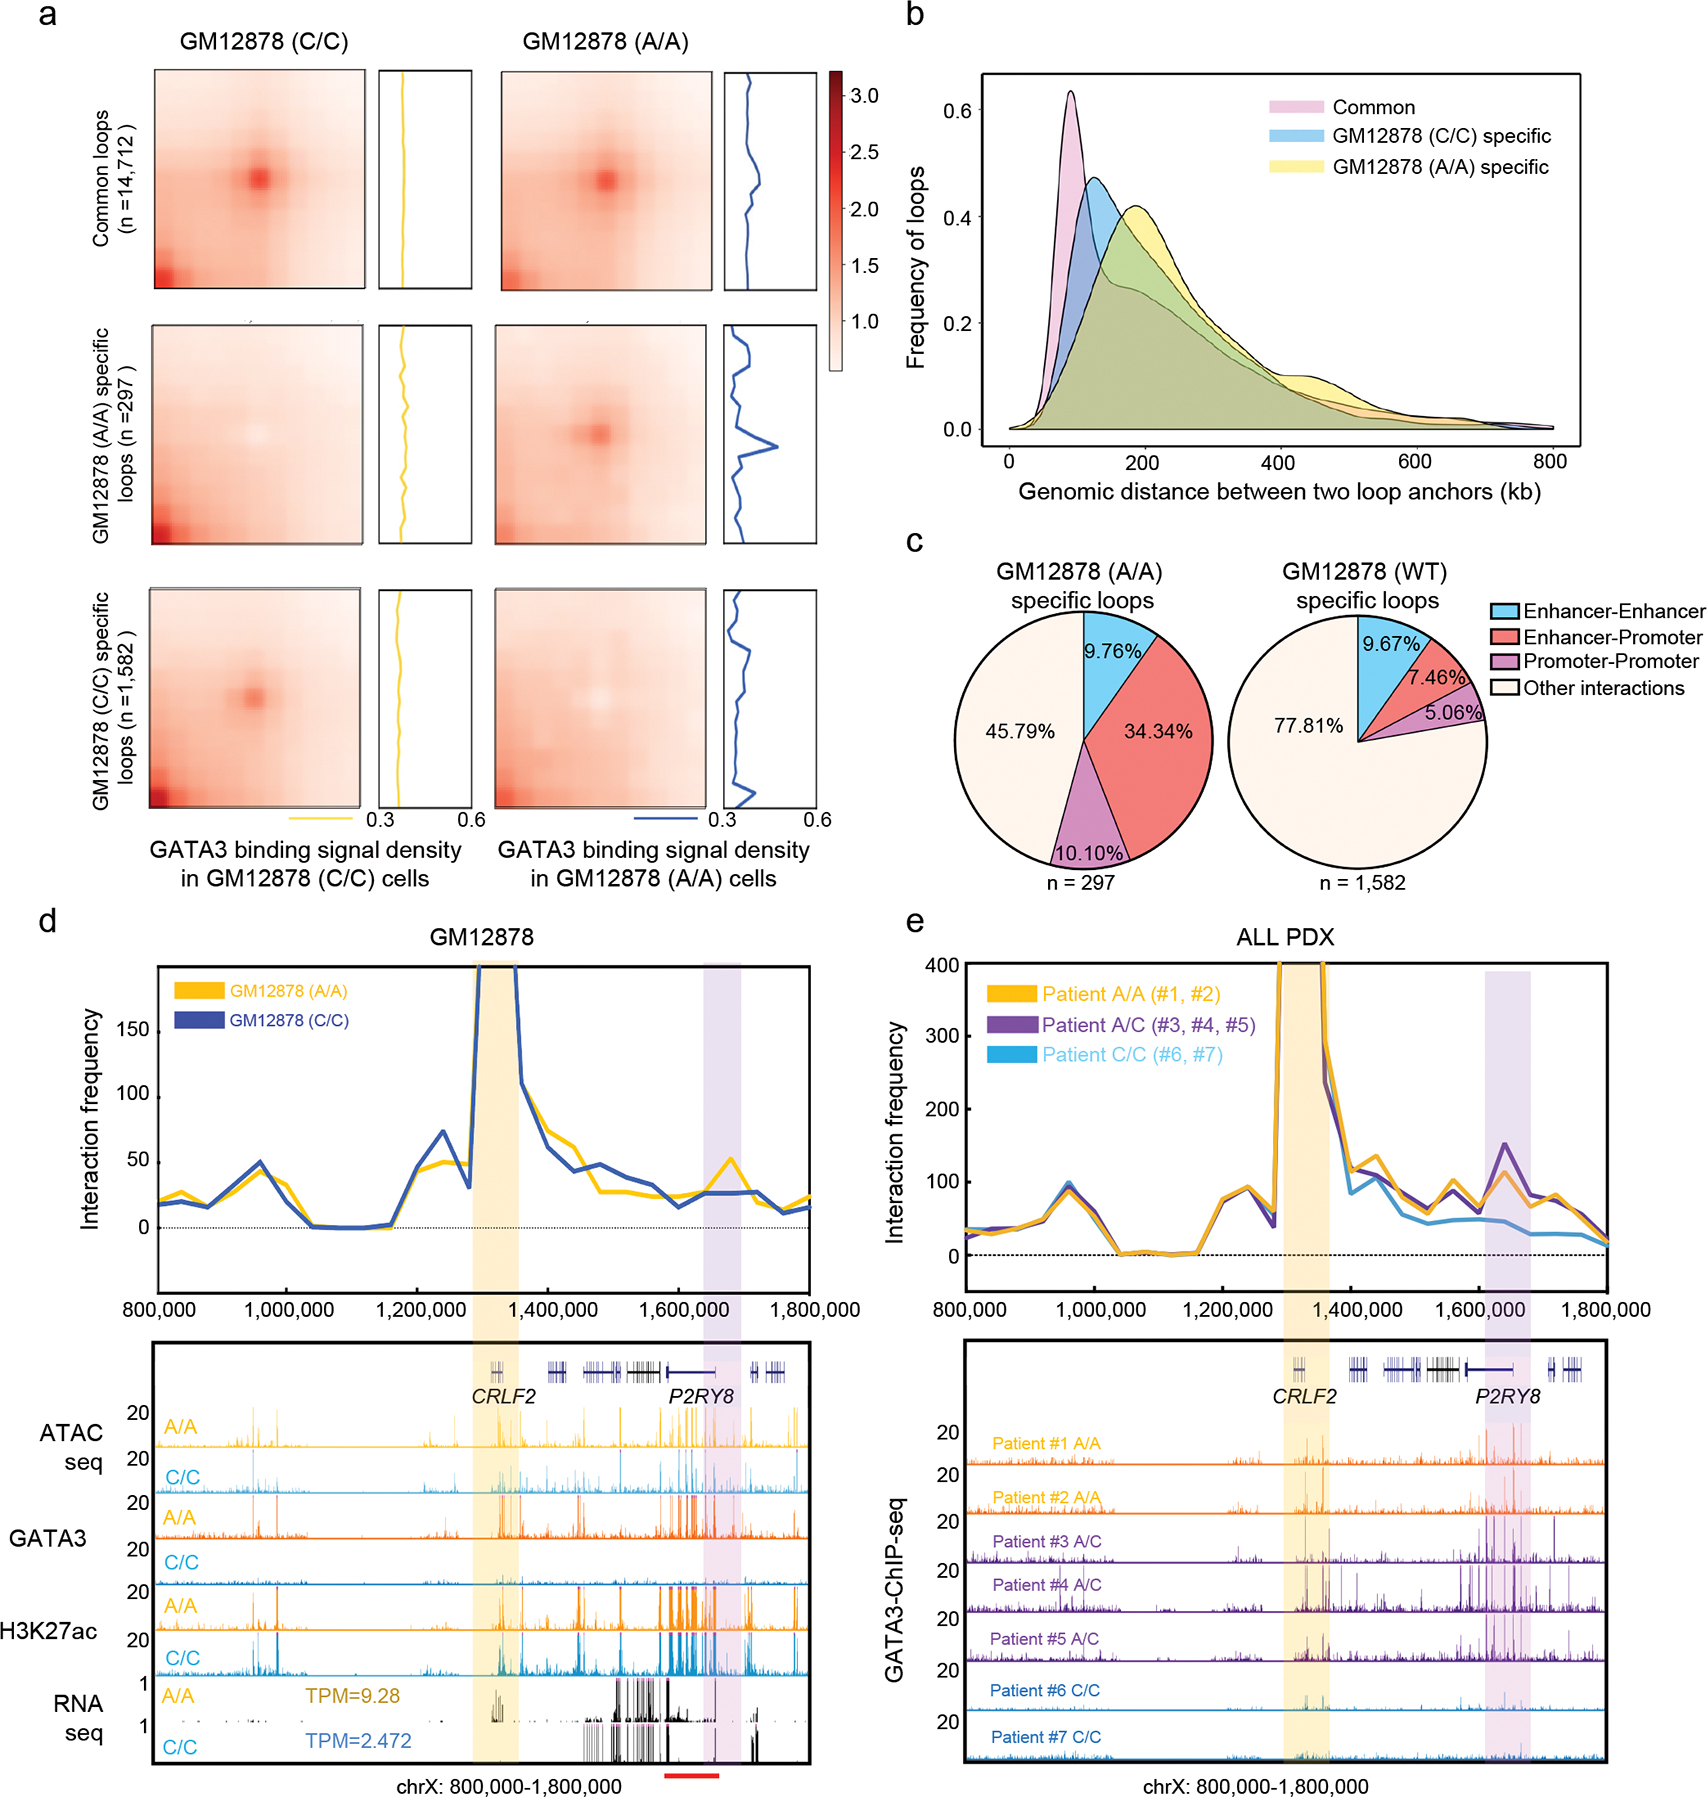
a, APA plot indicates that GATA3 binding is enriched in engineered GM12878 (A/A) cell specific chromatin loops. b, Distance distribution of chromatin loops specific to GM12878 (A/A), GM12878 (WT), or common in both cell lines. c, Enhancer-Promoter and Promoter-Promoter are more enriched in the differential loops of engineered GM12878 (A/A) cells. d-e, Virtual 4-C analysis (40kb resolution) shows A/A genotype-specific chromatin looping between the P2RY8 enhancer (pink bar) and the CRLF2 promoter (yellow bar) in engineered GM12878 (A/A) cells and ALL PDX samples with A/A genotype. Red bar indicates the P2RY8 super enhancer predicted by ROSE.
Inspired by this observation, we performed motif analysis of all the common breakpoint regions in Ph-like ALL patients 12, and we observed an enrichment of the GATA3 motif (Extended Data fig. 9a). Finally, we examined the GATA3 ChIP-seq signals surrounding the Ph-like breakpoints in both the GATA3-overexpressing Nalm-6 ALL cells and engineered GM12878 cells, and again we observed an enrichment of GATA3 binding (Extended Data fig. 9b–c).
GATA3 regulates CRLF2 and JAK-STAT signaling
When ectopically expressed in ALL cell lines, GATA3 induced a gene expression pattern that overlapped with the expression signature of Ph-like ALL7. In particular, inducible overexpression of GATA3 led to up-regulation of CRLF2 in a time-dependent manner (Fig. 5a, Extended Data fig. 8e–f), with concomitant gain of GATA3 binding at the CRLF2 promoter region overlapping with CRLF2 rearrangement hotspots observed in Ph-like ALL (Extended Data fig. 9d). Conversely, down-regulation of GATA3 by shRNA suppressed CRLF2 transcription (Fig. 5b, Extended Data fig. 8e), further indicating that GATA3 functions as a transcriptional regulator of CRLF2. It has been shown that CRLF2-mediated constitutive activation of the JAK-STAT pathway is responsible for leukemogenesis in hematopoietic cells27. Therefore, we hypothesized that GATA3 acts upstream of CRLF2, and the germline GATA3 variant can directly influence CRLF2-JAK signaling (by upregulating GATA3 expression). To test this possibility, we examined the effects of GATA3 on in vitro transformation potential and JAK-STAT signaling in the mouse hematopoietic cell line Ba/F3. GATA3 overexpression was associated with upregulation of CRLF2 (Extended Data fig. 8f), and also led to phosphorylation of Jak2 and Stat5 (Fig. 5c). Co-expression of GATA3 and Jak2R683G were sufficient to induce cytokine-independent growth and Ba/F3 cell transformation in a fashion analogous to co-expression of CRLF2 and Jak2R683G, although with a longer latency (Fig. 5d). Interestingly, the addition of a CRLF2 ligand, TSLP, potentiated transforming effects of GATA3 in Ba/F3 cells expressing mouse IL7r (Ba/F7 cells, Extended Data fig. 10a). Intriguingly, ectopic expression of JAK2R683G also increased the proliferation of engineered GM12878 cells, especially those with the A/C and A/A genotypes (Extended Data fig. 8g), which was consistent with the findings of Ba/F3 cells.
Figure. 5. GATA3 potentiates CRLF2-JAK-STAT signaling in hematopoietic cells.
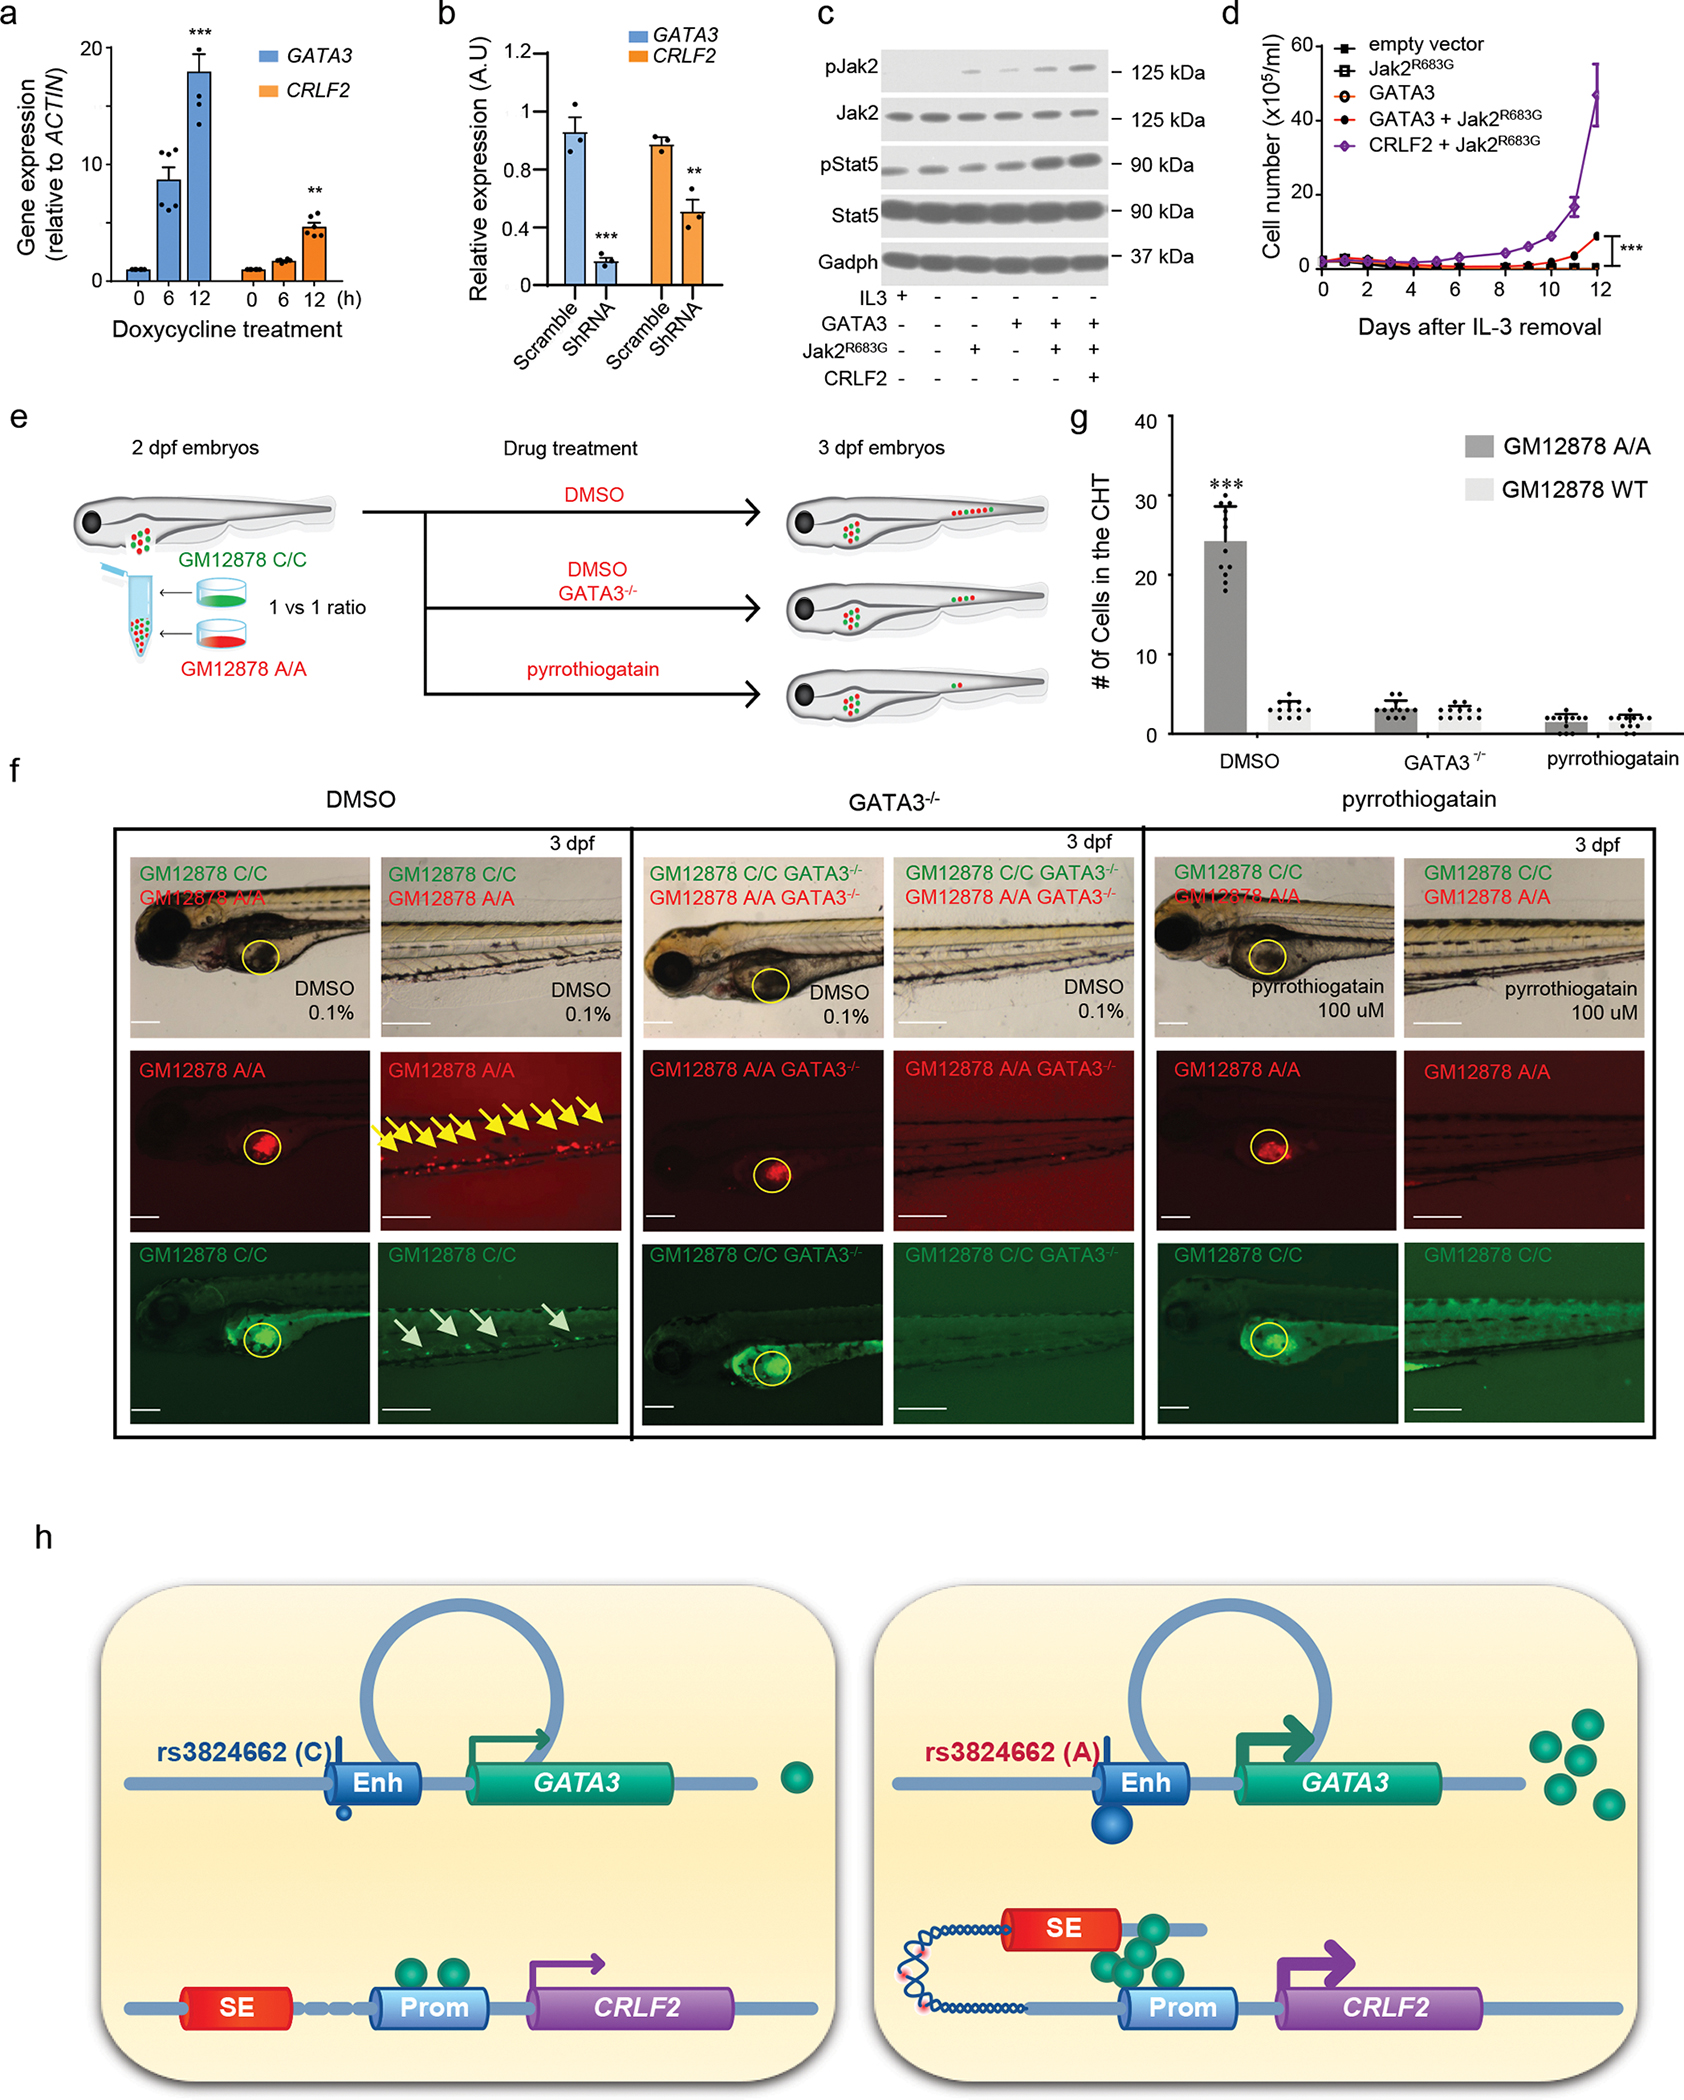
a-b, GATA3 regulates CRLF2 transcription in ALL cell line Nalm6 (overexpression in a and knockdown in b, n = 6 and 3, respectively); two-sided unpaired T test. In the GATA3 group, 12h vs. 0h p-value = 9.195e-05, scramble vs shRNA, p-value = 0.008203; in the CRLF2 group, 12h vs. 0h p-value = 0.0001296, scramble vs shRNA, p-value = 0.01786. Data are presented as mean values +/− SEM. c, JAK-STAT activation by GATA3 in mouse hematopoietic cell line Ba/F3. Cells were transduced with GATA3, JAK2R683G, and/or CRLF2 as indicated, and cultured in the presence or absence of IL3. JAK2 and STAT5 phosphorylation was examined by immunoblotting with GAPDH as control. Experiments were repeated three times with similar results. d, IL3-independent growth of Ba/F3 cells expressing GATA3, Jak2R683G, GATA3 with Jak2R683G, Jak2R683G with CRLF2, or empty vector. Experiments were performed in triplicates, p value < 0.001 by two-way ANOVA. Data are presented as mean values +/− SEM. e, Experimental design to evaluate the hematopoietic niche homing of GM12878 cells in zebrafish. f, Bright field and fluorescent imaging of 3dpf embryos with GM12878 injection. Yellow circle indicates injection sites. Yellow and green arrows indicate GM12878 A/A cells and WT cells homing to the caudal hematopoietic tissue (CHT), respectively. Scale bar: 200 uM. Experiments were repeated three times independently with similar results. g, Quantitative analysis of GM12878 cell homing to the CHT (n = 12), two-sided unpaired T test, p-value, from left to right, 1.446e-09, 0.2713, and 1. Data are presented as mean values +/− SEM. h, A schematic of our proposed model of how the rs3824662 variant contributes to Ph-like ALL pathogenesis. The A allele induces GATA3 expression which binds to the CRLF promoter and loops the CRLF2 promoter to the super enhancer at the P2RY8 locus, eventually resulting in CRLF2 overexpression. The chromatin region between the CRLF2 promoter and P2RY8 super enhancer also becomes more open and thus susceptible to damage (e.g., rearrangements). Enh: enhancer; SE: super-enhancer; Prom: promoter. For bar plots, *, ** and, *** represent p-value<0.01, p-value <0.001, and p-value<0.0001, respectively.
CRLF2 and JAK/STAT pathways are known to induce cell migration in hematopoietic progenitor cells and also pediatric B-cell ALL28,29. To explore this in vivo, we employed zebrafish model to directly examine xenograft cell migration from yolk sac to caudal hematopooieitc tissue (CHT). GM12878 WT and A/A cells were both labeled with Vybrant DiO green dye and then injected to the yolk sac region of 2 dpf zebrafish embryos. The engineered GM12878 cells with A/A genotypes showed stronger migration ability to the CHT 24 hours after injection, which is similar to hematopoietic niche-specific homing (Extended Data fig. 10b–c). To further test whether this risk A allele induced cell migration is regulated by GATA3 expression, we first generated GM12878 WT cells with GFP labeling and engineered GM12878 A/A cells with mCherry labeling and then co-injected these two types of cells mixed at 1:1 ratio into zebrafish embryos (Fig. 5e). There were significantly more red fluorescent cells in the CHT region 24 hours after co-injection (Fig. 5f and 5g, first column). More importantly, GATA3 knockout in the GM12878 cells (A/A) reduced their homing to the CHT region (Fig. 5f and 5g, second column). GATA3 DNA binding inhibitor, pyrrothiogatain, also reduced the migration of these cells to CHT (Fig. 5f and 5g, third column). These results strongly suggested that GATA3 directly up-regulates CRLF2 in human and zebrafish cells, and impinges upon the pathogenesis of Ph-like ALL (Fig. 5h).
Discussion
Both inherited germline and somatic genetic variations contribute to the pathogenesis of different malignancies, including leukemias. Somatic genomic aberrations, i.e., mutations, rearrangements, and insertions/deletions have been shown to drive overt leukemogenesis by promoting the survival and proliferation of pre-leukemia hematopoietic cells. However, the roles of inherited leukemia risk variants, especially those in intronic/intergenic loci, remain largely unclear. For example, GWAS studies have identified 9 genomic loci with common SNPs associated with susceptibility to childhood ALL, but there has been little progress to move from descriptive association studies to identifying causative mechanisms relating these variants to ALL pathogenesis.
Here we define the regulatory function of a non-coding SNP, rs3824462, associated with Ph-like ALL7. This variant strongly influences the susceptibility to high-risk ALL and prognosis consistently across different ALL treatment regimens7,30,31. The GATA3 risk allele is also associated with CRLF2 expression in pediatric B-cell precursor ALL32, howerver, the mechanism of how rs3824662 regulates CRLF2 is still unkown. In this work, we first reported that the rs3824662 variant is located inside an enhancer element and the risk allele showed significantly increased enhancer activity. Introducing the risk A allele at rs3824662 by CRISPR/Cas9 editing in the wildtype GM12878 cells directly confirmed its enhancer effects on GATA3 transcription. Using a variety of chromatin conformation capturing techniques, we further demonstrated that this variant significantly reshaped chromatin interactions both locally and also in a global fashion. A recent study showed that GATA3 can act as a pioneer factor in the course of cellular reprogramming, making previously condensed chromatin more accessible by recruiting BRG1, a chromatin remodeling factor24. Similarly, our ATAC-seq data also suggested that the C-to-A allele substitution at rs3824662 was associated with many newly-gained open chromatin regions enriched for GATA3 binding sites, coupled with global 3D genome re-organization. In particular, we observed that hundreds of regions switched from the repressive and compacted compartment to the active and open compartment. Among them are many essential genes whose expression are altered in Ph-like ALL, likely due to the change of chromatin environment, including SEMA6, PDGFRB, CSF1R and IFZF1(Supplemetanry Fig. 10b and 11). We also performed ATAC-seq, GATA3 ChIP-seq and Hi-C in a panel of seven ALL patient samples with different genotypes at rs3824462. In these analyses, we identified similar B-to-A switching in the PON2 gene and novel looping events between the CRLF2 and P2RY8 loci, indicating that these transcriptional regulation mechanisms are indeed operative in Ph-like ALL patients. However, these human leukemia samples harbor a plethora of somatic genomic abnormalities which likely confounded the effects from germline GATA3 polymorphisms.
More interestingly, we found that many GATA3 binding sites are located near the breakpoints of translocation events observed in Ph-like ALL. Although this observation suggested that GATA3 over-expression might be related to chromosomal instability and susceptibility to translocations, the causual effects of GATA3 remain to be documented directly and experimentally. Therefore, we hypothesize that GATA3 over-expression might facilitate enhancer hijacking, where a distal enhancer is rearranged to the proximity of oncogenes and leads to oncogenesis without gene fusions23,33–35.
Aberrantly high GATA3 expression has also been identified in other B cell malignancies, such as classical Hodgkin lymphoma. Constitutive activation of NFkB and Notch-1 leads to higher GATA3 expression in Reed Sternberg cells, which then contributes to cytokine secretion (especially IL13) and signaling typical in Hodgkin lymphoma36. In contrast, GATA3 is not expressed in normal B cells, and in fact functions as a key regulator of lymphoid cell lineage commitment (B vs T cells)37. The data we present in the current study points to novel roles of GATA3 in global cellular reprogramming and pathogenesis of B-cell malignancies. The rs3824662 T allele has a significant association score with the risk of systemetic lupus and type2 Diabetes38,39. The role of the risk T allele in these diseases need to be further investiaged in the future.
PDX into zebrafish embryos is a useful model to study human hematopoiesis and hematological diseases because of the embryo transparency for in vivo monitoring, and the late maturation of the adaptive immune system40,41. There are several studies investigating various kinds of leukemia cell proliferation and migration including intravasation and extravasation in early-stage zebrafish embryos42–44. In our study, we found that engrafted engineered GM12878 cells with A/A genotype have a strong ability to migrate in the blood vessel labeled transgenic embryos 24 hours after injection. This is consistent with the enrichment of migration functions with the risk A allele upregulated genes GSEA analysis. Furthermore, co-injection of equal numbers of cells with different rs3824662 genotypes into the same embryos shows that the cells containing the risk A allele migrated longer and have high efficiency of homing to the CHT region, which is functionally equivalent to bone marrow in humans. Importantly, GATA3 knockout or GATA3 DNA binding inhibitor pyrrothiogatain can reduce the risk A allele induced homing effect.
In conclusion, we report here that the inherited genetic variant rs3824662 is a cis-acting enhancer variant associated with GATA3 transcription activation, which results not only in increased occupancy at regulatory sites but also in de novo occupancy in otherwise non-occupied elements. This global chromatin status change contributes to Ph-like ALL leukemogenesis through regulating CRLF2 signaling. Our results suggest that transcription factor-mediated epigenomic reprogramming can directly influence oncogene activity and may be an important mechanism by which germline genetic variants influence cancer risk.
Methods
Our research complies with all relevant ethnical regulations, including approval from the institutional review board at St. Jude Children’s Research Hospital.
Patients
In this study, 5,008 childhood ALL patients were enrolled on Children’s Oncology Group (COG; AALL023245 and COG9904/9905/990646) and St. Jude Children’s Research frontline clinical trials47. Patient sex and age are described in Supplementary Table 1. Germline DNA was extracted from bone marrow samples or peripheral blood obtained from children with ALL during remission. This study was approved by institutional review boards at St. Jude Children’s Research Hospital and COG affiliated institutions and informed consent was obtained from parents, guardians, or patients, as appropriate. Patients received no compensation for participating in this research study. Ph-like ALL status was determined based on global gene expression, as described previously7. Patient-derived xenografts of ALL were selected from the St. Jude PROPEL resource with genomic characterization and sample authentication described at https://stjuderesearch.org/site/data/propel
GATA3 targeted sequencing
Illumina dual-indexed libraries were created from the germline DNA of 5,008 children with ALL and pooled in sets of 96 before hybridization with customized Roche NimbleGene SeqCap EZ probes (Roche, Roche NimbleGen, Madison, WI, USA) to capture the GATA3 genomic region. Quantitative PCR was used to define the appropriate capture product titer necessary to efficiently populate an Illumina HiSeq 2000 flow cell for paired-end 2 × 100 bp sequencing. Coverage of greater than 20 x depth was achieved across more than 80% of the targeted regions for nearly all samples. Sequence reads in the FASTQ format were mapped and aligned using the Burrows-Wheeler Aligner (BWA)48, and genetic variants were called using the GATK pipeline (version 3.1)49, as previously described, and annotated using the ANNOVAR50 program with the annotation databases including RefSeq51. All the GATA3 non-silent variants were manually reviewed in the Integrative Genomics Viewer52. Association of genotypes with Ph-like ALL status were examined following our established statistical procedure7, i.e., comparing allele frequency in ALL cases with vs without the Ph-like gene expression signature, using the logistic regression test with genetic ancestry as covariables.
Knock-in rs3824662 risk allele in GM12878
sgRNA targeted rs3824662 locus was cloned into CRISPR-CAS9 vector PX458 (Addgene)53 and co-transfected into GM12878 along with single-strand donor DNA which carries the risk allele A (Supplementary table 3). After 68h of transfection, GFP positive cells were sorted into 20 96-well plates (color BD FACS Aria SORP high-performance cell sorter). Half of the cells from successfully expanded clones were transferred into 24-well plates and the genomic DNA from the rest of the cells were extracted for PCR of the rs3824662 region. Pst1 (NEB) restriction enzyme digestion was used to select the heterozygous or homozygous knock-in clones. Successful knock-in clones were confirmed by Sanger sequencing.
3D chromatin structure mapping by Hi-C
Hi-C in GM12878 cells and PDX samples were performed using the Arima-HiC kit as per the manufacturer’s instructions. Briefly, 1 million GM12878 WT, A/A cells and PDX samples were fixed with 1% formaldehyde, digested with a restriction enzyme, end-labeled with Biotin-14-dATP, and then followed by ligation. The ligated chromatin was reverse-crosslinked and sonicated by Covaris E220 to produce 300–500 bp fragments. Biotin labeled DNA fragments were isolated using dynabeads Streptavidin C1 beads and followed by end-repair, adenylation, adaptor ligation and PCR amplification. The quantity of the library was measured by both BioAnalyzer (Agilent) and the Kapa Library Quantification Kit (Kapa Biosystems). Finally, the library underwent pair-end 2×100bp high-throughput sequencing using HiSeq 2500 and Nova-seq (Illumina).
Cytokine-dependent growth assay in Ba/F3 cells and Ba/F7 cells
The full-length GATA3 and CRLF2 coding sequences were purchased from GE Healthcare and cloned into the cL20c-IRES-GFP lentiviral vector. cl20c-CRLF2-IRES-GFP was modified into cl20c-CRLF2-IRES-CFP, and lentiviral supernatants were produced by transient transfection of HEK-293T cells using calcium phosphate. The MSCV-JAK2R683G-IRES-GFP construct was a gift from Dr. Charles Mullighan at St. Jude Children’s Research Hospital27 and modified into MSCV-JAK2R683G-IRES-mCherry and retroviral particles were produced using 293T cells. Ba/F3 cells and Ba/F7 cells were maintained in medium supplemented with 10 ng/ml recombinant mouse interleukin 3 (IL3) and interleukin 7 (IL7) (PeproTech), respectively. Ba/F3 or Ba/F7 cells were transduced with lentiviral supernatants expressing GATA3. GFP positive cells were sorted 48 hours after GATA3 transduction and maintained in the IL3 medium for another 24 hours before transfected by JAK2R683G retroviral supernatants. Forty-eight hours later, GFP/mCherry double positive cells were sorted and maintained in medium with their respective cytokine for 48 hours. Cells transduced with empty vector, JAK2 R683G or JAK2R683G and CRLF2 were sorted out for controls. Then, cells were washed three times and grown in the absence of cytokine. For the TSLP assay, cells are maintained in medium with 10 ng/ml TSLP but without IL3. Cell growth and viability were monitored daily by Trypan blue using a TC10 automated cell counter (BIO-RAD). Each experiment was performed three times.
Data Availability Statement
All sequencing data and processed results are deposited in the NCBI Gene Expression Omnibus under accession code: GSE145997. 2,296 ALL patient RNA-seq data54 can be found at https://pecan.stjude.cloud/proteinpaint/study/PanALL. T-cell RNA-seq and ATAC-seq data is downloaded from GSE107011 and GSE74912, respectively. B-ALL Patient ATAC-Seq is available at GSE161501. The human histone-modification ChIP-seq data were downloaded from ENCODE project, and all datasets used are summarized in Supplementary Table 9.
Statistics and Reproducibility Statement
All box plots in main and extended data figures were plotted using R and Python. In box plots, the horizontal line shows the median, the box encompasses the interquartile range, and whiskers extend to 5th and 95th percentiles. All the Error bar of bar plot indicates standard deviations. *note that *, ** and, *** represent p-value<0.01,p-value <0.001, and p-value<0.0001, respectively. Statistical analyses for differential gene expression, differential GATA3 ChIP–seq peaks were conducted with the edgeR and DiffBind R package using two replicates as described in Supplementary Note. For the ChIP-seq and ATAC-seq datasets, The Pearson correlation coefficient between each biological replication was calculated using RPM normalized 10kb bins reads. IDR with a threshold of 0.05 was used to measure the reproducibility of peaks from replicates. Additional experimental details and data analyses are included in the Supplementary Note.
Extended Data
Extended Data Fig. 1. Targeted GATA3 sequencing in 5,008 children with ALL and genomic features of the rs3824662 region.
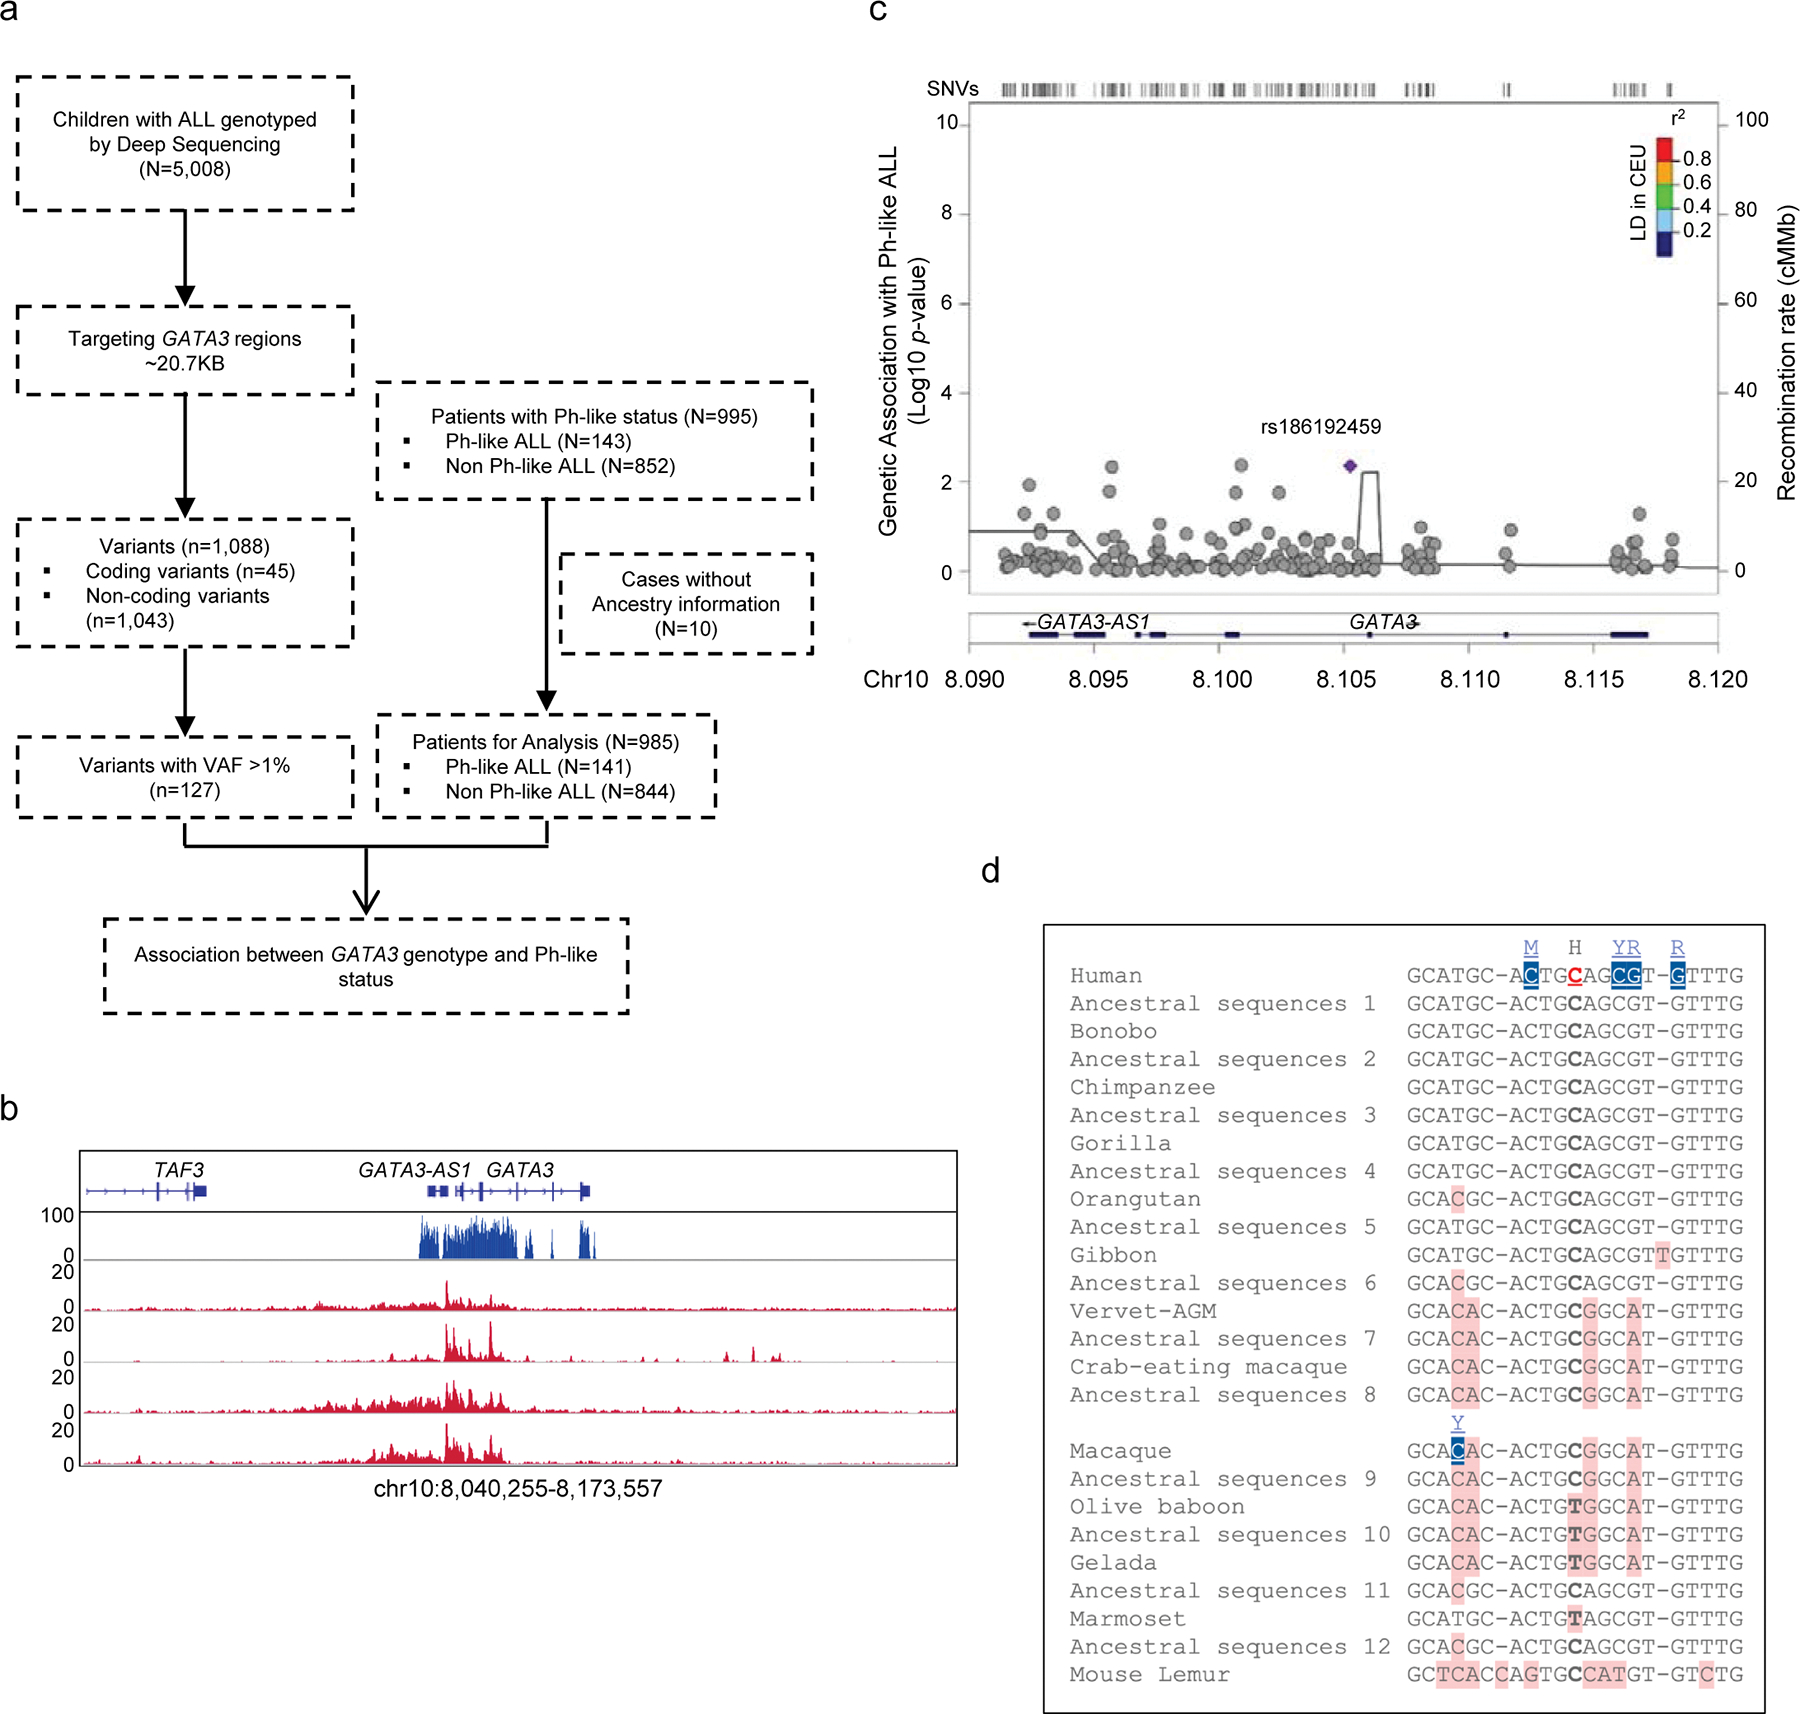
a, Flow chart of Ph-like ALL risk variant discovery. GATA3 variants were identified from 5,008 children with ALL, of whom 995 patients were examined for Ph-like subtype (143 Ph-like vs. 852 non-Ph-like ALL). A total of 127 variants with sufficient frequency were subjected to association test in this subset. b, Read density and coverage of GATA3 targeted sequencing, including all open chromatin regions at this locus, based on ALL ATAC-Seq data, 3kb upstream of 5’UTR, and 1kb after 3’UTR. c, Multivariate analysis conditioning on rs3824662 revealed no independent signals for association with Ph-like ALL susceptibility at the GATA3 locus. d, rs3824662 WT C allele is ancestral to risk A alleles in 13 primates, using the EPO pipeline in ENSEMBL.
Extended Data Fig. 2. Histone modification mark, enhancer reporter assay, and ATAC-seq analysis to examine regulatory DNA element at the GATA3 locus and the effects of rs3824662 genotype in normal human tissues and cells as well as human ALL cell lines.
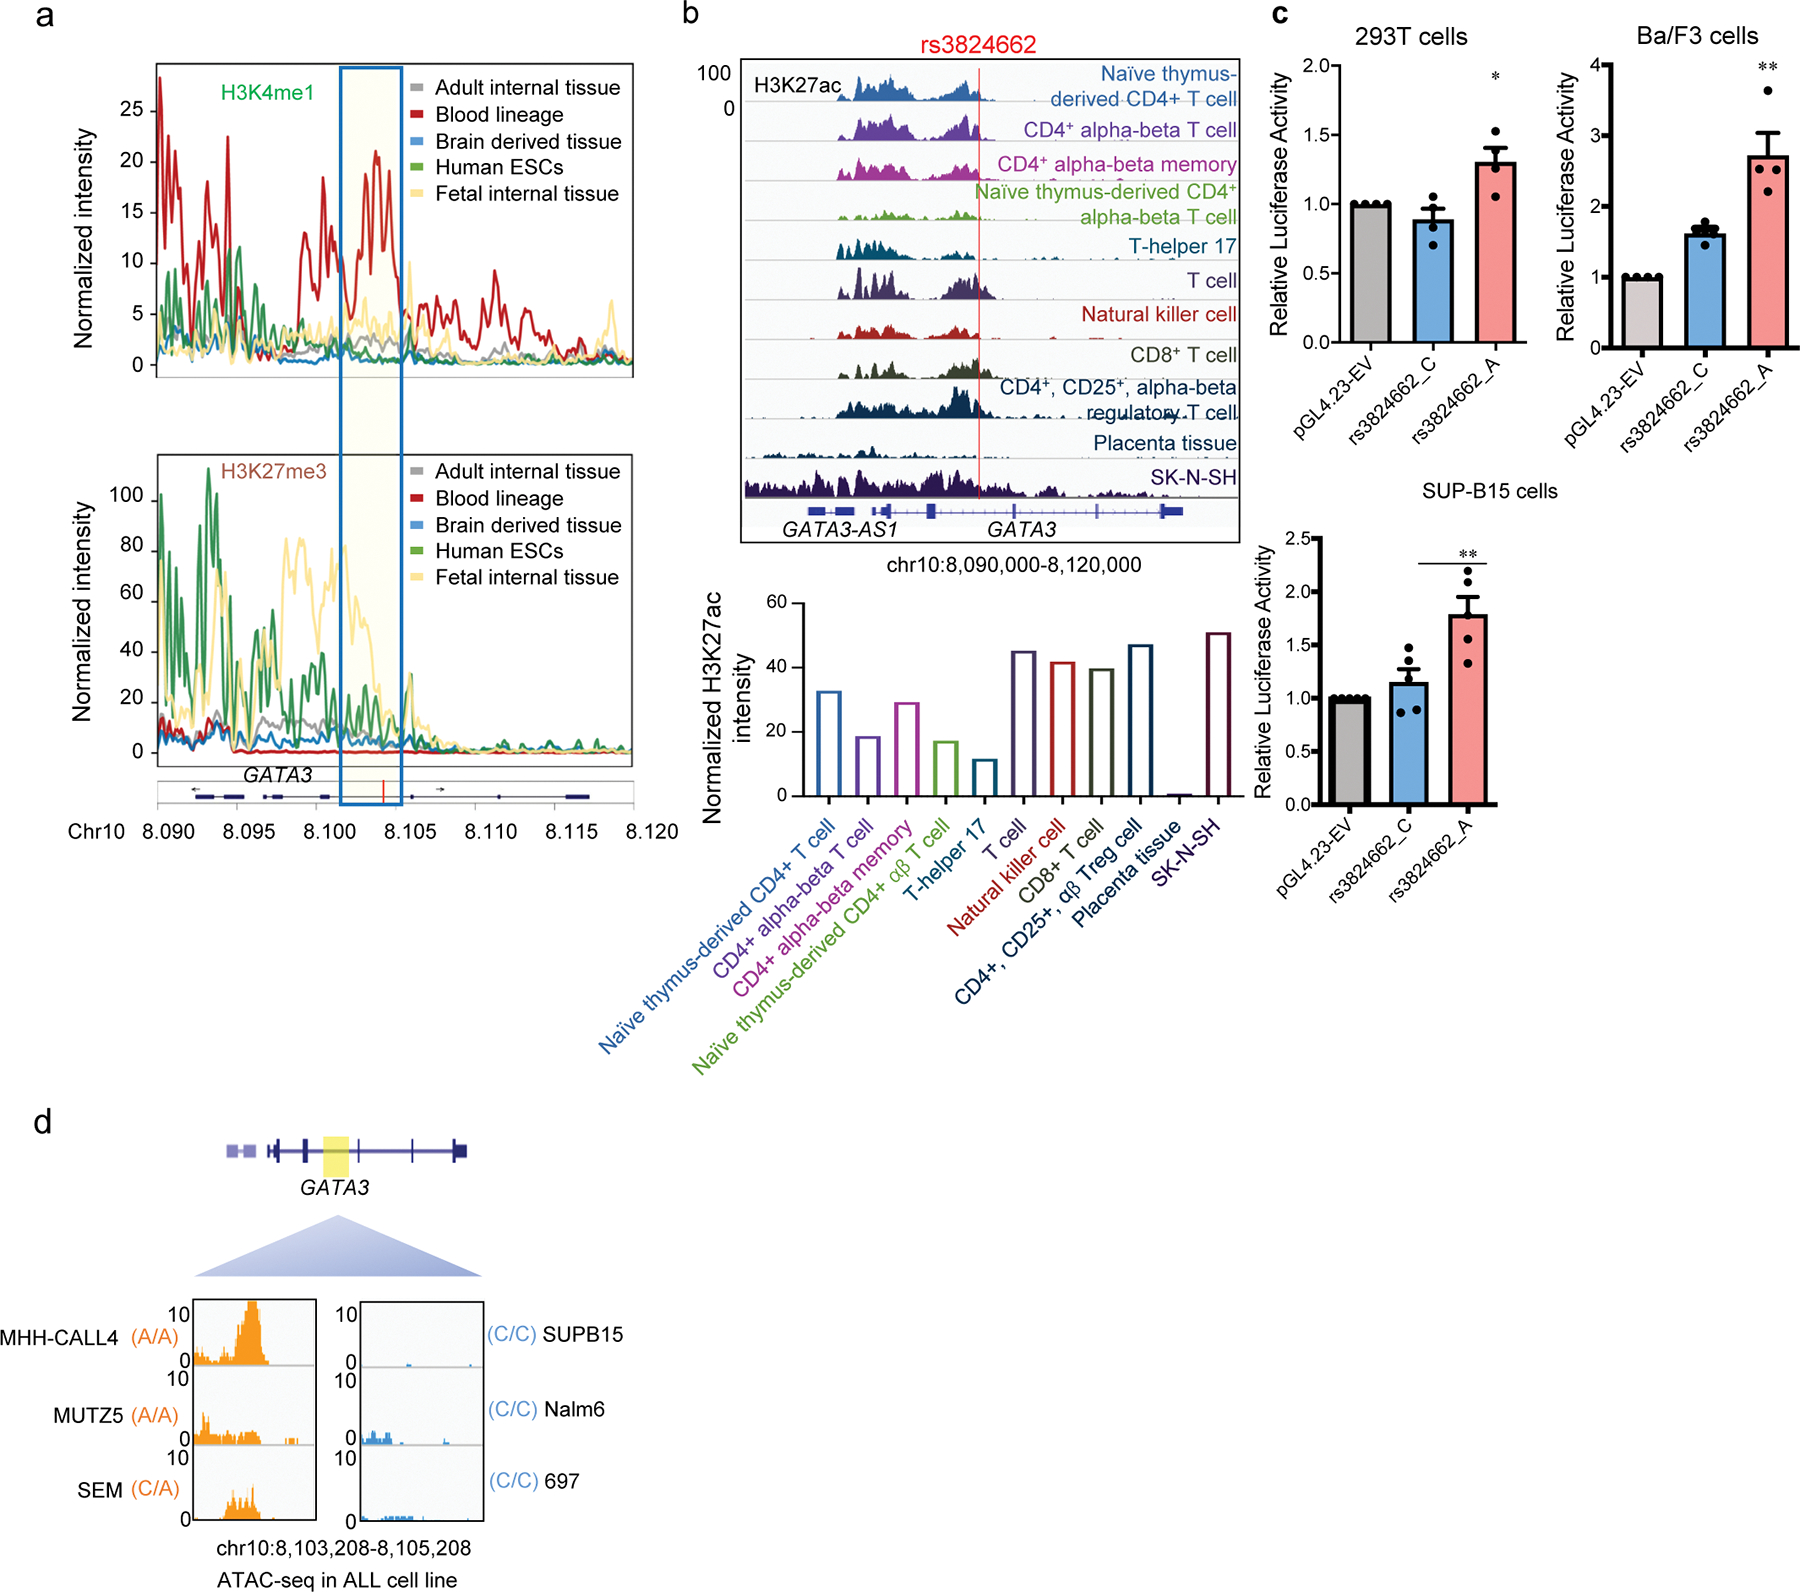
a, Normalized intensity of H3K4me1 and H3K27me3 signals at the GATA3 locus in 42 human tissues from the ROADMAP EPIGENOMICS data. Blue box indicates region encompassing rs3824662. b, H3K27ac signal of the rs3824662 locus in T cells based on ENCODE dataset. Up panel, genome browser snapshot for H3K27ac ChIP-seq signal of the rs3824662 locus in T cells. Bottom panel, the H2K27ac signal intensity of rs3824662 locus (+/− 500 bp) in T cells. c, Luciferase reporter activity comparing enhancer activities of the genomic fragments with either the rs3824662 A allele or wildtype C allele in human 293T cell(n=4), mouse Ba/F3 cell (n=4), and human ALL cell line SUP-B15(n=4). (Two-sided unpaired t-test: p value = 0.03599 for 293T; p value =0.0138 for Ba/F3; p value =0.0136 for SUP-B15). Data are presented as mean values +/− SEM. d, Open chromatin status at the rs3824662 locus (determined using ATAC-seq) in ALL cell lines representative of different molecular subtypes. The window represents a 2kb region flanking rs3824662. MHH-CALL4 and MUZT5 are CRLF2-rearranged with the A/A genotype at rs3824662; SEM is KMT2A-rearranged and with the C/A genotype, and the other three ALL cell lines have wildtype C/C genotype (SUPB15 is BCR-ABL1 ALL, Nalm6 is DUX4-rearranged, and 697 is TCF3-PBX1 ALL).
Extended Data Fig. 3. Knock-in of the rs3824662 risk A allele in GM12878 cell by using CRISPR/Cas9 editing.
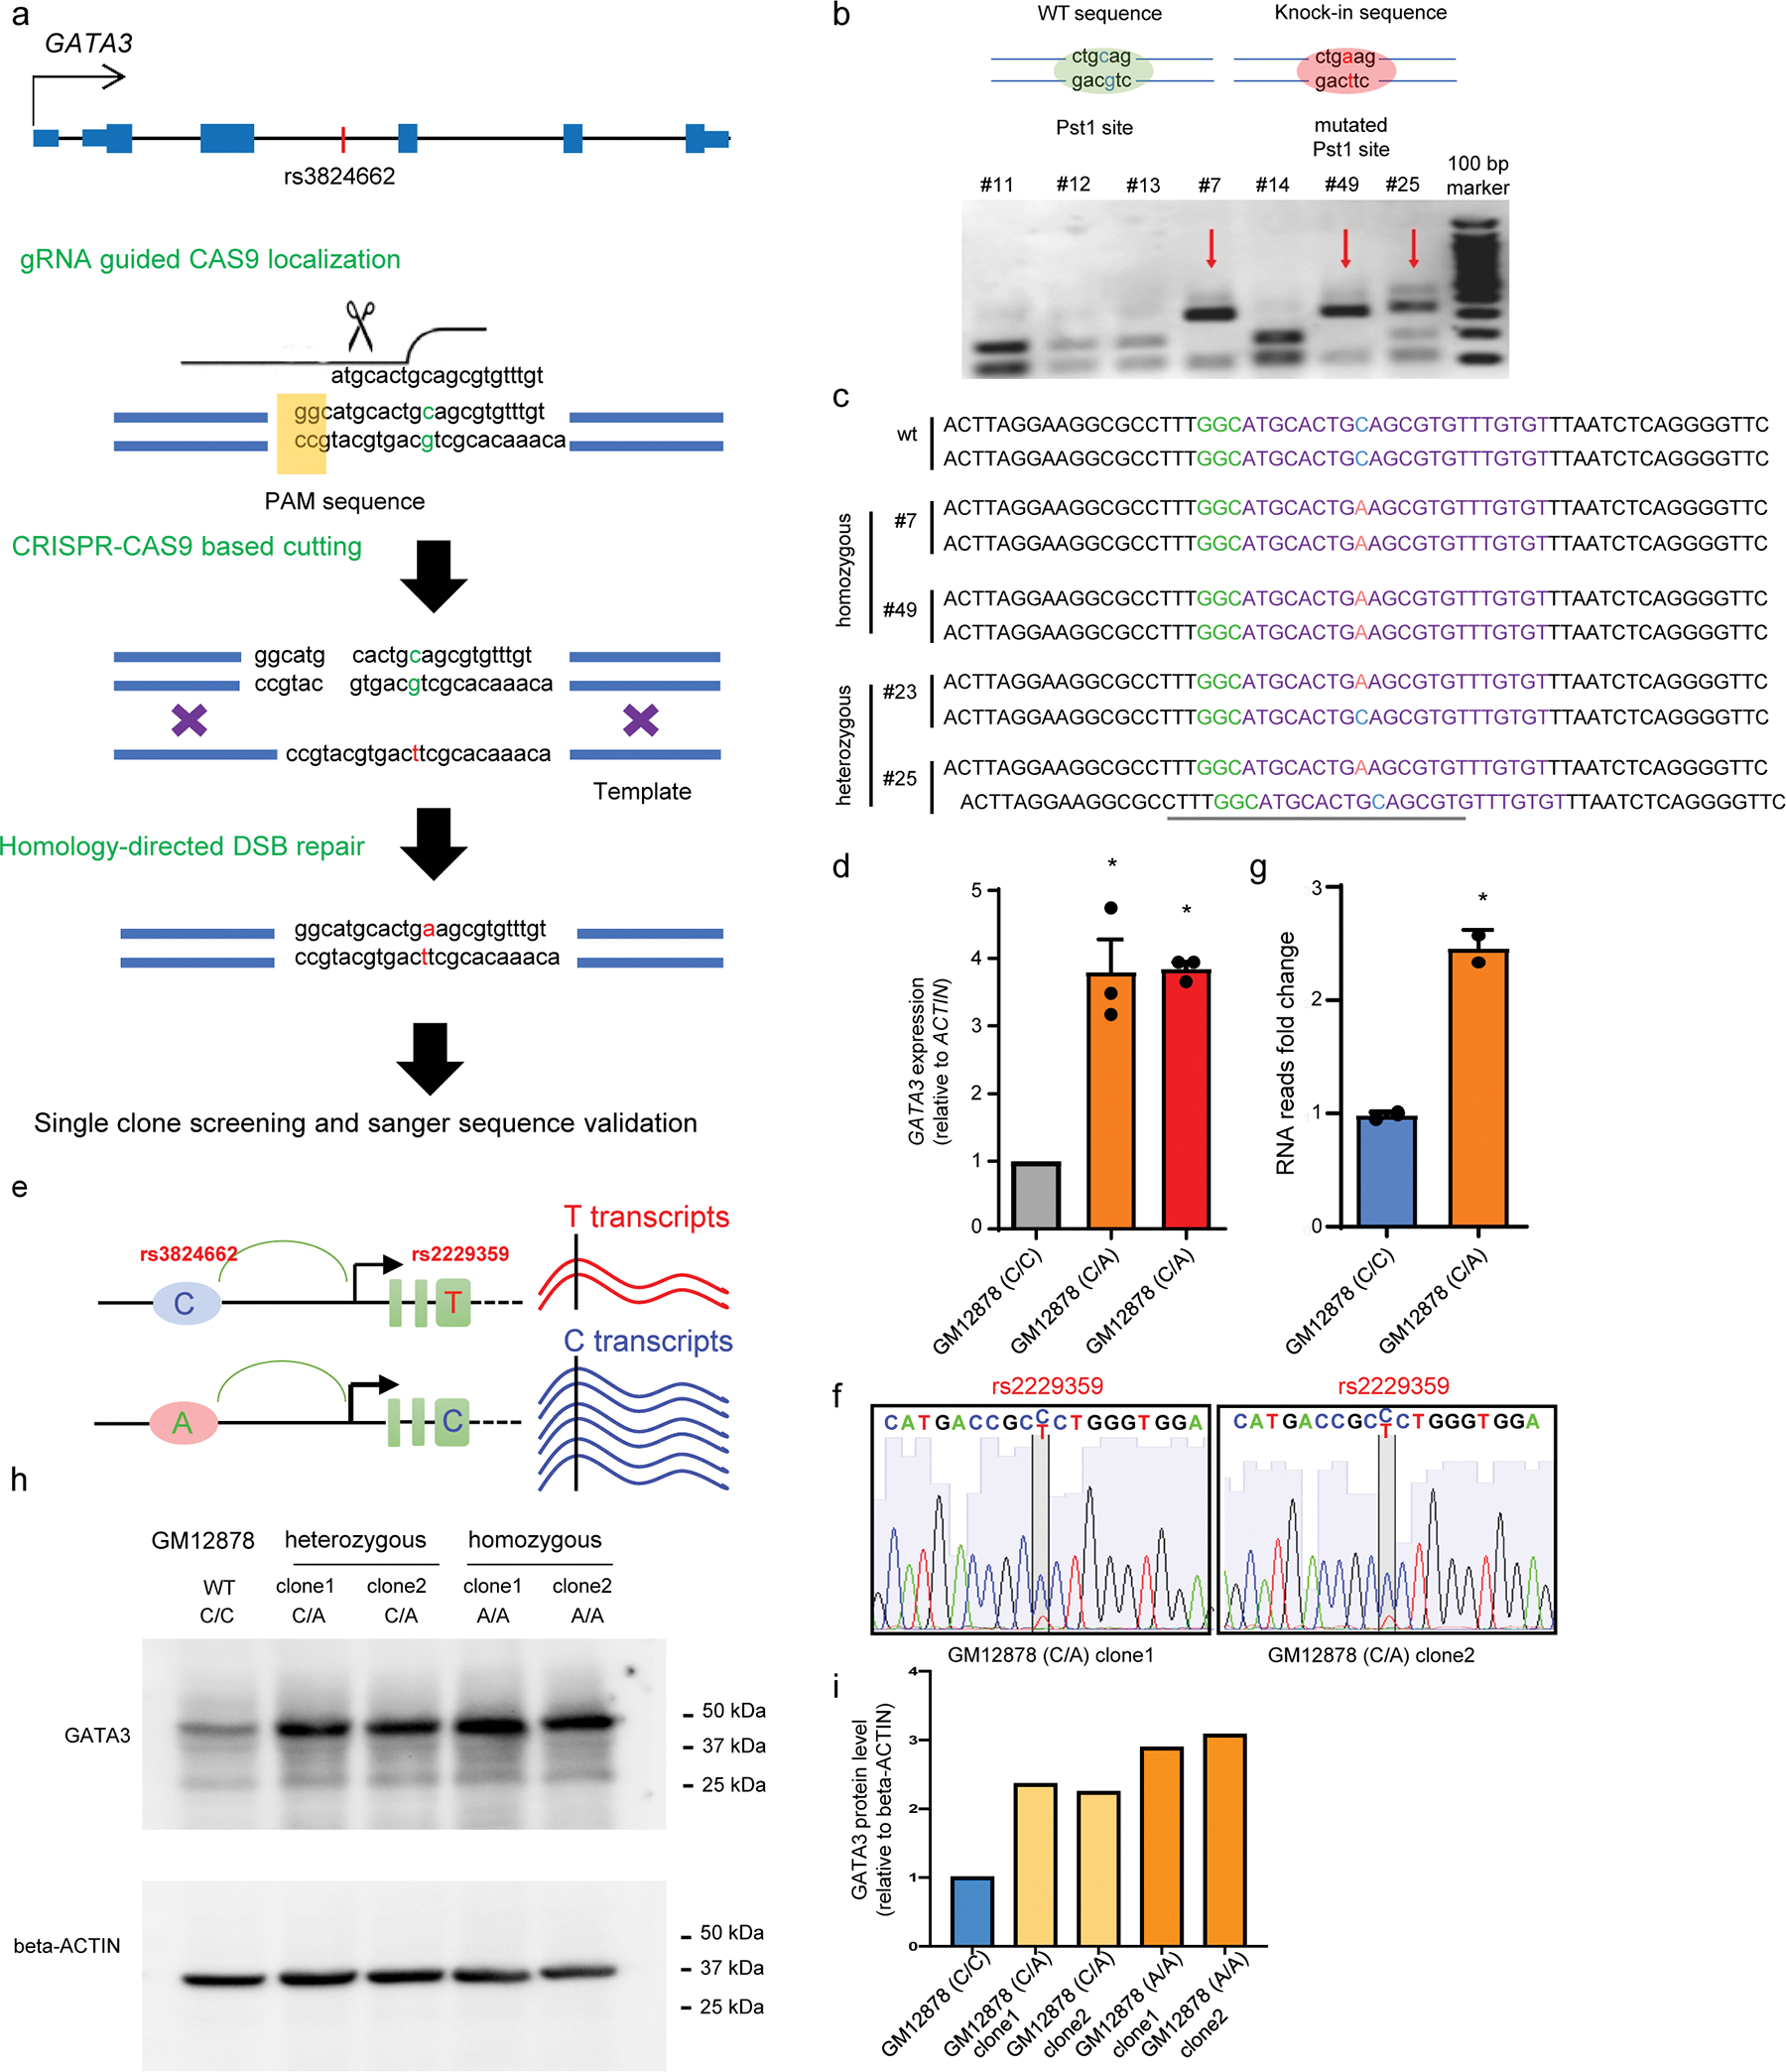
a, CRISPR design for knock-in. A 120nt template single-strand DNA containing rs3824662 A allele and flanking sequence was used as the donor for homology-directed repair with CRISPR-Cas9 induced cutting sites. b, Pst1 restriction enzyme is used to screen GM12878 clones with homozygous or heterozygous genotype at rs3824662. c, Sanger sequence results of four successful CRISPR knock-in GM12878 clones. Clones #7 and #49 had knock-in in both alleles; clones #23 and #25 had knock-in in one allele. Experiments were repeated three times independently with consistent results. d, Real time qPCR of GATA3 expression in engineered GM12878 cells with wildtype, heterozygous, or homozygous genotype(n=3) at rs3824662 (p-value = 0.02826 for C/A clones and p-value = 0.001126 for A/A clones by two-sided unpaired t-test). Data are presented as mean values +/− SEM. e, Design and detection of allelic-bias on GATA3 gene expression in GM12878 heterozygous clones. GM12878 cells harbor a nonsynonymous variant (rs2229359 T/C) in GATA3 3rd exon, we performed PCR and Sanger sequencing and observed that the T allele at rs2229359 and A allele at rs3824662 are from the same allele. Therefore, allelic expression derived from rs2229359 would directly inform the differential transcription activation effects of the A vs. C allele at rs3824662 in engineered GM12878 clones. f, Sanger sequencing of PCR products of GATA3 3rd exon cDNA shows allelic expression of GATA3 in two GM12878 heterozygous clone cells by rs2229359 genotyping. g, Shows the transcription level associated with rs3824662-A allele vs. the transcript associated with wild type C allele (n=3) (p value =0.0066 by two-sided unpaired t-test). Data are presented as mean values +/− SEM. h, Western blot of GATA3 and beta-ACTIN in GM12878 wildtype, heterozygous and homozygous clones. Experiments were repeated three times independently with similar results. i, bar plot of relative quantitative value of figure h.
Extended Data Fig. 4. GATA3 expression pattern in childhood ALL and NFIC binding in rs3824662 locus.
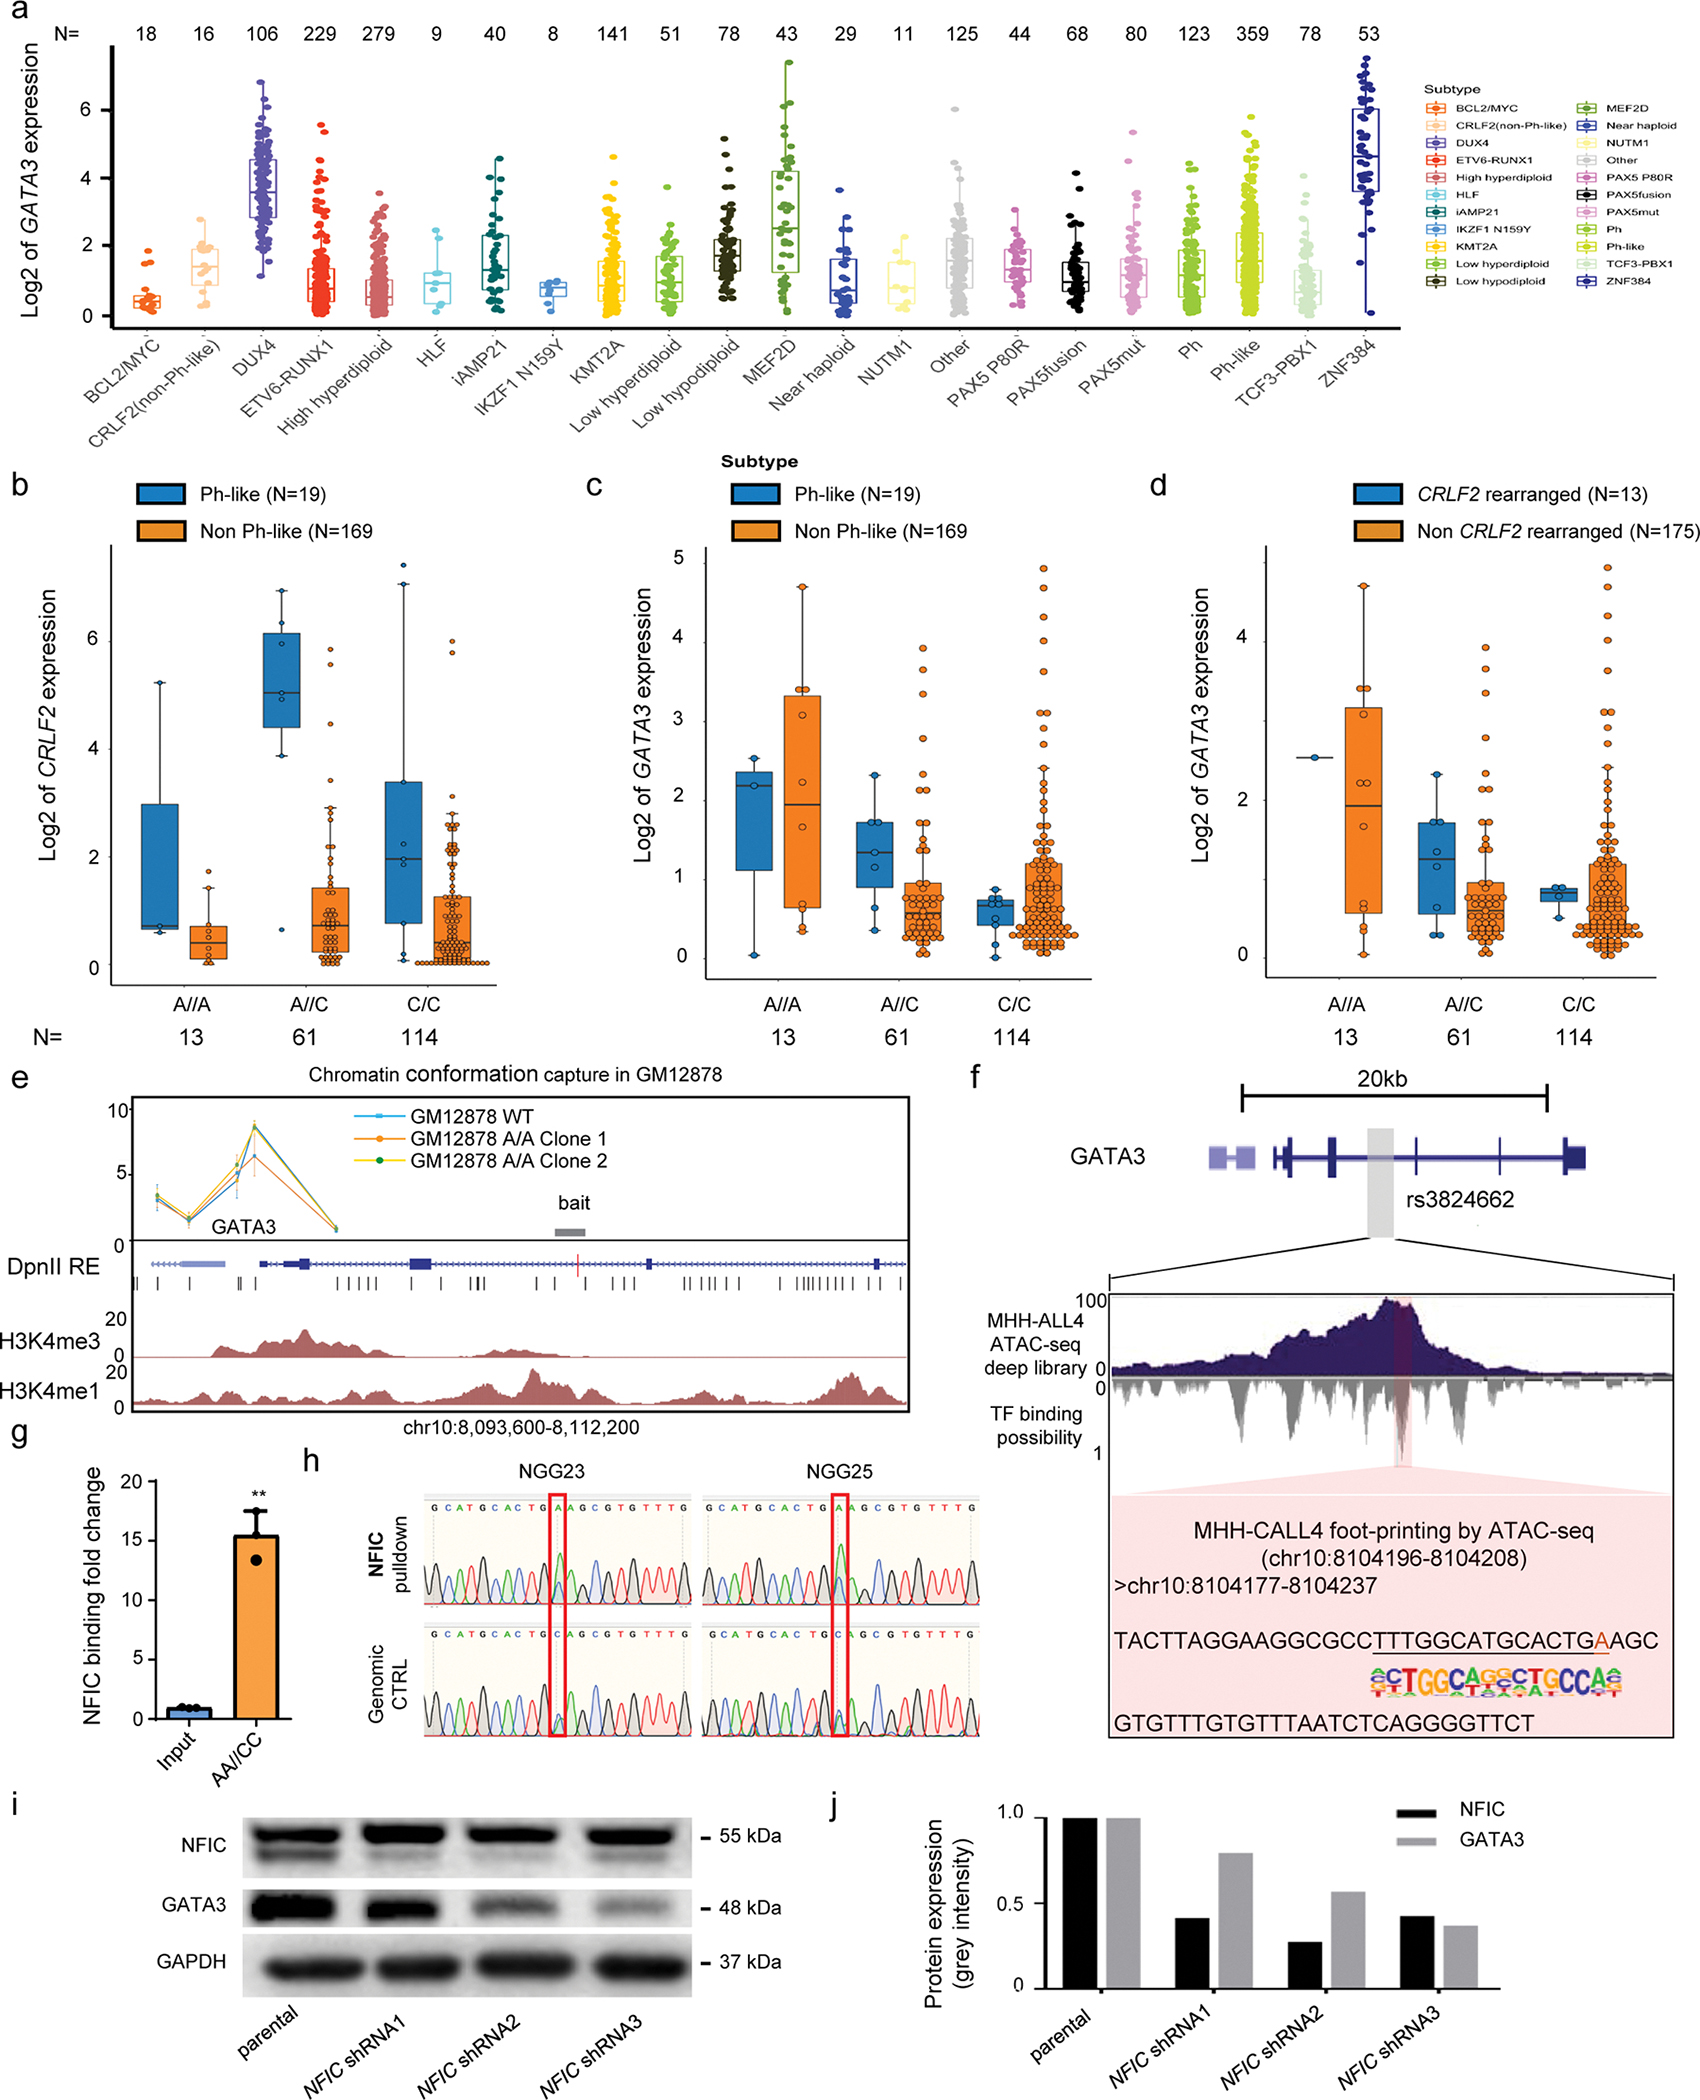
a, GATA3 expression varied significantly by ALL molecular subtypes, high in DUX4-rearranged, MEF2D-rearranged, Ph-like and ZNF384 subgroup of ALL. b, GATA3 expression by rs3824662 genotype in Ph-like ALL or non-Ph-like ALL patients, based on RNA-seq data. c, CRLF2 expression by rs3824662 genotype in Ph-like ALL or non-Ph-like ALL patients, based on RNA-seq data. d, RNA-seq data showed GATA3 expression level in Ph-like ALL with vs without CRLF2 rearrangements. All gene expression values were derived from the ALL RNA-seq dataset previously described in Gu et al., Nat Genet 2019 51:296. For box plots, the horizontal line shows the median, the box encompasses the interquartile range, and whiskers extend to 5th and 95th percentiles. e, chromatin conformation capture analysis (3C) of the GATA3 locus. With bait targeting rs3824662, this region strongly interacted with GATA3 promoter(n=4). f, transcription factor NFIC preferentially binds to the A allele at rs3824662. Foot-printing analysis using ATAC-seq data showed that the NFIC binding motif is only identified in MHH-CALL4 cells (Ph-like ALL with A/A genotype at rs3824662), and absent in GM12878 cell line (WT for rs3824662). g, NFIC binding in engineered GM12878 cells with the A/A genotype (n=3) at rs3824662, relative to in GM12878 (C/C) cells(n=3), measured by ChIP-qPCR (p value =0.0003 by two-sided unpaired t-test). Data are presented as mean values +/− SEM. h, Sanger sequencing of ChIP-PCR products of NFIC Pulldown DNA showed allelic binding in two clone of engineered GM12878 with heterozygous genotype at rs3824662. In both cells, NFIC showed stronger binding to the A allele than the C allele. For boxplots, the horizontal line shows the median, the box encompasses the interquartile range, and whiskers extend to 5th and 95th percentiles. i, Western blot shows GATA3 protein level decreased upon shRNA-mediated NFIC knockdown. Experiments were repeated three times independently with similar results. j, bar plot of relative quantitative value of figure i.
Extended Data Fig. 5. rs3824662 A allele-induced GATA3 binding sites are devoid of nucleosomes and enriched in genomic regions encompassing Ph-like genes.
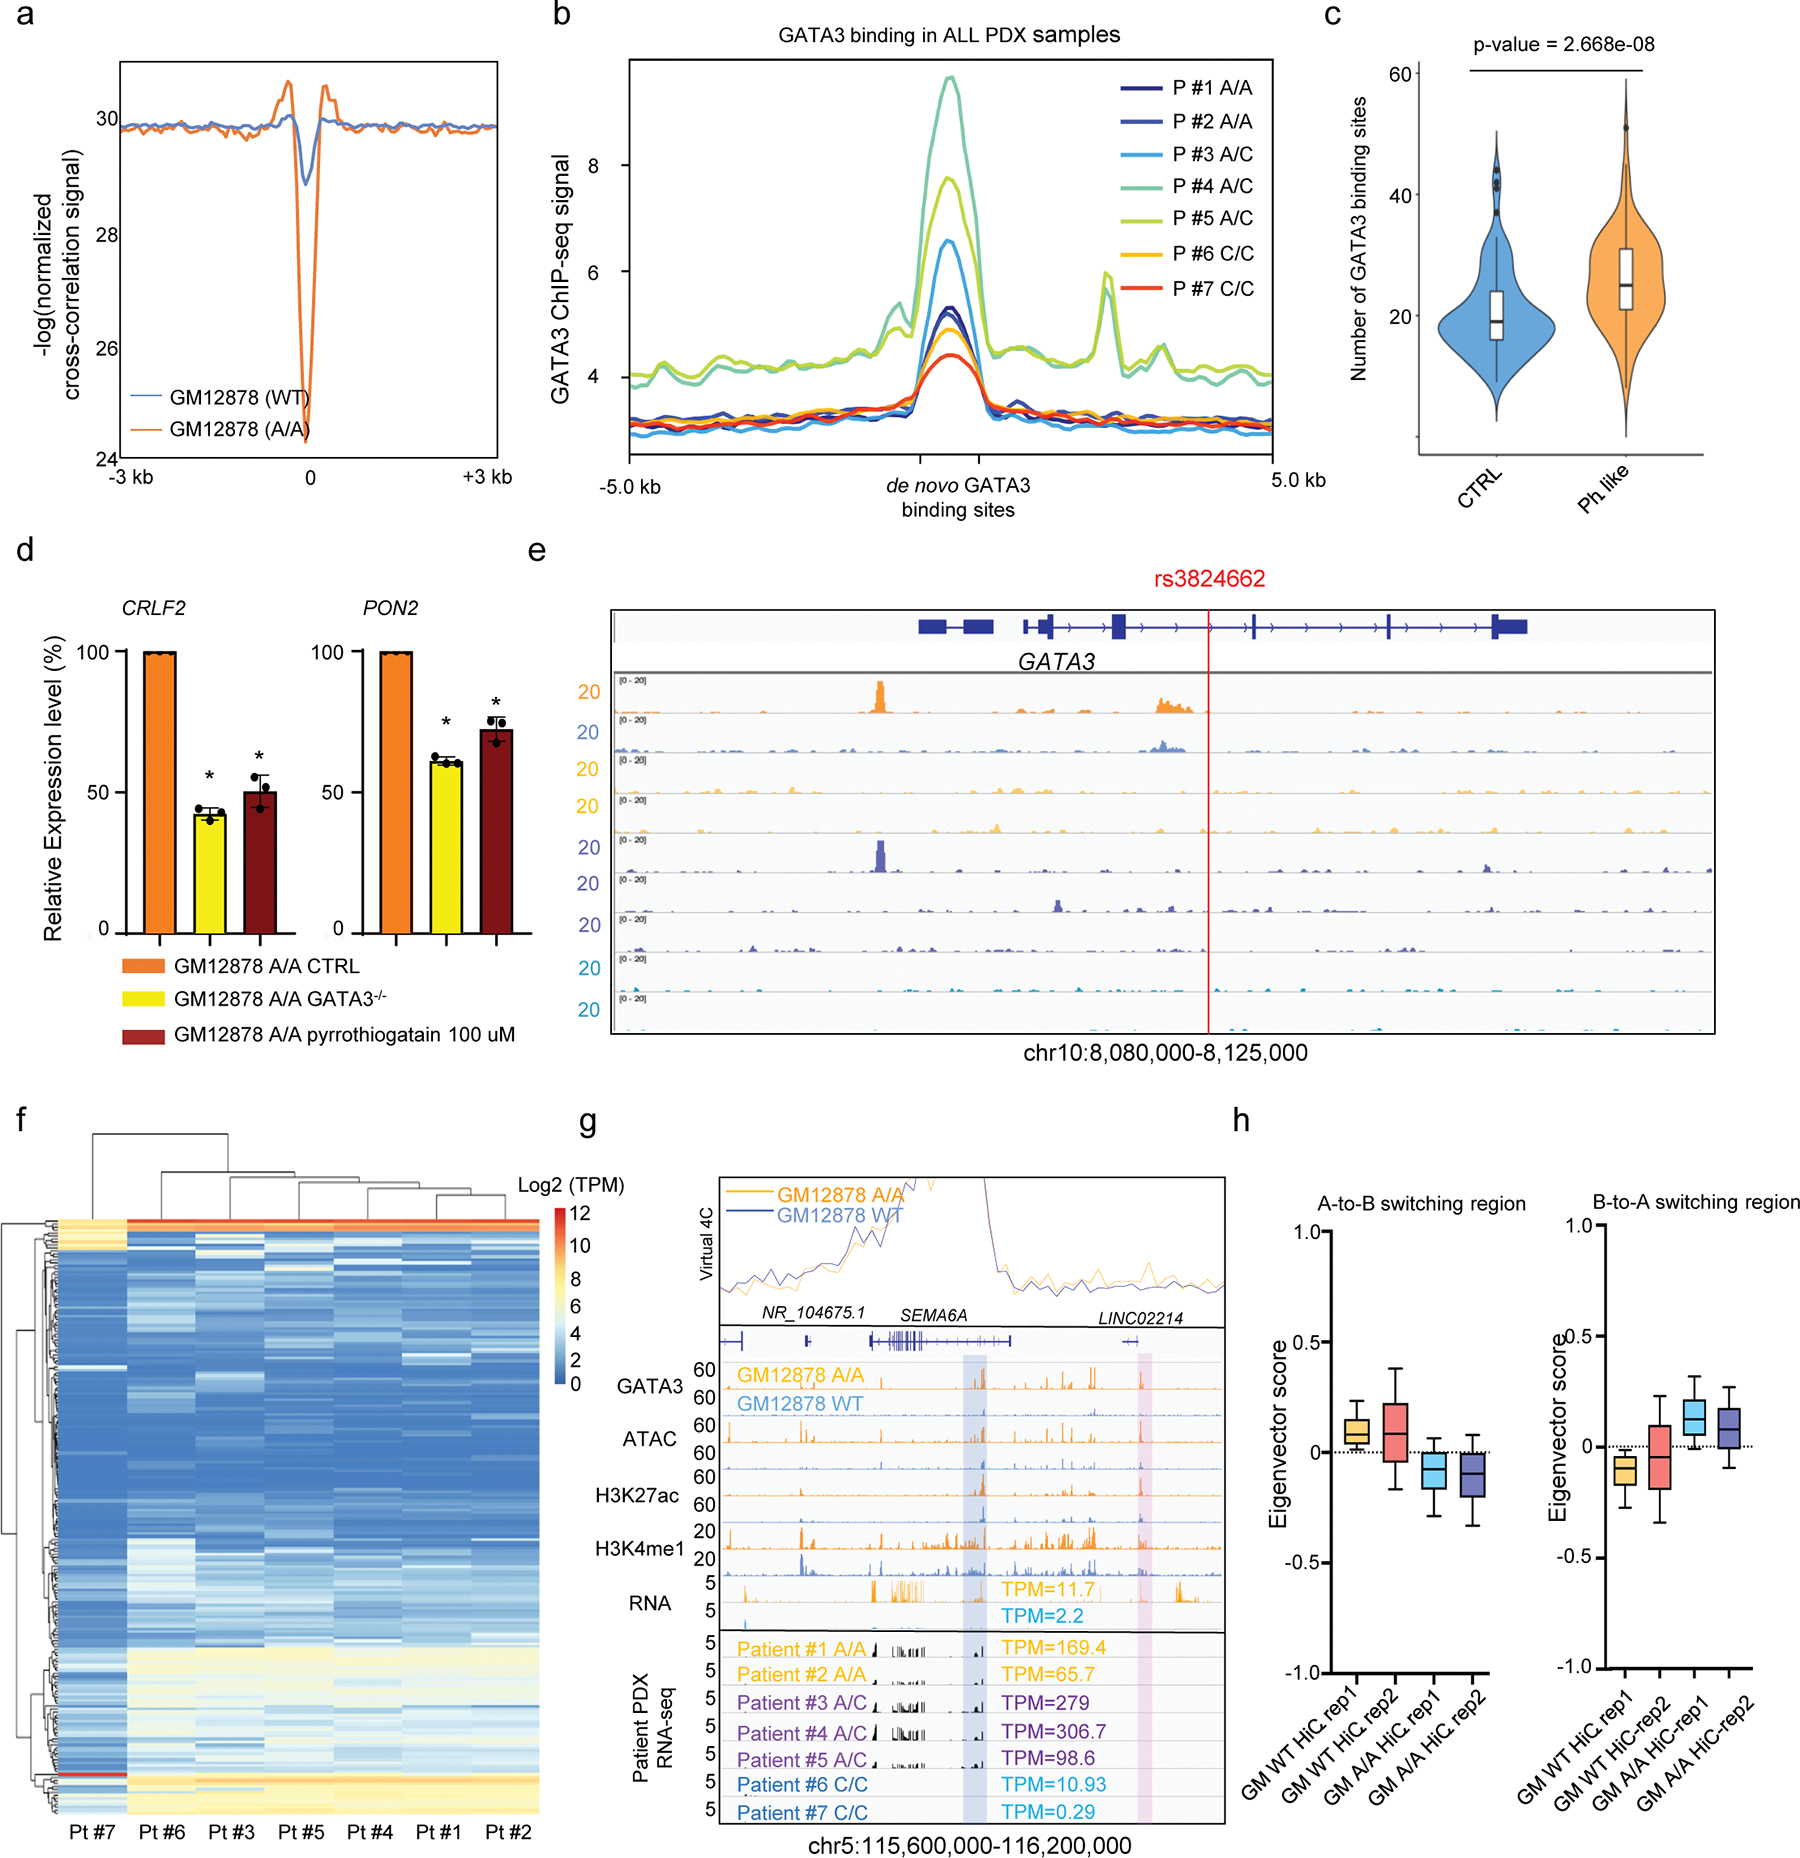
a, Nucleosome position surrounding GATA3 binding peaks in GM12878 (WT) and engineered GM12878 (A/A) cells. Y-axis indicates nucleosome position probability computed from ATAC-Seq and x-axis is the 6kb window for each GATA3 binding site. b, GATA3 ChIP-seq signal at 4,715 de novo GATA3 binding sites in ALL PDX samples of different rs3824662 genotypes. c, Enrichment of GATA3 binding in Ph-like ALL-related genes compared with genes randomly selected in the genome (n = 100, P value = 2.66×10−08 by two-sided Wilcoxon test) in engineered GM12878 (A/A) cells. Ph-like genes were defined as those most differentially expressed in this subtype than other ALL, as described previously (Roberts et al 2014). d, CRLF2 and PON2 expression level in GM12878 A/A cells(n=3) decreased upon GATA3 knockout or pyrrothiogatain treatment (two sided unpaired T test, p-value: CRLF2: 0.0044; 0.0005, PON2: 0.0005; 0.0080). Data are presented as mean +/− SEM. e, GATA3 ChIP-seq signals surrounding the GATA3 gene locus in GM12878 cells and ALL PDX samples. f, rs3824662 genotype influenced ALL expression pattern and A-B compartment switch. Global gene expression pattern (normalized TPM) in ALL PDX samples of different genotype at rs3824662 (k means = 100). g, Ph-like gene SEMA6A was highly expressed in engineered GM12878 (A/A) cells (upper panel) and ALL PDX samples with the A allele at rs3824662 (bottom panel). Blue bar indicates SEMA6A promoter as the bait for virtual 4C. Pink bar indicates its interacting enhancer (predicted by H3K27ac signal), in GM12878 A/A cells. h, Eigenvector score of genomics bins with A-to-B (left panel, n = 5,451) or B-to-A (right panel, n = 9,664) switch in GM12878 WT and A/A cell, as assessed by using Hi-C in replicates.
Extended Data Fig. 6. The function of rs3824662 risk A allele induced upregulated genes.
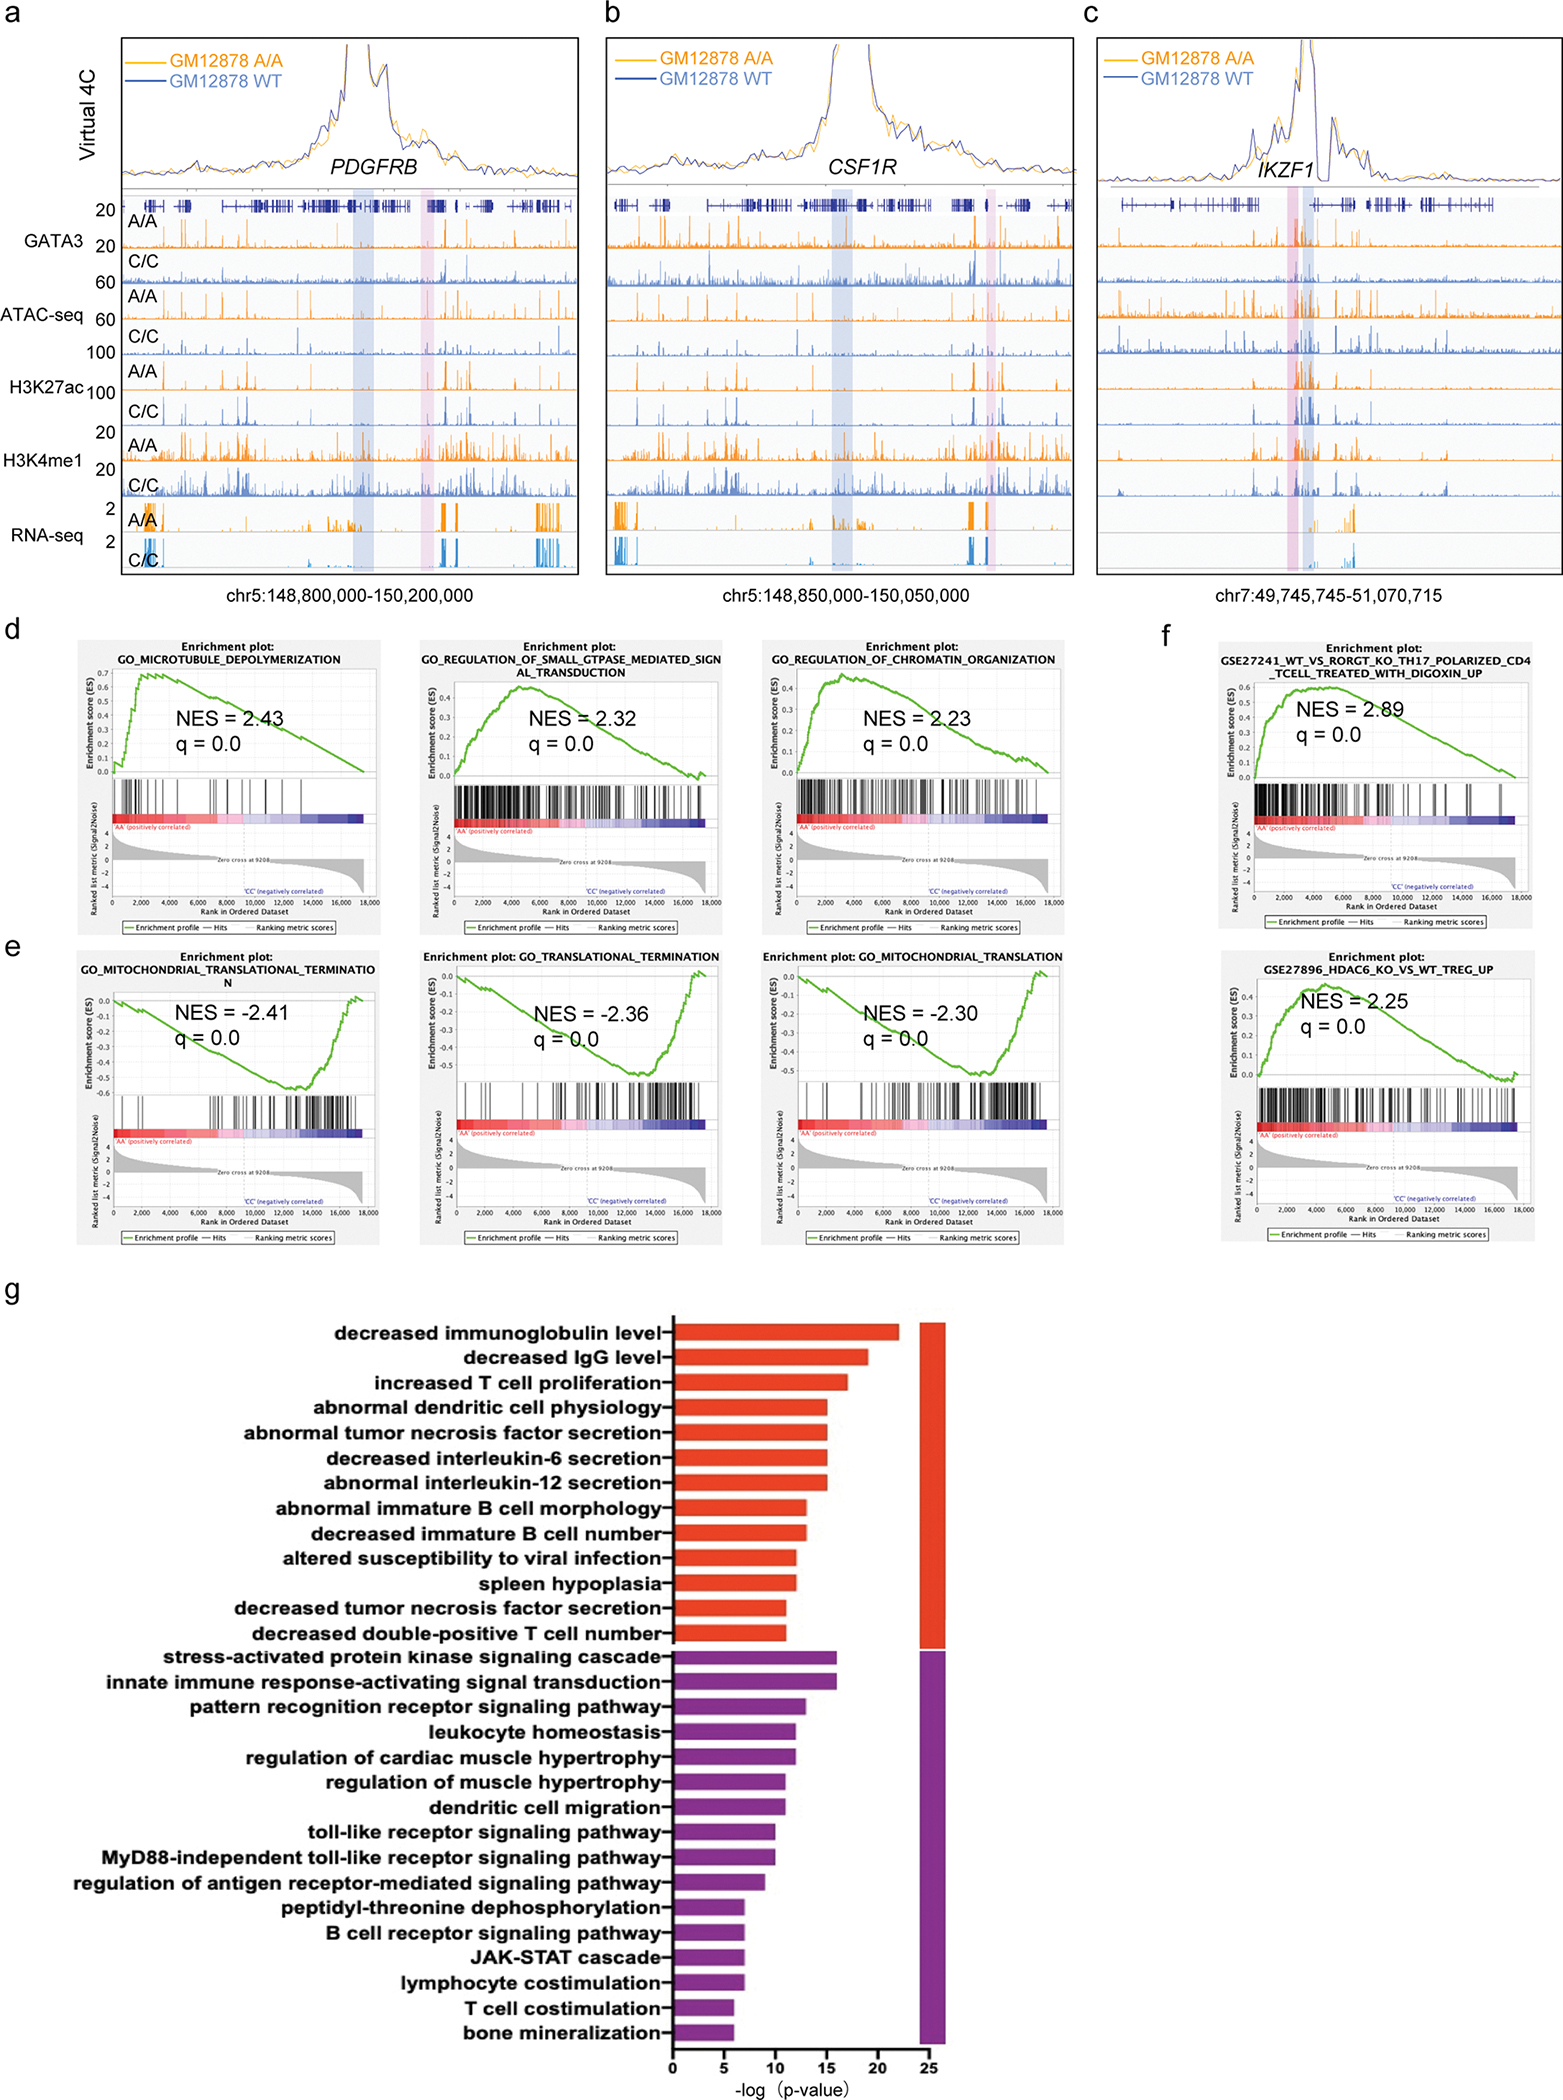
a-c, ATAC-seq, GATA3 ChIP-seq, H3K27AC and H3K4me1 ChIP-Seq, and RNA-seq in GM12878 (WT) and engineered GM12878 (A/A) cells at the PDGFRB (a), CSF1R (b) and IKZF1 (c) loci. Read densities (y axis) were normalized by sequencing depths. Blue bar indicates PDGFRB and CSF1R genes as the bait for virtual 4C. Pink bar indicates GATA3 binding in the inferred interacting enhancers in GM12878 A/A cells. d-f, gene Set Enrichment Analysis (GSEA) of differentially expressed genes (DEGs) between GM12878 cells with AA or CC genotype at rs3824662. The Molecular Signatures Database (MSigDB) was used for all pathway analyses. d, Enrichment for genes involved in microtubule organization, small GTPase and chromatin organization is notable within upregulated DEGs. e, Genes related to translocation termination and mitochondria translation were enriched in downregulated DEGs. f, Enrichment of T-cell function related gene sets in upregulated DEGs g, GREAT analysis of GATA3 binding sites in GM12878 A/A cells shows enrichment of genes related to T-cell proliferation, leukocyte homeostasis, cell migration, and JAK-STAT pathways.
Extended Data Fig. 7. 3D structure change induced by rs3824662 risk A allele.
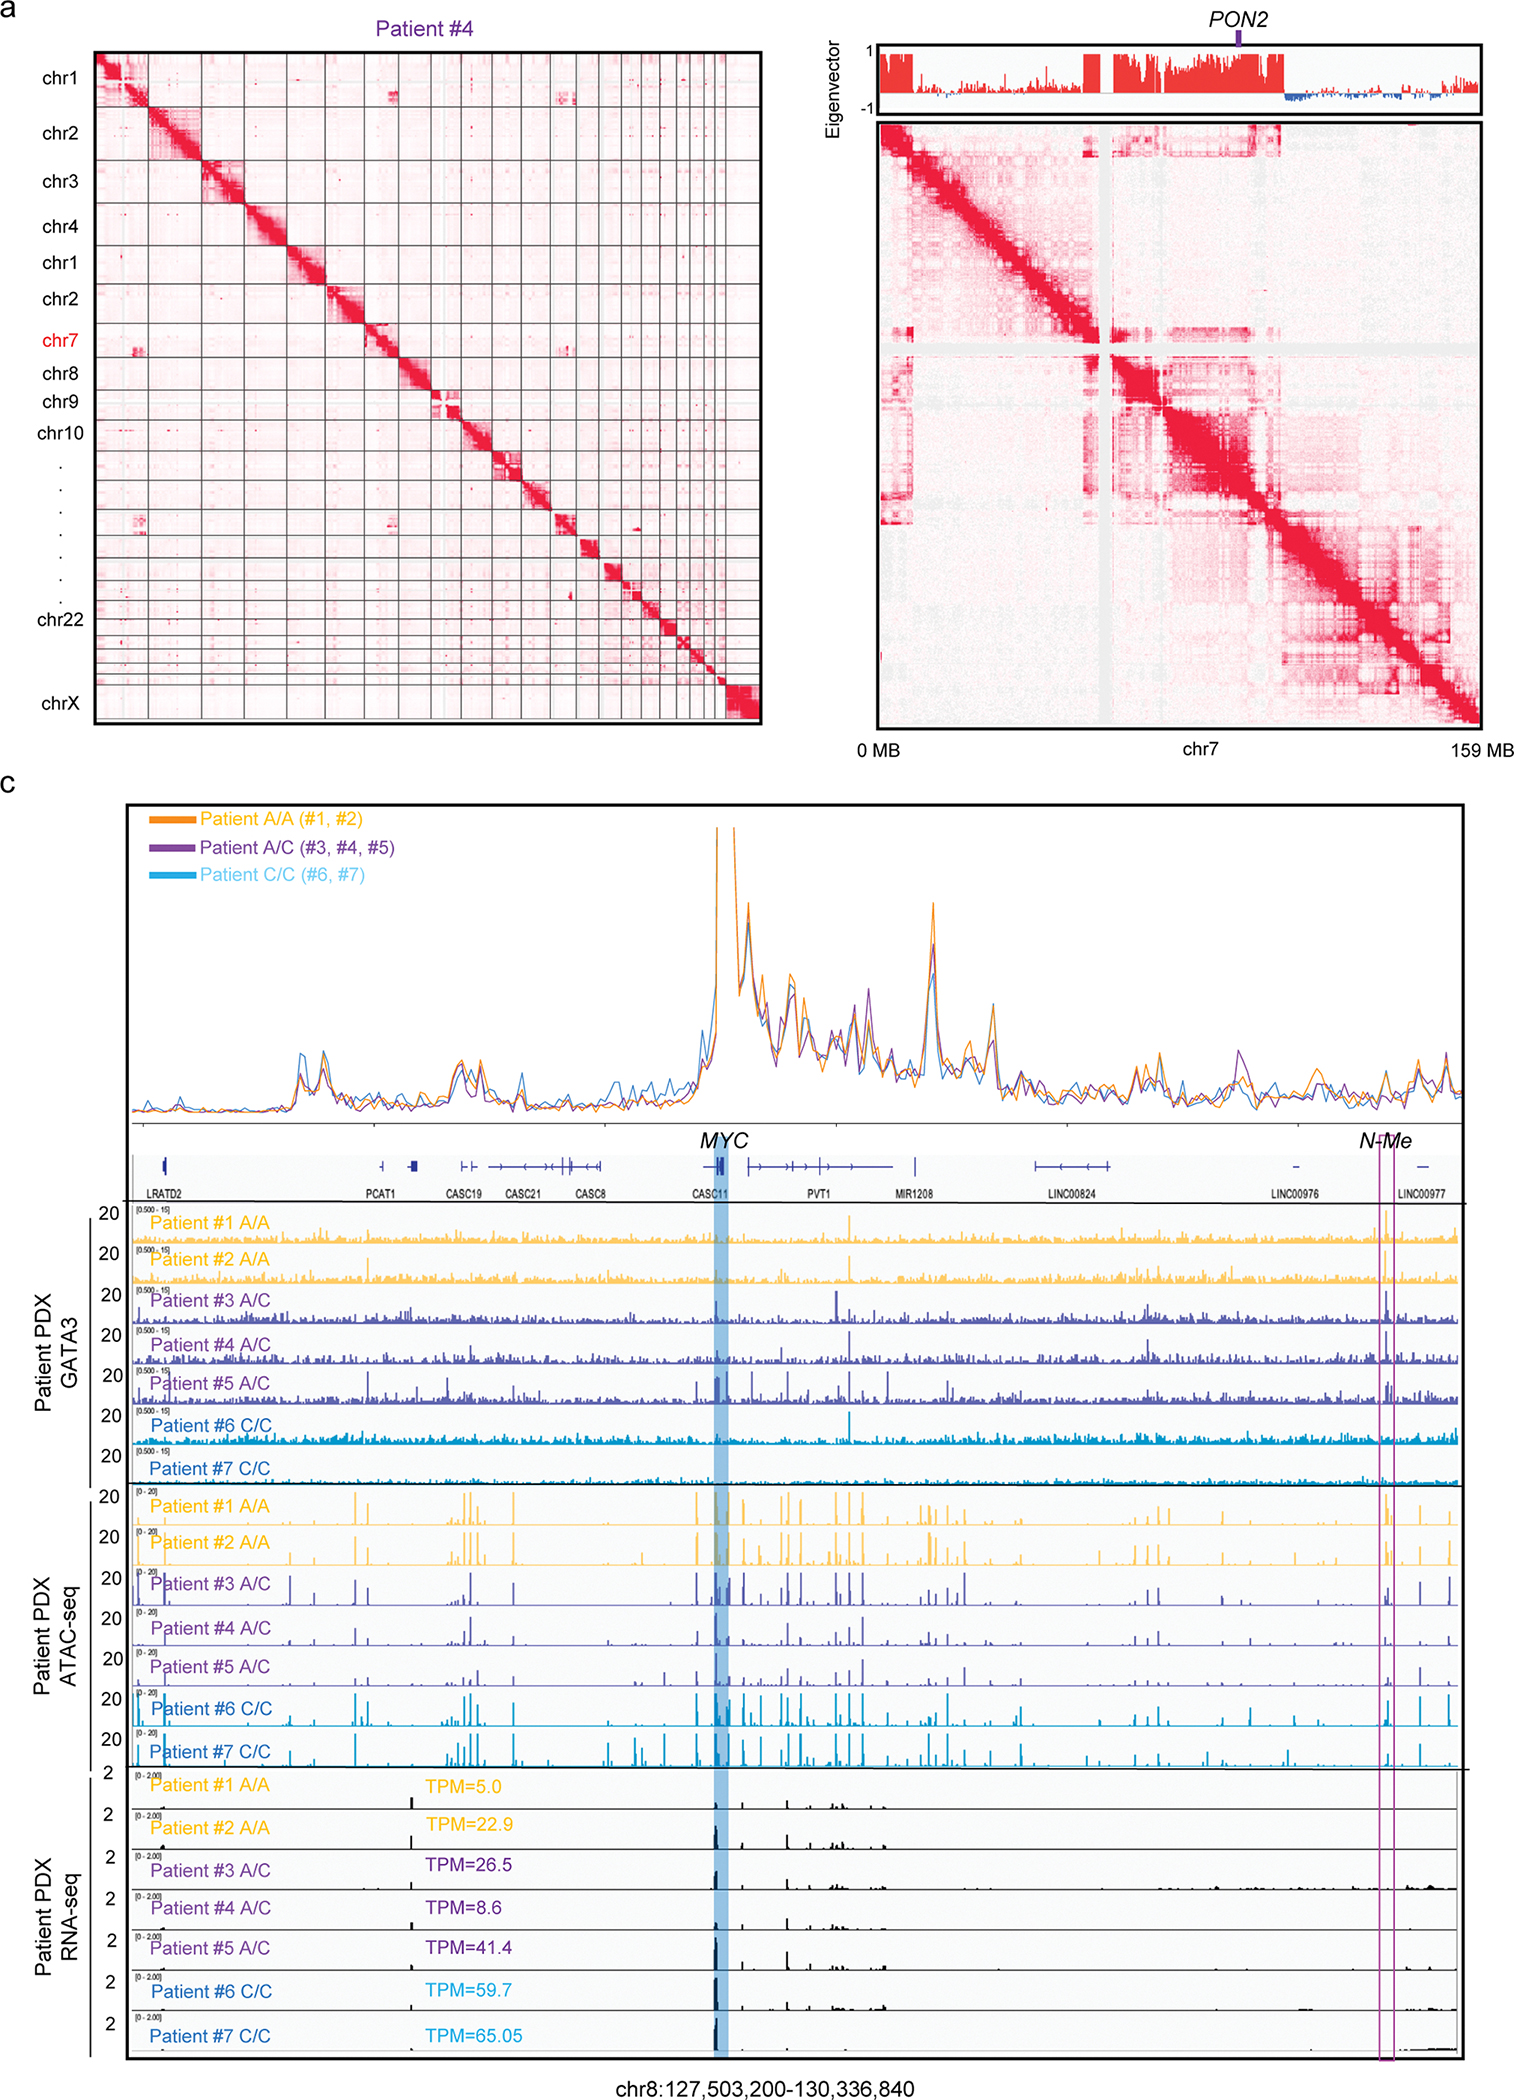
a-b, HiC-based inference of chromosomal translocations in ALL PDX samples. In Patient #4, both inter-chromosomal (a) and intra-chromosomal translocation events (b) were inferred as showed by Hi-C heatmap. Upper panel of b showed the abnormal compartment state in chr7 in this patient. c, Genome browser snapshot of GATA3 biding at the MYC locus with T-ALL specific N-Me enhancer in GM12878 and ALL PDX samples. Blue bar indicates MYC gene as the bait for virtual 4C. Purple hollow bar indicates N-Me region.
Extended Data Fig. 8. TAD and enhancer promoter looping structure in GM12878 (WT) and engineered GM12878 (A/A) cells.
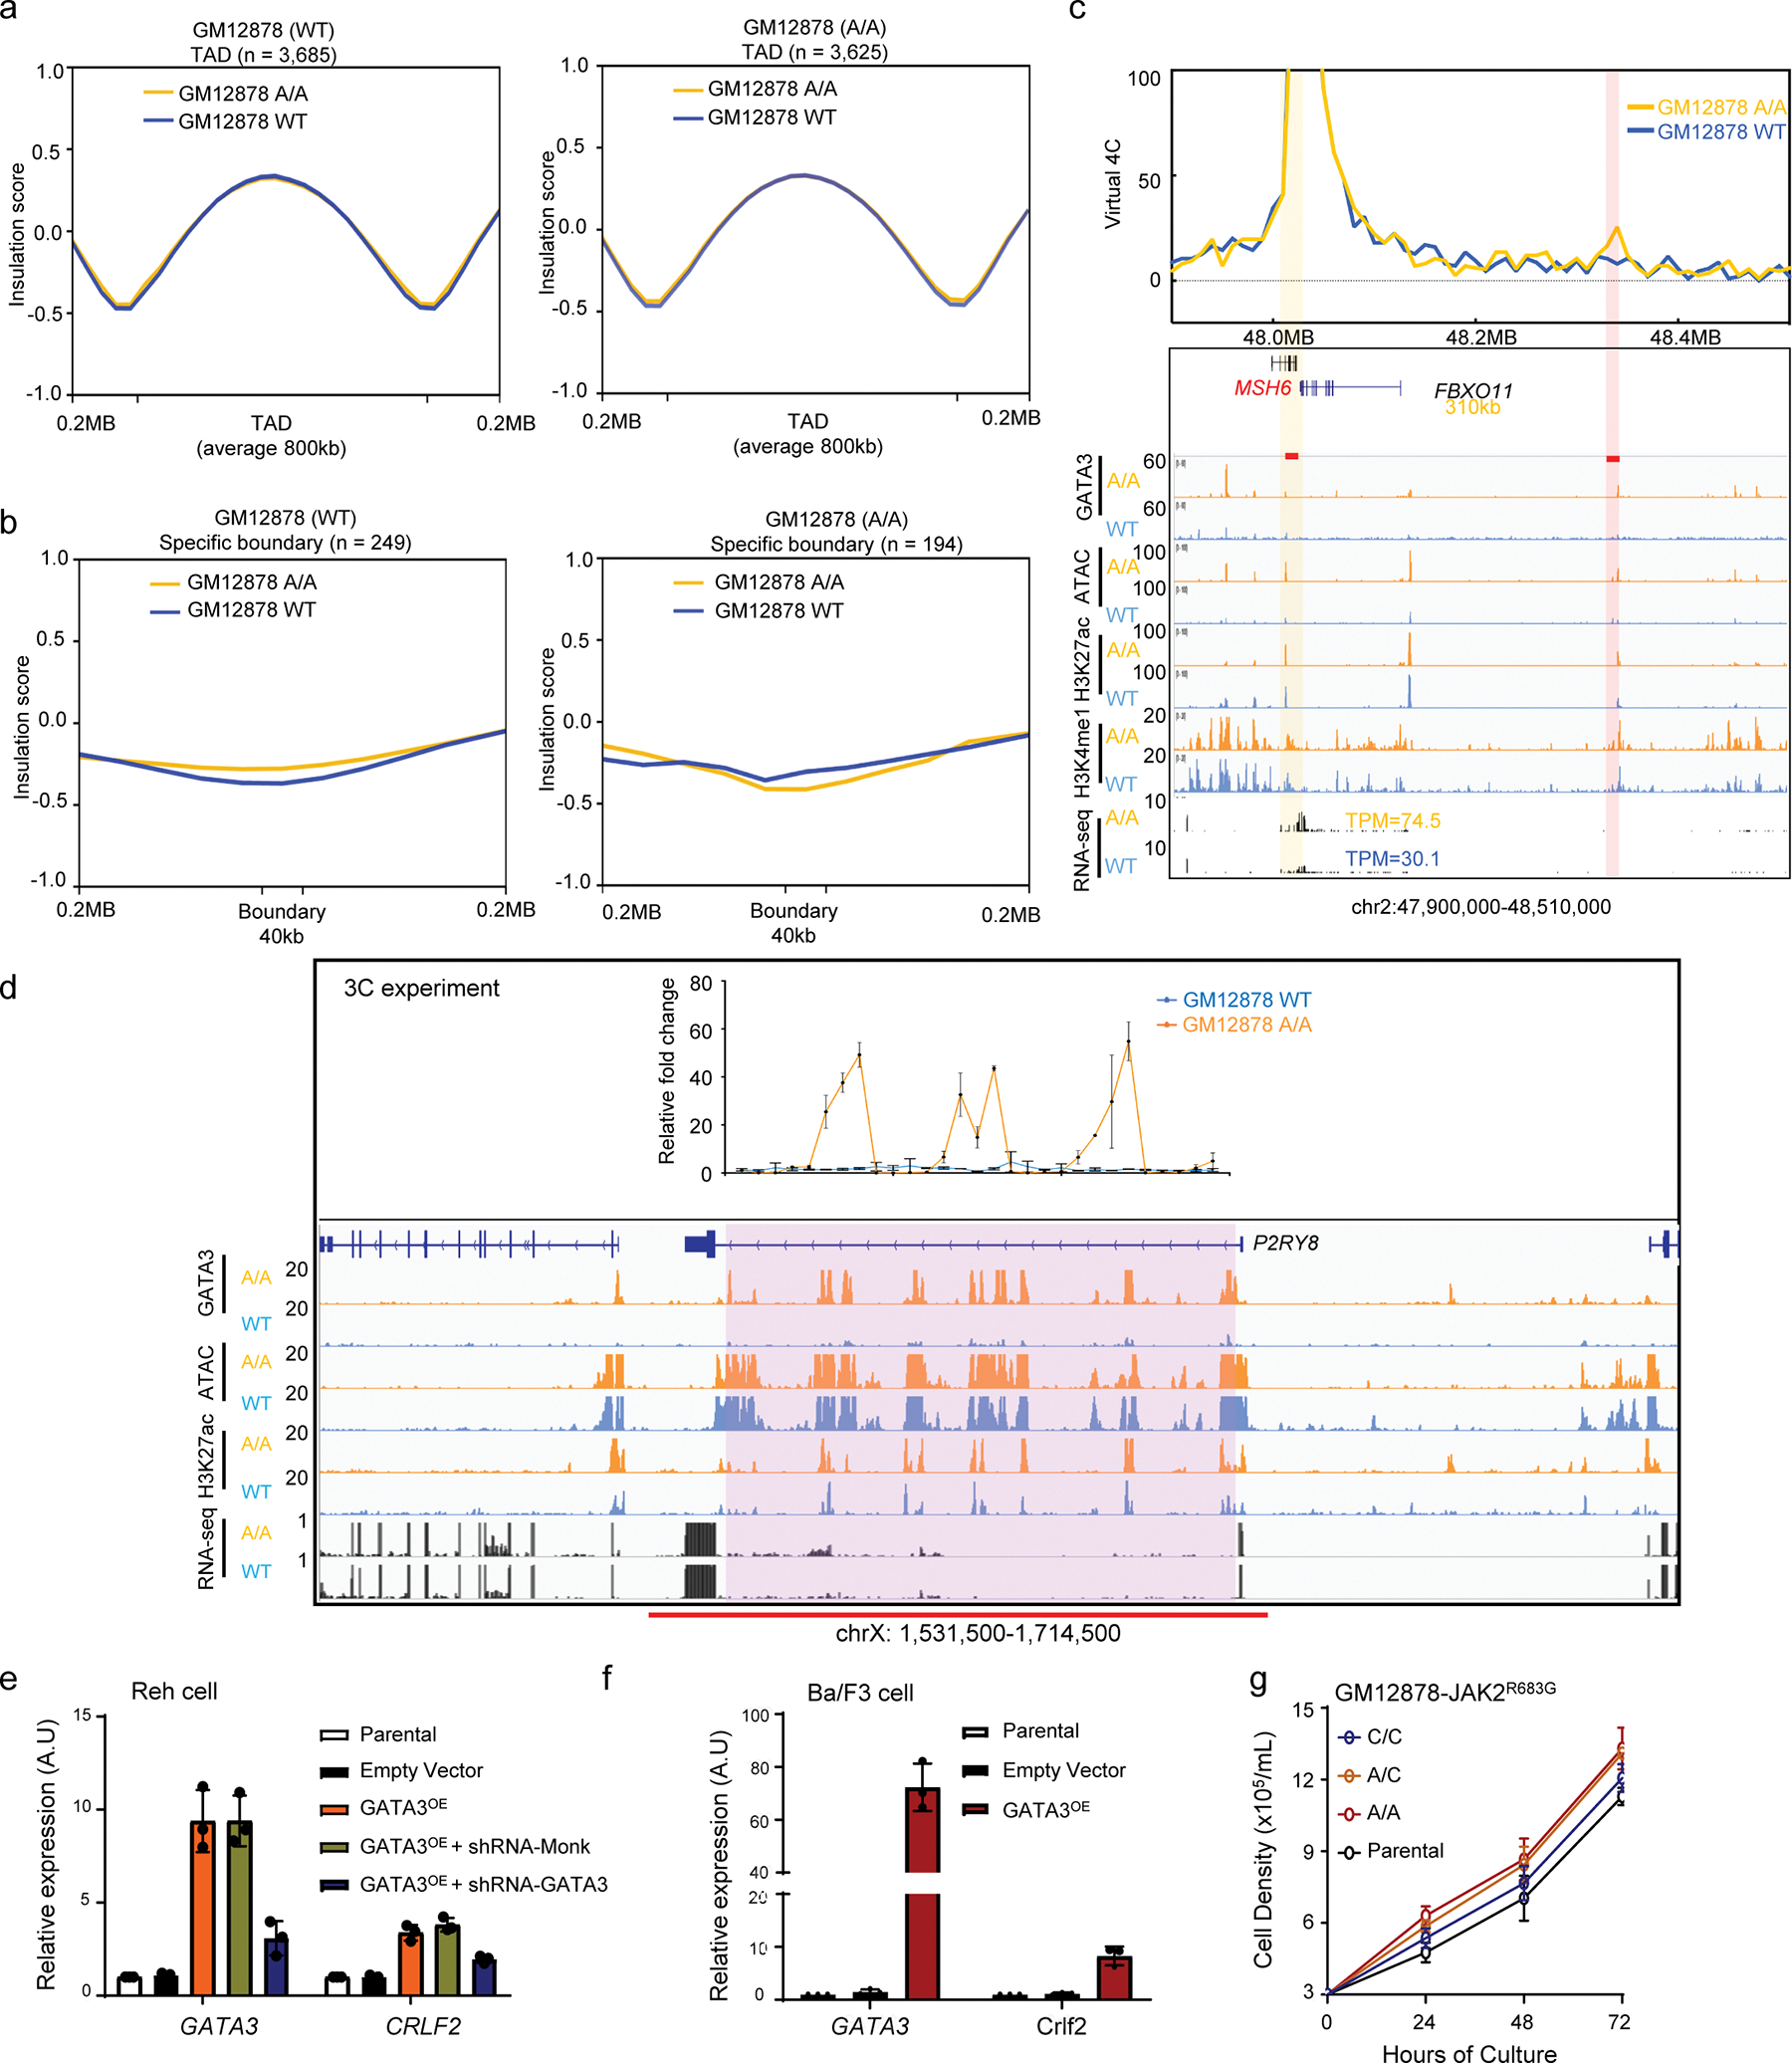
a, Average insulation score shows no significant difference in GM12878 cells with different rs3824662 genotype. Left panel: Insulation score from GM12878 (WT) Hi-C result (blue line) and engineered GM12878 (A/A) Hi-C result (yellow line) in GM12878 (WT) TADs. Right panel: Insulation score from GM12878 (WT) Hi-C result (blue line) and engineered GM12878 (A/A) Hi-C result (yellow line) in GM12878 (A/A) TADs. b, Average insulation score shows no significant difference in GM12878 (WT) Hi-C (blue line) and engineered GM12878 (A/A) Hi-C (yellow line) in GM12878 (WT) specific TAD boundaries. Left panel: Insulation score from GM12878 (WT) Hi-C (blue line) and GM12878 (A/A) Hi-C (yellow line) in GM12878 (WT) TAD boundaries. Right panel: Insulation score from GM12878 (WT) Hi-C (blue line) and GM12878 (A/A) Hi-C (yellow line) in GM12878 (A/A) TAD boundaries. c,Examples of how GATA3 binding influenced open chromatin status and chromatin looping. Virtual 4C analysis with 10kb resolution showed an A/A genotype-specific chromatin looping between MSH6 promoter (yellow bar) and a predicted enhancer 310kb away (pink bar) in engineered GM12878 (A/A) cells. d, 3C analyses showed the interaction frequency of each GATA3 binding sites in P2RY8 super enhancer (n=3). e, GATA3 overexpression drove upregulation of CRLF2 in ALL cell line REH (n=3, two-sided unpaired t-test, p-value: CRLF2, empty vs. GATA3OE= 0.007424, GATA3OE+shRNA-Mock vs. GATA3OE+shRNA-GATA3= 0.004278. Data are presented as mean +/− SEM. f, Similarly in mouse Ba/F3 cells, GATA3/Gata3 expression induced Crlf2 transcription (n=3, two-sided unpaired t-test, p-value= 0.01882). Data are presented as mean +/− SEM. g, Cell proliferation of GM12878 lines with different genotype at rs3824662 after transfection with JAK2R683G.
Extended Data Fig. 9. GATA3 binding and gene fusion in Ph-like ALL.
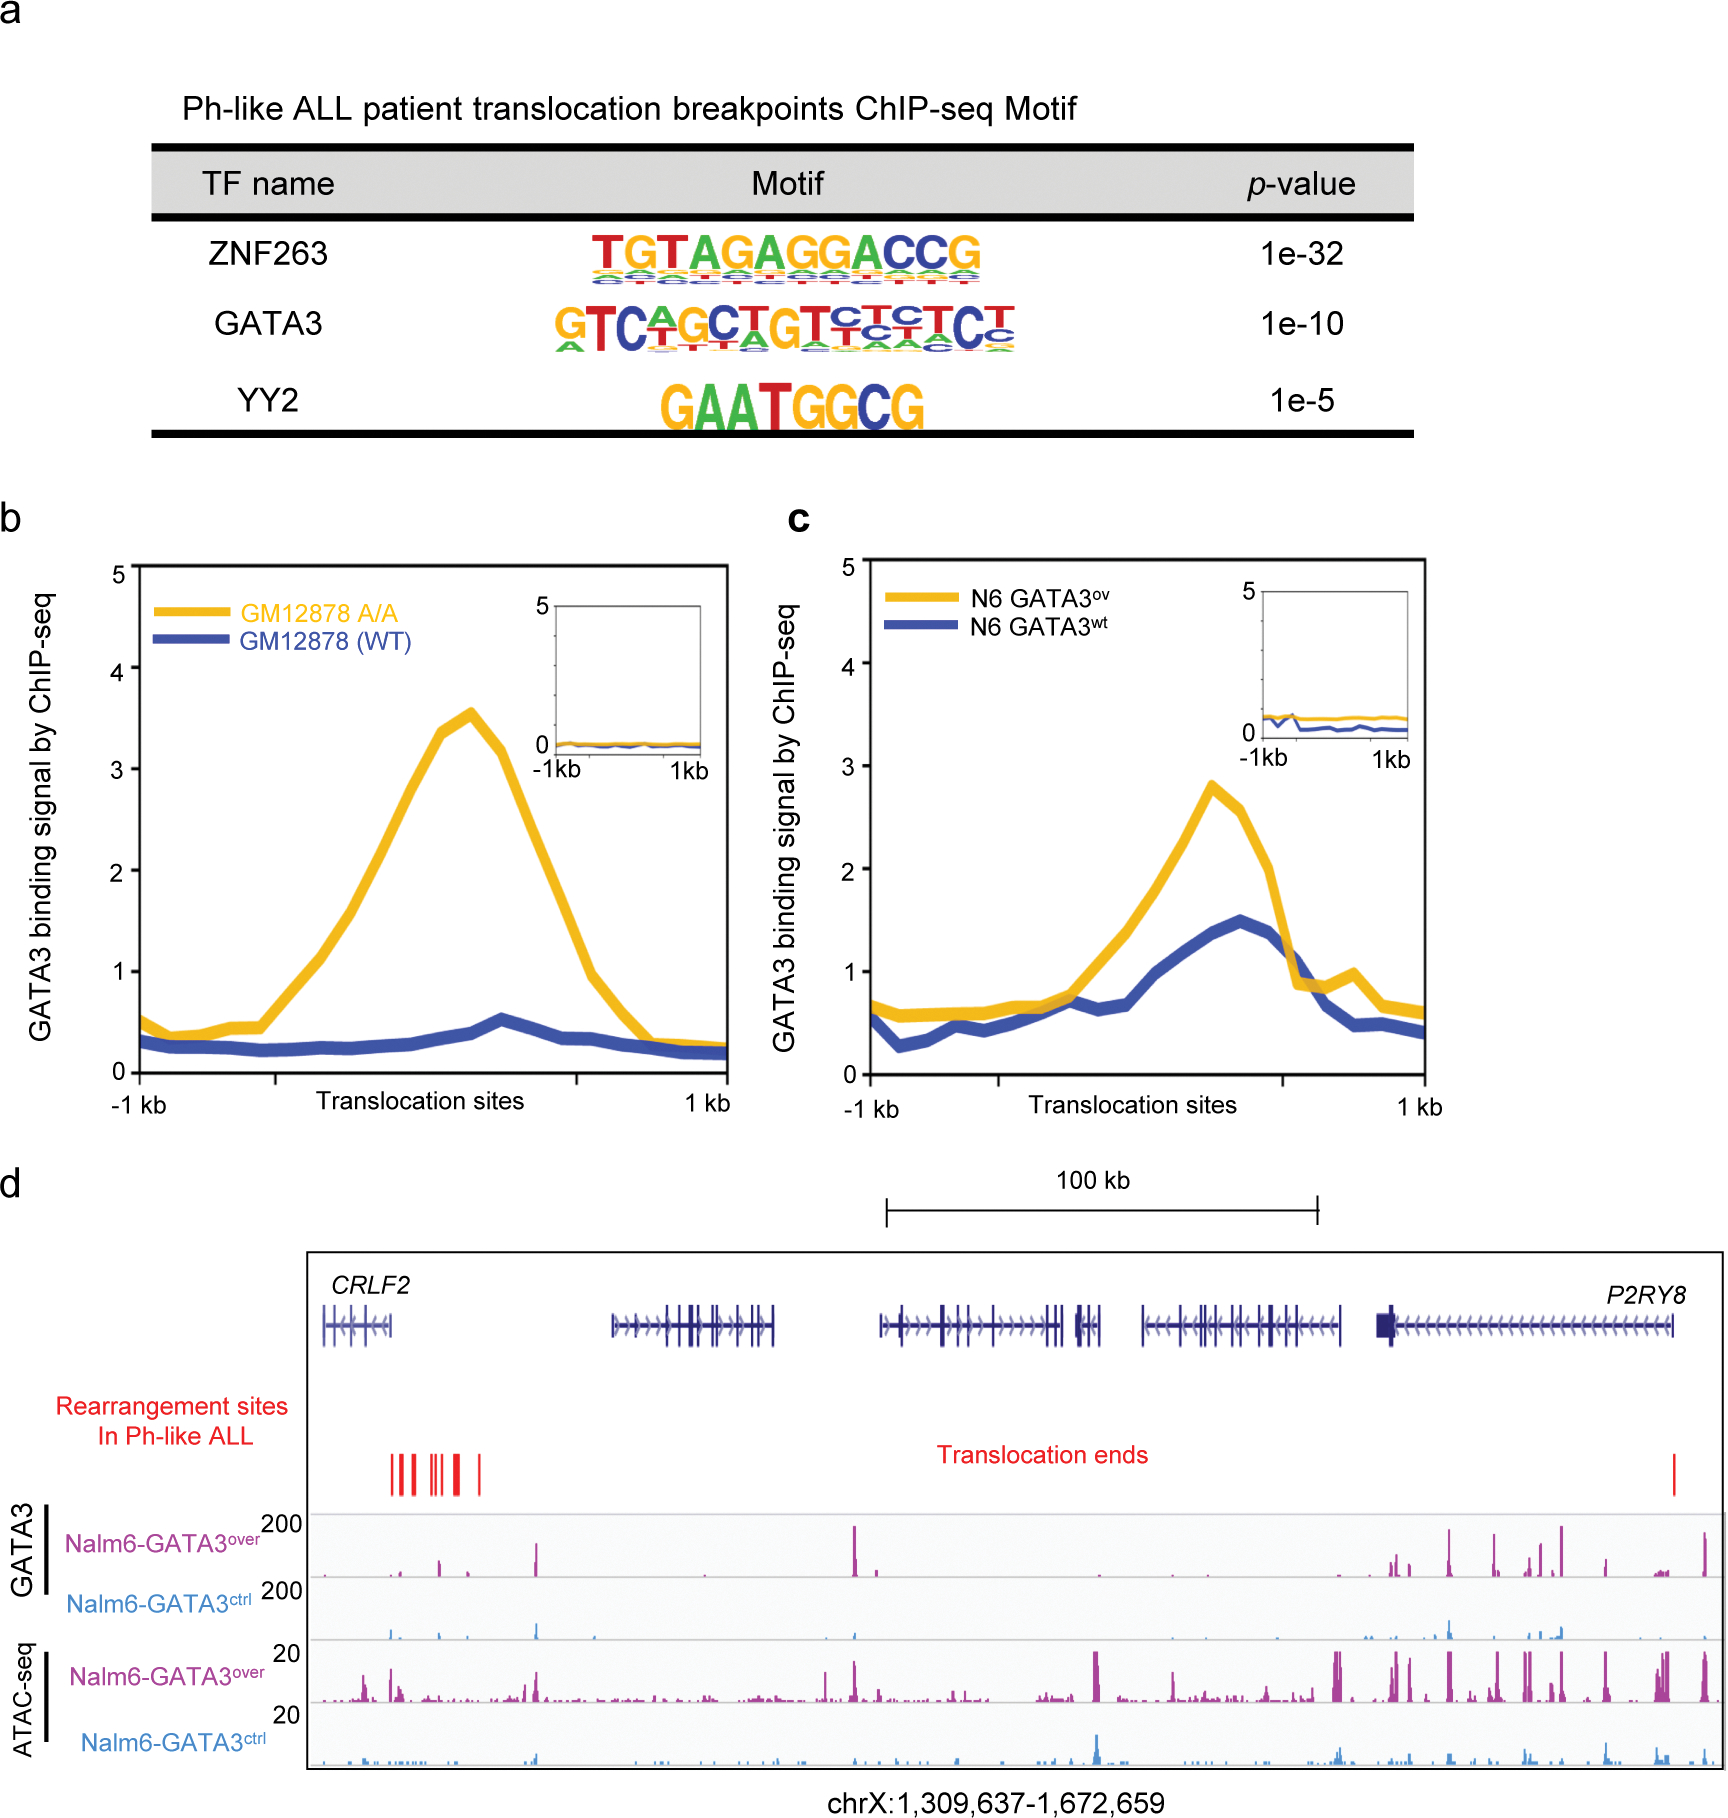
a, Motif enrichment analysis of translocation breakpoint genomic regions identified in Ph-like ALL. P values were estimated using Fisher Exact test. b, GATA3 binding signal (200bp bin) in GM12878 (A/A) (yellow) and GM12878 (WT) cells (blue) for Ph-like ALL translocation breakpoint region. Inset shows GATA3 binding signal in 1000 random genomic regions in GM12878 A/A and WT cells. c, GATA3 binding signal (200bp bin) in Nalm6 GATA3ov (yellow) and Nalm6 GATA3wt (blue) cells for the same Ph-like ALL translocation breakpoint region. Again, inset shows GATA3 binding signal in 1000 random genomic regions in these samples. d, GATA3 ChIP-seq and ATAC-seq at the CRLF2 locus in Nalm6 cells with or without ectopic GATA3 expression. Red vertical bars indicate the rearrangement hotspots in CRLF2-positive Ph-like ALL. ChIP-seq and ATAC signal intensities were normalized according to their sequencing depths.
Extended Data Fig. 10. GATA3 influenced hematopoietic cell transformation in vitro and homing in vivo.
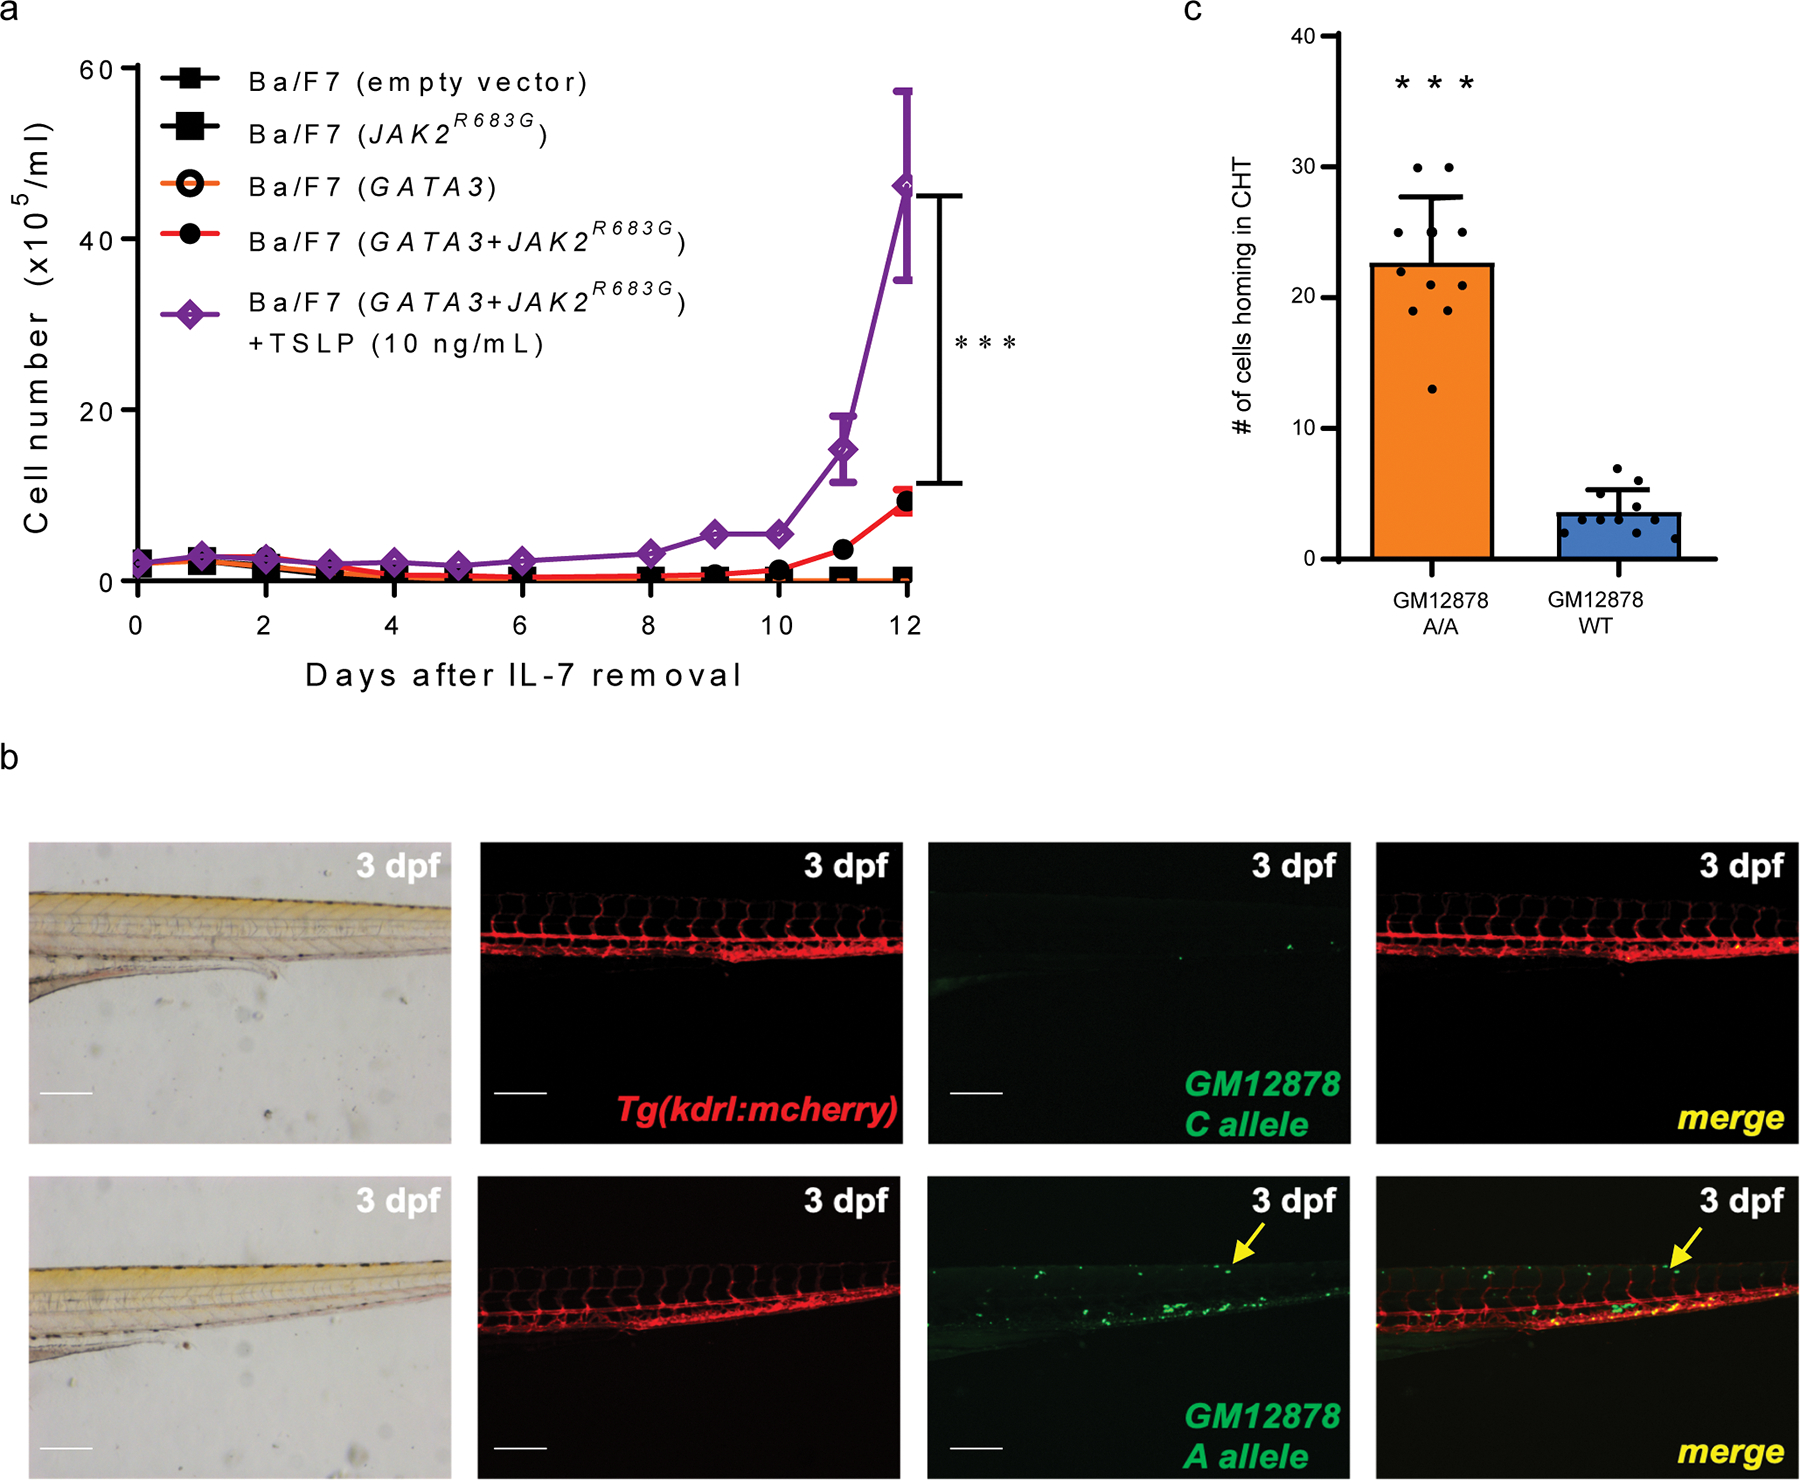
a, IL3-independent growth of Ba/F7 cells transduced with GATA3 alone, JAK2R683G alone, GATA3 with JAK2R683G, or empty vector control. All experiments were performed in triplicates (n=3, p-value = 0.0000915 by 2-sided 2-way ANOVA test). Ba/F7 cells with GATA3 and JAK2R683G were treated with or without 10 ng/ml TSLP. b, Zebrafish xenograft model of GM12878 cell migration. GM12878 WT and A/A cells were labeled with Vybrant DiO and then injected to 2 dpf Tg(kdrl:mcherry) transgenic embryos. 3dpf injected embryos were imaged under microscope for bright field and fluorescence. Red color shows the blood vessel of fish embryos. Green color shows GM12878 cells. Yellow arrows indicates GM12878 cells homing to the caudal hematopoietic tissue (CHT). Scale bar = 200 uM. Experiments were repeated twice independently with similar results. c, Quantitative analysis of GM12878 cell homing to the caudal hematopoietic tissue (CHT) (n = 11, p-value=3.924e-08, two-sided unpaired t-test). Data are presented as mean +/− SEM.
Supplementary Material
Acknowledgements
This work was supported by the US National Institutes of Health (CA21765, CA98543, CA114766, CA98413, CA180886, CA180899, GM92666, GM115279, and GM097119) and the American Lebanese Syrian Associated Charities. H.Z. is a St. Baldrick’s International Scholar (581580). S.P.H. is the Jeffrey E. Perelman Distinguished Chair in Pediatrics at The Children’s Hospital of Philadelphia. M.L.L. is the UCSF Benioff Chair of Children’s Health and the Deborah and Arthur Ablin Chair of Pediatric Molecular Oncology. F.Y. is supported by 1R35GM124820, R01HG009906, U01CA200060 and R24DK106766. We thank the patients and parents who participated in the St. Jude and COG clinical trials included in this study, the clinicians and research staff at St Jude Children’s Research Hospital and COG institutions.
Footnotes
Competing Interests Statement
F.Y. is a cofounder of Sariant Therapeutics, Inc. The remaining authors have no competing interests to declare.
Code Availability Statement
No custom code or software was used as part of data analysis. All analysis packages used are listed in the Methods section.
Additional experimental details and data analyses are included in the Supplementary Note.
Peer review Information:
Nature Genetics thanks Jinfang (Jeff) Zhu and the other, anonymous, reviewer(s) for their contribution to the peer review of this work.
References
- 1.Pui CH et al. Childhood Acute Lymphoblastic Leukemia: Progress Through Collaboration. J Clin Oncol 33, 2938–48 (2015). [DOI] [PMC free article] [PubMed] [Google Scholar]
- 2.Hunger SP & Mullighan CG Acute lymphoblastic leukemia in children. N Engl J Med 373, 1541–52 (2015). [DOI] [PubMed] [Google Scholar]
- 3.Moriyama T, Relling MV & Yang JJ Inherited genetic variation in childhood acute lymphoblastic leukemia. Blood 125, 3988–95 (2015). [DOI] [PMC free article] [PubMed] [Google Scholar]
- 4.Papaemmanuil E et al. Loci on 7p12.2, 10q21.2 and 14q11.2 are associated with risk of childhood acute lymphoblastic leukemia. Nat Genet 41, 1006–10 (2009). [DOI] [PMC free article] [PubMed] [Google Scholar]
- 5.Trevino LR et al. Germline genomic variants associated with childhood acute lymphoblastic leukemia. Nat Genet 41, 1001–5 (2009). [DOI] [PMC free article] [PubMed] [Google Scholar]
- 6.Sherborne AL et al. Variation in CDKN2A at 9p21.3 influences childhood acute lymphoblastic leukemia risk. Nat Genet 42, 492–4 (2010). [DOI] [PMC free article] [PubMed] [Google Scholar]
- 7.Perez-Andreu V et al. Inherited GATA3 variants are associated with Ph-like childhood acute lymphoblastic leukemia and risk of relapse. Nat Genet 45, 1494–8 (2013). [DOI] [PMC free article] [PubMed] [Google Scholar]
- 8.Xu H et al. Novel susceptibility variants at 10p12.31–12.2 for childhood acute lymphoblastic leukemia in ethnically diverse populations. J Natl Cancer Inst 105, 733–42 (2013). [DOI] [PMC free article] [PubMed] [Google Scholar]
- 9.Xu H et al. Inherited coding variants at the CDKN2A locus influence susceptibility to acute lymphoblastic leukaemia in children. Nat Commun 6, 7553 (2015). [DOI] [PMC free article] [PubMed] [Google Scholar]
- 10.Enciso-Mora V et al. Common genetic variation contributes significantly to the risk of childhood B-cell precursor acute lymphoblastic leukemia. Leukemia 26, 2212–5 (2012). [DOI] [PubMed] [Google Scholar]
- 11.Walsh KM et al. Novel childhood ALL susceptibility locus BMI1-PIP4K2A is specifically associated with the hyperdiploid subtype. Blood 121, 4808–9 (2013). [DOI] [PMC free article] [PubMed] [Google Scholar]
- 12.Roberts KG et al. Targetable kinase-activating lesions in Ph-like acute lymphoblastic leukemia. N Engl J Med 371, 1005–15 (2014). [DOI] [PMC free article] [PubMed] [Google Scholar]
- 13.Den Boer ML et al. A subtype of childhood acute lymphoblastic leukaemia with poor treatment outcome: a genome-wide classification study. Lancet Oncol 10, 125–34 (2009). [DOI] [PMC free article] [PubMed] [Google Scholar]
- 14.MacArthur J et al. The new NHGRI-EBI Catalog of published genome-wide association studies (GWAS Catalog). Nucleic Acids Res 45, D896–D901 (2017). [DOI] [PMC free article] [PubMed] [Google Scholar]
- 15.ENCODE-Project-Consortium. An integrated encyclopedia of DNA elements in the human genome. Nature 489, 57–74 (2012). [DOI] [PMC free article] [PubMed] [Google Scholar]
- 16.Bernstein BE et al. The NIH Roadmap Epigenomics Mapping Consortium. Nat Biotechnol 28, 1045–8 (2010). [DOI] [PMC free article] [PubMed] [Google Scholar]
- 17.Maurano MT et al. Systematic localization of common disease-associated variation in regulatory DNA. Science 337, 1190–5 (2012). [DOI] [PMC free article] [PubMed] [Google Scholar]
- 18.Lettice LA et al. A long-range Shh enhancer regulates expression in the developing limb and fin and is associated with preaxial polydactyly. Hum Mol Genet 12, 1725–35 (2003). [DOI] [PubMed] [Google Scholar]
- 19.Dixon JR et al. Topological domains in mammalian genomes identified by analysis of chromatin interactions. Nature 485, 376–80 (2012). [DOI] [PMC free article] [PubMed] [Google Scholar]
- 20.Lieberman-Aiden E et al. Comprehensive mapping of long-range interactions reveals folding principles of the human genome. Science 326, 289–93 (2009). [DOI] [PMC free article] [PubMed] [Google Scholar]
- 21.Zhou X et al. Epigenomic annotation of genetic variants using the Roadmap Epigenome Browser. Nat Biotechnol 33, 345–6 (2015). [DOI] [PMC free article] [PubMed] [Google Scholar]
- 22.McVicker G et al. Identification of genetic variants that affect histone modifications in human cells. Science 342, 747–9 (2013). [DOI] [PMC free article] [PubMed] [Google Scholar]
- 23.Hnisz D et al. Activation of proto-oncogenes by disruption of chromosome neighborhoods. Science 351, 1454–1458 (2016). [DOI] [PMC free article] [PubMed] [Google Scholar]
- 24.Takaku M et al. GATA3-dependent cellular reprogramming requires activation-domain dependent recruitment of a chromatin remodeler. Genome Biol 17, 36 (2016). [DOI] [PMC free article] [PubMed] [Google Scholar]
- 25.Belver L et al. GATA3-Controlled Nucleosome Eviction Drives MYC Enhancer Activity in T-cell Development and Leukemia. Cancer Discov 9, 1774–1791 (2019). [DOI] [PMC free article] [PubMed] [Google Scholar]
- 26.Harvey RC et al. Identification of novel cluster groups in pediatric high-risk B-precursor acute lymphoblastic leukemia with gene expression profiling: correlation with genome-wide DNA copy number alterations, clinical characteristics, and outcome. Blood 116, 4874–84 (2010). [DOI] [PMC free article] [PubMed] [Google Scholar]
- 27.Mullighan CG et al. Rearrangement of CRLF2 in B-progenitor- and Down syndrome-associated acute lymphoblastic leukemia. Nat Genet 41, 1243–6 (2009). [DOI] [PMC free article] [PubMed] [Google Scholar]
- 28.Jiang M, Zou X & Lu L Potential efficacy and prognosis of silencing the CRLF2mediated AKT/mTOR pathway in pediatric acute Bcell lymphoblastic leukemia. Oncol Rep 41, 885–894 (2019). [DOI] [PMC free article] [PubMed] [Google Scholar]
- 29.Teng Y, Ross JL & Cowell JK The involvement of JAK-STAT3 in cell motility, invasion, and metastasis. JAKSTAT 3, e28086 (2014). [DOI] [PMC free article] [PubMed] [Google Scholar]
- 30.Migliorini G et al. Variation at 10p12.2 and 10p14 influences risk of childhood B-cell acute lymphoblastic leukemia and phenotype. Blood 122, 3298–307 (2013). [DOI] [PubMed] [Google Scholar]
- 31.Mosaad YM et al. GATA3 rs3824662 gene polymorphism as possible risk factor in a cohort of Egyptian patients with pediatric acute lymphoblastic leukemia and its prognostic impact. Leuk Lymphoma 58, 689–698 (2017). [DOI] [PubMed] [Google Scholar]
- 32.Sejben A et al. Li-Fraumeni-szindroma. Orvosi Hetilap 160, 228–234 (2019). [DOI] [PubMed] [Google Scholar]
- 33.Groschel S et al. A single oncogenic enhancer rearrangement causes concomitant EVI1 and GATA2 deregulation in leukemia. Cell 157, 369–381 (2014). [DOI] [PubMed] [Google Scholar]
- 34.Northcott PA et al. Enhancer hijacking activates GFI1 family oncogenes in medulloblastoma. Nature 511, 428–34 (2014). [DOI] [PMC free article] [PubMed] [Google Scholar]
- 35.Weischenfeldt J et al. Pan-cancer analysis of somatic copy-number alterations implicates IRS4 and IGF2 in enhancer hijacking. Nat Genet 49, 65–74 (2017). [DOI] [PMC free article] [PubMed] [Google Scholar]
- 36.Stanelle J, Doring C, Hansmann ML & Kuppers R Mechanisms of aberrant GATA3 expression in classical Hodgkin lymphoma and its consequences for the cytokine profile of Hodgkin and Reed/Sternberg cells. Blood 116, 4202–11 (2010). [DOI] [PubMed] [Google Scholar]
- 37.Banerjee A, Northrup D, Boukarabila H, Jacobsen SE & Allman D Transcriptional repression of Gata3 is essential for early B cell commitment. Immunity 38, 930–42 (2013). [DOI] [PMC free article] [PubMed] [Google Scholar]
- 38.Huda N et al. Genetic variation of the transcription factor GATA3, not STAT4, is associated with the risk of type 2 diabetes in the Bangladeshi population. PLoS One 13, e0198507 (2018). [DOI] [PMC free article] [PubMed] [Google Scholar]
- 39.Mosaad YM et al. GATA3 rs3824662 gene polymorphism as possible risk factor for systemic lupus erythematosus. Lupus 27, 2112–2119 (2018). [DOI] [PubMed] [Google Scholar]
- 40.White R, Rose K & Zon L Zebrafish cancer: the state of the art and the path forward. Nat Rev Cancer 13, 624–36 (2013). [DOI] [PMC free article] [PubMed] [Google Scholar]
- 41.Rajan V, Dellaire G & Berman JN Modeling Leukemogenesis in the Zebrafish Using Genetic and Xenograft Models. Methods Mol Biol 1451, 171–89 (2016). [DOI] [PubMed] [Google Scholar]
- 42.Gacha-Garay MJ et al. Pilot Study of an Integrative New Tool for Studying Clinical Outcome Discrimination in Acute Leukemia. Front Oncol 9, 245 (2019). [DOI] [PMC free article] [PubMed] [Google Scholar]
- 43.Corkery DP, Dellaire G & Berman JN Leukaemia xenotransplantation in zebrafish--chemotherapy response assay in vivo. Br J Haematol 153, 786–9 (2011). [DOI] [PubMed] [Google Scholar]
- 44.Rajan V et al. Humanized zebrafish enhance human hematopoietic stem cell survival and promote acute myeloid leukemia clonal diversity. Haematologica 105, 2391–2399 (2020). [DOI] [PMC free article] [PubMed] [Google Scholar]
- 45.Larsen EC et al. Dexamethasone and High-Dose Methotrexate Improve Outcome for Children and Young Adults With High-Risk B-Acute Lymphoblastic Leukemia: A Report From Children’s Oncology Group Study AALL0232. J Clin Oncol 34, 2380–8 (2016). [DOI] [PMC free article] [PubMed] [Google Scholar]
- 46.Borowitz MJ et al. Clinical significance of minimal residual disease in childhood acute lymphoblastic leukemia and its relationship to other prognostic factors: a Children’s Oncology Group study. Blood 111, 5477–85 (2008). [DOI] [PMC free article] [PubMed] [Google Scholar]
- 47.Pui CH et al. Long-term results of St Jude Total Therapy Studies 11, 12, 13A, 13B, and 14 for childhood acute lymphoblastic leukemia. Leukemia 24, 371–82 (2010). [DOI] [PMC free article] [PubMed] [Google Scholar]
- 48.Li H & Durbin R Fast and accurate short read alignment with Burrows-Wheeler transform. Bioinformatics 25, 1754–60 (2009). [DOI] [PMC free article] [PubMed] [Google Scholar]
- 49.Poplin R et al. Scaling accurate genetic variant discovery to tens of thousands of samples. bioRxiv (2017). [Google Scholar]
- 50.Wang K, Li M & Hakonarson H ANNOVAR: functional annotation of genetic variants from high-throughput sequencing data. Nucleic Acids Res 38, e164 (2010). [DOI] [PMC free article] [PubMed] [Google Scholar]
- 51.O’Leary NA et al. Reference sequence (RefSeq) database at NCBI: current status, taxonomic expansion, and functional annotation. Nucleic Acids Res 44, D733–45 (2016). [DOI] [PMC free article] [PubMed] [Google Scholar]
- 52.Robinson JT et al. Integrative genomics viewer. Nat Biotechnol 29, 24–6 (2011). [DOI] [PMC free article] [PubMed] [Google Scholar]
- 53.Ran FA et al. Genome engineering using the CRISPR-Cas9 system. Nat Protoc 8, 2281–2308 (2013). [DOI] [PMC free article] [PubMed] [Google Scholar]
- 54.Gu Z et al. PAX5-driven subtypes of B-progenitor acute lymphoblastic leukemia. Nature genetics 51, 296–307 (2019). [DOI] [PMC free article] [PubMed] [Google Scholar]
Associated Data
This section collects any data citations, data availability statements, or supplementary materials included in this article.
Supplementary Materials
Data Availability Statement
All sequencing data and processed results are deposited in the NCBI Gene Expression Omnibus under accession code: GSE145997. 2,296 ALL patient RNA-seq data54 can be found at https://pecan.stjude.cloud/proteinpaint/study/PanALL. T-cell RNA-seq and ATAC-seq data is downloaded from GSE107011 and GSE74912, respectively. B-ALL Patient ATAC-Seq is available at GSE161501. The human histone-modification ChIP-seq data were downloaded from ENCODE project, and all datasets used are summarized in Supplementary Table 9.


