

Summary
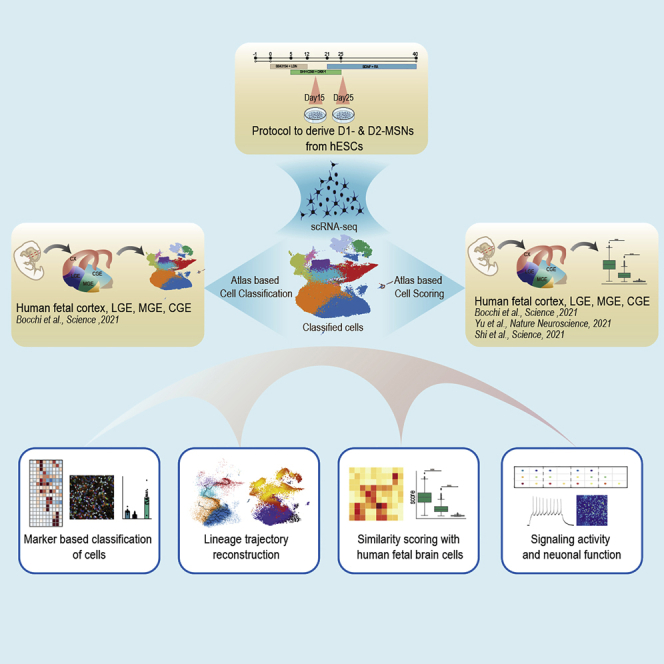
Stem cell engineering of striatal medium spiny neurons (MSNs) is a promising strategy to understand diseases affecting the striatum and for cell-replacement therapies in different neurological diseases. Protocols to generate cells from human pluripotent stem cells (PSCs) are scarce and how well they recapitulate the endogenous fetal cells remains poorly understood. We have developed a protocol that modulates cell seeding density and exposure to specific morphogens that generates authentic and functional D1- and D2-MSNs with a high degree of reproducibility in 25 days of differentiation. Single-cell RNA sequencing (scRNA-seq) shows that our cells can mimic the cell-fate acquisition steps observed in vivo in terms of cell type composition, gene expression, and signaling pathways. Finally, by modulating the midkine pathway we show that we can increase the yield of MSNs. We expect that this protocol will help decode pathogenesis factors in striatal diseases and eventually facilitate cell-replacement therapies for Huntington’s disease (HD).
Keywords: embryonic stem cells, human medium spiny projection neurons, striatal development, single-cell RNA-seq, midkine signaling, retinoic acid, neuronal differentiation protocol
Graphical abstract
Highlights
-
•
An efficient method to generate D1 and D2-medium spiny neurons (MSNs) from hESC
-
•
The protocol shows high reproducibility between different batches
-
•
MSNs show significant similarity to human fetal MSNs at single-cell resolution
-
•
Modulating the midkine pathway enhances the number of MSNs generated
Motivation
Although methods to develop medium spiny neurons (MSNs) have been reported, they are not able to reproduce D1- and D2-MSNs. Furthermore, all protocols use a restricted panel of genes to define MSNs, making it difficult to measure their authenticity. Finally, they all require extended periods of differentiation to obtain functional neurons. To solve these problems, we developed a protocol that enables the generation of functional D1- and D2-MSNs in just 25 days in culture. Single-cell RNA sequencing shows that these MSNs have significant resemblance with human fetal MSNs. Moreover, we define the midkine pathway as an important mediator of MSN differentiation.
Conforti et al. develop a protocol to generate authentic and functional D1 and D2-medium spiny neurons (MSNs). These MSNs show a significant resemblance to human fetal MSNs at single-cell resolution. By modulating the midkine pathway with retinoic acid, they show they can further increase the number of MSNs generated.
Introduction
The human striatum is a brain area implicated in neurological disorders.1 There is an urgent need to develop reliable in vitro protocols to generate striatal neurons from stem cells to understand their formation and maturation in normal conditions. Furthermore, these in vitro-derived cells could be exploited for studies on disease mechanisms and cell-replacement therapy, to treat neurodegenerative disorders like Huntington’s disease (HD).2
Several protocols to generate medium spiny neurons (MSNs) have been developed,3,4,5,6,7,8,9 but none are able to produce D1- and D2-MSNs, the main neurons found in the striatum.10 Furthermore, interpretation on the authenticity of MSNs generated remains challenging as cells were classified with an insufficient combination of markers. Finally, all current protocols require extended periods of differentiation to obtain functional neurons, hampering reproducibility.11
Here, we plated cells at a low density and modulated sonic hedgehog (SHH) and WNT signaling pathways to generate ∼30% of authentic D1- and D2-MSNs after 25 days of differentiation. Through single-cell RNA sequencing (scRNA-seq) of the cells and by comparing them against a panel of single-cell atlases of the human developing lateral (LGE), medial (MGE), and caudal (CGE) ganglionic eminences,12,13,14 we demonstrate that our protocol recapitulates the cell types observed in the human fetal brain with significant accuracy. We confirmed the protocol’s reproducibility on different batches. Furthermore, neurons reach a high level of maturity after 25 days in culture. Finally, by modulating the midkine pathway, we were able to increase the output of MSNs. In conclusion, the methodology we have employed here may constitute a reference to correctly generate MSNs in vitro.
Results
Modulating cell density and specific morphogens can generate both D1- and D2-MSNs in just 25 days of differentiation
During striatal development, MSNs arise from the LGE by opposing dorsoventral WNT and SHH signaling,15 and most protocols that generate MSNs from pluripotent stem cells modulate these pathways.3,4,5,7 All these studies classify MSNs with insufficient markers. Some studies report generating 12%–45% of MSNs considering DARPP32 immunostaining.3,5,6,7 However, using DARPP32 alone could classify cells as MSNs even though this marker is found in both cortical and striatal neurons.16 Others have co-stained for DARPP32 and CTIP2 reporting 11%–20% of MSNs,4,9 but these two markers fail to discriminate if the cells are GABAergic. Furthermore, most protocols have focused on modulating morphogens, but recent findings report that cell density controls cell patterning17,18 and enhances the reproducibility of in vitro protocols.19 Finally, no studies have so far analyzed the composition of the striatal cultures at single-cell resolution.
Taking these studies under consideration, we modified the initial cell density4,20 of 6 × 10⁴ cells/cm2 and plated H9 human embryonic stem (hES) cells at a density of 1 × 10⁴ cells/cm2 (Figure 1A). Lower densities cells do not form colonies and detach from the coating (Figure S1A). At first, by adding selective BMP (LDN193189) and TGFβ (SB431542) for the first 12 days in vitro (DIV) (Figure 1A), we reproduced the anterior neuroectoderm marked by expression of FOXG1 and PAX621 (Figure S1B). We then ventralized the cells using SHH combined with the WNT pathway antagonist dickkopf 1 from DIV5 to DIV25 (Figure 1A) to generate GSX2 and ASCL1 ventral telencephalic progenitors by DIV15 (Figures 1B and S1B). The cells were finally treated with BDNF, B27, and retinoic acid (RA) from DIV21 (Figure 1A) to promote terminal maturation of MSNs. We show that these conditions enable the generation of 18% ± 9.7% of CTIP2+/DARPP32+/GAD67+ MSNs by DIV25 that reached 28% ± 8.5% by DIV40 (Figures 1B, 1C, S1C, and S1D). Finally, these cells express the specific human and striatal lincRNAs, hfb_G_000494 and hfb_G_00005312 (Figure S1D), confirming they are authentic MSNs.
Figure 1.

MSN protocol generates cellular diversity of the human fetal striatum
(A) Schematic illustration of the protocol to obtain rapid induction of MSNs.
(B) Phase contrast images of H9 hES cells and immunofluorescent staining. Scale bars, 100 and 50 μm respectively.
(C) Quantification of the percentage of DARPP32+, CTIP2+, and GAD67+ cells. n = 9–11 independent biological replicates; error bars represent ± SEM.
(D) Overview of how cells of the human fetal LGE12 are used to classify different cell types in vitro.
(E) UMAP plot of 45,727 single cells derived from DIV15 and 25 color coded by cell type. AP, apical progenitors; BP, basal progenitors; MGE int., MGE interneurons; Migr. int., migrating interneurons; v.CGE int., ventral caudal ganglionic eminence interneurons; Cx, neocortical neurons; Endo., endothelial cells.
(F) UMAP plot of single cells color-coded by DIV.
(G) Pie charts of cell types at DIV15 and 25.
(H) Heatmap of expression values of canonical markers genes averaged by cell type.
(I) Immunofluorescent staining for D1- and D2-MSNs markers. Scale bars, 50 μm.
(J) Quantification of the percentage of D1- and D2-MSNs markers at DIV25 of differentiation. n = 3 independent biological replicates; error bars represent ± SEM.
(K and L) qRT-PCR analysis of ISL1 and SIX3 (K) and DRD1 and DRD2 (L) during differentiation. n = 3 independent differentiation experiments; error bars represent ± SEM; one-way ANOVA, Tukey’s multiple comparison test; ∗∗p < 0.01, ∗∗∗p < 0.001.
See also Figure S1.
To examine the cell states in our protocol we performed scRNA-seq of 45,727 cells on five different batches at DIV15 and DIV25. To classify the cell types observed in vitro, we used a scRNA-seq atlas of the human fetal striatum12 (Figure 1D). We observe that cell types in vivo are reproduced in vitro and by DIV25 we have pre-MSNs, D1- and D2-MSNs, interneurons, and cortical cells (Figures 1E–1G). This is confirmed by the expression of genes like EBF1 and ISL1 for D1-MSNs and SIX3 for D2-MSNs (Figure 1H). We show a high percentage of OCT6+/ISL1+ D1-MSNs that represent immature D1-MSNs, while we reach approximately 25% of mature ISL1+/CTIP2+ D1-MSNs at DIV25 (Figures 1I–1K). Mature D2-MSNs are confirmed by SIX3 expression and SIX3+/CTIP2+ cells (Figures 1I–1K). Finally, we show that the dopamine receptors DRD1 and DRD2 transcripts are present at DIV25 and DIV40 (Figures 1L and S1E), further confirming the presence of both types of MSNs.
Cell types generated in vitro are highly reproducible and have a significant similarity with cells from the human fetal brain
Our protocol is able to produce both D1- and D2-MSNs in all the analyzed experiments and with a high degree of similarity between batches, confirming the reproducibility of our protocol (Figures 2A and 2B). We then tested the performance of an independent hES cell line (RUES2) that has been previously shown to be resistant to LGE differentiation and biased toward MGE fates.20,22 Initial seed density of 6 × 10⁴ in RUES2 showed that cells were not able to produce MSNs.20 We therefore tested the same cell densities as used in the H9 lines. We show that seeding at 1 × 10⁴ cells/cm2 is the optimal condition to form colonies after plating (Figure S2A) and is able to give 10% of CTIP2+/DARPP32+/GAD67+ cells by DIV40 (Figures S2B–S2D). However, the cells differentiate at a slower pace compared with H9 line as shown by the absence of CTIP2+/DARPP32+/GAD67+ cells at DIV25 (Figures S2B–S2E). Finally, we show that our protocol is able to instruct RUES2 cells in both D1- and D2-MSNs by DIV40, as shown by OCT6+/ISL1+ and SIX3+/CTIP2+cells, respectively (Figures S2B and S2D), and as confirmed by expression of both DRD1 and DRD2 transcripts by DIV40 (Figure S2E). In conclusion, this panel of data suggests that our protocol is reproducible and can be used on different cell lines.
Figure 2.

MSN protocol shows high reproducibility and significant transcriptional similarity with human fetal neurons
(A) UMAP plots of in vitro data from DIV15 and 25 plotted by batch.
(B) Percentage of different cells types from each individual batch.
(C and D) Heatmap of the Jaccard index for the comparison between bulk RNA-seq in vivo signatures12 and in vitro cell types (C), and the comparison between in vivo cell type-specific signatures12 and in vitro cell types (D).
(E and F) Boxplots showing the distribution of enrichment scores for each cell type according to a specific in vivo cell signature12 (E) and enrichment scores for a certain cell type according to an in vivo vs. in vivo comparison12 (the perfect cell score) of the actual score by comparing in vitro cells to the in vivo dataset12 and the comparison with a random gene list (F). Mann-Whitney rank test and Benjamini-Hochberg correction; ∗∗∗p < 0.001.
See also Figures S2 and S3.
We then measured the similarity between our in vitro cell derivatives and those of the human fetal striatum.12 We show that cells correctly position themselves along the dorsal-ventral axis of the neocortex, LGE, and MGE (Figure 2C). In particular, cortical cells show a high Jaccard similarity index with cortical signatures, D1- and D2-MSNs for LGE signatures and interneurons for MGE signatures (Figure 2C). Similar patterns and ranges are observed when comparing these regional signatures with in vivo single-cell signatures12 (Figure S3A).We then evaluated how the gene signature of each cell type generated in vitro is comparable to the single-cell gene signatures in vivo.12 Jaccard similarity index shows a high degree of similarity between the same cell types (Figure 2D). The maximum scores achievable are calculated by comparing the in vivo dataset with itself (Figure S3B).
We then defined signature lists of each cell type in vivo and measured how each cell in vitro scored in terms of number of expressed genes and intensity of expression of each gene from the signature lists.23 We show that each cell type in vitro scores significantly higher for their corresponding gene signature in vivo (Figure 2E), confirming that the cell types have a significant resemblance to their in vivo counterpart.
We then compared each score, for each cell type, with the score reached by the “idealized” cell (in vivo vs. in vivo) and to a list of random genes to confirm that the enrichment seen is not by chance. The data confirm that the signal of each specific cell state is higher than what it would be by chance, although there is still room to reach the idealized in vivo cell (Figure 2F). Finally, we used two independent studies on the human fetal brain13,14 that confirm that in vitro progenitors correctly enrich for the in vivo progenitor signature, in vitro MSNs for the LGE signature and MGE interneurons enrich for MGE (Figures S3C and S3D). These patterns are also confirmed when comparing the in vivo dataset used to classify the cells12 with the different ganglionic eminence,13,14 confirming that the cells are correctly classified (Figures S3E and S3F). CGE interneurons (Figures S3C–S3F) are misclassified probably because the LGE dataset12 contained CGE interneurons from one fetal sample.13,14 Finally, we show that MSNs correctly enrich for the LGE branching point,13 showing that cells correctly commit to an LGE fate (Figure S3G) as confirmed with the in vivo comparison12 (Figure S3H). Overall, we conclude that we are able to reproduce, with significant accuracy, cells observed in the developing human striatum.
In vitro-generated MSNs follow a specific trajectory that mimics the one taken by MSNs in vivo
Velocity24 and pseudotime analyses show that cells correctly developed from progenitors to D1- and D2-MSNs (Figures 3A and 3B). Monocle25 shows that branching for the generation of D1- and D2-MSNs occurs at the pre-MSN (Figure 3C). This is corroborated by expression of GSX2 and SALL3 in action potentials (APs), highly specific markers of LGE progenitors,12 together with FABP7, HES1, LIX1, PTN, SLC1A3, and TTYH1, markers of APs of the ganglionic eminence.14 Basal progenitors (BPs) correctly express ASCL1, INSM1, and DLX2, and neurons express DLX5, DLX6, DCX, SNAP25, and SCN2B (Figure 3D), confirming their ventral neuronal identity. This is confirmed by a high percentage of GSX2+ and Ki67+ progenitors in the first 20DIV, which decreases as differentiation progress (Figures 3F and 3G). ASCL1-positive cells increase between DIV15 and DIV19, reflecting the increase in BPs as differentiation advances (Figure 3F). Finally, we show that the percentage of post-mitotic cells increases, as shown by p27 expression (Figure 3G).
Figure 3.

MSNs are generated following the same trajectory identified in the human fetal LGE lineage
(A) Velocity estimates projected onto the UMAP plot.
(B) UMAP showing cells colored by velocity pseudotime.
(C) Trajectory predicted by Monocle.
(D) Gene expression levels plotted on the UMAP plot for specific maturation markers.
(E) Immunofluorescent staining for GSX2/ASCL1 and Ki67/p27. Top left, DAPI inset. Scale bars, 50 μm.
(F) Quantification of the proportion of GSX2, ASCL1, and GSX2+/ASCL1+ cells. n = 3 independent biological replicates; error bars represent ± SEM.
(G) Quantification of the percentage of Ki67+ and p27+ cells. n = 3 independent biological replicates; error bars represent ± SEM.
In vitro and in vivo MSNs display similar signaling logic, and in vitro MSNs show rapid induction of neuronal function
By exploiting CellChat,26 we observe that most of the predicted outgoing (Figure 4A) and incoming (Figure 4B) signaling pathways in vivo are recapitulated in vitro.
Figure 4.

In vitro-derived MSNs show similar signaling cascades observed in the human LGE and are functionally active by DIV25
(A and B) Heatmaps showing the strength of the outgoing (A) or incoming (B) signaling pathways from the DIV25 in vitro dataset and the human fetal brain (HFB) LGE dataset.12
(C) Communication probabilities mediated by ligand-receptor pairs between APs and BPs.
(D) qRT-PCR analysis of MDK at DIV25 with retinoic acid given from DIV21 of differentiation (standard protocol), DIV12, or DIV5. n = 2 independent biological replicates; error bars represent ± SEM.
(E) Quantification of the percentage of CTIP2+/DARPP32+/GAD67+ cells at DIV25 and DIV40 of differentiation with RA given from DIV25, DIV12, or DIV5. n = 3 independent biological replicates; error bars represent ± SEM; one-way ANOVA, Tukey’s multiple comparison test, ∗p < 0.05; ∗∗p < 0.01, ∗∗∗p < 0.001.
(F) Sample traces of total inward and outward currents recorded during voltage steps injection and quantification of the percentage of cells subdivided accordingly to the peak amplitude of their Na+ current (n = 5 independent biological replicates).
(G) Firing response elicited by a step of supra-threshold depolarizing current. Cells with INa > 400 pA were subdivided into no action potentials (APs), abortive APs, single spike, or repetitive firing; (n = 5 independent biological replicates).
(H) Heatmap of expression values of GABAergic and glutamatergic marker genes.
(I) Ca++ imaging activity after stimulation with GABA or glutamate (fold increase after stimuli = 0–0.25 not responding; 0.25–1 low responding; >1 high responding). n ≥ 9 from 2/3 independent biological replicates.
See also Figure S4.
In particular, we observe that the midkine heparin-binding growth factor (MK) pathway is in the progenitors of both datasets, especially in APs (Figures 4A and 4B). The MK ligand can bind to SSDC2, PTPRZ1, or NCL receptors, and communication is observed between APs both in vivo and in vitro, but while it remains active between APs and BPs in vitro, it is instead switched off in vivo (Figure 4C). These differences in MK communication may be due to the fact that in vitro cells are not spatially organized, like we observe in the human fetal brain, and therefore AP and BP may be in close contact with each other and continue to communicate. MK is an RA-responsive gene suggesting that RA signal participates in defining striatal neural progenitors.27 To test the role of MK-RA signaling in MSN differentiation, we tested RA exposure from DIV12 or from DIV5, and we compared it to our standard application of RA from DIV21 (Figure 1A). We show that exposure from DIV5 significantly increases MK expression (Figure 4D) and the overall output of CTIP2+/DARPP32+/GAD67+ MSNs (Figures 4E and S4A), suggesting that modulating this pathway in progenitors enhances the efficiency of the protocol.
Other signaling activities in both in vivo and in vitro progenitors include NOTCH (Figures 4A and 4B), which has roles in neural development28 (Figures 4A and 4B), and cell adhesion molecules like NCAM that are correctly expressed in neurons (Figures 4A, 4B, and S4B). There are, however, dataset-specific enrichments. For example, in vitro cells have GDF signaling in APs (Figures 4A, 4B, and S4C). GDF11 is expressed in the neural epithelium and later in the E14.5 mouse striatum.29 In vitro APs may be less committed than APs in vivo and therefore still show this signaling pathway as in neural epithelium cells. Instead, communication signals restricted to in vivo cells include somatostatin signaling (Figure S4D). The lack of this pathway in vitro may be caused by a lower level of maturity of the interneurons generated in culture.
We next profiled the electrophysiological properties of the neurons using the whole-cell patch-clamp technique in both voltage- and current-clamp modes. We found that at DIV25, 36% of cells current peak amplitude ranged between 0 and 400 pA, and in 49.3% of cells, it was greater than 400 pA4 (Figure 4F). In parallel, 62% of the neurons displayed single spike or repetitive firing (Figure 4G), indicating that by DIV25, neurons have mature electrophysiological properties.
We then show that the basal activity (the intensity of intracellular Ca++) of the neurons increases from DIV25 to DIV40 (Figure 4E and Videos S1 and S2) indicating that these cells mature as differentiation progress. We show that both ventral (MSNs and interneurons) and dorsal (cortical) neurons correctly express NMDA, AMPA, and Kainate receptor together with GABA receptor subunits (Figure 4H). However, only ventral populations express the enzymes for GABA synthesis, GAD1 and GAD2 (Figure 4H), while cortical neurons express SLC17A6 (Figure 4H) that mediates the uptake of glutamate into neural cells. This confirms the identity of both excitatory and inhibitory neurons. This is confirmed by the ability of the cells to respond to GABA and glutamate stimulation (Figures 4I, S4F, and S4G), which increases between DIV25 and DIV40, confirming that neurons mature during this time window. The increase in maturation is also shown by the increase in expression of MAP2, TAU, GAD67, CTIP2, DARPP32, PSD95, SYP, and SNAP25 between DIV15 and DIV40 (Figures S4H and S4I).
(10x magnification, thermal LUT pseudo-color scale, 30 frames per second).
(10x magnification, thermal LUT pseudo-color scale, 30 frames per second).
Discussion
We present a protocol to robustly generate D1- and D2-MSNs with strong similarity to human fetal MSNs12,13,14 and that display mature electrophysiological properties by DIV25 of differentiation. We believe that this protocol could be adapted to large-scale manufacturing given its accelerated differentiation timing and minimal cell handling. Our work offers the opportunity to investigate D1- and D2-specific phenotypes in vitro, enabling the identification of decisive cellular subgroups in striatal diseases.
We anticipate that the resolution of this study will also be applied to quantitatively answer fundamental questions in the HD cell replacement field, such as what score transplanted cells should have in terms of similarity to the human fetal counterpart to produce optimal grafts and what is the effect of heterogeneous populations on the outcome of the transplant. Further studies are needed to optimize the protocol to either generate pure D1- or D2-MSNs to have a better control on the use of these cells.
Limitations of the study
The first limitation is that neurons need to be evaluated at single-cell resolution after 25 days in culture to determine the degree of maturity that can be reached in vitro. Second, the efficacy of the protocol requires testing on different types of cell lines and laboratories. Finally, our method to score cell similarity between in vitro and in vivo will still require empirical testing and comparison with an in vivo post-transplant potency assay that assesses the equivalence of the generated cells with their in vivo counterparts.
STAR★Methods
Key resources table
| REAGENT or RESOURCE | SOURCE | IDENTIFIER |
|---|---|---|
| Antibodies | ||
| Mouse monoclonal anti-OCT3/4 (C-10) | Santa Cruz Biotechnology | Cat#sc-5279; RRID:AB_628051 |
| Rabbit anti-SOX2 | Millipore | Cat# AB5603; RRID:AB_2286686 |
| Rabbit polyclonal anti-GSX2 | GeneTex | Cat#gtx129390; RRID:AB_2885981 |
| Mouse anti-ASCL1 | BD | Cat#556604; RRID:AB_396479 |
| Rabbit polyclonal anti-Ki67 | Abcam | Cat#ab15580; RRID:AB_443209 |
| Mouse anti-p27 | Cell Signaling | Cat#3698; RRID:AB_2077832 |
| Rabbit polyclonal anti-OCT6 | Abcam | Cat#ab272925; RRID: N/A |
| Rabbit polyclonal anti-SIX3 | Abcam | Cat#ab221750; RRID: N/A |
| Mouse anti-ISL1/2 | Hybridoma Bank | Cat#39.4D5; RRID:AB_2314683 |
| Rat monoclonal anti-CTIP2 [25B6] | Abcam | Cat#ab18465; RRID:AB_2064130 |
| Rabbit monoclonal anti-DARPP32 [EP720Y] | Abcam | Cat# ab40801; RRID:AB_731843 |
| Mouse monoclonal anti-GAD67 | Millipore | Cat# MAB5406; RRID:AB_2278725 |
| Mouse monoclonal anti-MAP2 Clone Ap20 | BD Biosciences | Cat# Cat# 556320; RRID:AB_396359) |
| Mouse anti-TAU | Invitrogen | Cat#MN1000; RRID:AB_2314654 |
| Mouse monoclonal anti-PSD95 | Synaptic System | Cat#124 011BT; RRID:AB_2619799 |
| Mouse anti-SYNAPTOPHYSIN [SY38] | Abcam | Cat#ab8049; RRID:AB_2198854 |
| Rabbit anti-TRKB | Millipore | Cat#07-225; RRID:AB_310445 |
| Rabbit anti-GAPDH | Abcam | Cat#ab37168; RRID:AB_732652 |
| AlexaFluor Goat Anti-Rabbit 488 | Life Technologies | Cat#A11008; RRID:AB_143165 |
| AlexaFluor Goat Anti-Rabbit 568 | Life Technologies | Cat#A11011; RRID:AB_143157 |
| AlexaFluor Goat Anti-Rabbit 647 | Life Technologies | Cat#A27040; RRID:AB_2536101 |
| AlexaFluor Goat Anti-Mouse 488 | Life Technologies | Cat#A11029; RRID:AB_2534088 |
| AlexaFluor Goat Anti-Mouse 568 | Life Technologies | Cat#A11004; RRID:AB_2534072 |
| AlexaFluor Goat Anti-Mouse 647 | Life Technologies | Cat#A21235; RRID:AB_2535804 |
| AlexaFluor Goat Anti-Rat 488 | Life Technologies | Cat#A11006; RRID:AB_141373 |
| AlexaFluor Goat Anti-Rat 568 | Life Technologies | Cat#A11077; RRID:AB_141874 |
| AlexaFluor Goat Anti-Rat 647 | Life Technologies | Cat#A21247; RRID:AB_141778 |
| HRP-conjugated Goat anti-Rabbit IgG | Bio-Rad | Cat#170-6515; RRID:AB_11125142 |
| HRP-conjugated Goat anti-Mouse IgG | Bio-Rad | Cat#170-6516; RRID:AB_11125547 |
| HRP-conjugated Goat anti-Rat IgG | Bio-Rad | Cat# 31470; RRID:AB_228356 |
| Chemicals, peptides, and recombinant proteins | ||
| B27 Supplement | Life Technologies | 17504-044 |
| B27 w/o Vit A supplement | Life Technologies | 12587-010 |
| Biolaminin 521 | Voden | LN521-05 |
| brain-derived neurotrophic factor (BNDF) | PeproTech | 450-02 |
| Cell Culture water | Sigma Aldrich | W4502-1L |
| Cultrex® BME Pathclean® | Trevigen | 343201001 |
| DKK-1 | PeproTech | 120-30 |
| DMEM/F12 | Life Technologies | 21331-020 |
| Dulbecco’s PBS w/o Calcium w/o Magnesium (PBS) |
Euroclone | ECB40041 |
| EDTA 0.5M pH 8.0 | Millipore | 324506 |
| ESGRO Complete Accutase | Millipore | SF006 |
| Fluo4-AM | Invitrogen | F14201 |
| GABA | TOCRIS | 0344 |
| Geltrex™ | Life Technologies | A1413302 |
| GlutaMAX (100X) | Life Technologies | 35050-38 |
| Glutamic acid | Sigma Aldrich | G5889 |
| Halt™ Protease and Phosphatase Inhibitor Cocktail 1 mM |
Thermo Fisher Scientific | 78440 |
| Hanks' Balanced Salt Solution (HBSS) | Gibco | 14025092 |
| Hoechst 33342 | Invitrogen | H3570 |
| Ionomicyn | Sigma Aldrich | I9657 |
| Laminin | Life Technologies | 1858435 |
| LDN | CHDI Foundation | 00396388-0001-006 |
| mTeSR™1 basal medium | STEMCELL Technologies | 85851 |
| mTeSR™1 Supplement (5X) | STEMCELL Technologies | 85851 |
| Normal Goat Serum (NGS) | Vector Laboratories | S-1000 |
| N2 Supplement | Life Technologies | 17502-048 |
| Penicillin/Streptomycin solution (100X) | Euroclone | ECB3001D |
| Pluronic acid F-127 | Invitrogen | P3000MP |
| PMSF 1mM | Sigma Aldrich | P7626 |
| Poly-D-Lysin | Sigma Aldrich | P6407 |
| Polyvinyl alcohol mounting medium with DABCO® | Sigma Aldrich | 10981 |
| Y-27632 (ROCKi) | CHDI Foundation | 00197406-0001-007 |
| SB431542 | CHDI Foundation | 00447536-0000-002 |
| SHH C-25 II | R&D System | 464-SH-2MG |
| Trypan Blue Solution | Life Technologies | 15250-06 |
| TRIzol™ Reagent | Life Technologies | 15596018 |
| Sodium chloride | VWR CHEMICALS | 27,810,295 |
| Potassium chloride | VWR CHEMICALS | 26764.298 |
| Calcium chloride dihydrate | Sigma Aldrich | C3881 |
| Magnesium chloride hexahydrate | Sigma Aldrich | M2670 |
| Glucose | Sigma Aldrich | G8270 |
| HEPES | Sigma Aldrich | H3375 |
| EGTA | Sigma Aldrich | E4378 |
| Creatine phosphate disodium salt hydrate | Sigma Aldrich | P7936 |
| Adenosine 5′-triphosphate disodium salt hydrate | Sigma Aldrich | A6419 |
| Guanosine 5′-triphosphate sodium salt hydrate | Sigma Aldrich | G8877 |
| Potassium D-gluconate | Sigma Aldrich | G4500 |
| Sodium hydroxide | Sigma Aldrich | S8045 |
| Potassium hydroxide | Sigma Aldrich | P1767 |
| Critical commercial assays | ||
| Clarity Western ECL Substrate | Bio-Rad | 1705061 |
| DNA-free™ DNase Treatment and Removal | Thermo Fisher Scientific | AM1906 |
| iScript cDNA Synthesis Kit | Bio-Rad | 1708891 |
| Pierce BCA Protein Assay Kit | Thermo Fisher Scientific | 23225 |
| RNAscope® Multiplex Fluorescent Kit v2 Assay | ACD | 323100 |
| RNAscope® 4-Plex Ancillary Kit for Multiplex Fluorescent Kit v2 Assay |
ACD | 323120 |
| SsoFast EvaGreen® Supermix | Bio-Rad | 172-5202 |
| Deposited data | ||
| ArrayExpress | www.ebi.ac.uk/arrayexpress/ | E-MTAB-12080 |
| Experimental models: Cell lines | ||
| Human: H9 (WA-09) hESC line | WiCell Research Institute | NIHhESC-10-0062 |
| Human: RUES2 Q22 hESC line | CHDI Foundation | CHDI-90001539 |
| Oligonucleotides | ||
| Primers for qPCR see Table S1 | This paper | N/A |
| Software and algorithms | ||
| FIJI - ImageJ | N/A | https://fiji.sc/ |
| CFX Manager Software | N/A | Bio-Rad |
| CellProfiler Image Analysis Software v2.2.1 | N/A | https://cellprofiler.org |
| GraphPad Prism | N/A | https://www.graphpad.com/ |
| OriginPro | N/A | https://www.originlab.com/origin |
| pClamp Software Suit (including Clampex and Clampfit) |
N/A | https://www.moleculardevices.com/products/axon-patch-clamp-system/acquisition-and-analysis-software/pclamp-software-suite?cmp=7010g000000nOC8&utm_source=AdWords&utm_medium=cpc&utm_campaign=CNS-Brand_Regional&utm_adgroup={adgroup}&utm_location=20589&utm_keyword=clampex&utm_device=c&utm_devicemodel=&utm_placement=&utm_adpostion=&utm_target=&utm_network=g&utm_creative=505613889055&gclid=CjwKCAiAsNKQBhAPEiwAB-I5zUeZwiuJ_6j8CO6oz1fQOjUbcu03EPnC2nK_W-_yInNTf-eQuhEctBoCrqQQAvD_BwE |
| Cellranger | 10x Genomics | https://support.10xgenomics.com/single-cell-gene-expression/software/pipelines/latest/what-is-cell-ranger |
| Scanpy and dependencies Ingest |
(Wolf et al., 2018) | https://github.com/theislab/scanpy |
| BBKNN | (Polański et al., 2020) | https://github.com/Teichlab/bbknn |
| Scoring cells | (Della Chiara et al., 2021) | https://github.com/paganilab/DellaChiara_et_al_2021/tree/main/sc_RNAseq/scr |
| Velocyto | (La Manno et al., 2018) | https://velocyto.org/velocyto.py/tutorial/cli.html#running-velocyto |
| Monocle3 | (Cao et al., 2019) | https://cole-trapnell-lab.github.io/monocle3/docs/trajectories/ |
| CellChat | (Jin et al., 2021) | https://github.com/sqjin/CellChat |
Resource availability
Lead contact
Further information and requests for resources and reagents should be directed to the lead contact, Elena Cattaneo (elena.cattaneo@unimi.it)
Materials availability
This study did not generate new unique reagents.
Experimental model and subject details
hPSC cell culture
Human ES H9 cell line (WiCell) was cultured on Cultrex (120-180 μg/mL, Trevigen) -coated dishes in complete mTeSR1 medium (STEMCELL Technologies) and maintained for a maximum of three months. Medium was changed daily, and cells were dissociated twice a week with PBS (Euroclone) plus 0.5 mM EDTA for passaging or Accutase (Millipore) for striatal differentiation.
Method details
Striatal differentiation
For neural induction, H9 hES cells were plated at a density of 1x10⁴ cells/cm2 on Cultrex- coated plates (120-180 μg/mL) in complete mTeSR1 medium supplemented with 10μM ROCK inhibitor (Y-27632, provided by CHDI FOUNDATION). After two days of expansion, cells were exposed to Dual-SMAD inhibition using 10μM SB431542 (provided by CHDI FOUNDATION) and 500nM LDN193189 (provided by CHDI FOUNDATION) in DMEM/F12 (Life Technologies) plus N2 Supplement (Life Technologies) and B27 Supplement without retinoic acid (Life Technologies) for 12 days. Starting on DIV5, 200 ng/mL Recombinant human SHH C-25 II (R&D System) and 100 ng/mL DKK-1 (PrepoTech) were added to the culture and maintained until DIV25. On DIV21 the entire cell population was detached upon Accutase single cell dissociation and replated at a cell density of 2x10⁴ cells/cm2 either on Poly-D-Lysin (33 μg/mL, Sigma-Aldrich) and Laminin (3 μg/mL, Life Technologies) or Biolaminin 521 (5 μg/mL, Voden) -coated plates for continued culture. The cells were maintained, in DMEM/F12 plus N2 Supplement, B27 Supplement with retinoic acid (Life Technologies), and 20 ng/mL BDNF (PrepoTech), until the end of differentiation. When modulating the midkine pathway, B27 Supplement with retinoic acid (Life Technologies) was given from DIV12 or from DIV5, instead of the standard application from DIV21.
Immunocytochemistry
Cell cultures were fixed with ice-cold 4% paraformaldehyde for 15 min, permeabilized with 0.5% Triton X-100 in PBS for 10 min and blocked with 5% normal goat serum (NGS, Vector Laboratories) for 1 h. All previous steps were performed at room temperature. Cells were then incubated overnight at 4°C with primary antibodies. Appropriate Alexa Fluor-conjugated secondary antibodies (Life Technologies) were diluted 1:500 and mixed with 0.1 μg/mL Hoechst (Invitrogen, cod. 33,342) to counterstain nuclei. Images were acquired on a Leica TCS SP5 Confocal Laser Scanning Microscope (Leica Microsystems), using a 40X (NA 1.4) oil immersion objective (zoom = 1,7) guided by LAS-F software or on a GE Healthcare IN Cell Analyzer 6000 (GE Healthcare Life Sciences), using a 40× objective. The following primary antibodies were used: OCT4 (mouse, 1:100; Santa Cruz); SOX2 (rabbit, 1:200; Millipore); KI67 (rabbit, 1:500; Abcam); p27 (mouse, 1:1000; Cell Signaling); GSX2 (rabbit, 1:250; Millipore); ASCL1 (mouse, 1:1000; Beckton Dickinson); OCT6 (rabbit, 1:250; Abcam); SIX3 (rabbit, 1:500; Abcam); ISL1 (mouse, 1:1000; Hybridoma Bank) CTIP2 (rat, 1:1000; Abcam); GAD67 (mouse, 1:2500; Millipore); DARPP32 (rabbit, 1:250; Abcam).
The percentage of cells positive for striatal markers DARPP32, CTIP2 and GAD67 was manually counted using the cell counter feature in ImageJ. For all others markers, the numbers of cells positive were counted using the free open-source CellProfiler 2.2.1 software.
RNA extraction and real-time qRT-PCR
At specific time points during differentiation, cells were harvested and processed for total RNA extraction using TRIzol Reagent (Life Technologies) according to the manufacturer’s instructions. The integrity of the purified RNA and the absence of genomic DNA contamination were assessed by non-denaturing agarose gel electrophoresis. In presence of genomic DNA contamination, RNA extracts were treated with the DNA-free DNase Treatment and Removal kit (ThermoFisher Scientific). 500ng of total RNA was retrotranscribed using iScript cDNA Synthesis Kit (Bio-Rad) following the manufacturer’s instructions. Quantitative RT-PCR was performed using a CFX96TM Real-Time System (Bio-Rad) and analyzed with the CFX Manager Software (Bio-Rad). All reactions were performed in 15uL containing 50ng cDNA and SsoFastTM EvaGreen Supermix (Bio-Rad). Primer pairs used are reported in Table S1.
RNAscope assay
RNA in situ hybridization was performed using the RNAscope Multiplex Fluorescent Assay v2 (Advanced Cell Diagnostic) according to the manufacturer’s instructions.
Cell cultures were fixed with ice-cold 4% paraformaldehyde for 15 min followed by three washes in PBS. Cells were then dehydrated in a graded ethanol series (75% EtOH, 100% EtOH) and subsequently treated for 10 min with Hydrogen Peroxide solution. After three washes in distilled water, cells were exposed to Protease Plus digestion for 30 min at 40°C. The following probes (indicated with gene target name for human, respective channel, and Advanced Cell Diagnostics catalog number) were used: Hs-Drd1 (Ch1, 524,991); Hs-Drd2 (Ch4, 553,991). Probe hybridization took place for 2 h at 40°C and cells were then rinsed in 1 × wash buffer, followed by amplification steps (according to the standard protocol). For multiplex detection, Opal 520 and Opal 570 fluorophores were diluted 1:1500 in the RNAscope Multiplex TSA Buffer. Cells were then labeled with DAPI, and mounted with Polyvinyl alcohol mounting medium with DABCO (Sigma Aldrich). Images were acquired on a Leica TCS SP5 Confocal Laser Scanning Microscope (Leica Microsystems), using a 63× oil immersion objective (zoom 1,7).
The endogenous POLR2A and HPRT1 genes were used as positive control to assess both cell RNA integrity and assay procedure. The bacterial gene DapB was used as negative control to assess background signals.
Western blotting
Cell cultures were collected and homogenized in RIPA buffer (Tris-HCl pH8 50 mM, NaCl 150 mM, SDS 0.1%, NP40 1%) supplemented with PMSF 1mM (Sigma-Aldrich) and Halt Protease & Phosphatase Inhibitor Cocktail 1mM (Thermo Fisher Scientific). Total amount of protein extracts was quantified using the Pierce BCA Protein Assay Kit (Thermo Fisher Scientific). 20 μg of proteins were loaded per track onto a 7.5% or 10% SDS/PAGE gels. Proteins were transferred onto a nitrocellulose membrane using the Trans-Blot TurboSystem (Bio-Rad) and blocked in TBS-T 0.1% with 5% non-fat dry milk (Bio-Rad). Nitrocellulose membranes were immunoprobed with MAP2a/b (mouse, 1:500; Beckton Dickinson); CTIP2 (rat, 1:500; Abcam); GAD67 (mouse, 1:500; Millipore); DARPP32 (rabbit, 1:500; Abcam); TAU (mouse, 1:500; Invitrogen); PSD95 (mouse, 1:1000; Synaptic System); SNAP25 (mouse, 1:500; Abcam); SYNAPTOPHYSIN (mouse, 1:500; Abcam) overnight at 4°C. HRP-conjugated secondary antibodies were detected by Clarity Western ECL Substrate (Bio-Rad). GAPDH (Rabbit, 1:5000; Abcam) was used to normalize. The acquisitions were performed by ChemiDoc MP imaging system (Bio-Rad) and densitometric analysis was performed by ImageJ software.
Ca2+ imaging
For calcium dye loading, the cells at DIVs 25, 30 and 40 were incubated with 1 μM Fluo4-AM (Thermo Fisher/Invitrogen) mixed 1:1 with 20% (w/v) Pluronic acid F-127 (Thermo Fisher/Invitrogen) in HBSS (Thermo Fisher/Life Technologies) for 15 min at 37°C. Excess dye was removed by double washing with HBSS and cells were let to rest for 15 min. Imaging was carried out at 37°C and 5% CO2 with 10× air objective using a spinning disk CREST-X-Light-V2 (CrestOPtics) spinning disk equipped with a DU888 EM-CCD camera (Andor Technologies) mounted on a fully automated Nikon Ti inverted microscope (Nikon Instruments), with 50 ms exposure and 25% 470 LED power (SpectraAura, LumenCore), guided via Nis-Elements v.5.31 software (Nikon-Lim Instruments). Time-lapse image sequences were acquired at 1-s intervals for 3 min for basal activity and for 1 min after stimulation with GABA (80μM) or Glutamate (50mM). For each biological replicate one well was stimulated with Ionomycin (1μM) followed by EDTA quenching (20mM) as controls for proper calcium dye labeling.
Images were processed to calculate ROIs using automatic auto-adjusting threshold for intensities and quantify the fluorescence intensity of calcium dye over-time (FIJI software, mask thresholding over signal with Huang algorithm). In details, ROIs were identified determining a custom adjusted threshold based on the T0 of each image set. Three background ROIs were also identified for each image. The fluorescence intensities of each cellular ROI were measured over-time. Every ROI was singularly identified and only ROIs with a size of 25-150 μm2 were considered. Derived quantifications from image analysis were further elaborated using RStudio, to perform peaks quantification, looking at the fluorescence change over time for each ROI, as time dependent quantification defined as (Ftn – Ftn-1)/(Ftn), where Ftn is the fluorescence intensity at any single frame and Ftn-1 is the fluorescence intensity at the previous frame. Each fluorescence intensity was quantified after subtraction of the level of a mean of three background ROIs measured at each time. A Peak is considered true if located between two values that are either greater or lower than itself and if it is > or < of the arbitrary threshold value set to 3.5% of the baseline value.
Electrophysiological recordings
All recordings were performed at room temperature by using the whole-cell patch-clamp technique in voltage- and current-clamp configurations. Cells were visualized using an Eclipse TE200 (Nikon) inverted microscope, as previously described.4 The extracellular solution contained: NaCl (140 mM), MgCl2 (1 mM), CaCl2 (2 mM), KCl (3 mM), glucose (10 mM), HEPES (10 mM) [pH 7.4 with NaOH]. Pipettes were produced from borosilicate glass capillary tubes by means of a horizontal puller (P-97, Sutter instruments) and filled with an intracellular saline solution containing: potassium gluconate (130 mM), NaCl (4 mM), MgCl2 (2 mM), EGTA (1 mM), HEPES (10 mM), creatine phosphate (5 mM), Na2-ATP (2 mM), Na3-GTP (0.3 mM) [pH 7.3 with KOH]. The liquid junction potential between the bath and the pipette solution was measured and subtracted from the membrane potential values. Pipette series resistance was constantly monitored during experiments. Recordings were made with an Axopatch 200B amplifier (Axon Instruments) and digitized with a Digidata 1322A AD/DA converter (Axon Instruments). Signals were acquired using Clampex software (Molecular Devices), sampled at 20–50 kHz, and low-pass filtered at 10 kHz. Software Clampfit 10.2 (Molecular Devices) and OriginPro 8 (Microcal) were used for data analysis. Activation of inward and outward currents mediated by voltage-dependent sodium and potassium channels was obtained by stimulating the cell with steps of voltage of increasing amplitude. Firing properties were assessed by recording the voltage responses to a series of supra-threshold current steps starting from a potential of −70 mV.
Quantification and statistical analysis
For all experiments, analyses were performed from at least three independent biological replicates as described in figure legends. All measured values are indicated as mean ± SEM In all analyses comparison of mean values was conducted with unpaired t-test or One-way ANOVA. The tests used are described in the figure legends and the threshold of statistical significance was set at ≤ 0.05 (∗∗∗∗, p < 0.0001; ∗∗∗, p < 0.001; ∗∗, p < 0.01; ∗, p < 0.05). GraphPad Prism 8 was used for all statistical analyses.
Single-cell RNA sequencing
Single-cell RNA sequencing was performed using the Chromium Single Cell 3′ v2/v3 platform (10X Genomics) at DIVs 15 and 25 of differentiation. At the specified time points during differentiation, cells were dissociated using Accutase for 5 min and filtered through a 20μm cell strainer (Sysmex) to remove cell clumps. Single cell suspensions were counted and adjusted to 1.000-1.200 cells/μl in PBS containing 0.04% BSA (BSA, Ambion, AM2616). Cell viability (>90%) was assessed by trypan blue staining. 5.000 cells per sample and for each time point were collected for generating Single Cell 3′ Gene Expression libraries. GEM generation, reverse transcription, cDNA amplification. Single cell sequencing libraries were prepared using the Chromium Single Cell 3′ Library & Gel Bead Kit v2 (PN- 120237) for batch 1 and 2 and v3 for the rest of the batches, Chromium Single Cell 3′ Chip kit v2 (PN-120236) and Chromium i7 Multiplex Kit (PN-120262) according to the manufacturer’s instructions. Libraries were generated and were sequenced with the Illumina NovaSeq platform (2∗100bp), using paired end sequencing with single indexing.
scRNA-seq raw data processing, alignment and quality control
Fastq raw data files were demultiplexed, processed, aligned and quantified using the Cell Ranger Single-Cell Software Suite (v.3.1, 10x Genomics) using a custom reference annotation with a panel of novel lincRNAs identified in the human fetal telencephalon between 7 and 11pcw.12
All downstream analyses were performed using the Scanpy v1.7.130 processing pipeline. All genes expressed in less than 3 cells and all cells with less than 200 detected genes and with unique gene counts under 500 or over 7000 were removed. All cells with total mitochondrial gene expression was higher than 3% were removed. The default method for identifying variable genes was used. The number of detected molecules and mitochondrial gene expression was regressed out to avoid biasing data interpretation.
Dimensionality reduction and annotation of scRNA-seq data using the human fetal striatum as a reference
To reduce data dimensionality in cells that passed QC a principal component analysis (PCA) was performed. The 20 most significant PCs with 20 neighbors were used to construct a K-nearest neighbors (KNN) graph. Batch effects were corrected using BBKNN, a graph-based data integration algorithm.31 The ingest function in Scanpy was used to map labels and embeddings from the reference human fetal brain dataset12 to our in vitro data. The function uses a knn classifier for mapping labels and then the UMAP package to map the embeddings. The classification of each cluster was then confirmed by canonical marker gene expression evaluation.
Jaccard similarity analysis
To compare in vitro signatures with in vivo bulk signatures of the human fetal CTX, LGE, and MGE12 a Jaccard similarity index was used. For the in vitro dataset, the top 500 differentially expressed genes were calculated with a Wilcoxon rank-sum test, p values were then adjusted for multiple testing using the Benjamini-Hochberg method (Table S2). Then the top 100 differentially expressed genes for the fetal human CTX, LGE and MGE at 7, 9 and 11 pcw were selected by ranking the region-specific genes identified in each region/time-point12 using the lowest p-adjusted values for each comparison per area (e.g. CTX vs LGE and CTX vs MGE), summing the p-adjusted values of each comparison, and then taking the top 100 genes with the lowest summed p-adjusted values. Then, the two lists were compared using the Jaccard similarity index. In vivo vs in vivo bulk comparisons were performed using the same list described above.
To measure the similarity between single-cell populations between in vitro and in vivo12 data, the top 100 expressed genes from the in vitro and in vivo matrix were calculated and compared using the Jaccard index. For the in vivo striatal single-cell dataset12 the top 100 expressed genes were calculated using groups as follows: apical progenitors (AP1, AP2 and AP3), basal progenitors (BP1, BP2 and BP3), pre-MSNs, D1-MSNs (MSN.DRD1.i and MSN.DRD1.m), D2-MSNs, migrating interneurons, MGE-interneurons, vCGE interneurons, cortical cells and endothelial cells. In vivo vs in vivo single-cell comparisons were performed with the same methods used for in vitro vs in vivo comparisons.
To compare in vitro signatures with in vivo LGE, MGE and CGE branching point signatures13 the top 40 DE-Gs identified in the study were compared to the top 200 DE-Gs identified in each cell-population. Similarly, in vivo13 vs in vivo12 single-cell comparisons were performed using the first 40 genes of each area13 with the first 200 DE-Gs of each cell type.12
Scoring cells on in vivo gene signature sets
In vitro or in vivo gene expression patterns were compared to the top 20 differentially expressed genes in the in vivo cell-type specific gene signatures. A score was computed for each cell by considering both the fraction of DE-Gs in the in vivo datasets that are expressed in vitro/vivo (expression greater than 0) and the expression level of each gene in the in vivo signature in the in vitro/vivo expression matrix compared to the rest of the genes in that cell. These two values are multiplied together to yield the combined score for each cell.23 For the in vivo striatal single-cell dataset12 DE-Gs were recalculated using Wilcoxon rank-sum test by comparing apical progenitors (AP1, AP2 and AP3), basal progenitors (BP1, BP2 and BP3), pre-MSNs, D1-MSNs (MSN.DRD1.i and MSN.DRD1.m), D2-MSNs, migrating interneurons, MGE-interneurons, vCGE interneurons, cortical cells and endothelial cells. For progenitor, LGE, MGE, CGE signatures13 DE-Gs identified for each cluster in the study were used. For the other set of progenitor, LGE, MGE, CGE signatures14 DE-Gs were recalculated using Wilcoxon rank-sum test by comparing progenitors (P1-P6), LGE (LGE1, LGE2 and LGE3), MGE (MGE1 and MGE2) and CGE. The random gene list was done be selecting 20 random genes from the expression matrix. Significance was tested using the Mann-Whitney rank test and p values were adjusted using the Benjamini-Hochberg procedure.
Trajectory analysis using Velocyto and Monocle
Spliced and unspliced read counts were generated using Velocyto v.0.17.17.24 The scvelo32 python package (v.0.2.2) was used to calculate cellular dynamics using a generalized stochastic model. Moments were computed using 20 neighbors and 20 principal components. The calculated RNA velocities were then embedded in UMAP space. Pseudotime was computed on the velocity graph.
Trajectory analysis was also performed with Monocle3.25 Only cells that had been previously assigned to LGE lineage clusters (AP, BP, pre-MSNs, D1-MSNs, D2-MSNs) were selected for trajectory analysis. Cell clustering was performed again in Monocle3 with the leiden method and a resolution of 10−4. Based on this underlying clustering, the trajectory graph was computed by deactivating the close loop parameter and setting minimal branch length to 5.
CellChat
To investigate potential interactions across different cell types in in vitro and in vivo,12 cell-cell communication analysis was performed using CellChat v.1.1.1.26 First, we inferred intercellular communications among in vitro cell subsets at day 25 of differentiation and then for the in vivo single-cell dataset separately. The human ligand-receptor interaction database was used for the analysis. To infer the cell state-specific communication patterns, over-expressed ligands and receptors and their interactions in each cell type were computed using default parameters. Biologically significant cell-cell communications were then selected by calculating a probability value and performing a permutation test. Communication probabilities of all ligands-receptors pairs were associated with each signaling pathway and then a cell-cell communication network was defined. The in vitro and in vivo datasets were then analyzed together via joint manifold learning and classification of the inferred communication networks based on their functional similarity. The interaction strength of each signaling pathway was compared to identify differences in signaling pathways between in vivo and in vitro. Finally, the upregulated and down-regulated signaling ligand-receptor pairs in one dataset compared to the other dataset were computed with default parameters.
Acknowledgments
The authors acknowledge Nikolaus Rajewsky and Jian Chen for insightful discussions and Simon Noble from the CHDI Foundation for manuscript editing. This work was conducted with collaboration and funding from the CHDI Foundation (JSC A11103) to E.C. This work received funding from European Union’s funded Consortia NeurostemcellRepair: European stem cell consortium for neural cell replacement, reprogramming and functional brain repair (FP7, GA no. 602278), and Nsc-Reconstruct: Novel Strategies for Cell based Neural Reconstruction (H2020, GA no. 874758).
Author contributions
Conceptualization, P.C., V.D.B., D.B., and E.C. Methodology, P.C., V.D.B., I.C., L.S., and M.G. Investigation, P.C., V.D.B., I.C., L.S., M.G., F.T., M.P., C.C., and A.F. Bioinformatics analysis, V.D.B., T.L., I.F., and A.M. Further experimental suggestions, D.F., G.B, and E.A. Writing – original draft, V.D.B. and P.C. Writing – review and editing, V.D.B., P.C., I.C., L.S., M.G., E.A., D.F., G.B., D.B., and E.C. Supervision, E.C. Funding Acquisition, E.C.
Declaration of interests
All authors declare no competing interests.
Published: December 19, 2022
Footnotes
Supplemental information can be found online at https://doi.org/10.1016/j.crmeth.2022.100367.
Supplemental information
Data and code availability
-
•
Single-cell RNA-seq data have been deposited at in ArrayExpress and are publicly available as of the date of publication. The accession number is listed in the key resources table.
-
•
This paper does not report original code
-
•
Any additional information required to reanalyze the data reported in this paper is available from the lead contact upon request.
References
- 1.Shepherd G.M.G. Corticostriatal connectivity and its role in disease Gordon. Nat. Rev. Neurosci. 2013;14:278. doi: 10.1038/nrn3469.Corticostriatal. [DOI] [PMC free article] [PubMed] [Google Scholar]
- 2.Steinbeck J.A., Studer L. Moving stem cells to the clinic: potential and limitations for brain repair. Neuron. 2015;86:187–206. doi: 10.1016/j.neuron.2015.03.002. [DOI] [PMC free article] [PubMed] [Google Scholar]
- 3.Ma L., Hu B., Liu Y., Vermilyea S.C., Liu H., Gao L., Sun Y., Zhang X., Zhang S.C. Human embryonic stem cell-derived GABA neurons correct locomotion deficits in quinolinic acid-lesioned mice. Cell Stem Cell. 2012;10:455–464. doi: 10.1016/j.stem.2012.01.021. [DOI] [PMC free article] [PubMed] [Google Scholar]
- 4.Delli Carri A., Onorati M., Lelos M.J., Castiglioni V., Faedo A., Menon R., Camnasio S., Vuono R., Spaiardi P., Talpo F., et al. Developmentally coordinated extrinsic signals drive human pluripotent stem cell differentiation toward authentic DARPP-32+ medium-sized spiny neurons. Development. 2013;140:301–312. doi: 10.1242/dev.084608. [DOI] [PubMed] [Google Scholar]
- 5.Nicoleau C., Varela C., Bonnefond C., Maury Y., Bugi A., Aubry L., Viegas P., Bourgois-Rocha F., Peschanski M., Perrier A.L. Embryonic stem cells neural differentiation qualifies the role of Wnt/β-Catenin signals in human telencephalic specification and regionalization. Stem Cell. 2013;31:1763–1774. doi: 10.1002/stem.1462. [DOI] [PubMed] [Google Scholar]
- 6.Arber C., Precious S.V., Cambray S., Risner-Janiczek J.R., Kelly C., Noakes Z., Fjodorova M., Heuer A., Ungless M.A., Rodríguez T.A., et al. Activin a directs striatal projection neuron differentiation of human pluripotent stem cells. Development. 2015;142:1375–1386. doi: 10.1242/dev.117093. [DOI] [PMC free article] [PubMed] [Google Scholar]
- 7.Adil M.M., Gaj T., Rao A.T., Kulkarni R.U., Fuentes C.M., Ramadoss G.N., Ekman F.K., Miller E.W., Schaffer D.V. hPSC-derived striatal cells generated using a scalable 3D hydrogel promote recovery in a Huntington disease mouse model. Stem Cell Rep. 2018;10:1481–1491. doi: 10.1016/j.stemcr.2018.03.007. [DOI] [PMC free article] [PubMed] [Google Scholar]
- 8.Wu M., Zhang D., Bi C., Mi T., Zhu W., Xia L., Teng Z., Hu B., Wu Y. A chemical recipe for generation of clinical-grade striatal neurons from hESCs. Stem Cell Rep. 2018;11:635–650. doi: 10.1016/j.stemcr.2018.08.005. [DOI] [PMC free article] [PubMed] [Google Scholar]
- 9.Smith-Geater C., Hernandez S.J., Lim R.G., Adam M., Wu J., Stocksdale J.T., Wassie B.T., Gold M.P., Wang K.Q., Miramontes R., et al. Aberrant development corrected in adult-onset Huntington’s disease iPSC-derived neuronal cultures via WNT signaling modulation. Stem Cell Rep. 2020;14:406–419. doi: 10.1016/j.stemcr.2020.01.015. [DOI] [PMC free article] [PubMed] [Google Scholar]
- 10.Gerfen C.R. The neostriatal mosaic: multiple levels of compartmental organization. Trends Neurosci. 1992;15:133–139. doi: 10.1016/0166-2236(92)90355-C. [DOI] [PubMed] [Google Scholar]
- 11.Badin R.A., Bachoud-Lèvi A.C., Bauer G., Busse-Morris M., Canals J.M., Capetian P., Cattaneo E., Chen J., Cozzi E., Ellederova Z., et al. Stem cells for Huntington’s disease (SC4HD): an international consortium to facilitate stem cell-based therapy for Huntington’s disease. J. Huntingtons Dis. 2021;10:221–226. doi: 10.3233/JHD-210473. [DOI] [PMC free article] [PubMed] [Google Scholar]
- 12.Bocchi V.D., Conforti P., Vezzoli E., Besusso D., Cappadona C., Lischetti T., Galimberti M., Ranzani V., Bonnal R.J.P., Simone M.D., et al. The coding and long noncoding single-cell atlas of the developing human fetal striatum. Science. 2021;372:eabf5759. doi: 10.1126/science.abf5759. [DOI] [PubMed] [Google Scholar]
- 13.Shi Y., Wang M., Mi D., Lu T., Wang B., Dong H., Zhong S., Chen Y., Sun L., Zhou X., et al. Mouse and human share conserved transcriptional programs for interneuron development. Science. 2021;374:eabj6641. doi: 10.1126/science.abj6641. [DOI] [PubMed] [Google Scholar]
- 14.Yu Y., Zeng Z., Xie D., Chen R., Sha Y., Huang S., Cai W., Chen W., Li W., Ke R., et al. Interneuron origin and molecular diversity in the human fetal brain. Nat. Neurosci. 2021;24:1745–1756. doi: 10.1038/s41593-021-00940-3. [DOI] [PubMed] [Google Scholar]
- 15.Evans A.E., Kelly C.M., Precious S.V., Rosser A.E. Molecular regulation of striatal development: a Review. Anat. Res. Int. 2012;2012:1–14. doi: 10.1155/2012/106529. [DOI] [PMC free article] [PubMed] [Google Scholar]
- 16.Onorati M., Castiglioni V., Biasci D., Cesana E., Menon R., Vuono R., Talpo F., Laguna Goya R., Lyons P.A., Bulfamante G.P., et al. Molecular and functional definition of the developing human striatum. Nat. Neurosci. 2014;17:1804–1815. doi: 10.1038/nn.3860. [DOI] [PubMed] [Google Scholar]
- 17.Kempf H., Olmer R., Haase A., Franke A., Bolesani E., Schwanke K., Robles-Diaz D., Coffee M., Göhring G., Dräger G., et al. Bulk cell density and Wnt/TGFbeta signalling regulate mesendodermal patterning of human pluripotent stem cells. Nat. Commun. 2016;7:13602. doi: 10.1038/ncomms13602. [DOI] [PMC free article] [PubMed] [Google Scholar]
- 18.Gage B.K., Webber T.D., Kieffer T.J. Initial cell seeding density influences pancreatic endocrine development during in vitro differentiation of human embryonic stem cells. PLoS One. 2013;8:e82076. doi: 10.1371/journal.pone.0082076. [DOI] [PMC free article] [PubMed] [Google Scholar]
- 19.Wilson H.K., Canfield S.G., Hjortness M.K., Palecek S.P., Shusta E.V. Exploring the effects of cell seeding density on the differentiation of human pluripotent stem cells to brain microvascular endothelial cells. Fluids Barriers CNS. 2015;12:13. doi: 10.1186/s12987-015-0007-9. [DOI] [PMC free article] [PubMed] [Google Scholar]
- 20.Conforti P., Besusso D., Brocchetti S., Campus I., Cappadona C., Galimberti M., Laporta A., Iennaco R., Rossi R.L., Dickinson V.B., et al. RUES2 hESCs exhibit MGE-biased neuronal differentiation and muHTT-dependent defective specification hinting at SP1. Neurobiol. Dis. 2020;146:105140. doi: 10.1016/j.nbd.2020.105140. [DOI] [PubMed] [Google Scholar]
- 21.Chambers S.M., Fasano C.A., Papapetrou E.P., Tomishima M., Sadelain M., Studer L. Highly efficient neural conversion of human ES and iPS cells by dual inhibition of SMAD signaling. Nat. Biotechnol. 2009;27:275–280. doi: 10.1038/nbt.1529. [DOI] [PMC free article] [PubMed] [Google Scholar]
- 22.Ruzo A., Croft G.F., Metzger J.J., Galgoczi S., Gerber L.J., Pellegrini C., Wang H., Fenner M., Tse S., Marks A., et al. Chromosomal instability during neurogenesis in Huntington’s disease. Development. 2018;145:dev156844. doi: 10.1242/dev.156844. [DOI] [PubMed] [Google Scholar]
- 23.Della Chiara G., Gervasoni F., Fakiola M., Godano C., D’Oria C., Azzolin L., Bonnal R.J.P., Moreni G., Drufuca L., Rossetti G., et al. Epigenomic landscape of human colorectal cancer unveils an aberrant core of pan-cancer enhancers orchestrated by YAP/TAZ. Nat. Commun. 2021;12:2340. doi: 10.1038/s41467-021-22544-y. [DOI] [PMC free article] [PubMed] [Google Scholar]
- 24.La Manno G., Soldatov R., Zeisel A., Braun E., Hochgerner H., Petukhov V., Lidschreiber K., Kastriti M.E., Lönnerberg P., Furlan A., et al. RNA velocity of single cells. Nature. 2018;560:494–498. doi: 10.1038/s41586-018-0414-6. [DOI] [PMC free article] [PubMed] [Google Scholar]
- 25.Cao J., Spielmann M., Qiu X., Huang X., Ibrahim D.M., Hill A.J., Zhang F., Mundlos S., Christiansen L., Steemers F.J., et al. The single-cell transcriptional landscape of mammalian organogenesis. Nature. 2019;566:496–502. doi: 10.1038/s41586-019-0969-x. [DOI] [PMC free article] [PubMed] [Google Scholar]
- 26.Jin S., Guerrero-Juarez C.F., Zhang L., Chang I., Ramos R., Kuan C.H., Myung P., Plikus M.V., Nie Q. Inference and analysis of cell-cell communication using CellChat. Nat. Commun. 2021;12:1–20. doi: 10.1038/s41467-021-21246-9. [DOI] [PMC free article] [PubMed] [Google Scholar]
- 27.Toresson H., Mata de Urquiza A., Fagerström C., Perlmann T., Campbell K. Retinoids are produced by glia in the lateral ganglionic eminence and regulate striatal neuron differentiation. Development. 1999;126:1317–1326. doi: 10.1242/dev.126.6.1317. [DOI] [PubMed] [Google Scholar]
- 28.Lathia J.D., Mattson M.P., Cheng A. Notch: from neural development to neurological disorders. J. Neurochem. 2008;107:1471–1481. doi: 10.1111/j.1471-4159.2008.05715.x. [DOI] [PMC free article] [PubMed] [Google Scholar]
- 29.Nakashima M., Toyono T., Akamine A., Joyner A. Expression of growth/differentiation factor 11, a new member of the BMP/TGFβ superfamily during mouse embryogenesis. Mech. Dev. 1999;80:185–189. doi: 10.1016/S0925-4773(98)00205-6. [DOI] [PubMed] [Google Scholar]
- 30.Wolf F.A., Angerer P., Theis F.J. SCANPY: large-scale single-cell gene expression data analysis. Genome Biol. 2018;19:15. doi: 10.1186/s13059-017-1382-0. [DOI] [PMC free article] [PubMed] [Google Scholar]
- 31.Polański K., Young M.D., Miao Z., Meyer K.B., Teichmann S.A., Park J.E. BBKNN: fast batch alignment of single cell transcriptomes. Bioinformatics. 2020;36:964–965. doi: 10.1093/bioinformatics/btz625. [DOI] [PMC free article] [PubMed] [Google Scholar]
- 32.Bergen V., Lange M., Peidli S., Wolf F.A., Theis F.J. Generalizing RNA velocity to transient cell states through dynamical modeling. Nat. Biotechnol. 2020;38:1408–1414. doi: 10.1038/s41587-020-0591-3. [DOI] [PubMed] [Google Scholar]
Associated Data
This section collects any data citations, data availability statements, or supplementary materials included in this article.
Supplementary Materials
(10x magnification, thermal LUT pseudo-color scale, 30 frames per second).
(10x magnification, thermal LUT pseudo-color scale, 30 frames per second).
Data Availability Statement
-
•
Single-cell RNA-seq data have been deposited at in ArrayExpress and are publicly available as of the date of publication. The accession number is listed in the key resources table.
-
•
This paper does not report original code
-
•
Any additional information required to reanalyze the data reported in this paper is available from the lead contact upon request.