

Abstract
The Ce3+/Ce4+ redox couple has a charge transfer (CT) with extreme asymmetry and a large shift in redox potential depending on electrolyte composition. The redox potential shift and CT behavior are difficult to understand because neither the cerium structures nor the CT mechanism are well understood, limiting efforts to improve the Ce3+/Ce4+ redox kinetics in applications such as energy storage. Herein, we identify the Ce3+ and Ce4+ structures and CT mechanism in sulfuric acid via extended X-ray absorption fine structure spectroscopy (EXAFS), kinetic measurements, and density functional theory (DFT) calculations. We show EXAFS evidence that confirms that Ce3+ is coordinated by nine water molecules and suggests that Ce4+ is complexed by water and three bisulfates in sulfuric acid. Despite the change in complexation within the first coordination shell between Ce3+ and Ce4+, we show that the kinetics are independent of the electrode, suggesting outer-sphere electron-transfer behavior. We identify a two-step mechanism where Ce4+ exchanges the bisulfate anions with water in a chemical step followed by a rate-determining electron transfer step that follows Marcus theory (MT). This mechanism is consistent with all experimentally observed structural and kinetic data. The asymmetry of the Ce3+/Ce4+ CT and the observed shift in the redox potential with acid is explained by the addition of the chemical step in the CT mechanism. The fitted parameters from this rate law qualitatively agree with DFT-predicted free energies and the reorganization energy. The combination of a two-step mechanism with MT should be considered for other metal ion CT reactions whose kinetics have not been appropriately described.
Keywords: Ce3+/Ce4+ redox, Marcus theory, EXAFS, density functional theory, charge transfer
1. Introduction
Charge transfer (CT) is integral to many processes such as energy storage, chemical conversion, and biological reactions.1 Theories of CT are crucial to interpret experiments and to predict rates and trends. The Marcus theory (MT) of electron transfer (E) was developed to describe homogeneous self-exchange E reactions.1−3 MT and its extensions rationalize E across liquid–liquid interfaces,1,4 for biological systems,1,5,6 and for reactions at electrode interfaces.7−10 In this work, we use MT to understand a heterogeneous E reaction that initially seems to have discrepancies between the observed kinetics and aqueous ionic structure. Specifically, we study the Ce3+/Ce4+ redox couple in sulfuric acid on different electrodes, which shows notable differences in electrolyte complexation11 between the Ce3+ and Ce4+ oxidation states and extreme asymmetry in the observed redox kinetics. A system is considered asymmetric when the CT coefficient (α) is far from 0.5,12 and Ce3+/Ce4+ is reported to have α < 0.3.13−20 The high voltage and tunable redox potentials achievable by Ce3+/Ce4+ lead to its myriad uses including volumetric analysis and ceric oxidimetry,21,22 chemical oxidation, and energy storage;23−28 thus, understanding the Ce3+/Ce4+ reaction mechanism is important to improve redox kinetics. The work herein highlights the necessity of understanding the cerium ion structure and ligand exchange with the electrolyte to explain the Ce3+/Ce4+ redox kinetics and mechanism. Furthermore, the methodology established to study the cerium CT mechanism is applicable to other redox couples that so far have not been adequately described, such as the V4+/V5+ redox reaction.29,30
The Ce3+/Ce4+ CT mechanism has not been satisfactorily determined, leading to unresolved questions about structure–kinetic relationships and the origin of the highly asymmetric α of Ce3+/Ce4+ in common electrolytes. We have shown that a structural change in the first coordination shell occurs between the Ce3+ and Ce4+ oxidation states,11 in agreement with the literature showing that Ce3+ is preferentially coordinated by water in most acids31−34 and Ce4+ is complexed by anions in acids.35−41 The density functional theory (DFT)-calculated energy of this complexation explains the shift in the Ce3+/Ce4+ redox potential with acid.11,23 However, we identified small differences in the extended X-ray absorption fine structure spectroscopy (EXAFS) of Ce3+ in sulfuric acid compared to other acids, and we were unable to identify the exact structure of Ce4+ in sulfuric acid through EXAFS, which motivated additional EXAFS studies.
The Ce3+/Ce4+ CT has typically been studied as a single outer-sphere E step despite evidence of uneven complexation. A recent study of Ce3+/Ce4+ kinetics on a gold electrode in sulfuric acid corroborated the reports of asymmetry.13 However, this asymmetric behavior could not be accounted for even with an asymmetric model of MT. Electrostatic effects in the region beyond the outer Helmholtz plane were proposed to control the observed kinetics through a rate-determining step (RDS) involving ligand dissociation. Although this finding highlights the importance of considering chemical steps in the overall mechanism, the derived rate law is inconsistent with the experimentally observed exchange current densities as a function of Ce4+ concentration that we report here.
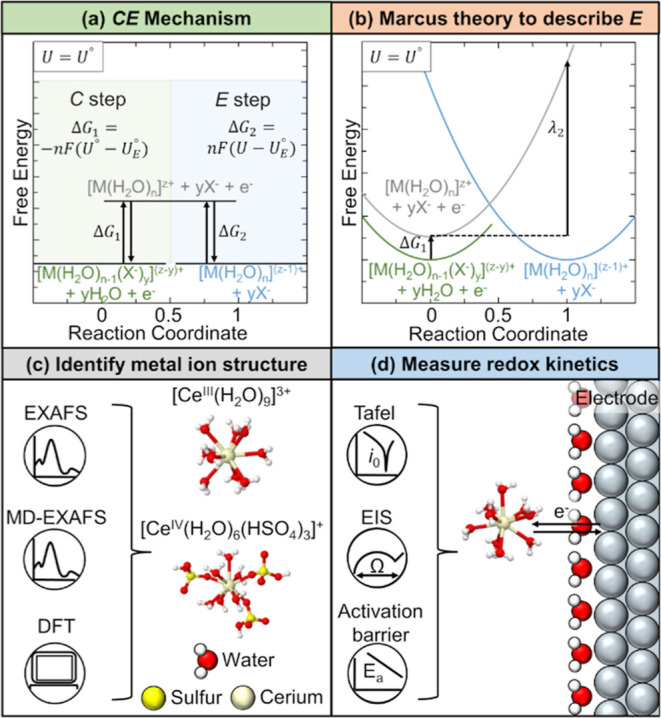
We hypothesize that the Ce3+/Ce4+ CT can be explained by considering ligand-exchange and electron-transfer steps in series. This type of mechanism is an example of a mechanism with chemical (C) and E steps (e.g., CE, EC, or CEC mechanisms).42,43 The CE reaction mechanism is shown in Scheme 1a, where M is a metal ion undergoing an electron transfer and X– is a complexing ligand. From Scheme 1a, the first step is a ligand exchange with free energy ΔG1. We define ligand exchange as the replacement of a water molecule with a complexing ligand in the first solvation shell of M.44 Then, an electron transfer occurs with free energy ΔG2, where the species before and after the E are complexed by the same molecules. When the electrode potential U is equal to the standard redox potential of the overall reaction, U°, ΔG1 is equal to the negative of ΔG2.
Scheme 1. CE Reaction Mechanism.
(a) Steps for a CE
mechanism
and (b) free energy curves for the species involved in the mechanism.
The metal ion, M, undergoes a CE mechanism between the oxidation states
of Mz+ and M(z–1)+, with Mz+ undergoing a ligand exchange
(C step) before the E step. System free energy is depicted at the
electrode potential U = U°.
The redox potential of the overall reaction is U°,
and the redox potential of the electron transfer step is UE°. The
free energy of the E step is  . This difference is related to the C step
energy, ΔG1, through the Nernst
equation. The reorganization energy, λ2, is defined
as the energy required to change the reactant and solvent nuclear
configuration to the configurations of the product. To inform the
Ce3+/Ce4+ CT mechanism, we identify the (c)
Ce3+ and Ce4+ structures using EXAFS, molecular
dynamics EXAFS (MD-EXAFS), and DFT calculations and the (d) Ce3+/Ce4+ kinetics (exchange current density, i0, and activation barrier, Ea) in
sulfuric acid using Tafel plots and electrochemical impedance spectroscopy
(EIS) to extract CT resistances (Ω) at different temperatures.
. This difference is related to the C step
energy, ΔG1, through the Nernst
equation. The reorganization energy, λ2, is defined
as the energy required to change the reactant and solvent nuclear
configuration to the configurations of the product. To inform the
Ce3+/Ce4+ CT mechanism, we identify the (c)
Ce3+ and Ce4+ structures using EXAFS, molecular
dynamics EXAFS (MD-EXAFS), and DFT calculations and the (d) Ce3+/Ce4+ kinetics (exchange current density, i0, and activation barrier, Ea) in
sulfuric acid using Tafel plots and electrochemical impedance spectroscopy
(EIS) to extract CT resistances (Ω) at different temperatures.
Multiple studies have developed models for the kinetics and current–potential responses of coupled electron-transfer chemical reactions,7,42,43,45−50 as well as tested the validity of these mechanisms by fitting them to the experimental data of organic compounds42,46,51 and heterogeneous metal ion complexes.7,49 MT has been used to understand the E step in coupled E and C systems such as organic compounds,46,52 transition metal ions,7,53 transition metal oxides,50 and coupled redox-inactive metal ion–organic electron acceptor pairs.54Scheme 1b shows how the free energy parabolas derived from standard MT can be used to describe the free energies of the species involved in a CE mechanism. The difference in values of the free energy curves at the reaction coordinate value of 1 gives information about the reorganization energy of the E step, λ2. Importantly, several of these studies note that an ongoing challenge in identifying CT mechanisms is obtaining accurate structural information of reactants and products53 as well as the intermediate species46 undergoing CT.
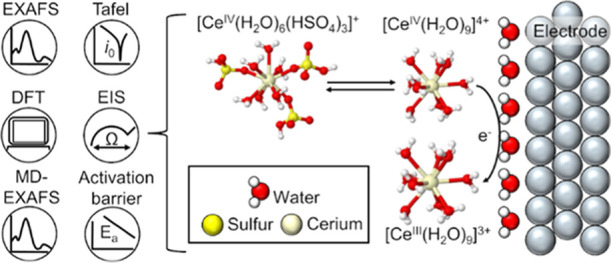
Herein, we confirm the Ce3+ and Ce4+ structures and present a CT mechanism in sulfuric acid. We use the EXAFS and MD-EXAFS spectra of the Ce L3-edge and K-edge to address unresolved uncertainties about the structure of Ce3+ and Ce4+ in sulfuric acid (Scheme 1c) and confirm the favorability of these structures through DFT modeling. Ce3+ coordinates with nine water molecules as [CeIII(H2O)9]3+ and Ce4+ likely complexes with six water molecules and three bisulfates as [CeIV(H2O)6(HSO4)3]+. We show that the Ce3+/Ce4+ CT kinetics are similar as a function of Ce4+ concentration and temperature on platinum (Pt) and glassy carbon (GC). We use two independent methods to obtain the standard rate constants and CT coefficients for the Pt and GC rotating disk electrodes (RDEs), namely, the Tafel method and the CT resistance method (Scheme 1d). The similar rate constants, CT coefficients, and activation energies on two different electrode surfaces implies an outer-sphere CT mechanism. We measure a low cathodic CT coefficient of α = 0.23, in qualitative agreement with prior reports of an asymmetric CT reaction (Table S1). We explain this behavior through a mechanism where the anion-complexed Ce4+ species rapidly undergoes a ligand exchange to form [CeIV(H2O)9]4+, which is then followed by a rate-determining outer-sphere E between [CeIV(H2O)9]4+ and [CeIII(H2O)9]3+. We derive a rate law based on this CE mechanism that results in a better fit to the experimentally observed kinetic data than a Butler–Volmer (BV) rate law. Using this CE rate law, we extract parameters such as reorganization energy and Gibbs free energy of the ligand exchange step. We find agreement between the experimentally fitted and DFT-predicted reorganization energies and ligand-exchange free energies and show that the fitted ligand-exchange free energy agrees with the shift in redox potential observed for the Ce3+/Ce4+ redox couple between HClO4 (a non-complexing acid) and H2SO4.23 These findings demonstrate the necessity of considering ligand-exchange energetics to rationalize CT kinetics and shed light on the Ce3+/Ce4+ CT reaction, which will aid various electrochemical applications.
2. Results and Discussion
2.1. Structures of Ce3+ and Ce4+ in Sulfuric Acid from EXAFS
We use Ce K-edge and L3-edge EXAFS to resolve uncertainties in the Ce3+ and Ce4+ structures in sulfuric acid from our prior work solely at the L3-edge.11 The first uncertainty was the Ce3+–O coordination number (CN) of 9, which was previously obtained without using a known solid crystalline standard for calibration.11 The second uncertainty was whether Ce3+ in sulfuric acid had Ce–sulfate or bisulfate complexation. The third uncertainty was in the accuracy of the fit of the EXAFS data of Ce4+ in sulfuric acid at the Ce L3-edge, which did not prove the presence of sulfate or bisulfate in the first coordination shell of Ce4+.11 Herein, we use CeCl3·7H2O and CeO2 standards to confirm our previously reported Ce–O CNs and use the Ce K-edge and additional L3-edge EXAFS data to show evidence that Ce3+ coordinates solely with water and Ce4+ complexes with three bisulfate anions. The Ce K-edge allows for quality data at higher k values than the L3-edge, where interference from the L2-edge occurs for lanthanides between 9 and 15 Å–1. Thus, the K-edge gives more accurate structural information for the CNs and scattering distances between Ce4+ and its surrounding atoms.33 Measuring at an additional edge allows for co-fitting both sets of EXAFS data, which will improve the fit statistics. We also collect EXAFS data at the Ce L3-edge to elucidate the influence of Ce ion concentration and acid concentration on the cerium structure. Our MD-EXAFS predictions of different possible cerium complexes help to interpret the experimental spectra.
We show that the Ce3+–O CN in sulfuric acid is 9 using co-fits of EXAFS data at the Ce L3- and K-edges. To obtain accurate CNs for Ce3+ solutions, we first record the EXAFS data of a Ce3+ standard, CeCl3·7H2O, at both Ce L3- and K-edges. We determine an amplitude reduction factor, S02, value of 1.5 for Ce3+ at the Ce K-edge by fitting the CeCl3·7H2O standard using ARTEMIS,55 as shown in Figure 1a. The fit of the magnitude component in the R space and the fit in the k space of the CeCl3·7H2O standard and fitting parameters are included in the Supporting Information (Figure S1 and Table S2). The fit of the CeCl3·7H2O standard at the Ce L3-edge is included in the Supporting Information (Figure S2 and Table S2), and the S02 value for the Ce L3-edge was 1.1. Using these S02 values for the Ce K- and L3-edges, we co-fit the EXAFS spectra of a 0.05 M Ce3+ + 2 M H2SO4 solution at the Ce K-edge, as can be seen in Figure 1b, and a 0.1 M Ce3+ + 2 M H2SO4 solution at the Ce L3-edge, and we obtain a Ce3+–O CN of 8.7 ± 0.6. Different concentrations were necessary at the two Ce edges to optimize the signal while avoiding energy attenuation through the sample. The CN is consistent with the value of 9 that we previously reported for Ce3+ in acidic solutions including sulfuric acid.11 From the fit, we also obtain a Ce3+–O scattering distance of 2.541 ± 0.004 Å, which agrees within 0.01% of our previously reported Ce3+–O distance in sulfuric acid.11 The Ce K-edge fits in the R- and k-space (Figure S3), and the Ce L3-edge fits (Figure S4 and Table S3) are shown in the Supporting Information. By using both K- and L3-edges and a standard, the fit here gives additional confidence to our previous report on the Ce3+–O CN and distance in sulfuric acid.
Figure 1.
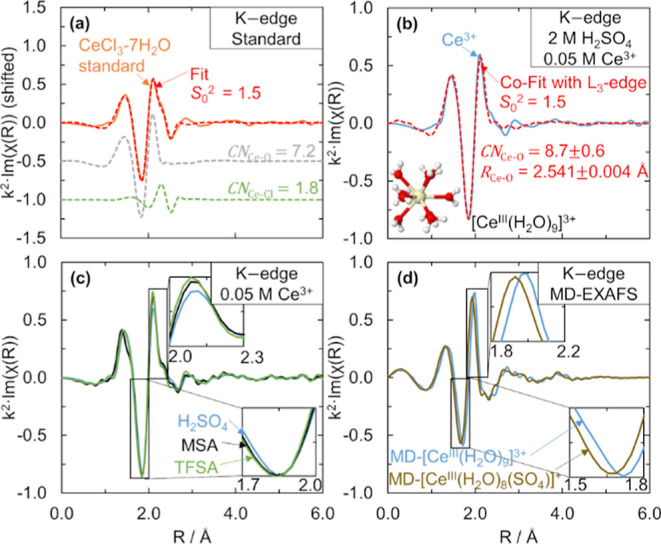
Ce K-edge k2·χ(R) EXAFS spectra and fits for different Ce3+ species. (a) CeCl3·7H2O standard (orange solid line) with fit (red dashed line) and Ce–O and Ce–Cl path contributions (shifted in the y-axis). (b) 0.025 M Ce2(CO3)3 in 2 M H2SO4 (blue solid line) with fit using the Ce–O path (red dashed line). The inset structure shows [CeIII(H2O)9]3+ from a MD snapshot. (c) 0.025 M Ce2(CO3)3 in 2 M H2SO4 (blue solid line), 2 M MSA (black solid line), and 2 M TFSA (light green solid line). The insets are zoomed-in portions of the EXAFS spectra. (d) Simulated MD-EXAFS spectra of [CeIII(H2O)9]3+ (blue solid line) and [CeIII(H2O)8(SO4)]+ (brown solid line) for comparison to the experimental data in (a–c). The insets are zoomed-in portions of the EXAFS spectra. During the preparation of Ce solutions with Ce2(CO3)3, the carbonate reacts with H+ to form CO2, which we then remove by sparging with inert nitrogen before collecting the measurements.
We also confirm that the dominant Ce3+ structure in H2SO4 is [CeIII(H2O)9]3+ by comparing the EXAFS spectra of Ce3+ to MD-EXAFS spectra. The co-fit of the EXAFS spectra of Ce3+ in 2 M H2SO4 did not improve with the addition of a Ce3+–S scattering pathway (Figure S5). We compare our experimental Ce K-edge EXAFS data of Ce3+ in 2 M acids in Figure 1c. Ce3+ coordinates only with water in triflic acid (TFSA)33 and methanesulfonic acid (MSA),11 so the spectra of Ce3+ in TFSA and MSA can serve as Ce3+–water coordinated references. We observe no shift in the peak centered at ∼1.85 Å and a slight shift to the right in the peak at 2.1 Å in H2SO4 compared to MSA or TFSA. From the MD-EXAFS spectra of [CeIII(H2O)9]3+ and [CeIII(H2O)8(SO4)]+ in Figure 1d, we can see a shift to shorter distances in both peaks when Ce3+ is complexed by sulfate because the average Ce3+–O scattering distance is shortened. Because we do not see this shift to the left in our experimental EXAFS spectra of Ce3+ in H2SO4, as shown qualitatively in Figure 1c, or quantitatively from the fits of Ce3+ in TFSA, MSA, and H2SO4 at the Ce K-edge (Figure S6 and Table S3), Ce3+ does not complex with sulfate or bisulfate. Additionally, the EXAFS spectra do not change with sulfuric acid concentration (Figure S7). Based on this evidence that Ce3+ does not complex with sulfate or bisulfate, and the evidence that the Ce3+–O CN is 9, we conclude that Ce3+ exists as [CeIII(H2O)9]3+, which is consistent with our previous DFT-predictions.11
Comparisons between the experimental Ce4+ EXAFS and MD-EXAFS data of possible Ce4+ species in H2SO4 imply that Ce4+ complexes with either sulfate (SO42–) or bisulfate (HSO4–) anions. From Figure 2a, we observe a shift in the Ce–O scattering peak as we go from the EXAFS spectra of Ce3+ to Ce4+ in H2SO4 at the Ce K-edge (confirmed at the Ce L3-edge, Figure S8). The shift in Ce–O distance is 0.16 Å based on the co-fits of Ce3+ and Ce4+ at both edges. We show the MD-EXAFS spectra of [CeIII(H2O)9]3+ and two possible Ce4+ complexes [CeIV(H2O)8SO4]2+ and [CeIV(H2O)9]4+ in Figure 2b. Those Ce4+ MD-EXAFS complexes were selected to illustrate the expected effect of sulfate complexation in the first coordination shell of Ce4+ relative to solely water coordination since the exact Ce4+ anion complex structure was not known. The Ce–O shift of 0.16 Å that we observe experimentally between Ce3+ and Ce4+ is expected because the Ce4+ ionic radius is 0.14–0.20 Å smaller than that of Ce3+.56 The experimental value of 0.16 Å is closer to the 0.13 Å shift between MD-EXAFS [CeIV(H2O)8SO4]2+ and [CeIII(H2O)9]3+ compared to the 0.11 Å shift between [CeIV(H2O)9]4+ and [CeIII(H2O)9]3+. The DFT-predicted shifts in Ce–O from [CeIII(H2O)9]3+ to bisulfate complexes ([CeIV(H2O)8HSO4]+ and [CeIV(H2O)6(HSO4)3]+) are 0.14 Å, also close to the experimental shift (Table S4). More importantly, scattering peaks at ∼2.6 Å appear for Ce4+ in H2SO4 that are not present for Ce3+, as shown in the inset in Figure 2a. From the inset in Figure 2b, similar peaks appear in the MD-EXAFS spectra of [CeIV(H2O)8(SO4)]2+ that are not observed for [CeIV(H2O)9]4+ or [CeIII(H2O)9]3+. We confirm that the peaks in this region of the MD-EXAFS spectra are due to sulfate scattering by comparing the MD-EXAFS-generated spectrum for [CeIV(H2O)8SO4]2+ with and without sulfate scattering pathways included from Figure 2c. The S atom in either of the bisulfate complexes also is at the same distance as the S from sulfate. The peaks at ∼2.6 Å we see for Ce4+ in 2 M H2SO4 in the K-edge spectra are also present in the Ce4+ EXAFS at the Ce L3-edge (Figure S8), and the peak heights increase with increasing H2SO4 concentration (Figure S9), further suggesting that these peaks are associated with an anion, which would be either SO42– or HSO4–. To further probe the anion complexation of Ce4+ in H2SO4, including the type of anion and CN, we next fit the Ce4+ EXAFS data.
Figure 2.
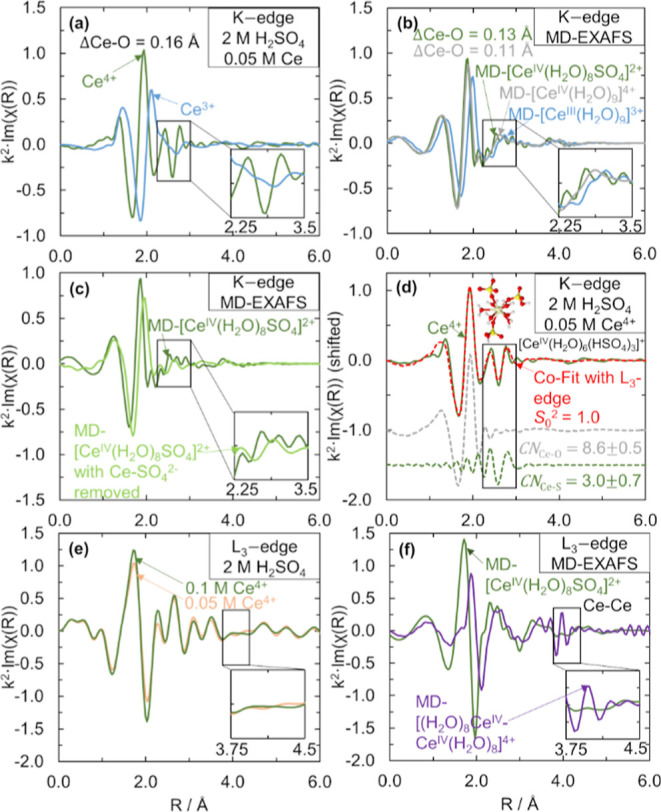
Ce K- and L3-edge k2·χ(R) EXAFS and fits for different Ce3+ and Ce4+ species. (a) 0.025 M Ce2(CO3)3 (blue solid line) and 0.025 M Ce2(CO3)3 oxidized to Ce4+ in 2 M H2SO4 (dark green solid line), with the inset showing the zoomed-in region of spectra. (b) Simulated MD-EXAFS spectra of [CeIII(H2O)9]3+ (blue solid line), [CeIV(H2O)9]4+ (gray solid line), and [CeIV(H2O)8(SO4)]2+ (dark green solid line), with the inset showing the zoomed-in region of spectra and green-colored ΔCe–O distance representing the shift in Ce–O distance from MD-EXAFS [CeIII(H2O)9]3+ to [CeIV(H2O)8(SO4)]2+ and gray-colored ΔCe–O distance representing the shift in Ce–O distance from MD-EXAFS [CeIII(H2O)9]3+ to [CeIV(H2O)9]4+. (c) Simulated MD-EXAFS spectra of [CeIV(H2O)8(SO4)]2+ (dark green solid line) and [CeIV(H2O)8(SO4)]2+ with paths associated with sulfate scattering removed (light green solid line), with the inset showing the zoomed-in region of spectra. (d) 0.025 M Ce2(CO3)3 oxidized to Ce4+ in 2 M H2SO4 (dark green solid line) with the best fit (red dashed line) and Ce–O and Ce–S path contributions (shifted in the y-axis). The inset is the proposed [CeIV(H2O)6(HSO4)3]+ structure. (e) 0.025 M Ce2(CO3)3 oxidized to Ce4+ (orange solid line) and 0.05 M Ce2(CO3)3 oxidized to Ce4+ (dark green solid line), both in 2 M H2SO4, with the inset showing the zoomed-in region of spectra. (f) Simulated MD-EXAFS spectra of [CeIV(H2O)8(SO4)]2+ (dark green solid line) and [(H2O)8CeIV–CeIV(H2O)8]8+ (purple solid line), with the inset showing the zoomed-in region of spectra.
Ce4+ likely complexes with three bisulfates in the first coordination shell based on EXAFS fits and DFT-predicted complexation free energies. To fit our experimental Ce4+ K- and L3-edge EXAFS, we measure a CeO2 standard to determine a value for S02 (Figure S10, with fitting results included in Table S5), which gives us confidence in the total CN of Ce4+. By co-fitting 0.05 M Ce4+ in 2 M H2SO4 EXAFS data at the Ce K-edge and 0.1 M Ce4+ in 2 M H2SO4 EXAFS data at the Ce L3-edge with Ce–O and Ce–S scattering pathways, as shown in Figure 2d, we confirm evidence of sulfate or bisulfate in the first coordination shell because the Ce–S scattering pathway fits the peaks centered at 2.6 Å. The result of the co-fit at the Ce L3-edge is shown in Figure S8. The co-fit with just a Ce–O scattering shell for both edges results in a worse fit (Figure S11). All parameters for Ce4+ EXAFS fitting are given in the Supporting Information (Table S6). From the co-fit with a Ce–S scattering pathway included, the Ce4+–O distance is 2.382 ± 0.006 Å and the Ce4+–S distance is 3.671 ± 0.016 Å. We identify a Ce4+–O CN of 8.6 ± 0.5 and a Ce4+–S CN of 3.0 ± 0.7.
It is not possible to distinguish from EXAFS whether the Ce–S path is due to a sulfate or a bisulfate anion in the first coordination shell because the Ce–S scattering distance is similar for Ce4+–sulfate and Ce4+–bisulfate complexes, so we turn to DFT modeling to determine whether sulfate or bisulfate complexation is more favorable. Previously, we compared the DFT-predicted ligand-exchange free energies for Ce4+ complexed with one or two sulfates or one or two bisulfates and found that of these four options, the [CeIV(H2O)8SO4]2+ species was the most energetically favorable.11 Here, we extend this analysis to compare the free energies of Ce4+ complexed with three sulfates and Ce4+ complexed with three bisulfates. We find that the free energy of the [CeIV(H2O)6(HSO4)3]+ species is the most energetically favorable Ce4+–bisulfate-complexed species considered, and its energy is comparable to that of the [CeIV(H2O)8SO4]2+ species (Figure S12). Also, considering the relative acid dissociation constants of HSO4– and SO42–,57 HSO4– will be present at 99 times greater concentration than SO42–. Although studies have proposed a Ce4+ structure with three sulfates,36 this structure is unfavorable based on our DFT calculations. The DFT-predicted ligand-exchange free energy for [CeIV(H2O)6(HSO4)3]+ is also in good agreement with the experimentally observed shift in redox potential for the Ce3+/Ce4+ redox couple from 1 M HClO4 (a non-complexing acid58) to 1 M H2SO4 of −28.9 kJ/mol. Because this structure is the most energetically favorable based on DFT and matches our experimental CNs of nine oxygens and three sulfurs for each Ce atom, we conclude that the dominant Ce4+ species is [CeIV(H2O)6(HSO4)3]+.
We do not detect cerium dimers for 0.05–1.0 M Ce4+ in 2 M H2SO4, unlike what has been proposed for Ce4+ in HClO459−62 and HNO3.39,40 In Figure 2e, we see that increasing Ce4+ concentration from 0.05 to 0.1 M does not result in an increase in any features around 4.0 Å, the distance at which the Ce–Ce scattering pathway from dimers is expected to appear based on the MD-EXAFS spectra of a dimer species, as shown in the inset in Figure 2f. The lack of dimers in H2SO4 may be due to the stronger anion complexation of Ce4+ single ions in H2SO4 compared to in HNO3 and HClO4.
Our findings from the Ce K-edge and additional Ce L3-edge EXAFS in sulfuric acid support that Ce3+ coordinates with nine water molecules, while Ce4+ complexes with at least one sulfate or bisulfate.11 Our EXAFS measurements indicate that a structural change occurs within the first coordination shell of Ce between Ce3+ and Ce4+. Thus, a CT mechanism for the cerium redox reaction must include an inner-sphere ligand exchange. In the next section, we present kinetic results that show that despite this inner-sphere structural change, the Ce3+/Ce4+ redox reaction behaves as if outer sphere.
2.2. Kinetic Measurements of the Ce3+/Ce4+ CT and Modeling with BV
We measure the Ce3+/Ce4+ CT coefficient, standard rate constant, and activation energy on two electrode surfaces, Pt and GC, under identical reaction conditions and show the results are consistent with an outer-sphere electron-transfer RDS. Although Ce3+/Ce4+ redox kinetics have been measured on multiple electrodes (Table S1), the experimental conditions varied, making it difficult to draw conclusions about the relative rates on different electrodes. We emphasize the importance of controlled mass transport conditions and consideration of multiple possible reactions when extracting kinetic parameters12 as well as the utility of comparing kinetic parameters obtained through different measurement techniques. Here, we use two independent methods (Tafel method and the CT resistance method) to ensure comparable and accurate steady-state kinetic measurements. We study the Ce4+ reduction rates to avoid convolution with oxygen evolution or electrode oxidation during Ce3+ oxidation and control the mass transport to allow extraction of kinetically limited rates. See the Experimental Methods section for more details.
To obtain the Ce3+/Ce4+ kinetic parameters and a rate law on a Pt electrode in sulfuric acid, we use the Tafel method to measure exchange current densities, i0, as a function of Ce4+ concentration and temperature, as shown in Figure 3a,b, respectively. The data in Figure 3c shows the cathodic Tafel slope as a function of Ce4+ concentration. The Ce3+/Ce4+ exchange current densities for Pt extracted from the CT resistance method (Figure S13) agree within 31% of the Tafel method. The exchange current densities increase with increasing Ce4+ concentration until [Ce4+] = 0.04 M and then decrease. The exchange current densities increase exponentially with temperature.
Figure 3.

Tafel analysis of Ce3+/Ce4+ kinetic measurements on Pt and GC electrode surfaces. Kinetic measurements and fit (solid line) using the BV equation of the Ce3+/Ce4+ redox couple. Exchange current densities, i0, extracted from Tafel plots as a function of Ce4+ concentration for (a) Pt RDE and (d) GC RDE. i0 extracted from Tafel plots as a function of temperature for (b) Pt RDE and (e) GC RDE. Cathodic Tafel slopes as a function of Ce4+ concentration for (c) Pt RDE and (f) GC RDE. Ce4+ concentrations were determined by titration. Reported values are averaged from three runs, with error bars representing 1 standard deviation from the average value in both horizontal and vertical directions. Data in (a,c,d,f) collected at room temperature in 2 M H2SO4 at a total cerium concentration of 0.05 M. Data in (b,e) collected at a total cerium concentration of 0.05 M with a Ce4+ concentration of 0.026 and 0.025 M, respectively. An Ag/AgCl reference electrode and a graphite rod counter electrode were used for all measurements. Measurements were done at 2000 rpm of the RDE. The rate constant k0, the cathodic CT coefficient α, and the activation energy Ea were obtained through minimizing the NMSE of the data.
Differences in the i0 values from the Tafel and CT resistance methods are comparable to our previous studies for the V2+/V3+ system (∼40%)63 as well as others for Ce3+/Ce4+ on Pt in 4.5 M MSA (35% difference in i0 between Tafel and CT methods).64 We attribute these differences to uncertainty in fitting of the EIS data, which depends on the selection of an appropriate equivalent circuit and the use of the correct OCV value without influence from competitive side reactions. Because the Tafel method is used more frequently in the literature and is less prone to error, we use the Tafel exchange current density values to study the Ce3+/Ce4+ CT mechanism. We note that despite the 30% difference in i0, the activation barriers extracted from each method are within 10% of each other on Pt.
The exchange current densities for Pt reveal that the Ce3+/Ce4+ redox reaction is asymmetric, with a low α that is unusual for metal ion CTs and a standard rate constant and activation energy that agree with the reported values (Table S1). We attempt to fit our kinetic data through the BV formulism to describe the kinetic current density, iK,BV (eq 1a), which assumes a one-step E and relates exchange current density, i0,BV (eq 1b), to the Ce3+ and Ce4+ concentrations, where k0 is the standard rate constant and α is the cathodic CT coefficient.
| 1a |
| 1b |
where U is the electrode potential, U° is the standard equilibrium potential (1.44 V vs SHE), and Ueq is the equilibrium potential corresponding to the [Ce3+] and [Ce4+] conditions at which the measurement was taken. The normalized mean-square error (NMSE) fit of eq 1a to the exchange current densities using k0 and α as fitting parameters is shown in Figure 3a. The k0 value obtained from the fit is 1.43 × 10⁻⁴ ± 7 × 10⁻⁶ cm/s at 298 K, which aligns with many of the standard rate constants reported in the literature for Ce3+/Ce4+ in sulfuric acid (Table S1). The activation energy Ea on Pt from fitting the data in Figure 3b is 48.3 ± 21 kJ/mol, which, while having a large degree of uncertainty, agrees within 35% of an activation energy calculated from cerium redox standard rate constants on Pt in sulfuric acid.65 The value of α is 0.23 ± 0.005, agreeing with reports for Pt (Table S1) and indicating the asymmetric nature of the cerium redox reaction. The CT behavior of cerium with a Pt electrode is the same between 0.01 and 0.05 M cerium (Figures S14–S16), with the magnitude of exchange current densities dependent on the total concentration of cerium.
The large cathodic Tafel slopes on Pt corroborate the low value of α and therefore the asymmetry of the cerium redox reaction, but the BV equation does not capture the Tafel slopes’ dependence on Ce4+ concentration. The cathodic Tafel slopes shown in Figure 3c are between 220 and 320 mV/decade as a function of [Ce4+], which correspond to α values between 0.18 and 0.27. These α values are similar to those obtained from fitting eqs 1a and 1b to the data in Figure 3a, giving further evidence that Ce3+/Ce4+ is highly asymmetric. However, unlike the BV equation where α is constant, here we see a trend in cathodic Tafel slope with concentration. We also measure cathodic Tafel slopes as a function of temperature (Figure S17) and find that the Tafel slope increases with temperature. The BV fit does not entirely capture the dependence of the Tafel slope on temperature. The inability of the BV equation to capture the cathodic Tafel slopes’ dependence on Ce ion concentration suggests that a more accurate rate law than that described through BV kinetics is necessary to describe the Ce3+/Ce4+ redox kinetics on Pt.
We repeat the same kinetic analysis as Pt for a GC electrode and find that the redox reaction is asymmetric on GC as well. Fitting eqs 1a and 1b to the Tafel exchange current densities as a function of [Ce4+] shown in Figure 3d, we determine a k0 value of 2.99 × 10⁻⁵ ± 1.30×10⁻⁶ cm/s and an α value of 0.23 ± 0.008. The exchange current densities derived from CT resistances are given in the Supporting Information (Figure S18). The α value of GC aligns well with the reported values, but the standard rate constant is lower than most of the previously reported values in sulfuric acid (Table S1). Based on our Tafel exchange current density versus temperature data shown in Figure 3e, the activation energy on GC is 41.2 ± 14.0 kJ/mol, which is 7.1 kJ/mol smaller than that of Pt. To our knowledge, this is the first time the activation energy of Ce3+/Ce4+ has been compared between two electrodes under the same conditions. The magnitude of the cathodic Tafel slopes as a function of Ce4+ concentration ranges from 170 to 250 mV/decade as shown in Figure 3f, which corresponds to α values between 0.24 and 0.35. Although the fitted value of α qualitatively agrees with the values predicted from the cathodic Tafel slopes, the BV fit is unable to capture the decrease in Tafel slope with [Ce4+]. Also, the BV fit only partially captures the dependence of the cathodic Tafel slopes with temperature (Figure S19). To further probe the CT mechanism of Ce3+/Ce4+, it is beneficial to compare the kinetic behavior on the Pt and GC electrodes.
The similar exchange current densities, CT coefficients, activation energies, and cathodic Tafel slopes for the Pt and GC RDEs in Figure 3 imply that the cerium redox kinetics behave as an outer-sphere reaction. The exchange current densities and rate constants of Pt and GC are within a factor of 5 of one another, comparable to the differences for various outer-sphere redox couples on different electrode surfaces (Table S7). Even for well-known outer-sphere redox reactions such as [Fe(CN)6]3–/[Fe(CN)6]4– in 1.0 M KCl,66 the electrode materials affect the standard rate constants of various outer-sphere redox couples by a factor of 2–9.66−68 These electrode effects are ascribed to a variety of factors, including the Frumkin effect,69 a metal’s electronic properties, for example, electronic spillover distance, work function, intrinsic electric field,70 and the interaction of adsorbed water on the electrode surface with electroactive species.71−73 The activation barriers on the Pt and GC RDEs in this work are similar, suggesting a small electrode influence on the kinetics, further underscoring the outer-sphere behavior of the Ce3+/Ce4+ electron transfer. Additionally, the Pt and GC RDE cathodic Tafel slopes fall within the same range of 150–320 mV/decade and the α values are both 0.23, highlighting not only a similar kinetic behavior but also the extreme asymmetry in the CT on both electrodes.
From our structural and kinetic results, the Ce3+/Ce4+ reaction is unlikely to be purely a one-step electron-transfer reaction. Although obeying an outer-sphere kinetic behavior, the value of α falls far below the expected value of 0.5, suggesting that a rate law based on a one-step electron transfer is inappropriate to model the Ce3+/Ce4+ redox kinetics. Additionally, the BV rate law predicts constant cathodic Tafel slopes with [Ce4+], which we do not observe on either Pt or GC. Our structural data from Figures 1 and 2 also suggests that solely a one E step mechanism cannot adequately describe the cerium redox kinetics because of the structural change that must occur from [CeIII(H2O)9]3+ and [CeIV(H2O)6(HSO4)3]+.
2.3. Proposed Mechanism for the Ce3+/Ce4+ Redox Reaction in Sulfuric Acid
We propose a mechanism that aligns with both our structural and kinetic data and discuss the implications of the resulting fit of our experimental data to a rate law derived from the mechanism. The appropriate CT mechanism and rate law for the Ce3+/Ce4+ redox reaction must satisfy the following nine criteria observed from our structural and kinetic data:
-
1.
A structural change occurs in addition to an electron transfer.
-
2.
Ce3+ preferentially coordinates with water as [CeIII(H2O)9]3+.
-
3.
Ce4+ favorably complexes with three bisulfates as [CeIV(H2O)6(HSO4)3]+.
-
4.
There is minimal influence of the electrode on kinetic activity.
-
5.
There is a maximum in the exchange current density as a function of Ce4+ concentration (with the total cerium concentration fixed) occurring between 60 and 80% [Ce4+] relative to the total cerium concentration.
-
6.
The exchange current density increases with increasing temperature.
-
7.
The cathodic Tafel slope is large, with values between 170 and 320 mV/decade.
-
8.
The cathodic Tafel slope decreases with an increasing ratio of Ce4+ concentration to the total cerium concentration.
-
9.
The cathodic Tafel slope increases with increasing temperature.
In Table 1, we summarize six different possible mechanisms and whether each mechanism and its corresponding rate law matches the nine criteria. We begin with the simplest mechanism and expand complexity only when needed to describe the data.74 We show that a CE mechanism where electron transfer is the RDS is the simplest mechanism that satisfies criteria 1–9. The rate law uses MT to describe the electron-transfer step. Derivations for all rate laws considered are in the Supporting Information (see Tables S8 and S9).
Table 1. Different Possible Mechanisms and Agreement or Disagreement of the Mechanism and the Corresponding Rate Law to the Structural and Kinetic Data Observed Experimentally for the Ce3+/Ce4+ CTa.
| |
criteria: observedCe3+/Ce4+ structural
and kinetic behavior |
|||||||||
|---|---|---|---|---|---|---|---|---|---|---|
| mechanism and rate law | 1 | 2 | 3 | 4 | 5 | 6 | 7 | 8 | 9 | |
| one-step E | BV | yes | yes | yes | yes | yes | yes | yes | no | yes |
| MT | no | — | — | yes | no | yes | yes | yes | yes | |
| two-step | CE Mech, E RDS | yes | yes | yes | yes | yes | yes | yes | yes | yes |
| EC Mech, E RDS | yes | no | yes | yes | yes | yes | yes | yes | yes | |
| EC Mech, C RDS | yes | yes | yes | yes | no | no | no | no | no | |
| CE Mech, C RDS | yes | yes | yes | yes | no | no | no | no | no | |
Mechanisms are separated into one and two step. E RDS refers to the electron-transfer step being the RDS, whereas C RDS refers to ligand exchange being the RDS. The numbers in the criteria row correspond with the list of criteria at the beginning of this section. The dashes included for the MT rate law indicate that these criteria are not considered since they are dependent on criterion 1 being met.
The BV and the MT rate laws for a one-step electron-transfer mechanism do not meet all the criteria established from our experimentally observed structural and kinetic data (Table 1). The BV rate law does not adequately describe the behavior of the cathodic Tafel slope as a function of [Ce4+] concentration (criterion 8) because the Tafel slope from BV is constant with potential. Although the BV rate law describes the Ce3+/Ce4+ CT asymmetry through the low value of α, the BV rate law is only an empirical model, and as a result, the fitting parameters are unphysical. The MT rate law better captures the behavior of the cathodic Tafel slopes; however, it does not allow for a structural change to occur between the redox species (criterion 1), and it does not satisfy criterion 5 (Figure S20). For a symmetric MT rate law, the exchange current density maximum occurs at 50% Ce4+. As has been previously shown,13 although asymmetric MT can mathematically describe the observed asymmetry in the kinetics, the reorganization energies from fitting the data are unreasonably large (see the Supporting Information for further discussion of an asymmetric MT rate law). Additionally, the NMSE of the MT fit is higher for both Pt and GC data than the BV fit (Table S9). Since the rate laws for a one-step E mechanism do not satisfy all the observed structural and kinetic data, it is necessary to consider mechanisms that include more than a one-step electron transfer.
We next consider different two-step mechanisms, which we refer to as CE and EC mechanisms. In the CE mechanism, the Ce4+ species, [CeIV(H2O)6(HSO4)3]+, undergoes ligand exchanges with water to form [CeIV(H2O)9]4+ (eq 2a). [CeIV(H2O)9]4+ is subsequently reduced to form [CeIII(H2O)9]3+ (eq 2b). Note that the C step would not in reality occur in a single elementary step, as it involves the exchange of three bisulfates with three water molecules. If one of the C steps were rate limiting, then we would not be able to aggregate the bisulfate exchange into one step as we have in eq 2a. However, we will show below that the bisulfate-exchange C steps are likely quasi-equilibrated; thus, we can condense the ligand exchange into a single step.
| 2a |
| 2b |
In the EC mechanism,
the E step occurs first between the Ce4+ and Ce3+ complexes, followed by ligand exchange
of Ce3+ (see the Supporting Information for details on the EC mechanism). For both the CE and EC mechanisms,
we consider two possible rate laws, based on assuming the RDS is either
the E or C. We show the rate law for the kinetic current density (iK,CE,E) for the CE mechanism when E (eq 2b) is the RDS in eq 3a.  represents the concentration of the water-coordinated
Ce4+ (eq 3b), and A, B, and C are defined
in eqs 3c–3e.
represents the concentration of the water-coordinated
Ce4+ (eq 3b), and A, B, and C are defined
in eqs 3c–3e.
| 3a |
| 3b |
| 3c |
| 3d |
| 3e |
Here, K1 is the
equilibrium constant of the C step, n is the number
of electrons transferred, assumed to be 1, F is Faraday’s
constant, Z2 is the preexponential factor
for the E step,  refers to the concentration of the bulk
Ce4+ species, that is, [CeIV(H2O)6(HSO4)3]+, λ2 is the reorganization energy of the E step, R and T have their usual meanings, η is the overpotential
applied (U – Ueq), and
refers to the concentration of the bulk
Ce4+ species, that is, [CeIV(H2O)6(HSO4)3]+, λ2 is the reorganization energy of the E step, R and T have their usual meanings, η is the overpotential
applied (U – Ueq), and  is the concentration of the bulk Ce3+ species, that is, [CeIII(H2O)9]3+. Figure 4a shows the free energies of the species involved in the CE
mechanism, as well as the physical meaning of some of the fitting
parameters used in the rate law (λ2 and K1). As shown by the free energy parabolas, standard MT
expressions are used to describe the E step.
is the concentration of the bulk Ce3+ species, that is, [CeIII(H2O)9]3+. Figure 4a shows the free energies of the species involved in the CE
mechanism, as well as the physical meaning of some of the fitting
parameters used in the rate law (λ2 and K1). As shown by the free energy parabolas, standard MT
expressions are used to describe the E step.
Figure 4.

Proposed CE mechanism and fit of rate law to kinetic data on Pt assuming that the electron-transfer step (E) is rate determining. (a) Free energy profiles at the equilibrium Ce3+/Ce4+ potential (U = U°) in H2SO4 for the three species involved in the proposed CE mechanism for Ce3+/Ce4+ CT: [CeIV(H2O)6(HSO4)3]+ (green solid line), [CeIV(H2O)9]4+ (gray solid line), and [CeIII(H2O)9]3+ (light blue solid line). Parabolas represent the free energies of the species as a function of reaction coordinate, as defined through MT. The Ce3+/Ce4+ electron transfer is described by the reorganization energy λ2 and the transition-state free energy, ΔG2⧧, and the ligand exchange is described by the equilibrium constant K1. We propose that electron transfer between [CeIV(H2O)9]4+ and [CeIII(H2O)9]3+ is the RDS; that is, [CeIV(H2O)6(HSO4)3]+ and [CeIV(H2O)9]4+ are quasi-equilibrated. (b,c) Fit (dark blue solid line) of the Ce3+/Ce4+ exchange current densities (blue circles) in the 0.05 M Ce/2 M H2SO4 solution on the Pt RDE using the rate law in eqs 3a–3e derived for the CE mechanism assuming that E is RDS as a function of (b) Ce4+ concentration and (c) temperature. (d) Fit (blue solid line) of the Ce3+/Ce4+ cathodic Tafel slopes (blue circles) on the Pt RDE using the rate law in eqs 3a–3e derived for the CE mechanism assuming that the E is RDS as a function of Ce4+ concentration. All fits of the data in (b–d) were obtained through minimizing the NMSE of the data.
Of the rate laws derived from the two-step mechanisms, the only one that meets all criteria is a CE-type mechanism with the E as the RDS (CE, E RDS), as summarized in Table 1. Because the C step involves ligand exchange, and the only Ce3+ species included in the CE mechanism is the [CeIII(H2O)9]3+ species, criteria 1 and 2 are satisfied. The rate law does not incorporate any electrode-dependent properties; thus, criterion 4 is also met. By fitting the exchange current densities and cathodic Tafel slopes for both Pt and GC RDEs to expressions for i0 and Tafel slopes derived from eq 3a, we see that the rate law satisfies all the observed kinetic criteria. The rate law equation for iK,CE,E indicates that i0 will be asymmetric with Ce4+ concentration and increase with temperature (criteria 5 and 6), as shown in Figure 4b,c for Pt. From Figure 4d, the rate law modeled Pt cathodic Tafel slopes agree with the observed Tafel slopes (criteria 7 and 8), and the Tafel slopes also increase with increasing temperature (criterion 9, Figure S21). The parameters used in the fit of the Pt experimental data are shown in Figure 4b–d. The NMSE of the CE, E RDS rate law fit to Pt was the lowest for all rate laws at 0.049. The E step reorganization energy is reasonable at 100.2 kJ/mol, and the equilibrium constant, K1, is small at 1.1 × 10⁻⁷, indicating that the ligand exchange from [CeIV(H2O)6(HSO4)3]+ to [CeIV(H2O)9]4+ is unfavorable, as expected from our EXAFS structural data. Additionally, the observed shift in redox potential for the Ce3+/Ce4+ redox couple from 1 M HClO4 to 1 M H2SO4 is 0.30 V,23 which corresponds to an equilibrium constant of 8.4 × 10⁻⁶, assuming that the shift is due only to Ce4+-anion complexation in sulfuric acid. Thus, criterion 3 is also met. The pre-exponential factor Z2 is equal to the product of the electronic transmission coefficient, precursor equilibrium constant, and nuclear frequency factor (see the Supporting Information),12 and values for the apparent preexponential factor for metal ions at metal–aqueous interfaces are reported to be on the order of 103 to 105 cm/s.75 Our fitted Z2 value of 4.22 × 104 cm/s for Pt is within this range. The fit of the CE, E RDS rate law to the GC data is included in the Supporting Information (Figure S22), with the lowest NMSE of all rate laws fit to the GC data. The fitted Z2 and λ2 values for GC are smaller than those for Pt, and the value of K1 for GC is 2 orders of magnitude larger than the Pt equilibrium constant (Table S9). This K1 value does still correctly predict that Ce4+ is complexed by an anion in sulfuric acid and the CE, E RDS rate law is still the best fitting rate law to the GC data.
We were unable to experimentally confirm the existence of the [CeIV(H2O)9]4+ species. Experimental determination of intermediates in catalysis and electrochemistry through spectroscopy is notoriously difficult because of their small populations and/or short lifetimes.46 We assert that the fact that the CE mechanism is the simplest mechanism that is consistent with our experimental kinetics is evidence of the plausible existence of [CeIV(H2O)9]4+, in accordance with the common use of Occam’s razor in mechanistic studies.76 Additionally, in our previous work,11 we demonstrated that the shift in redox potential observed for Ce3+/Ce4+ from HClO4 to H2SO4 agrees with our calculated change in Gibbs free energy, assuming the [CeIV(H2O)9]4+ species in HClO4 and an anion-complexed species in H2SO4. We note, however, that previous studies suggest a Ce4+-hydrolyzed dimer forms in HClO4.59,61,62 Additional spectroscopic studies of the proposed intermediate and DFT-based calculations of other possible structures such as monomeric and dimeric hydroxides would help test our hypothesized mechanism.
The rate laws derived from the CE and EC mechanisms in which the C step is the RDS and the rate law for the EC mechanism with the E step as RDS do not satisfy the observed structural and kinetic behavior (Table 1) and thus are eliminated as possible mechanisms for the Ce3+/Ce4+ CT. Details of the fits of both the Pt and GC data for these rate laws are included in Figures S23–S25. The rate laws with the rate-determining C step result in an incorrect linear dependence of i0 on [Ce4+]. If a series of C steps were assumed to occur instead of a single C step to go from [CeIV(H2O)6(HSO4)3]+ to [CeIV(H2O)9]4+, and any of these steps were the RDS, then the rate law would still display a linear dependence of i0 on [Ce4+]. Since our observed i0 does not have a linear dependence with [Ce4+], we conclude that none of the C steps are rate determining and can therefore be condensed into a single quasi-equilibrated reaction as shown in eq 2a. In recent work that studied the Ce3+/Ce4+ kinetics in sulfuric acid on a gold electrode,13 it was concluded that the E step was preceded by a rate-determining ligand dissociation step. From their proposed rate law, exchange current density is linear with Ce4+ concentration, as we see for our C RDS rate laws. Therefore, we can rule out the rate-determining ligand dissociation step proposed in this prior work based on its failure to meet criterion 5. The C RDS rate laws also do not capture the values of the cathodic Tafel slopes, the decrease in Tafel slopes with an increase in Ce4+ concentration, or the increase in Tafel slopes with temperature (criteria 7–9). Considering the EC mechanism with the E step assumed to be the RDS (EC, E RDS), the fits to the experimental Pt and GC data (Figure S25) indicate that Ce3+ will favorably complex with an anion, contradicting our experimental EXAFS and thus failing criterion 2. Also, the fitted value of the reorganization energy is unreasonably high at 663 kJ/mol (Table S9). With all this evidence taken together, we reject that these three rate laws and conclude that only the CE, E RDS rate law is consistent with the experimental data. On the principle of Occam’s razor,77 which asserts that the simplest explanation that satisfies all observed data is preferable, we do not consider more complex mechanisms with additional C or E steps.
The parameters K1 and λ2 extracted from the fit to the experimental data of the CE, E RDS rate law compare favorably to DFT-predicted values, allowing us to use DFT to analyze the contributions to the total reorganization energy and possibly make predictions for different systems. Our DFT-predicted K1 for the ligand exchange from [CeIV(H2O)6(HSO4)3]+ to [CeIV(H2O)9]4+ is 9.8 × 10⁻⁹ as compared to the fitted value of 1.1 × 10⁻⁷ for Pt. These equilibrium constants agree qualitatively with the equilibrium constant derived from the Ce3+/Ce4+ redox potential in H2SO4 relative to HClO4. We also calculate the reorganization energy using DFT for the water-coordinated Ce3+/Ce4+ CT to be 87.2 kJ/mol (Table S9). This reorganization energy value falls between the experimentally fitted λ2 values for GC (71.8 kJ/mol) and Pt (100.2 kJ/mol). From DFT, the inner-sphere reorganization energy from the change in the Ce water-coordinated species (e.g., metal–ligand bond length), λi, is 40.4 kJ/mol, and the outer-sphere reorganization energy related to the reorganization of the solvent,12,78 λo, is 46.8 kJ/mol (Table S10). See the Supporting Information (Figure S26) for further discussion on the reorganization energy calculations. Our ability to computationally determine the ligand exchange and reorganization energies for the Ce3+/Ce4+ CT has implications for future efforts to enhance Ce kinetics. By coupling calculated reorganization energy information with known ligand-exchange equilibrium constants, we could use the CE, E RDS rate law to screen acids to determine which would yield optimal kinetic activities. Assuming that the CE, E RDS rate law holds in other acids, we would expect acids with stronger complexing anions (smaller K1) to exhibit slower Ce3+/Ce4+ kinetics than acids with weaker complexing anions. If the reorganization energies were calculated for Ce-anion complexed species, we could also calculate the expected rates in acids if the dominant mechanism switches to be EC (see the Supporting Information).
Although the CE, E RDS model fits the Pt experimental data and DFT values, we observe discrepancies between the Pt and GC fitted parameters, which could be because we ignore the effect of temperature on Z2 in all considered rate laws. The λ2 and Z2 values for GC are smaller than those of Pt (Table S9), whereas the K1 value for GC is larger. Although we expect a difference in Z2 between Pt and GC due to factors such as the Frumkin effect, the metal’s electronic properties, and the effect of water adsorption on the electrode, it is unexpected that there would be different λ2 and K1 values. In our model, we captured the temperature dependence of the kinetic activity through the λ2 and K1 parameters and assumed the pre-exponential value Z2 to be independent of temperature. However, it has been noted in the case of weak electronic coupling that the nuclear frequency factor has a T1/2 dependence on temperature,2,79 and Z2 is proportional to the nuclear frequency factor. Thus, it is possible that one reason for the difference in λ2 and K1 between Pt and GC is because we ignore the temperature dependence of Z2. Better treatment of the preexponential factor’s dependence on the temperature through more sophisticated treatments75 as well as kinetic measurements on additional electrodes would be needed in future mechanistic studies of the cerium redox couple.
3. Conclusions
We demonstrate how determining the cerium ions’ structures and characterizing the kinetic behavior as a function of experimental conditions can be used to identify a CT mechanism that is consistent with both experimentally observed and computationally predicted behavior. We show that a rate law where a chemical step (exchange of bisulfate ligands with water) is followed by a rate-determining electron-transfer step, described using MT, successfully captures the extreme asymmetry of the Ce3+/Ce4+ kinetics. Additionally, this mechanism is consistent with the differences in complexation observed for the Ce3+ and Ce4+ oxidation states. The agreement between the rate law-modeled behavior and observed kinetic behavior demonstrates the importance of understanding ion structures, considering possible mechanisms, and the utility of MT in mechanistic studies. Given the agreement between experimental and computational work, we propose that structural information from either DFT calculations or experiment can be combined with our proposed rate law to predict the activity of the Ce3+/Ce4+ redox couple in other electrolytes. The use of MT coupled with a CE- or EC-type mechanism, which has been considered previously for other systems, and informed by detailed structural data could also be applied to understand other redox couples that have seemingly anomalous empirical kinetic parameters such as V4+/V5+.
4. Experimental and Computational Methods
4.1. Experimental Methods
4.1.1. Solution Preparation
The Ce3+ solution preparation methods and chemical sources are described in detail elsewhere.11 To prepare solutions of mixed oxidation state, that is, some Ce3+ and some Ce4+ present, or entirely Ce4+, cerium(III) carbonate hydrate (same source as used for Ce3+ solutions) was added to 2 M H2SO4 and stirred until all cerium had dissolved and a clear solution had formed. While it has been noted that cerium complexes with carbonate in solution,80 those studies were conducted in basic solutions, whereas our studies were conducted in a strongly acidic solution and with a step to remove carbonate before spectroscopic or kinetic studies. As discussed in our prior work,11 when using cerium(III) carbonate in an acid solution, the carbonate will react with the available protons to form CO2 which is vented out of the solution with sufficient N2 sparging. The redox potentials of cerium carbonate complexes range from 0.198 to 0.2595 V versus SHE,80 whereas the redox potentials we measured during kinetic measurements ranged between 1.39 and 1.49 V versus SHE, which is consistent with cerium complexation in H2SO4. We previously demonstrated that the Ce3+ UV–vis peaks did not change significantly whether Ce3+ were prepared from Ce2(CO3)3 or Ce(CF3SO3)3, suggesting that Ce3+ is predominantly coordinated by the same species in each of these, that is, water.11 Here, we also show that the EXAFS of a 0.05 M Ce3+ solution in 2 M TFSA does not change whether Ce2(CO3)3 or Ce(CF3SO3)3 is used to prepare the solution (Figure S27). Then, using a two-compartment glass electrochemical cell discussed in more detail elsewhere,11 Ce3+ ions were electrochemically oxidized to Ce4+ using a titanium-based anode from De Nora (coating type DN-240 or DN-300) as the working electrode, a graphite rod (Alfa Aesar, 99.9995% metals basis) as the counter electrode, and a double-junction Ag/AgCl electrode (saturated KCl, Pine Research) as the reference electrode until the desired ratio of Ce4+ to Ce3+ was achieved. The concentrations of Ce3+ and Ce4+ were measured using titration, as described in detail elsewhere.11
4.1.2. Electrochemistry Cell Setup
For room-temperature kinetic measurements on either the Pt or GC working electrodes, the same electrochemical cell was used that was used for solution preparation, with the same reference and counter electrodes. For activation barrier measurements, a jacketed two-compartment electrochemical cell (Adams & Chittenden Scientific Glass) was used. A refrigerated/heated bath circulator (Fisher Scientific) controlled the temperature of the water. The temperature of the solution was measured before kinetic measurements. A VSP potentiostat (Biologic Science Instruments USA) was used to supply voltage and measure kinetics. Before kinetic measurements, the working electrode compartment solution was sparged for at least 15 min with nitrogen (Metro Welding Supply Corp, pure compressed nitrogen) to minimize oxygen contamination, and the solution was continuously blanketed with nitrogen. A Modulated Speed Rotator (model AFMSRCE, Pine Research) was used to control the rotation rate of the RDEs, which were inserted into the E5TQ ChangeDisk Tip (Pine Research). We compared Ce3+/Ce4+ kinetic measurements in 2 M H2SO4 with 0.05 M total cerium concentration prepared from Ce2(CO3)3 and Ce(SO4)2 and found no significant difference in activity (see Figure S28), suggesting that Ce3+ and Ce4+ are not complexing with carbonate species in our measurements. To eliminate the effect of cerium crossover, no kinetic measurements were taken beyond 48 h from when the solution had been added to the cell (Figure S29).
4.1.3. Experimental XAFS Data Collection, Normalization, and Fitting
XAFS measurements consisting of both X-ray near-edge spectroscopy (XANES) and EXAFS were collected at the Advanced Photon Source at Argonne National Laboratory (L3-edge collected at 20 BM and K-edge collected at 20 ID-B,C). The data analyzed in this paper included EXAFS spectra of a CeO2 standard and 0.1 M Ce4+ in 2 M H2SO4 at the Ce L3-edge from our previous work11 (newly normalized) and additional EXAFS spectra of cerium species at the Ce L3- and K-edges. In the Supporting Information, the additionally collected EXAFS spectra at the Ce L3-edge of 0.1 M Ce4+ in 2 M H2SO4 are shown in Figures S8b,f and S9 and labeled “Ce4+ in varied [H2SO4].”
The Ce3+ and Ce4+ solutions used in the additional XAFS measurements were shipped to the beamline in either glass vials or capillary tubes. To ensure that the solutions of Ce4+ maintained their oxidation state, they were shipped in dry ice and stored in a freezer with temperatures less than 0 °C. The frozen solutions were thawed and syringed into solution holders immediately before EXAFS measurements began. The XANES of the Ce4+ solutions were compared to CeO2 XANES (Figure S30) to confirm 100% Ce4+ oxidation state. The CeCl3·7H2O and CeO2 standards were prepared by mixing CeCl3 (Strem Chemicals, Inc., 99.9% pure) and CeO2 (Alfa Aesar, 99.99%), respectively, with boron nitride (BN, Sigma Aldrich) in air, grinding using a mortar and pestle, and then forming a pellet using a pellet press with a pressure of 10,000 psi. The ratios of either CeCl3 or CeO2 to BN for each edge are reported in Table S11.
For the Ce L3-edge XAFS measurements, the same monochromator was used as previously described,11 as were the processes for harmonic contamination suppression and incident beam intensity measurement. For all Ce L3-edge XAFS spectra except the 0.05 M Ce4+/2 M H2SO4 solution XAFS spectra in Figure 2f, data collection was performed in the transmission mode. A chromium (Cr) foil was used as a reference to verify energy reproducibility because its K-edge energy (5989 eV) is close to the Ce L3-edge energy (5723 eV). The Ce L3-edge XAFS of the 0.05 M Ce4+/2 M H2SO4 solution in Figure 2f was collected in the fluorescence mode due to low transmission signal, using a 13-element germanium fluorescence detector. The Ce K-edge XAFS studies were carried out at 295 K. The incident beam was monochromatized using a pair of Si(311) crystals. Higher order harmonics were suppressed by detuning the monochromator to reduce the incident X-ray intensity by approximately 15%. Argon-filled ion chambers were used for the I0, It, and Iref detectors. All Ce K-edge XAFS spectra were collected in the transmission mode, and the XANES spectra of a CeO2 standard was used to confirm energy reproducibility several times throughout the data collection. At least two scans were collected for each sample. For the Pt L3-edge XAFS data discussed in the Supporting Information, the XAFS measurements were collected in a polyacrylate electrochemical cell designed for beamline measurements described in more detail elsewhere.81
The XAFS data were normalized using the software ATHENA,55 and all normalization parameters used are listed in Table S12. The repeating scans for each sample were merged after energy alignment and normalization. The Fourier transformed EXAFS data used an Rbkg parameter of 1.4 Å for all K-edge samples and 1.2 Å for all L3-edge samples. All plotted EXAFS data have unadjusted R space values. No attempt was made to correct for multi-electron excitation (MEE) effects in the L3-edge data based on our previous findings that correcting for MEE did not result in improved fitting results.11
The normalized and k2-weighted EXAFS spectra were analyzed using the software ARTEMIS,55 with R and k ranges specified in Table S13. FEFF9 was used to generate paths from the known structures of CeCl3·7H2O (sourced from the Cambridge Structural Database82,83) and CeO2 (source included in our previous work11) to fit the standards for Ce3+ and Ce4+. For the CeCl3·7H2O standard, Ce–O and Ce–Cl were used in the fit. The amplitude reduction factor (S02) was first fixed at a value of 1.0, while the value of shift in threshold energy (ΔE0) and path specific values (the shift in scattering distance (ΔR), the Debye–Waller factor (σ2), and the CN) were obtained by fitting. The CN were fixed to sum to 9, and these fitted results were then set as fixed parameters to obtain S02. Fits of the CeCl3·7H2O data for the K- and L3-edges are shown in Figures S1 and S2, respectively, and fitted parameter values are included in Table S2. For CeO2, two Ce–O shells (Ce–O1 and Ce–O2) and one Ce–Ce shell were included in the fit. The S02, ΔE0, and path-specific ΔR and σ2 were obtained by fitting, but the CN of Ce–O1 was set to 8, the CN of Ce–Ce was set to 12, and the CN of Ce–O2 was set to 24. Fits of the CeO2 data are shown in Figure S10, and the fitted parameter values are included in Table S5.
To fit the k2 weighted EXAFS data of cerium solutions, FEFF9 was used to generate paths with self-consistency in JFEFF from DFT-predicted cerium structures. The final fit of Ce3+ in H2SO4 was a Ce–O scattering shell co-fit to the Ce L3-edge EXAFS spectra of 0.1 M Ce3+/2 M H2SO4 and Ce K-edge EXAFS spectra of 0.05 M Ce3+/2 M H2SO4. A Ce–S scattering path was also considered in the Ce3+ fit in Figure S5. The values of S02 and ΔE0 were set as fixed global parameters and were obtained from the fits of the CeCl3·7H2O standard. The CN, ΔR, and σ2 were all obtained by co-fitting. Ce K-edge data of 0.05 M Ce3+ in 2 M MSA, 2 M TFSA, and 2 M H2SO4 were fit with a Ce–O scattering shell with the same R range and k range as that used for the K-edge data in the co-fit (Table S13). The final fit of Ce4+ in H2SO4 was a co-fit using the Ce L3-edge EXAFS spectra of 0.1 M Ce4+/2 M H2SO4 and the Ce K-edge EXAFS spectra of 0.05 M Ce4+/2 M H2SO4, with Ce–O and Ce–S shells. The co-fit with only a Ce–O scattering shell is shown in Figure S11. Four path-specific parameters (CN, ΔR, σ2, and the third cumulant, σ3) were obtained by co-fitting, and values for S02 and ΔE0, which were set as fixed global parameters, were obtained from the fit of the CeO2 standard. See Table S13 for R and k ranges.
4.1.4. Electrode Pretreatment
To prepare the RDEs for kinetic measurements, a polishing, sonication, and electrochemical cleaning procedure was followed for each electrode material. For GC, the RDE was polished for 3 min using a 0.3 μm alumina slurry (Allied High Tech Products, Inc., DeAgglomerated) and then sonicated (Fisher Scientific, 2.8 L Ultrasonic Bath) in water purified with the MilliporeSigma Synergy UltrapureWater Purification System (18.2 MΩ cm resistivity) for 45 min. EIS was used to measure the solution resistance, and then a series of cyclic voltammograms (CVs) were conducted in the range 0.36 V versus RHE to 1.16 V versus RHE, that is, the non-faradaic region, as a function of scan rate in 2 M H2SO4. If no impurities were detected from the CVs, the double-layer capacitance could be calculated and the GC was ready for kinetic measurements of the cerium redox couple. For Pt, which was more sensitive to oxidation and thus required a more rigorous cleaning procedure, the RDE was first polished for 3 min using a 0.3 μm alumina slurry and then sonicated in Millipore water for 45 min. Then, the RDE was dried and polished for 3 min using a 0.05 μm alumina slurry (Allied High Tech Products, Inc., DeAgglomerated) before being sonicated again in Millipore water for 45 min. The Pt RDE was subjected to 50 electrochemical cleaning cycles in 2 M H2SO4 (CV with a potential range of −0.35 V vs RHE to 1.56 V vs RHE and a scan rate of 100 mV/s) to remove any contaminants on the Pt surface. Following the cleaning cycles, the Pt RDE hydrogen underpotential deposition (HUPD) peaks were characterized, and the electrochemically active surface area (ECSA) was calculated by dividing the amount of charge associated with the desorption of a monolayer of adsorbed hydrogen on the Pt surface by the specific charge of Pt (210 μC cm–2). If the HUPD peaks demonstrated any oxygen contamination or contamination on the Pt surface, for example, extremely low or misshapen hydrogen desorption peaks, then the cleaning cycles were repeated with additional N2 sparging and blanketing at higher flow rates until HUPD peaks were stable. The Pt kinetic data was only used if the ECSA calculated from the HUPD peaks was greater than or equal to the geometric surface area of the Pt RDE (0.196 cm2) and had a corresponding roughness factor that was less than 2.5.
4.1.5. Kinetic Measurements
To measure the kinetic activity of the Pt and GC electrodes, the exchange current density of the reaction, i0, the Tafel slope, b, and the activation energy, Ea, were extracted. Two independent methods of obtaining the exchange current density were used: the Tafel method and the CT resistance method. In the Tafel method, a series of fixed potentials were applied to the working electrode, and the resulting steady-state currents were measured to achieve a polarization curve. The applied potentials were compensated for solution resistance using EIS measurements. The steady-state currents were then normalized by surface area to obtain steady-state current densities. For Pt measurements, the ECSA from HUPD measurements were used to normalize the currents, whereas the GC kinetic activity was normalized by its geometric surface area of 0.196 cm2. From the steady-state current densities, a Tafel plot was constructed from the Tafel equation (eq 4, where a is a constant, b is the Tafel slope, and η is the overpotential). The Tafel slope was extracted from the Tafel plot by fitting a linear trendline in the overpotential range of −0.250 to −0.118 V12 and extrapolating to η = 0 to obtain i0.
| 4 |
In the CT resistance method, the CT resistance, Rct, was extracted from a Nyquist plot using EIS. The solution resistance, Rs, and CT resistance, Rct, were found by fitting an electrical circuit, assumed here to be the Randles circuit, and finding the intercepts of the x-axis of the semicircle, which is the real portion of the impedance. Rs is the left-most x-intercept (i.e., high frequencies), and Rct is the x-intercept at the right-most side of the semicircle (i.e., low frequencies). Then, eq 5 was used to calculate i0, where R is the ideal gas constant, T is the temperature, A is the surface area (ECSA from HUPD for Pt, geometric for GC), and n refers to the number of electrons that are transferred during CT.
| 5 |
Obtaining similar exchange current density values from the Tafel method and the CT method lends confidence in the kinetic values reported, and so the exchange current densities were measured using both methods for all values reported in this study. All exchange current densities obtained from the CT resistance method for the Pt and GC electrodes can be found in Figures S13 and S18.
A competitive redox reaction that will occur at similar potentials as the Ce3+/Ce4+ electron transfer is the oxygen evolution reaction (OER).84 To avoid measuring the OER activity, only the reduction currents of Ce4+ to Ce3+, which occur at potentials at which OER is negligible, were used to determine i0 from the Tafel method. As noted, oxygen reduction contributions are mitigated by purging the electrolyte with nitrogen.
To ensure that the data reported herein were kinetically controlled, all activity measurements were collected using RDEs. The observed activity for the GC and Pt RDEs was no longer dependent on rotation rate at 2000 rpm (Figure S31), so all reported kinetic activity was collected at a rotation speed of 2000 rpm. Additionally, a Koutecký–Levich analysis was conducted for the Pt RDE (Figure S32) at a 0.02 M Ce4+ concentration (total Ce concentration of 0.05 M), and it was found that using the kinetically limited current from the Koutecký–Levich analysis resulted in an exchange current density that was less than 1% different from the exchange current density extracted from the Tafel method. Last, the kinetic activities for Pt were found to be independent of the electrochemical reactor design by confirming that the exchange current densities achieved for a Pt RDE were similar to those achieved for a Pt wire with rapid stirring (Figure S33).
Several precautions were taken to ensure that the kinetic data were accurate and reproducible and the concentrations of Ce3+ and Ce4+ were accurate. As mentioned, only electrode surfaces with no indication of impurities from the CV were used for analysis. To ensure that the kinetic measurements were reproducible, the reported i0 and Tafel slope values were determined from the average of three measurement runs at a specific experimental condition (either Ce4+ concentration or temperature), with uncertainty represented by the standard deviation away from the average. The accuracy of the concentration of Ce4+ relative to the total amount of cerium was determined from three methods for each data point: (1) titration, (2) using the open-circuit voltage (OCV) and obtaining concentrations from the Nernst equation, and (3) the UV–vis spectrum of the solution in the working electrode compartment of the electrochemical cell compared to other UV–vis spectra at similar Ce4+ concentrations. Only data points that had Ce4+ concentration results that were less than 10% different between titration and OCV, and with the UV–vis spectrum in qualitative agreement with the expected peak intensity from Ce4+, were used for analysis. The UV–vis spectra of Ce3+ and Ce4+ are discussed in more detail in our previous work.11
4.1.6. Kinetic Data Fitting
To fit the
kinetic rate laws to the experimentally collected kinetic data, the
NMSE was calculated for each data set (i0[Ce4+], i0[T], b[Ce4+], b[T]) using eq 6, where yobs,i is the
experimentally observed data point i, ymod,i is the modeled data point i,  , is the mean of the experimentally observed
data points,
, is the mean of the experimentally observed
data points,  is the mean of the modeled data points,
and N is the number of i data points.
is the mean of the modeled data points,
and N is the number of i data points.
| 6 |
The modeled data points were calculated using the rate laws discussed in the Supporting Information by using the Tafel method to extract exchange current densities and cathodic Tafel slopes from modeled kinetic currents as a function of overvoltage. The NMSE for each set of data was then weighted equally and summed together, and a solver function was used to minimize the total summed error by varying relevant fitting parameters. For the BV rate law, the fitting parameters were standard rate constant, k0, CT coefficient, α, and activation energy, Ea. For the two-step EC and CE mechanisms, the fitting parameters were the reorganization energy, a preexponential factor, and the equilibrium constant of the C step. The uncertainty in the fitted parameters was the standard error (eq 7) of the value, estimated through the jackknife method,85 in which one observed data point is removed and the fitted value (Tj) is determined for that subset j. The process is repeated for all M subsets, and the average of the fitted value for all subsets (Tj,avg) is used in eq 7 to calculate the standard error.
 |
7 |
4.2. Computational Methods
4.2.1. MD-EXAFS Spectra Calculations
The MD-EXAFS spectra of [CeIII(H2O)9]3+, [CeIV(H2O)9]4+, [CeIII(H2O)8SO4]+, and [CeIV(H2O)8SO4]2+ complexes were generated by averaging the EXAFS signals of geometry snapshots of the complex in solution over a molecular dynamics trajectory. Car–Parrinello molecular dynamics (CPMD) were performed in the NWChem software86 to generate structures of the complexes in solution (Figure S34), which were then used as inputs to the FEFF9 code87 to calculate EXAFS signals due to scattering paths. The CPMD simulations were performed in an 8 × 8 × 8 Å3 periodic box using the PBE functional in the canonical ensemble (Figure S35). Simulations of each cerium complex were run for 50 ps post-equilibration, and one snapshot was taken each ps to generate 50 geometry snapshots. The cerium complexes were explicitly solvated with 15 water molecules (to give a solution density of ≈1.0 g/cm3). All hydrogen atoms were given a fictitious mass of 2 amu to decrease the frequency of O–H bond vibrations, allowing a larger time step of 5.0 au to be used for computational tractability. The Nosé–Hoover thermostat88 was used to maintain the temperature of the system at 300 K throughout the simulation, and the periods of the ionic and electronic thermostats were set to 1200 a.u. All non-cerium atoms were treated with the Hamann pseudopotential,89 and the cerium ion was treated with the Troullier–Martins pseuodopotential.90
Each sampled geometry snapshot was fed into the FEFF9 code to calculate an EXAFS spectrum. Each spectrum was calculated using a cluster radius of 6 Å centered on the cerium ion. The 50 geometries were averaged to produce a final EXAFS spectrum of the complex in solution. To generate spectra without sulfate scattering pathways, those paths were omitted during FEFF9 runs.
4.2.2. Reorganization Energy and Anion Complexation Free Energy Calculations
Reorganization energies were calculated for the [CeIII(H2O)9]3+/[CeIV(H2O)9]4+ CT (Table S10). All calculations were performed in the NWChem software unless otherwise noted. DFT-optimized structures of the cerium ion and its first coordination shell (nine water molecules) were used at each step in the process. For all geometry optimizations and calculations, a mixed basis set was used with the Stuttgart RSC 1997 ECP basis set91 for the cerium ion and the 6-31+G* basis set92 for all non-cerium atoms. This basis set was used to maintain computational tractability and accuracy. The calculated reorganization energy was shown to converge with this basis set (see converged outer-sphere reorganization energies, Figure S36). Implicit solvation was included using conductor-like screening model (COSMO) with default parameters.93 The B3LYP functional with Grimme’s D3 dispersion correction94 was employed for all electron-transfer calculations.94−96
The reorganization energy λ includes the inner- (λi) and outer-sphere (λo) contributions (eq 8), which were calculated separately. λi was approximated by Nelsen’s four-point method (eq 9),97 in which single-point energy calculations of the oxidized and reduced species geometries (with COSMO) at both the oxidized and reduced charge states were used to estimate the energetics of inner-sphere reorganization.
| 8 |
| 9 |
where Rox and Rred are the optimized geometries of the oxidized and reduced species, respectively, and Eox and Ered are the energies of the oxidized and reduced states, respectively, evaluated at the given geometry. Energies of each species were evaluated at each state using the computational settings described above. See the Supporting Information for further discussion of reorganization energy calculations (Table S10).
The outer-sphere reorganization energy, λo, was obtained within the PCM framework98 in the GAMESS99 software. The PCM framework was employed to calculate solvation free energy at different polarization potentials (eq 10).
| 10 |
where Goxeq and Gox are the free energy of the oxidized geometry evaluated at the oxidized and reduced polarization potentials, respectively. Gredeq and Gred are the free energy of the reduced geometry evaluated at the reduced and oxidized polarization potentials, respectively.
In this framework, the electrode surface was modeled as a perfect conductor, and water was implicitly treated as the solvent, meaning that the dielectric constant assumed in the λo calculation was the dielectric constant of water. Cavity surfaces that contain the cerium complex were defined using the Gauss–Bonet tessellation procedure, and cavity sizes for each atom were generated using their van der Waal radius using the default GAMESS radii, except cerium, which was estimated as twice the covalent radius, 4.08 Å.100 The outer-sphere reorganization energies were calculated in the Born–Oppenheimer limit using inertial polarization;101 however, the self-consistent limit was shown to yield results less than 1 kJ/mol different for the systems studied. The solvated radius of the water molecules used to define the distance of the cavity from the electrode surface was obtained from the experiment102 to be 3.00 Å. Last, the anion complexation free energies for the [CeIV(H2O)6(SO4)3]2– and [CeIV(H2O)6(HSO4)3]+ species (Figure S12) were calculated in the same manner as our previous paper.11
Acknowledgments
We thank John Fulton for his help in interpreting the EXAFS spectra, Darren Driscoll for help with K-edge EXAFS sample preparations, and Harsh Agarwal, James Akinola, and Chengjun Sun for their assistance in collecting L3-edge EXAFS measurements. Anodes for solution preparation were provided from De Nora (DSA oxygen evolving anodes).
Supporting Information Available
The Supporting Information is available free of charge at https://pubs.acs.org/doi/10.1021/jacsau.2c00484.
Previous cerium kinetic literature, Ce3+ and Ce4+ EXAFS data, Ce4+ DFT predictions, Ce3+/Ce4+ kinetic data, rate law derivations, DFT-predicted reorganization energies, and experimental and computational procedures (PDF)
Author Present Address
∥ Oak Ridge National Laboratory, Electrification and Energy Infrastructures Division, 1 Bethel Valley Rd, Oak Ridge, TN, 37830, United States
Author Contributions
N.S. conceived the project. C.A.B. carried out all kinetic experimental measurements and characterization. M.B. suggested and performed the K-edge EXAFS measurements, and C.A.B. completed the data reduction and fitting with input from M.B. D.H. performed all the first-principles modeling calculations under the guidance of B.R.G. All authors were involved in the analysis and writing of the manuscript. CRediT: Cailin Anne Buchanan data curation, formal analysis, investigation, methodology, validation, visualization, writing-original draft; Dylan Herrera data curation, formal analysis, investigation, visualization, writing-review & editing; Mahalingam Balasubramanian data curation, methodology, writing-review & editing; Bryan R. Goldsmith funding acquisition, methodology, project administration, resources, software, supervision, validation, writing-review & editing; Nirala Singh conceptualization, funding acquisition, methodology, project administration, resources, supervision, validation, visualization, writing-review & editing.
This work was supported by University of Michigan (UofM) start-up funds of B.R.G. and N.S. This work was in part supported by the Dow Sustainability Fellows Program at the UofM. This research used resources of the National Energy Research Scientific Computing Center (NERSC), a U.S. Department of Energy Office of Science User Facility operated under contract no. DE-AC02-05CH11231. This work used the Extreme Science and Engineering Discovery Environment (XSEDE), which is supported by National Science Foundation grant number ACI-1548562. Sector 20 operations are supported by the US Department of Energy and the Canadian Light Source.
The authors declare no competing financial interest.
Supplementary Material
References
- Marcus R. A. Electron Transfer Reactions in Chemistry. Theory and Experiment. Rev. Mod. Phys. 1993, 65, 599–610. 10.1103/revmodphys.65.599. [DOI] [Google Scholar]
- Marcus R. A.; Sutin N. Electron Transfers in Chemistry and Biology. Biochim. Biophys. Acta 1985, 811, 265–322. 10.1016/0304-4173(85)90014-x. [DOI] [Google Scholar]
- Di Giacomo F. A Short Account of RRKM Theory of Unimolecular Reactions and of Marcus Theory of Electron Transfer in a Historical Perspective. J. Chem. Educ. 2015, 92, 476–481. 10.1021/ed5001312. [DOI] [Google Scholar]
- Osakai T.; Hotta H.. Electron Transfer at Liquid/Liquid Interfaces. In International Nanochemistry: Molecular Science and Engineering at Liquid–Liquid Interfaces; Watarai H., Teramae N., Sawada T., Eds.; Kluwer Academic/Plenum: New York, 2005; pp 171–188. [Google Scholar]
- Deisenhofer J.; Epp O.; Miki K.; Huber R.; Michel H. X-Ray Structure Analysis of a Membrane Protein Complex. J. Mol. Biol. 1984, 180, 385–398. 10.1016/s0022-2836(84)80011-x. [DOI] [PubMed] [Google Scholar]
- Deisenhofer B. J.; Michel H. The Photosynthetic Reaction Center from the Purple Bacterium. Angew. Chem., Int. Ed. 1989, 28, 829–847. 10.1002/anie.198908293. [DOI] [Google Scholar]
- Weaver M. J.; Anson F. C. Distinguishing between Inner- and Outer-Sphere Electrode Reactions. Reactivity Patterns for Some Chromium(III)-Chromium(II) Electron-Transfer Reactions at Mercury Electrodes. Inorg. Chem. 1976, 15, 1871–1881. 10.1021/ic50162a026. [DOI] [Google Scholar]
- Weaver M. J. Correlations between Electrochemical and Homogeneous Redox Reactivity. Quantitative Comparisons of Rate Constants and Activation Parameters for Some Inorganic Outer-Sphere Reactions. J. Phys. Chem. 1980, 84, 568–576. 10.1021/j100443a002. [DOI] [Google Scholar]
- Bard A. Inner-Sphere Heterogeneous Electrode Reactions. Electrocatalysis and Photocatalysis: The Challenge. J. Am. Chem. Soc. 2010, 132, 7559–7567. 10.1021/ja101578m. [DOI] [PubMed] [Google Scholar]
- Marcus R. A. On the Theory of Electron-Transfer Reactions. VI. Unified Treatment for Homogeneous and Electrode Reactions. J. Chem. Phys. 1965, 43, 679–701. 10.1063/1.1696792. [DOI] [Google Scholar]
- Buchanan C. A.; Ko E.; Cira S.; Balasubramanian M.; Goldsmith B. R.; Singh N. Structures and Free Energies of Cerium Ions in Acidic Electrolytes. Inorg. Chem. 2020, 59, 12552–12563. 10.1021/acs.inorgchem.0c01645. [DOI] [PubMed] [Google Scholar]
- Bard A. J.; Faulkner L. R.. Electrochemical Methods: Fundamentals and Applications, 2nd ed.; John Wiley & Sons, Inc., 2001. [Google Scholar]
- Heinritz A.; Binninger T.; Patru A.; Schmidt T. J. Asymmetric Butler–Volmer Kinetics of the Electrochemical Ce(III)/Ce(IV) Redox Couple on Polycrystalline Au Electrodes in Sulfuric Acid and the Dissociation Field Effect. ACS Catal. 2021, 11, 8140–8154. 10.1021/acscatal.0c04587. [DOI] [Google Scholar]
- Bishop E.; Cofré P. Anodic Generation of Cerium(IV). Charge-Transfer Kinetic Parameters and Confitional Potentials at Platinum, Gold and Glassy Carbon. Analyst 1981, 106, 316–322. 10.1039/an9810600316. [DOI] [Google Scholar]
- Kiekens P.; Steen L.; Donche H.; Temmerman E. Kinetics of Ce(IV) Reduction at Gold, Carbon and Iridium Electrodes. Electrochim. Acta 1981, 26, 841–845. 10.1016/0013-4686(81)85043-8. [DOI] [Google Scholar]
- Randle H.; Kuhn T. Kinetics and Mechanism of the Cerium(IV)/Cerium(III) Redox Reaction on a Platinum Electrode. J. Chem. Soc., Faraday Trans. 1983, 79, 1741–1756. 10.1039/f19837901741. [DOI] [Google Scholar]
- Liu Y.; Xia X.; Liu H. Studies on Cerium (Ce4+/Ce3+)-Vanadium (V2+/V3+) Redox Flow Cell- Cyclic Voltammogram Response of Ce4+/Ce3+redox Couple in H2SO4 Solution. J. Power Sources 2004, 130, 299–305. 10.1016/j.jpowsour.2003.12.017. [DOI] [Google Scholar]
- Galus Z.; Adams R. N. The Investigation of the Kinetics of Moderately Rapid Electrode Reactions Using Rotating Disk Electrodes. J. Phys. Chem. 1963, 67, 866–871. 10.1021/j100798a036. [DOI] [Google Scholar]
- Greef R.; Aulich H. The Kinetics of the Cerous-Ceric Redox Reaction at a Platinum Electrode. J. Electroanal. Chem. Interfacial Electrochem. 1968, 18, 295–307. 10.1016/S0022-0728(68)80260-8. [DOI] [Google Scholar]
- Kuhn T.; Randle H. Effect of Oxide Thickness on the Rates of Some Redox Reactions on a Platinum Electrode. J. Chem. Soc., Faraday Trans. 1985, 81, 403–419. 10.1039/f19858100403. [DOI] [Google Scholar]
- Furman N. H. Applications of Ceric Sulfate in Volumetric Analysis. I. The Preparation and Stability of Solutions of Ceric Sulfate (Containing Free Sulfuric Acid). II. Potentiometric Study of the Reactions between Ceric and Ferrous or Oxalate Ion. Application to the St. J. Am. Chem. Soc. 1928, 50, 755–764. 10.1021/ja01390a019. [DOI] [Google Scholar]
- Smith G. F.; Getz C. A. Cerate Oxidimetry. Ind. Eng. Chem. Res. 1938, 10, 191–195. 10.1021/ac50120a006. [DOI] [Google Scholar]
- Arenas L. F.; Ponce de León C.; Walsh F. C. Electrochemical Redox Processes Involving Soluble Cerium Species. Electrochim. Acta 2016, 205, 226–247. 10.1016/j.electacta.2016.04.062. [DOI] [Google Scholar]
- Binnemans K. Chapter 229 Applications of tetravalent cerium compounds. Handb. Phys. Chem. Rare Earths 2006, 36, 281–392. 10.1016/S0168-1273(06)36003-5. [DOI] [Google Scholar]
- Kreh R. P.; Spotnitz R. M.; Lundquist J. T. Mediated Electrochemical Synthesis of Aromatic Aldehydes, Ketones, and Quinones Using Ceric Methanesulfonate. J. Org. Chem. 1989, 54, 1526–1531. 10.1021/jo00268a010. [DOI] [Google Scholar]
- Devadoss V.; Basha C.; Jayaraman K. Indirect Electrochemical Oxidation of P-Methoxy-Toluene to p-Methoxy-Benzaldehyde Using Ceric Methanesulphonate: A Scale-up Study. Ind. Eng. Chem. Res. 2008, 47, 4607–4616. 10.1021/ie071427i. [DOI] [Google Scholar]
- Weber A. Z.; Mench M. M.; Meyers J. P.; Ross P. N.; Gostick J. T.; Liu Q. Redox Flow Batteries: A Review. J. Appl. Electrochem. 2011, 41, 1137–1164. 10.1007/s10800-011-0348-2. [DOI] [Google Scholar]
- Xie Z.; Liu Q.; Chang Z.; Zhang X. The Developments and Challenges of Cerium Half-Cell in Zinc-Cerium Redox Flow Battery for Energy Storage. Electrochim. Acta 2013, 90, 695–704. 10.1016/j.electacta.2012.12.066. [DOI] [Google Scholar]
- Roznyatovskaya N.; Noack J.; Pinkwart K.; Tübke J. Aspects of Electron Transfer Processes in Vanadium Redox-Flow Batteries. Curr. Opin. Electrochem. 2020, 19, 42–48. 10.1016/j.coelec.2019.10.003. [DOI] [Google Scholar]
- Gattrell M.; Park J.; MacDougall B.; Apte J.; McCarthy S.; Wu C. W. Study of the Mechanism of the Vanadium 4+/5+ Redox Reaction in Acidic Solutions. J. Electrochem. Soc. 2004, 151, A123–A130. 10.1149/1.1630594. [DOI] [Google Scholar]
- Solera J. A.; García J.; Proietti M. G. Multielectron Excitations at the L Edges in Rare-Earth Ionic Aqueous Solutions. Phys. Rev. B: Condens. Matter Mater. Phys. 1995, 51, 2678–2686. 10.1103/PhysRevB.51.2678. [DOI] [PubMed] [Google Scholar]
- Allen P. G.; Bucher J. J.; Shuh D. K.; Edelstein N. M.; Craig I. Coordination Chemistry of Trivalent Lanthanide and Actinide Ions in Dilute and Concentrated Chloride Solutions. Inorg. Chem. 2000, 39, 595–601. 10.1021/ic9905953. [DOI] [PubMed] [Google Scholar]
- Persson I.; D’Angelo P.; De Panfilis S.; Sandström M.; Eriksson L. Hydration of Lanthanoid(III) Ions in Aqueous Solution and Crystalline Hydrates Studied by EXAFS Spectroscopy and Crystallography: The Myth of the “Gadolinium Break. Chem.—Eur. J. 2008, 14, 3056–3066. 10.1002/chem.200701281. [DOI] [PubMed] [Google Scholar]
- Urbanski T. S.; Fornari P.; Abbruzzese C. The Extraction of Cerium(III) and Lanthanum(III) from Chloride Solutions with LIX 54. Hydrometallurgy 1996, 40, 169–179. 10.1016/0304-386X(94)00082-E. [DOI] [Google Scholar]
- Wang Z.; Chu T.; Chai Z.; Wang D. A Density Functional Theory Study of the Competitive Complexation of Pyridine against H2O and Cl- to Cm3+ and Ce4+. Radiochim. Acta 2014, 102, 101–109. 10.1515/ract-2014-2114. [DOI] [Google Scholar]
- Hardwick T. J.; Robertson E. Association of Ceric Ions with Sulphate (A Spectral Study). Can. J. Chem. 1951, 29, 828–837. 10.1139/v51-095. [DOI] [Google Scholar]
- Moore R. L.; Anderson R. C. Spectrophotometric Studies on Cerium (IV) Sulfate Complex Ions. J. Am. Chem. Soc. 1945, 67, 167–171. 10.1021/ja01218a005. [DOI] [Google Scholar]
- Larsen R. D.; Brown G. H. The Structure of Ammonium Hexanitratocerate(IV) in Solution. J. Phys. Chem. 1964, 68, 3060–3062. 10.1021/j100792a502. [DOI] [Google Scholar]
- Antonio M. R.; Ellis R. J.; Estes S. L.; Bera M. K. Structural Insights into the Multinuclear Speciation of Tetravalent Cerium in the Tri-n-Butyl Phosphate-n-Dodecane Solvent Extraction System. Phys. Chem. Chem. Phys. 2017, 19, 21304–21316. 10.1039/c7cp03350h. [DOI] [PubMed] [Google Scholar]
- Demars T. J.; Bera M. K.; Seifert S.; Antonio M. R.; Ellis R. J. Revisiting the Solution Structure of Ceric Ammonium Nitrate. Angew. Chem., Int. Ed. 2015, 54, 7534–7538. 10.1002/anie.201502336. [DOI] [PubMed] [Google Scholar]
- Jones E. G.; Soper F. G. The Nature of the Ceric Sulphates. J. Chem. Soc. 1935, 802–805. 10.1039/jr9350000802. [DOI] [Google Scholar]
- Rafiee M.; Nematollahi D.; Salehzadeh H. CEC Mechanism in Electrochemical Oxidation of Nitrocatechol-Boric Acid Complexes. Electrochim. Acta 2011, 56, 9946–9952. 10.1016/j.electacta.2011.08.083. [DOI] [Google Scholar]
- Testa A. C.; Reinmuth W. H. Stepwise Reactions in Chronopotentiometry. Anal. Chem. 1961, 33, 1320–1324. 10.1021/ac60178a010. [DOI] [Google Scholar]
- Mironov V. E. Outer-Sphere Complexes of Tervalent Cobalt. Russ. Chem. Rev. 1970, 39, 319. 10.1070/rc1970v039n04abeh001972. [DOI] [Google Scholar]
- Molina A.; López-Tenés M.; Laborda E. Unified Theoretical Treatment of the Eirrev, CE, EC and CEC Mechanisms under Voltammetric Conditions. Electrochem. Commun. 2018, 92, 48–55. 10.1016/j.elecom.2018.03.011. [DOI] [Google Scholar]
- Costentin C.; Savéant J. M. Homogeneous Molecular Catalysis of Electrochemical Reactions: Catalyst Benchmarking and Optimization Strategies. J. Am. Chem. Soc. 2017, 139, 8245–8250. 10.1021/jacs.7b02879. [DOI] [PubMed] [Google Scholar]
- Nicholson R. S.; Shain I. Theory of Stationary Electrode Polarography: Single Scan and Cyclic Methods Applied to Reversible, Irreversible, and Kinetic Systems. Anal. Chem. 1964, 36, 706–723. 10.1021/ac60210a007. [DOI] [Google Scholar]
- Amatore C.; Savéant J. M. Mechanism Analysis of Electrochemical Reactions Involving Homogeneous Chemical Steps: The Electrodimerization of 4-Methoxybiphenyl. J. Electroanal. Chem. 1983, 144, 59–67. 10.1016/s0022-0728(83)80143-0. [DOI] [Google Scholar]
- Vassiliev S. Y.; Sentyurin V. V.; Levin E. E.; Nikitina V. A. Diagnostics of Lithium-Ion Intercalation Rate-Determining Step: Distinguishing between Slow Desolvation and Slow Charge Transfer. Electrochim. Acta 2019, 302, 316–326. 10.1016/j.electacta.2019.02.043. [DOI] [Google Scholar]
- Nikitina V. A.; Vassiliev S. Y.; Stevenson K. J. Metal-Ion Coupled Electron Transfer Kinetics in Intercalation-Based Transition Metal Oxides. Adv. Energy Mater. 2020, 10, 1903933. 10.1002/aenm.201903933. [DOI] [Google Scholar]
- Amatore C.; Lexa D.; Savéant J. M. ECE Reaction Pathways in the Electrochemical Reduction of Dicyanocobalamin: Kinetics of Ligand Substitution in Vitamin B12r Cyanocob(II)Alamin. J. Electroanal. Chem. 1980, 111, 81–89. 10.1016/s0022-0728(80)80077-5. [DOI] [Google Scholar]
- Schlesener C. J.; Amatore C.; Kochi J. K. Kinetics and Mechanism of Aromatic Oxidative Substitutions via Electron Transfer. Application of Marcus Theory to Organic Processes in the Endergonic Region. J. Am. Chem. Soc. 1984, 106, 3567–3577. 10.1021/ja00324a027. [DOI] [Google Scholar]
- Yepes D.; Seidel R.; Winter B.; Blumberger J.; Jaque P. Photoemission Spectra and Density Functional Theory Calculations of 3d Transition Metal-Aqua Complexes (Ti-Cu) in Aqueous Solution. J. Phys. Chem. B 2014, 118, 6850–6863. 10.1021/jp5012389. [DOI] [PubMed] [Google Scholar]
- Fukuzumi S.; Ohkubo K.; Morimoto Y. Mechanisms of Metal Ion-Coupled Electron Transfer. Phys. Chem. Chem. Phys. 2012, 14, 8472–8484. 10.1039/c2cp40459a. [DOI] [PubMed] [Google Scholar]
- Ravel B.; Newville M. ATHENA; ARTEMIS, HEPHAESTUS Data Analysis for X-Ray Absorption Spectroscopy Using IFEFFIT. J. Synchrotron Radiat. 2005, 12, 537–541. 10.1107/s0909049505012719. [DOI] [PubMed] [Google Scholar]
- Shannon R. D. Revised effective ionic radii and systematic studies of interatomic distances in halides and chalcogenides. Acta Crystallogr., Sect. A: Cryst. Phys., Diffr., Theor. Gen. Crystallogr. 1976, 32, 751–767. 10.1107/s0567739476001551. [DOI] [Google Scholar]
- Lower S.Acid Strength and the Acid Dissociation Constant (Ka). General Chemistry A Molecular Approach, 2022.
- Baes C. F. J.; Mesmer R. E.. Yttrium, Lanthanides, Actinium. The Hydrolysis of Cations; Krieger Publishing Company: Malabar, Florida, 1986; pp 138–146. [Google Scholar]
- Ikeda-Ohno A.; Tsushima S.; Hennig C.; Yaita T.; Bernhard G. Dinuclear Complexes of Tetravalent Cerium in an Aqueous Perchloric Acid Solution. Dalton Trans. 2012, 41, 7190–7192. 10.1039/c2dt12406h. [DOI] [PubMed] [Google Scholar]
- Fronaeus S.; Ostman C. O. The Mechanism of the Exchange Reaction between Cerium(III) and Cerium(IV) at Platinum Surfaces. Acta Chem. Scand. 1956, 10, 769–778. 10.3891/acta.chem.scand.10-0769. [DOI] [Google Scholar]
- Hardwick T. J.; Robertson E. Ionic Species in Ceric Perchlorate Solutions. Can. J. Chem. 1951, 29, 818–827. 10.1139/v51-094. [DOI] [Google Scholar]
- Heidt L. J.; Smith M. E. Quantum Yields of the Photochemical Reduction of Ceric Ions by Water and Evidence for the Dimerization of Ceric Ions. J. Am. Chem. Soc. 1948, 70, 2476–2481. 10.1021/ja01187a050. [DOI] [Google Scholar]
- Agarwal H.; Florian J.; Goldsmith B. R.; Singh N. V2+/V3+ Redox Kinetics on Glassy Carbon in Acidic Electrolytes for Vanadium Redox Flow Batteries. ACS Energy Lett. 2019, 4, 2368–2377. 10.1021/acsenergylett.9b01423. [DOI] [Google Scholar]
- Nikiforidis G.; Berlouis L.; Hall D.; Hodgson D. A Study of Different Carbon Composite Materials for the Negative Half-Cell Reaction of the Zinc Cerium Hybrid Redox Flow Cell. Electrochim. Acta 2013, 113, 412–423. 10.1016/j.electacta.2013.09.061. [DOI] [Google Scholar]
- Zhaohua L.; You-qun C.; Chun-an M. A Comparative Study of Ce3+/Ce4+ Redox Couple on Pt Electrode in Sulfuric Acid and Methanesulfonic Acid. J. Electrochem. 2013, 19, 141–145. [Google Scholar]
- Tanimoto S.; Ichimura A. Discrimination of Inner- and Outer-Sphere Electrode Reactions by Cyclic Voltammetry Experiments. J. Chem. Educ. 2013, 90, 778–781. 10.1021/ed200604m. [DOI] [Google Scholar]
- Daum P. H.; Enke C. G. Electrochemical Kinetics of the Ferri—Ferrocyanide Couple on Platinum. Anal. Chem. 1969, 41, 653–656. 10.1021/ac60273a007. [DOI] [Google Scholar]
- Chen P.; McCreery R. L. Control of Electron Transfer Kinetics at Glassy Carbon Electrodes by Specific Surface Modification. Anal. Chem. 1996, 68, 3958–3965. 10.1021/ac960492r. [DOI] [Google Scholar]
- Frumkin A. Hydrogen Overvoltage and the Structure of the Double Layer. Z. Phys. Chem. 1933, 164A, 121–133. 10.1515/zpch-1933-16411. [DOI] [Google Scholar]
- Kant R.; Kaur J.; Mishra G. K. Theory for Influence of the Metal Electrolyte Interface on Heterogeneous Electron Transfer Rate Constant: Fractional Electron Transferred Transition State Approach. J. Phys. Chem. C 2020, 124, 2273–2288. 10.1021/acs.jpcc.9b09461. [DOI] [Google Scholar]
- Galizzioli D.; Trasatti S. Work Function, Electronegativity, and Electrochemical Behavior of Metals. IV. Simple Electron Exchange Reactions. Fe2+/Fe3+ Redox Couple. J. Electroanal. Chem. Interfacial Electrochem. 1973, 44, 367–388. 10.1016/s0022-0728(73)80469-3. [DOI] [Google Scholar]
- Barr S. W.; Guyer K. L.; Weaver M. J. The Dependence of the Kinetics of Some Simple Outer-Sphere Electrode Reactions on the Nature of the Electrode Material. J. Electroanal. Chem. 1980, 111, 41–59. 10.1016/s0022-0728(80)80074-x. [DOI] [Google Scholar]
- Liu H. Y.; Hupp J. T.; Weaver M. J. Surface Environmental Effects in Electrochemical Kinetics: Outer-Sphere Chromium(III) Reductions at Mercury, Gallium, Lead, and Thallium Surfaces. J. Electroanal. Chem. 1984, 179, 219–238. 10.1016/s0022-0728(84)80290-9. [DOI] [Google Scholar]
- Scott S. L. The Burden ofDisproof. ACS Catal. 2019, 9, 4706–4708. 10.1021/acscatal.9b01623. [DOI] [Google Scholar]
- Hupp J. T.; Weaver M. J. The Frequency Factor for Outer-Sphere Electrochemical Reactions. J. Electroanal. Chem. 1983, 152, 1–14. 10.1016/s0022-0728(83)80028-x. [DOI] [Google Scholar]
- Hoffman R.; Minkin V. I.; Carpenter B. K. Ockham’s Razor and Chemistry. HYLE- An Int. J. Philos. Chem. 1997, 3, 3–28. [Google Scholar]
- Blumer A.; Ehrenfeucht D.; Haussler M. K.; Warmuth M. K. Occam’s Razor. Inf. Process. Lett. 1987, 24, 377–380. 10.1016/0020-0190(87)90114-1. [DOI] [Google Scholar]
- Chattopadhyay S.; Mukherjee M.; Kandemir B.; Bowman S. E. J.; Bren K. L.; Dey A. Contributions to Cytochrome c Inner- and Outer-Sphere Reorganization Energy. Chem. Sci. 2021, 12, 11894–11913. 10.1039/d1sc02865k. [DOI] [PMC free article] [PubMed] [Google Scholar]
- Clegg A. D.; Rees N. V.; Klymenko O. V.; Coles B. A.; Compton R. G. Marcus Theory of Outer-Sphere Heterogeneous Electron Transfer Reactions: High Precision Steady-State Measurements of the Standard Electrochemical Rate Constant for Ferrocene Derivatives in Alkyl Cyanide Solvents. J. Electroanal. Chem. 2005, 580, 78–86. 10.1016/j.jelechem.2005.03.013. [DOI] [Google Scholar]
- Larabi-Gruet N.; Chaussé A.; Legrand L.; Vitorge P. Relative Stabilities of Ce(IV) and Ce(III) Limiting Carbonate Complexes at 5-50 °C in Na+ Aqueous Solutions, an Electrochemical Study. Electrochim. Acta 2007, 52, 2401–2410. 10.1016/j.electacta.2006.08.046. [DOI] [Google Scholar]
- Singh N.; Nguyen M. T.; Cantu D. C.; Mehdi B. L.; Browning N. D.; Fulton J. L.; Zheng J.; Balasubramanian M.; Gutiérrez O. Y.; Glezakou V. A.; Rousseau R.; Govind N.; Camaioni D. M.; Campbell C. T.; Lercher J. A. Carbon-Supported Pt during Aqueous Phenol Hydrogenation with and without Applied Electrical Potential: X-Ray Absorption and Theoretical Studies of Structure and Adsorbates. J. Catal. 2018, 368, 8–19. 10.1016/j.jcat.2018.09.021. [DOI] [Google Scholar]
- Groom C. R.; Bruno I. J.; Lightfoot M. P.; Ward S. C. The Cambridge Structural Database. Acta Crystallogr. 2016, 72, 171–179. 10.1107/s2052520616003954. [DOI] [PMC free article] [PubMed] [Google Scholar]
- Zachariasen W. H. Crystal Chemical Studies of the 5f-Series of Elements. I . New Structure Types. Acta Crystallogr. 1948, 1, 265–268. 10.1107/S0365110X48000703. [DOI] [Google Scholar]
- Vanýsek P.Electrochemical Series; CRC Handbook of Chemistry and Physics, 2000; pp 1–10. [Google Scholar]
- Efron B. Nonparametric Estimates of Standard Error: The Jackknife , the Bootstrap and Other Methods. Biometrika 1981, 68, 589–599. 10.1093/biomet/68.3.589. [DOI] [Google Scholar]
- Aprà E.; Bylaska E. J.; De Jong W. A.; Govind N.; Kowalski K.; Straatsma T. P.; Valiev M.; Van Dam H. J. J.; Alexeev Y.; Anchell J.; Anisimov V.; Aquino F. W.; Atta-Fynn R.; Autschbach J.; Bauman N. P.; Becca J. C.; Bernholdt D. E.; Bhaskaran-Nair K.; Bogatko S.; Borowski P.; Boschen J.; Brabec J.; Bruner A.; Cauët E.; Chen Y.; Chuev G. N.; Cramer C. J.; Daily J.; Deegan M. J. O.; Dunning T. H.; Dupuis M.; Dyall K. G.; Fann G. I.; Fischer S. A.; Fonari A.; Früchtl H.; Gagliardi L.; Garza J.; Gawande N.; Ghosh S.; Glaesemann K.; Götz A. W.; Hammond J.; Helms V.; Hermes E. D.; Hirao K.; Hirata S.; Jacquelin M.; Jensen L.; Johnson B. G.; Jónsson H.; Kendall R. A.; Klemm M.; Kobayashi R.; Konkov V.; Krishnamoorthy S.; Krishnan M.; Lin Z.; Lins R. D.; Littlefield R. J.; Logsdail A. J.; Lopata K.; Ma W.; Marenich A. V.; Martin del Campo J.; Mejia-Rodriguez D.; Moore J. E.; Mullin J. M.; Nakajima T.; Nascimento D. R.; Nichols J. A.; Nichols P. J.; Nieplocha J.; Otero-de-la-Roza A.; Palmer B.; Panyala A.; Pirojsirikul T.; Peng B.; Peverati R.; Pittner J.; Pollack L.; Richard R. M.; Sadayappan P.; Schatz G. C.; Shelton W. A.; Silverstein D. W.; Smith D. M. A.; Soares T. A.; Song D.; Swart M.; Taylor H. L.; Thomas G. S.; Tipparaju V.; Truhlar D. G.; Tsemekhman K.; Van Voorhis T.; Vázquez-Mayagoitia Á.; Verma P.; Villa O.; Vishnu A.; Vogiatzis K. D.; Wang D.; Weare J. H.; Williamson M. J.; Windus T. L.; Woliński K.; Wong A. T.; Wu Q.; Yang C.; Yu Q.; Zacharias M.; Zhang Z.; Zhao Y.; Harrison R. J. NWChem: Past, Present, and Future. J. Chem. Phys. 2020, 152, 184102. 10.1063/5.0004997. [DOI] [PubMed] [Google Scholar]
- Rehr J. J.; Kas J. J.; Vila F. D.; Prange M. P.; Jorissen K. Parameter-Free Calculations of X-Ray Spectra with FEFF9. Phys. Chem. Chem. Phys. 2010, 12, 5503–5513. 10.1039/b926434e. [DOI] [PubMed] [Google Scholar]
- Nosé S. A Unified Formulation of the Constant Temperature Molecular Dynamics Methods. J. Chem. Phys. 1984, 81, 511–519. 10.1063/1.447334. [DOI] [Google Scholar]
- Hamann D. R. Optimized Norm-Conserving Vanderbilt Pseudopotentials. Phys. Rev. B: Condens. Matter Mater. Phys. 2013, 88, 085117. 10.1103/PhysRevB.88.085117. [DOI] [Google Scholar]
- Troullier N.; Martins J. L. Efficient Pseudopotentials for Plane-Wave Calculations. Phys. Rev. B: Condens. Matter Mater. Phys. 1991, 43, 1993–2006. 10.1103/physrevb.43.1993. [DOI] [PubMed] [Google Scholar]
- Dolg M.; Stoll H.; Preuss H. Energy-Adjusted Ab Initio Pseudopotentials for the Rare Earth Elements. J. Chem. Phys. 1989, 90, 1730–1734. 10.1063/1.456066. [DOI] [Google Scholar]
- Ditchfield R.; Hehre W. J.; Pople J. A. Self-Consistent Molecular-Orbital Methods. IX. An Extended Gaussian-Type Basis for Molecular-Orbital Studies of Organic Molecules. J. Chem. Phys. 1971, 54, 724–728. 10.1063/1.1674902. [DOI] [Google Scholar]
- Klamt A. Conductor-like Screening Model for Real Solvents: A New Approach to the Quantitative Calculation of Solvation Phenomena. J. Phys. Chem. 1995, 99, 2224–2235. 10.1021/j100007a062. [DOI] [Google Scholar]
- Grimme S.; Antony J.; Ehrlich S.; Krieg H. A Consistent and Accurate Ab Initio Parametrization of Density Functional Dispersion Correction (DFT-D) for the 94 Elements H-Pu. J. Chem. Phys. 2010, 132, 154104. 10.1063/1.3382344. [DOI] [PubMed] [Google Scholar]
- Becke A. D. Density-Functional Exchange-Energy Approximation with Correct Asymptotic Behavior. Phys. Rev. A 1988, 38, 3098–3100. 10.1103/physreva.38.3098. [DOI] [PubMed] [Google Scholar]
- Lee C.; Yang W.; Parr R. G. Development of the Colle-Salvetti Correlation-Energy Formula into a Functional of the Electron Density. Phys. Rev. B: Condens. Matter Mater. Phys. 1988, 37, 785–789. 10.1103/physrevb.37.785. [DOI] [PubMed] [Google Scholar]
- Nelsen S. F.; Blackstock S. C.; Kim Y. Estimation of Inner Shell Marcus Terms for Amino Nitrogen Compounds by Molecular Orbital Calculations. J. Am. Chem. Soc. 1987, 109, 677–682. 10.1021/ja00237a007. [DOI] [Google Scholar]
- Ghosh S.; Horvath S.; Soudackov A. V.; Hammes-Schiffer S. Electrochemical Solvent Reorganization Energies in the Framework of the Polarizable Continuum Model. J. Chem. Theory Comput. 2014, 10, 2091–2102. 10.1021/ct500051e. [DOI] [PubMed] [Google Scholar]
- Barca G. M. J.; Bertoni C.; Carrington L.; Datta D.; De Silva N.; Deustua J. E.; Fedorov D. G.; Gour J. R.; Gunina A. O.; Guidez E.; Harville T.; Irle S.; Ivanic J.; Kowalski K.; Leang S. S.; Li H.; Li W.; Lutz J. J.; Magoulas I.; Mato J.; Mironov V.; Nakata H.; Pham B. Q.; Piecuch P.; Poole D.; Pruitt S. R.; Rendell A. P.; Roskop L. B.; Ruedenberg K.; Sattasathuchana T.; Schmidt M. W.; Shen J.; Slipchenko L.; Sosonkina M.; Sundriyal V.; Tiwari A.; Vallejo J. L. G.; Westheimer B.; Włoch M.; Xu P.; Zahariev F.; Gordon M. S. Recent Developments in the General Atomic and Molecular Electronic Structure System. J. Chem. Phys. 2020, 152, 154102. 10.1063/5.0005188. [DOI] [PubMed] [Google Scholar]
- Emsley J.The Elements, 3rd ed.; Clarendon Press, 1988. [Google Scholar]
- Born M. Volumen und Hydratationswärme der Ionen. Z. Phys. 1920, 1, 45–48. 10.1007/bf01881023. [DOI] [Google Scholar]
- Nightingale E. R. Jr. Phenomenological Theory of Ion Solvation. Effective Radii of Hydrated Ions. J. Phys. Chem. 1959, 63, 1381–1387. 10.1021/j150579a011. [DOI] [Google Scholar]
Associated Data
This section collects any data citations, data availability statements, or supplementary materials included in this article.