

Abstract
Objective
To compare retinal function assessed by full‐field electroretinography (ffERG) and multifocal electroretinography (mfERG) in diabetes without retinopathy, diabetes with moderate non‐proliferative diabetic retinopathy (NPDR) and in the absence of diabetes.
Methods
Scotopic and photopic ffERG and mfERG was made in non‐fasting volunteers, including 26 diabetic participants without retinopathy, 22 diabetic participants with moderate NPDR and 22 participants without diabetes using full International Society for Clinical Electrophysiology of Vision protocols.
Results
Of the ffERG responses, significant deviation (p ≤ 0.05, corrected for multiple sampling and other relevant confounders) from the non‐diabetic participants was seen in the diabetic participants only for the OP1‐OP3 oscillatory amplitudes and the OP2 implicit time. This finding was independent of whether retinopathy was present or not. For the mfERG, minor amplitude or implicit time deviations were found for a small number of rings (R2, R4 and R5). Receiver of operating characteristic analysis showed that the single most prominent abnormality of the ffERG in diabetes, regardless of whether retinopathy was present or not, was the OP2 implicit time (area under the curve ≥ 0.80).
Conclusion
This bi‐modal study of electroretinographic characteristics found that the most prominent anomaly associated with diabetes was a prolongation of the implicit time of the OP2 of the scotopic ffERG, while the most prominent added effect of non‐proliferative diabetic retinopathy was a further prolongation of the OP2 implicit time. Although the variation in ERG characteristics is far too large for diagnostic purposes, the close association of the oscillatory potentials with the amacrine cells of the retina indicate that their function is particularly sensitive to diabetes.
Keywords: cones, diabetic retinopathy, ERG, full‐field ERG, multifocal ERG, rods
Background
Diabetic retinopathy (DR) is estimated to develop in 56% of patients with type 1 diabetes mellitus (T1DM) and 30% of patients suffering from type 2 diabetes mellitus (T2DM) (Thomas et al. 2015). With an expected global increase in the prevalence of diabetes from 415 million in 2015 to 642 million by 2035, DR continues to be a major economic and healthcare challenge in the upcoming decades (International‐Diabetes‐Federation 2015).
Diabetic retinopathy is the leading cause of visual impairment among individuals at the working age, and early detection of DR is important to avoid blindness (Yau et al. 2012). There is emerging evidence that DR can usually be detected even before it is visible on ophthalmoscopy and fundus photographic imaging (Coupland 1987; Park et al. 2003; Villarroel et al. 2010). Moreover, early signs of retinopathy, that is microaneurysms and haemorrhages can disappear spontaneously and thus are unreliable clinical outcomes in the studies, where progression and regression of earliest retinopathic signs might determine the efficacy of novel drugs (Hellstedt & Immonen 1996; Adams & Bearse 2012). Currently, plenty of researches are being conducted on developing novel therapies to treat DR and diabetic macular oedema (DMO) (Mansour et al. 2020). As such, full‐field (ffERG) and multifocal electroretinography (mfERG) are non‐invasive, objective and sensitive methods to detect subtle retinal changes in clinical trials (Hood et al. 2012; McCulloch et al. 2014; Jenkins et al. 2018). Whereas ffERG records summed electrical response from the entire retina, mfERG can detect localized abnormalities from different regions of the retina (Hood et al. 2012; McCulloch et al. 2014). ffERG can be conducted both in scotopic and photopic conditions (McCulloch et al. 2014). Subclinical scotopic ffERG biomarkers of DR include reduced rod‐initiated function (b‐wave amplitude and implicit time) (Luu et al. 2010) and reduced amacrine‐mediated oscillatory potentials (OPs) (Yonemura et al. 1962; Bresnick et al. 1984; Juen & Kieselbach 1990; Yoshida et al. 1991; Lachapelle 1994; Vadala et al. 2002; Luu et al. 2010; Adams & Bearse 2012; Longhin et al. 2016). Specially the amplitudes and implicit times of OPs in diabetes without visible retinopathy are shown to consistently deviate from non‐diabetic retinas (Li et al. 1992).
Photopic ffERG components, which can also be affected in diabetics without retinopathy (no‐DR) include implicit time of cone‐mediated ERG response, whereas the amplitude of cone pathway have shown conflicting results (Yamamoto et al. 1996; Luu et al. 2010; Jansson et al. 2015; McAnany et al. 2019; McAnany & Park 2019; Zeng et al. 2019). On the other hand, mfERG in diabetics with no‐DR has shown conflicting results; recently Frydkjaer‐Olsen et al. 2017 did not find any changes in the amplitude and implicit times of mfERG in diabetics without DR or with mild DR; however, previous studies have reported changes in the implicit time and/or amplitudes of mfERG in diabetics without vascular changes (Fortune et al. 1999; Klemp et al. 2005; Harrison et al. 2011; Adams & Bearse 2012; Abdelkader 2013). Our literature review reveals that a comprehensive and systematic assessment of electroretinographic changes in diabetic patients is needed. In this study, we performed scotopic and photopic ffERG, and mfERG in diabetes with no‐DR and moderate non‐proliferative DR (NPDR).
Methods
Subjects
We consecutively recruited 48 diabetics, consisting of 26 patients with no‐DR and 22 with NPDR, from Steno Diabetes Center Copenhagen. We also recruited 22 healthy controls from Capital Region of Denmark (Table 1). The study was approved by the Committee on Health Research Ethics at the Capital Region of Denmark (H‐15013160) and followed the tenets of the Declaration of Helsinki. Written informed consent was obtained from all participants. The inclusion criteria were T1DM or T2DM with no‐DR or with NPDR, diabetes duration ≥15 years and age between 40 and 80 years. The exclusion criteria were binocular retinal laser photocoagulation, pregnancy, retinal diseases other than DR and excessive myopia (>−6.0 D).
Table 1.
Clinical profile of healthy controls, diabetic patients without retinopathy (no‐DR) and with non‐proliferative diabetic retinopathy (moderate NPDR).
| Controls (n = 22) | Patients with diabetes (n = 48) | ||||
|---|---|---|---|---|---|
| No‐DR (n = 26) | p * | With NPDR (n = 22) | p † | ||
| Sex (%, female;male) | 68;32 | 31;69 | 0.07 | 36;64 | 0.11 |
| Age (years, mean ± SD) | 59.0 ± 10.9 | 63.6 ± 8.6 | 0.23 | 61.1 ± 9.5 | 0.75 |
| BMI (kg/m2, mean ± SD) | 24.8 ± 3.5 | 27.4 ± 3.5 | 0.18 | 29.0 ± 7.2 | 0.02 |
| Blood pressure (mmHg) | |||||
| Systolic (mean ± SD) | 131.2 ± 13.4 | 139 ± 14.7 | 0.18 | 138.6 ± 14.1 | 0.21 |
| Diastolic (mean ± SD) | 82.2 ± 13.4 | 77.3 ± 0.4 | 0.10 | 81.3 ± 7.2 | 0.93 |
| Smoking (%, yes:no) | 5;95 | 12;88 | 1.0 | 9;91 | 1.0 |
| HbA1c (mmol/mol, mean ± SD) | 35.2 ± 2.6 | 58.0 ± 12.1 | <0.01 | 67.7 ± 12.8 | <0.01 ‡ |
| Diabetes duration (years, mean ± SD) | 0.0 ± 0.0 | 28.2 ± 9.4 | <0.01 | 29.7 ± 9.7 | 0.01 |
| Visual acuity (ETDRS, mean ± SD) | 87.1 ± 3.4 | 86.9 ± 4.7 | 0.99 | 82.0 ± 8.3 | 0.01 ‡ |
| Refractive error (mean ± SD) | 0.40 ± 1.77 | −0.23 ± 1.71 | 0.62 | −0.28 ± 1.97 | 0.47 |
| IOP (mmHg, mean ± SD) | 14.3 ± 2.7 | 14.2 ± 2.2 | 0.99 | 16.1 ± 2.8 | 0.05 ‡ |
BMI = Body Mass Index; DR = diabetic retinopathy; ETDRS = Early Treatment Diabetes Retinopathy Study; HbA1c = glycated hemoglobin; IOP = Intraocular pressure; NPDR = non‐proliferative diabetic retinopathy.
p‐value for difference between controls and diabetics without retinopathy.
p‐value for difference between controls and diabetics with NPDR.
Significant difference between diabetic patients without retinopathy and diabetic patients with NPDR (p‐value not shown).
Clinical examination
Every subject underwent slit lamp examination, intraocular pressure measurement, indirect ophthalmoscopy and measurement of visual acuity using Early Treatment Diabetic Retinopathy Study (ETDRS) chart. Arterial blood pressure was measured by an automatic monitor (Microlife AG, 9443, Widnau, Switzerland) and venous blood samples were collected to determine the glycated haemoglobin (HbA1c). A five‐overlapping imaging of the retina, each covering 45‐degree, was acquired from each eye in dilated condition (Topcon TRC‐NW8 Non‐Mydriatic Retinal Camera; Topcon Corporation, Tokyo, Japan). ImageNet software program was used to create a single mosaic image from the five image‐fields (nasal, temporal, superior, inferior and poster pole), and trained readers staged the degree of retinopathy according to the Steno Grading Scale, which is comparable to ETDRS staging (for more information see (Hansen et al. 2005)). We included diabetic patients without and with moderate NPDR (dot and blot haemorrhages, microaneurysms and hard or soft exudates, Fig. 1). The patients were additionally scanned with spectral domain optical coherence tomography (SD‐OCT, Topcon Corporation, Tokyo, Japan). Healthy controls were scanned with Heidelberg SD‐OCT (Heidelberg Engineering GmbH, Heidelberg, Germany) to exclude retinal diseases.
Fig. 1.

Fundus image of a 68‐year old female subject without diabetic retinopathy (no‐DR) on the left panel compared to the images of a 64‐year old male subject with moderate non‐proliferative diabetic retinopathy (NPDR) on the right panel. The white arrows on the right panel indicate small retinal haemorrhages and the yellow arrows indicate microaneurysms.
Testing procedure
We performed scotopic‐ and photopic ffERG and light adapted mfERG according to standard of the International Society for Clinical Electrophysiology of Vision (ISCEV), using RETI‐scan Ganzfeld dome system (RETI‐port/scan21, Roland Consult, Brandenburg, Germany) (McCulloch et al. 2014). The ISCEV programs for ffERG and mfERG are the standard features of the RETI‐port/scan21. For both ffERG and mfERG, we only measured one eye of the patients. The ERG procedures started with pupil dilation using topical phenylephrine hydrochloride 10% and tropicamide 1%, followed by placement of the active DTL electrodes (Dawson, Trick and Litzkow) across the limbus for recording, a gold‐cup skin‐electrode superotemporal to the orbital rim as reference and a ground electrode on the forehead. Prior to the emplacement of the skin electrodes, the skin was cleaned with skin preparation gel (Nuprep EEG & ECG gel) to reduce the impedance, and an impedance level <10 kΩ was accepted. Conductive paste was applied to the skin electrodes to enhance the electrical signals.
Scotopic ffERG was conducted after minimum 20‐min of dark adaptation, and photopic ffERG was performed after 10‐min light adaptation. We used Ganzfeld light stimulation (Ganzfeld Q140), which is integrated in the RETI‐port/scan21 and consists of 400 mm full‐field globe with a central fixation red LED light and an integrated infrared monitoring camera. The light stimulation was performed with subject focusing on the fixation spot, and the examiner was observing the fixation on the monitor. The light intensity and durations were according to ISCEV standards (McCulloch et al. 2014). For each stimulus, averaging of at least five recordings was performed. The ffERG outcomes were amplitudes (μV) and implicit times (ms) of: scotopic rod‐initiated b‐wave as response to weak flashes at 0.01 cd*s*m−2 (DA0.01), scotopic combined rod/cone‐mediated a‐ and b‐wave to strong flashes at 3 cd*s*m−2 (DA3.0) and 10 cd*s*m−2 (DA10.0), scotopic amacrine‐mediated oscillatory potentials to strong flashes (OP1, OP2 and OP3), photopic a‐ and b‐wave to strong flashes (LA3.0) and 30 Hz flicker ERG measured from trough (N1) to peak (P1) of the second wave to repeated strong stimuli at 3 cd*s*m−2 (30 Hz flicker), Fig. 2 (McCulloch et al. 2014).
Fig. 2.
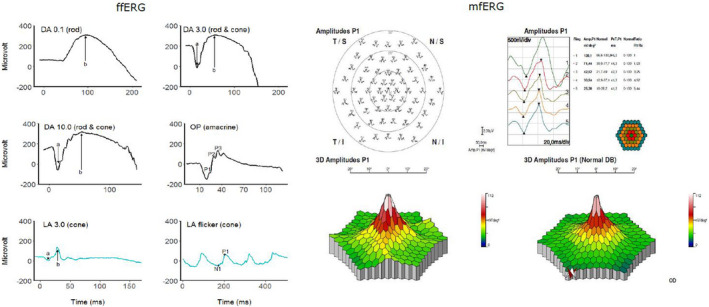
Example of a full‐field electroretinogram (ffERG) on the left and a multifocal electroretinogram (mfERG) on the right panel in a healthy subject. The dark‐adapted (DA) ffERG outcomes included DA0.01, DA3.0, DA10.0 and oscillatory potentials (OP), whereas the light adapted (LA) ffERG comprised the LA3.0 and LA flicker. The mfERG is presented both as a trace array and 3D map. For more details, please read the main text.
The mfERG was conducted in photopic condition with the pupil of the study eye dilated. The distance from the chinrest to the stimulation screen was 28 cm and correction lenses (+3 diopter) was added to patient's own refractive errors. The stimulations were displayed on a cathode ray tube (CRT) 19″ monitor with a luminance at 220 cd/m2. The study eye was stimulated with 8 runs of 61 hexagonal elements, covering 54○ of the retina (27○ radius from fixation point). The outcomes of mfERG were implicit time and amplitude of the first order kernel, rings 1–5 (Fig. 2).
Statistics
Continuous data are presented as mean ± SD and categorical data are expressed as percentage. For the continuous data, a one‐way analysis of variance (anova) was conducted to test the overall differences between the three group means (controls, diabetics with no‐DR and with NPDR), and when there was an overall significant difference, Tukey's honestly significant difference (HSD) post hoc test was run to identify the differences between two specific groups. Chi‐squared test was run for the categorical outcomes. Receiver operating characteristic (ROC) curves, plotting the sensitivity (true positive rate) as function of 1‐specificity (false positive rate), were used to calculate area under curve (AUC) of the implicit times and amplitudes of ffERG‐ and mfERG parameters for each of the three groups. p‐values were adjusted for BMI, age, sex, HbA1c and diabetes duration by adding these parameters in the post hoc anova‐model as covariates. Statistics were conducted using r version 3.5.3 (R Foundation for Statistical Computing, Vienna, Austria. URL https://www.R‐project.org). The study was performed in prospective manner, and we conducted power calculation prior to the study. The sample size was based on our previous experience with measurements of oscillatory potential amplitudes (μV) with full‐field ERG in diabetic patients. With a minimal clinically relevant difference at 17.8 μV we would be able to detect a difference in oscillatory potential amplitudes (μV) with 80% power using a sample of at least 16 subjects. The risk for type‐1 error was sat to 5%.
Results
Clinical characteristics of the 48 diabetics and 22 healthy controls are summarized in Table 1. There were no significant differences in age, sex, blood pressure, smoking and IOP between non‐diabetic controls and diabetics with no‐DR or with NPDR (n.s.). However, patients with NPDR had significantly higher BMI compared to healthy controls (p = 0.02) and significantly higher HbA1c than both healthy controls (p < 0.01) and diabetics with no‐DR (p < 0.01). In addition, visual acuity was significantly poorer in diabetics with NPDR compared to both no‐DR group as well as non‐diabetic controls (p < 0.01).
Scotopic and photopic ffERG
The amplitude of rod‐initiated DA0.01 b‐wave was reduced in patients with NPDR (p = 0.04), but not in those with no‐DR (p = 0.47) (Table 2). The implicit time of rod‐initiated DA0.01 b‐wave, and the implicit time and amplitude of the combined rod/cone‐mediated DA3.0 a‐ and b‐waves were not significantly changed in diabetics with no‐DR or with NPDR (n.s). The implicit time of the combined photoreceptor and bipolar cells response (DA10.0) was the only parameter in the scotopic ERG, which was prolonged both in diabetics with no‐DR and with NPDR (p ≤ 0.03). The amplitude of DA10.0 was smaller in the diabetic group with no‐DR (p = 0.08). Both the implicit times and the amplitudes of the amacrine‐mediated OP1, OP2 and OP3 were significantly reduced in diabetics with NPDR (for all comparisons p < 0.05). In patients with no‐DR, the amplitude of the amacrine‐mediated of OP1, OP2 and OP3 were significantly reduced (for all comparisons, p ≤ 0.03); however, only the implicit time of OP2 was significantly prolonged in this group (p = 0.002). The amplitude of cone‐initiated LA3.0 a‐ and b‐waves were not changed in the diabetic groups. The implicit time of cone‐initiated b‐wave was only prolonged in diabetics with NPDR (p < 0.01), but not in the group with no‐DR (p = 0.89). Likewise, the amplitude of cone‐mediated 30‐Hz flicker was not changed in the diabetic groups, whereas the cone‐mediated implicit time of 30 Hz flicker ERG was only prolonged in diabetics with NPDR (p < 0.05).
Table 2.
Full‐field electroretinographic amplitude (μV) and implicit time (ms) of dark‐adapted rod‐ (DA0.01) or combined rod/coned‐initiated (DA3.0) pathways, amacrine‐mediated scotopic oscillatory potentials (OP1‐OP3) and photopic cone‐initiated pathways in healthy controls and diabetic patients with and without non‐proliferative diabetic retinopathy (NPDR).
| Controls (n = 22) | No‐DR (n = 26) | With NPDR (n = 22) | ||||
|---|---|---|---|---|---|---|
| Mean ± SD | Mean ± SD | p * | Mean ± SD | p † | ||
| Scotopic ERG | ||||||
| DA0.01 (rod) | b‐wave (μV) | 228.9 ± 61.0 | 184.45 ± 65.1 | 0.19 § | 195.1 ± 73.2 | 0.04 § |
| b‐wave (ms) | 98.3 ± 7.9 | 101.5 ± 11.3 | 0.63 | 106.2 ± 13.9 | 0.08 | |
| DA3.0 (rod/cone) | a‐wave (μV) | 203.3 ± 84.2 | 176.9 ± 67.9 | 0.33 § , ¶ | 165.6 ± 62.8 | 0.13 § , ¶ |
| a‐wave (ms) | 19.5 ± 6.1 | 19.8 ± 2.6 | 0.95 | 20.9 ± 3.2 | 0.51 | |
| b‐wave (μV) | 324.9 ± 96.3 | 280.1 ± 82.9 | 0.18 § | 296.2 ± 98.2 | 0.53 § | |
| b‐wave (ms) | 52.8 ± 10.7 | 57.1 ± 17.8 | 0.48 § | 56.1 ± 6.4 | 0.69 § | |
| DA10.0 | a‐wave (μV) | 254.2 ± 87.1 | 192.9 ± 48.3 | 0.008 § | 208.8 ± 82.3 | 0.08 § |
| a‐wave (ms) | 15.9 ± 1.5 | 16.8 ± 0.8 | 0.03 § | 17.1 ± 1.36 | 0.002 § | |
| b‐wave (μV) | 345.9 ± 98.6 | 294.8 ± 89.3 | 0.16 § | 314 ± 124.7 | 0.52 § | |
| b‐wave (ms) | 52.1 ± 7,2 | 55.3 ± 10.2 | 0.41 | 55.3 ± 6.7 | 0.42 | |
| OP (amacrines) | OP1 (μV) | 31.1 ± 15.5 | 17.9 ± 10.9 | 0.001 § | 20.4 ± 11.6 | 0.01 § |
| OP2 (μV) | 80.6 ± 32.7 | 59.6 ± 22.8 | 0.03 | 60.2 ± 27.7 | 0.046 | |
| OP3 (μV) | 38.4 ± 24.9 | 19.7 ± 12.3 | 0.00 | 23.6 ± 19.1 | 0.03 | |
| OP1 (ms) | 19.1 ± 0.8 | 19.9 ± 2.1 | 0.19 | 20.3 ± 1.3 | 0.02 | |
| OP2 (ms) | 25.9 ± 0.9 | 27.5 ± 2.1 | 0.002 § | 27.3 ± 1.5 | 0.008 § | |
| OP3 (ms) | 32.7 ± 1.1 | 34.0 ± 2.8 | 0.09 | 34.5 ± 2.0 | 0.02 § | |
| Photopic ERG | ||||||
| LA3.0 (cone) | a‐wave (μV) | 36.4 ± 26.7 | 26.9 ± 8.2 | 0.11 § | 29.1 ± 14.3 | 0.29 § |
| a‐wave (ms) | 15.0 ± 1.3 | 15.4 ± 1.5 | 0.62 | 16.0 1.7 | 0.07 | |
| b‐wave (μV) | 122.7 ± 44.7 | 106.8 ± 24.8 | 0.27 § | 107.9 ± 49.7 | 0.35 § | |
| b‐wave (ms) | 31.3 ± 1.3 | 31.5 ± 1.2 ‡ | 0.89 § | 33.3 ± 2.7 | 0.0009 § | |
| 30Hz flicker (cone) | N1P1 (μV) | 95.0 ± 43.4 | 84.5 ± 18.2 | 0.46 § | 82.0 ± 32.5 | 0.33 § |
| N1P1 (ms) | 62.2 ± 1.9 | 62.7 ± 2.2 | 0.75 | 64.1 ± 3.7 | 0.048 | |
p‐value for difference between controls and diabetics without retinopathy.
p‐value for difference between controls and diabetics with NPDR.
Significant difference between diabetic patients without retinopathy and diabetic patients with NPDR (p‐value not shown).
Adjusted for age.
Adjusted for BMI.
Multifocal ERG
The amplitudes of all five rings (R1–R5) were significantly reduced in diabetics with NPDR compared to non‐diabetic controls (for all comparisons, p < 0.01) (Table 3). In diabetics with no‐DR, only the amplitude of R2 was significantly reduced compared to non‐diabetic controls (p = 0.04). The implicit times of R4 and R5 were significantly prolonged both in those with no‐DR and with NPDR (p ≤ 0.04). There were no significant differences in implicit times of R1‐R3 between the diabetic groups and non‐diabetic controls (n.s.).
Table 3.
Multifocal electroretinographic amplitudes (nV/deg2) and implicit times (ms) in healthy controls and patients without and with non‐proliferative diabetic retinopathy (NPDR).
| Multifocal ERG | Control (n = 22) | No‐DR (n = 26) | With NPDR (n = 22) | |||
|---|---|---|---|---|---|---|
| Mean ± SD | Mean ± SD | p * | Mean ± SD | p † | ||
| Amplitudes (nV/deg2) | R1 | 105.0 ± 27.3 | 87.9 ± 31.8 ‡ | 0.11 | 68.5 ± 27.4 | <0.01 |
| R2 | 51.9 ± 11.7 | 44.3 ± 9.5 | 0.04 | 38.0 ± 10.0 | <0.01 | |
| R3 | 30.2 ± 7.7 | 27.6 ± 6.8 | 0.40 | 22.5 ± 7.0 | <0.01 | |
| R4 | 21.1 ± 4.8 | 19.0 ± 4.8 | 0.24 | 16.3 ± 4.3 | <0.01 § | |
| R5 | 17.29 ± 4.6 | 14.9 ± 3.7 | 0.08 | 12.6 ± 334 | <0.01 § | |
| Implicit time (ms) | R1 | 46.9 ± 3.4 | 47.3 ± 3.0 | 0.92 | 46.0 ± 3.1 | 0.65 |
| R2 | 42.93 ± 2.5 | 44.3 ± 2.8 | 0.99 | 43.0 ± 6.1 | 0.49 | |
| R3 | 41.63 ± 4.0 | 43.0 ± 2.3 | 0.97 | 41.9 ± 5.6 | 0.47 | |
| R4 | 41.94 ± 1.9 | 43.3 ± 1.5 | 0.02 § | 44.2 ± 2.1 | <0.01 § | |
| R5 | 42.25 ± 1.5 | 43.5 ± 1.6 | 0.04 § | 44.4 ± 2.7 | <0.01 § | |
P1 and P2 indicate the differences between healthy controls and patients with no‐DR and with NPDR, respectively.
p‐value for difference between controls and diabetics without retinopathy.
p‐value for difference between controls and diabetics with NPDR.
Significant difference between diabetic patients without retinopathy and diabetic patients with NPDR (p‐value not shown).
Adjusted for age.
ROC curves: Sensitivity, specificity and AUC
Receiver operating characteristic analyses for ffERG parameters (OPs, a‐ and b‐waves of LA3.0 and 30 Hz flicker) and mfERG parameters (R1–R5) are shown in Figs 3 and 4, and the optimal threshold, sensitivity, specificity and AUC for each parameter are shown in Table 4. The amplitudes of OP1–OP3 and the implicit time of OP2 were the only parameters, which significantly distinguished both diabetics with no‐DR and with NPDR from non‐diabetic controls (all AUC ≥ 0.69, p ≤ 0.04). The implicit times of OP1 and OP3 significantly distinguished diabetics with NPDR from non‐diabetic controls (all AUC ≥ 0.79, p < 0.01), but not diabetics with no‐DR from non‐diabetic controls (all AUC ≥ 0.69, p < 0.01). Only the implicit time of OP2 was able to distinguish both diabetics with no‐DR and with NPDR from non‐diabetic controls (all AUC ≥ 0.80, p ≤ 0.01). The amplitudes of LA3.0 and 30 Hz flicker were not able to differentiate diabetic groups from non‐diabetic controls (all AUC ≥ 0.57, p ≥ 0.13). Meanwhile, the implicit times of LA3.0 a‐wave and 30 Hz flicker distinguished diabetics with NPDR from non‐diabetic controls (all AUC ≥ 0.63, p < 0.05). The amplitudes of R2 and R5 in multifocal ERG were significantly able to separate both diabetics with no‐DR and with NPDR from non‐diabetic controls (all AUC ≥ 0.68, p ≤ 0.04). The amplitudes of R1, R2 and R3 were only able to distinguish diabetics with NPDR from non‐diabetic controls (all AUC ≥ 0.68, p ≤ 0.04).
Fig. 3.
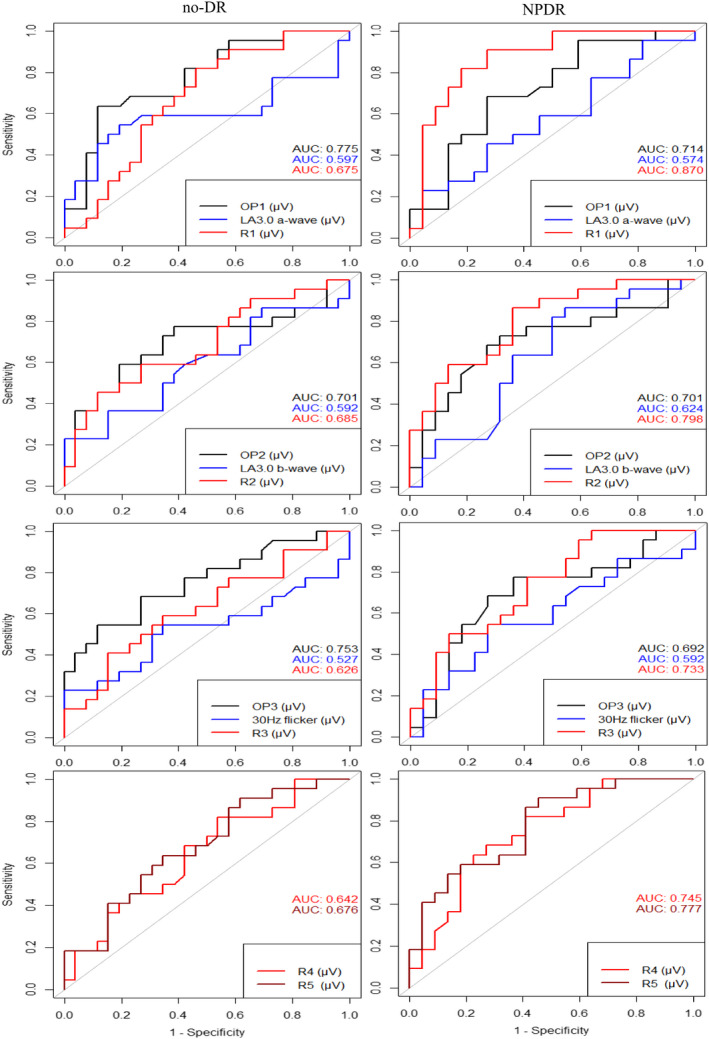
Receiving operating characteristic (ROC) curves for amplitudes of selected full‐field and multifocal electroretinographic parameters in diabetes patients without retinopathy (no‐DR) or with non‐proliferative diabetic retinopathy (NPDR) plotted with reference to non‐diabetic controls. Dark curves represent scotopic ERG, blue curves indicate photopic ERG and red colours illustrate mfERG outcomes.
Fig. 4.
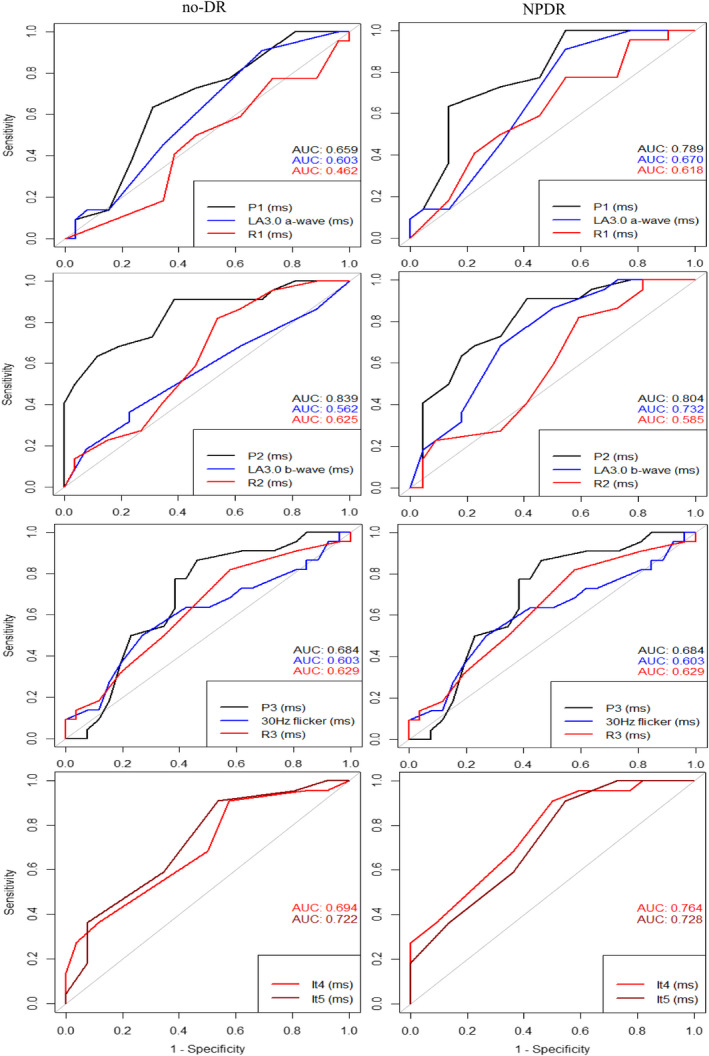
Receiving operating characteristic (ROC) curves for implicit times of selected full‐field and multifocal electroretinographic parameters in diabetes patients without retinopathy (no‐DR) or with non‐proliferative diabetic retinopathy (NPDR) plotted with reference to non‐diabetic controls. Dark curves represent scotopic ERG, blue curves indicate photopic ERG and red colours illustrate mfERG outcomes.
Table 4.
Comparison between healthy controls and patients without diabetic retinopathy (no‐DR) and with non‐proliferative diabetic retinopathy (with NPDR) using ROC curves of amplitudes (nV/deg2) and implicit times (ms) generated by full‐field and multifocal electroretinograms (ERG).
| MFERG | No‐DR (n = 26) | With NPDR (n = 22) | |||||||||
|---|---|---|---|---|---|---|---|---|---|---|---|
| Thr. | Sens. | Spec. | AUC | p * | Thr. | Sens. | Spec. | AUC | p † | ||
| ffERG, scotopic | |||||||||||
| Amp (μV) | Op1 | 0.49 | 0.54 | 0.73 | 0.78 | 0.006 | 0.49 | 0.68 | 0.73 | 0.71 | 0.02 |
| Op2 | 0.51 | 0.64 | 0.73 | 0.70 | 0.02 | 0.52 | 0.68 | 0.73 | 0.70 | 0.04 | |
| Op3 | 0.43 | 0.68 | 0.73 | 0.75 | 0.005 | 0.45 | 0.68 | 0.73 | 0.69 | 0.04 | |
| I.t. (ms) | Op1 | 0.48 | 0.64 | 0.69 | 0.66 | 0.13 | 0.63 | 0.64 | 0.86 | 0.79 | 0.005 |
| Op2 | 0.64 | 0.64 | 0.88 | 0.84 | 0.001 | 0.63 | 0.64 | 0.82 | 0.80 | 0.004 | |
| Op3 | 0.48 | 0.64 | 0.62 | 0.68 | 0.06 | 0.58 | 0.64 | 0.77 | 0.79 | 0.005 | |
| ffERG, photopic | |||||||||||
| LA3.0 (μV) | a‐wave | 0.45 | 0.55 | 0.81 | 0.60 | 0.13 | 0.50 | 0.50 | 0.64 | 0.57 | 0.29 |
| b‐wave | 0.44 | 0.55 | 0.62 | 0.59 | 0.14 | 0.48 | 0.64 | 0.64 | 0.62 | 0.30 | |
| LA3.0 (ms) | a‐wave | 0.46 | 0.45 | 0.65 | 0.60 | 0.32 | 0.53 | 0.45 | 0.68 | 0.67 | 0.045 |
| b‐wave | 0.48 | 0.32 | 0.77 | 0.67 | 0.53 | 0.46 | 0.45 | 0.65 | 0.60 | 9.32 | |
| Flicker (μV) | N1P1 | 0.45 | 0.55 | 0.65 | 0.53 | 0.27 | 0.50 | 0.55 | 0.73 | 0.59 | 0.27 |
| Flicker (ms) | N1P1 | 0.49 | 0.50 | 0.73 | 0.60 | 0.34 | 0.59 | 0.50 | 0.64 | 0.63 | 0.048 |
| MFERG | |||||||||||
| Amp. (nV/deg2) | R1 | 0.46 | 0.64 | 0.65 | 0.68 | 0.07 | 0.49 | 0.82 | 0.82 | 0.87 | 0.001 |
| R2 | 0.49 | 0.50 | 0.81 | 0.69 | 0.02 | 0.48 | 0.64 | 0.73 | 0.80 | 0.002 | |
| R3 | 0.46 | 0.50 | 0.73 | 0.63 | 0.13 | 0.50 | 0.64 | 0.64 | 0.73 | 0.01 | |
| R4 | 0.47 | 0.50 | 0.65 | 0.64 | 0.08 | 0.51 | 0.68 | 0.73 | 0.75 | 0.02 | |
| R5 | 0.48 | 0.55 | 0.74 | 0.68 | 0.04 | 0.54 | 0.64 | 0.68 | 0.78 | 0.01 | |
Amp = amplitude; AUC = area under the curve; DR = Diabetic retinopathy; ffERG = full‐field electroretinography; I.t. = Implicit time; LA = light adapted; MFERG = multifocal electroretinography; NPDR = Non‐proliferative diabetic retinopathy; ROC = receiving operating curves; Sens. = sensitivity; Spec. = specificity; Thr. = Threshold.
p‐value for difference between controls and diabetics without retinopathy.
p‐value for difference between controls and diabetics with NPDR.
Discussion
This study aimed to find which parameter is superior in distinguishing diabetics with no‐DR and with NPDR from non‐diabetic controls using ISCEV standard ffERG and mfERG protocols. We found that the implicit time of DA10.0, the amacrine‐mediated OP1‐3 amplitudes and OP2 implicit time in ffERG, and the R2 amplitude, the R4 and R5 implicit times in mfERG could significantly distinguish diabetics with no‐DR as well as diabetics with NPDR from non‐diabetic controls, and among these the implicit time of OP2 was superior in differentiating diabetic from non‐diabetic retinas.
International Society for Clinical Electrophysiology of Vision standard ffERG protocols test the function of rod‐driven response (DA0.01), combined response of rod‐cone and bipolar cells (DA3.0 and DA10.0), oscillatory potentials from the amacrines (OP1–OP4) and the responses from cone pathways (LA3.0 and 30 Hz flicker). The reduced amplitude of rod‐driven DA0.01 in patients with moderate NPDR and the normal rod‐initiated implicit time in diabetic with no‐DR and with moderate NPDR in our study agrees with some previous studies and contradicts other studies (Holopigian et al. 1992, 1997; Luu et al. 2010; Longhin et al. 2016). The prolonged implicit time of DA10.0 in both diabetic groups indicate that the rod pathway is affected in diabetes regardless of retinopathy. In the case of cone pathway, we found significantly delay in implicit times of LA3.0 and 30 Hz flicker in diabetes with moderate NPDR, but not in those with no‐DR. Although some previous studies have reported normal cone pathways, there is compelling evidence that flicker ERG, especially the high‐frequency flicker ERG is changed in diabetes with no‐DR as well as in those with NPDR (Holopigian et al. 1997; Kim et al. 1997; Luu et al. 2010; McAnany et al. 2019; McAnany & Park 2019; Zeng et al. 2019).
In contrast to the conflicting results of ffERG on the outer retinal photoreceptors, the inner retinal amacrine‐mediated OP amplitudes and the OP2 implicit time were consistently changed in diabetes with no‐DR as well as diabetes with NPDR. Hence our results are in agreement with previous studies, showing that the OP's are the only ERG parameters, which are consistently changed in the diabetic retina before vasculopathy becomes evident on ophthalmoscopy and funduscopic imaging (Yonemura et al. 1962; Brunette & Lafond 1983; Li et al. 1992; van der Torren & Mulder 1993; Lachapelle 1994; Luu et al. 2010). Moreover, our ROC analysis showed the largest AUC for OP2 implicit time both in diabetes with no‐DR (AUC = 0.84) and with NPDR (AUC = 0.80) (Table 4). The affected amacrine function in diabetic retinas might be due to the diabetes induced hypoxemia, because the amacrine‐mediated OP's are sensitive to hypoxemia, which are also observed in other conditions with retinal hypoxia, for example central retinal vein occlusion (Derr et al. 2002). It is worth to notice that there is a debate about how to measure and describe OPs because OPs are highly dependent on adaptation state and characteristics of the high‐pass filter used to separate them from the ERG. Therefore, without comparing the absolute values of each OP peaks between groups, simply observing the presence and normal waveform of OPs may be adequate for most clinical applications.
Previous studies have reported that ERG function in diabetic patients decreases proportionally with DR severity. In the current study, although there is no significant difference in ERG function between diabetic patients without DR and those with moderate NPDR, one can see that most of the ffERG and mfERG amplitudes are reduced in patients without DR compared to those with NPDR (Tables 2 and 3). So, our study is in agreement with previous studies, but due to low power the results are not statistically significant.
Diabetes tends to lead to retinal lesions that are unevenly distributed over the retina, which suggests that mfERG may be able to detect the earliest functional anomalies. Clinical studies have found varying results, from normal amplitudes and implicit times in diabetes with no‐DR and with mild DR (Frydkjaer‐Olsen et al. 2017), to prolonged implicit times in both conditions (Fortune et al. 1999; Bearse et al. 2004; Adams & Bearse 2012; Laron et al. 2012; Abdelkader 2013; Adhikari et al. 2014) (Fortune et al. 1999; Abdelkader 2013; Adhikari et al. 2014).
One could argue that the depressed ffERG‐ and mfERG outcomes in diabetes with NPDR compared to no‐DR and non‐diabetic controls may be attributed to the relatively poor visual acuity due to cataract in the NPDR‐group (Tanikawa et al. 2021; Wang et al. 2021). And since development of cataract lead to myopic shift, we compared the level of refractive errors between the groups, and there were no significant differences between the groups (p > 0.96). Nevertheless, the lack of myopic shift does not fully explain the lower visual acuity and thus, we cannot fully rule out that the presence of media opacity does not affect the ERG results.
Limitations
The study bundled T1DM and T2DM into a single group because of limited numbers and because the distinction between the two entities is not always clear. Regardless of type, the duration of diabetes was long, 15 years or more, a condition which is associated with retinal neurodegeneration, even if fundus photographic retinopathy is mild or absent (Juen & Kieselbach 1990; Klemp et al. 2005). We purposely examined the patients in a non‐fasting condition, because we gave priority to do it under circumstances that reflect their habitual glycaemia level. We did not, however, measure blood glucose level at the time of examination, although glycaemia fluctuations may influence mfERG parameters (Klemp et al. 2004, 2005; Klefter et al. 2015). Meanwhile animal and human studies indicate that retinal responses measured with both ffERG and mfERG in diabetic patients adapt to acutely changes in plasma glucose levels (Klemp et al. 2005; Becker et al. 2020).
Another major limitation is the way we classified DR, because for the precise classification of DR fluorescein angiography needs to be performed, whereas our classification was based on the mosaic of five fundus‐images. Nevertheless, our classification method is comparable to the ETDRS classification, which has previously been shown to be a reliable staging method. We included only diabetic patients without retinopathy and with moderate NPDR. It would optimize the study design if we had included patients with different stages of DR, then we would better understand dose–response relationship and the true association between DR and electrophysiological parameters.
Two of our patients were treated with anti‐VEGF minimum 5 months prior to the inclusion, and our results remained unchanged when we removed the two patients from the analysis.
Conclusion
Considering the ongoing research on developing novel therapies for diabetic retinopathy, ffERG and mfERG provide objective methods to evaluate the retina. And among the many outcomes from ff‐ and mfERG, the implicit time of OP2 from ffERG is the most sensitive parameter to distinguish diabetes with no‐DR and with moderate NPDR from non‐diabetic retina. The reason that we did not include patients with proliferative DR was that almost all patients with proliferative DR in Denmark are treated with pan‐retinal photocoagulation (PRP), which might affect the ERG parameters. And patients with severe degree of non‐proliferative DR have higher risk of diabetic macular oedema, which due to its fluctuating nature is not suitable to monitor with ERG.
SB, MLA and HLA wrote the manuscript and HUA contributed to collection and the study concept. All authors reviewed and edited the manuscript.
Ba‐Ali S., None; Larsen M. Consultant for Novo Nordisk; Lund‐Andersen H., None; Andersen, H. U. Owns stocks in Novo Nordisk A/S and works in advisory boards for Novo Nordisk A/S and Abbott Inc.
References
- Abdelkader M (2013): Multifocal electroretinogram in diabetic subjects. Saudi J Ophthalmol 27: 87–96. [DOI] [PMC free article] [PubMed] [Google Scholar]
- Adams AJ & Bearse MA Jr (2012): Retinal neuropathy precedes vasculopathy in diabetes: a function‐based opportunity for early treatment intervention? Clin Exp Optom 95: 256–265. [DOI] [PubMed] [Google Scholar]
- Adhikari P, Marasini S, Sah RP, Joshi SN & Shrestha JK (2014): Multifocal electroretinogram responses in Nepalese diabetic patients without retinopathy. Doc Ophthalmol 129: 39–46. [DOI] [PubMed] [Google Scholar]
- Bearse MA Jr, Han Y, Schneck ME & Adams AJ (2004): Retinal function in normal and diabetic eyes mapped with the slow flash multifocal electroretinogram. Invest Ophthalmol Vis Sci 45: 296–304. [DOI] [PubMed] [Google Scholar]
- Becker S, Carroll LS & Vinberg F (2020): Rod phototransduction and light signal transmission during type 2 diabetes. BMJ Open Diabetes Res Care 8: e001571. [DOI] [PMC free article] [PubMed] [Google Scholar]
- Bresnick GH, Korth K, Groo A & Palta M (1984): Electroretinographic oscillatory potentials predict progression of diabetic retinopathy. Preliminary report. Arch Ophthalmol 102: 1307–1311. [DOI] [PubMed] [Google Scholar]
- Brunette JR & Lafond G (1983): Electroretinographic evaluation of diabetic retinopathy: sensitivity of amplitude and time of response. Canadian journal of ophthalmology. Can J Ophthalmol 18: 285–289. [PubMed] [Google Scholar]
- Coupland SG (1987): A comparison of oscillatory potential and pattern electroretinogram measures in diabetic retinopathy. Doc Ophthalmol 66: 207–218. [DOI] [PubMed] [Google Scholar]
- Derr PH, Meyer AU, Haupt EJ & Brigell MG (2002): Extraction and modeling of the oscillatory potential: Signal conditioning to obtain minimally corrupted oscillatory potentials. Doc Ophthalmol 104: 37–55. [DOI] [PubMed] [Google Scholar]
- Fortune B, Schneck ME & Adams AJ (1999): Multifocal electroretinogram delays reveal local retinal dysfunction in early diabetic retinopathy. Invest Ophthalmol Vis Sci 40: 2638–2651. [PubMed] [Google Scholar]
- Frydkjaer‐Olsen U, Hansen RS, Peto T & Grauslund J (2017): Structural neurodegeneration correlates with early diabetic retinopathy. Int Ophthalmol 38: 1621–1626. [DOI] [PubMed] [Google Scholar]
- Hansen AB, Hansen RN, Colding‐Jorgensen M, Borch‐Johnsen K & Lund‐Andersen H (2005): Model simulation of the patient flow through a screening Centre for diabetic retinopathy. Acta Ophthalmol Scand 83: 678–686. [DOI] [PubMed] [Google Scholar]
- Harrison WW, Bearse MA Jr, Ng JS, Jewell NP, Barez S, Burger D, Schneck ME & Adams AJ (2011): Multifocal electroretinograms predict onset of diabetic retinopathy in adult patients with diabetes. Invest Ophthalmol Vis Sci 52: 772–777. [DOI] [PMC free article] [PubMed] [Google Scholar]
- Hellstedt T & Immonen I (1996): Disappearance and formation rates of microaneurysms in early diabetic retinopathy. Br J Ophthalmol 80: 135–139. [DOI] [PMC free article] [PubMed] [Google Scholar]
- Holopigian K, Greenstein VC, Seiple W, Hood DC & Carr RE (1997): Evidence for photoreceptor changes in patients with diabetic retinopathy. Invest Ophthalmol Vis Sci 38: 2355–2365. [PubMed] [Google Scholar]
- Holopigian K, Seiple W, Lorenzo M & Carr R (1992): A comparison of photopic and scotopic electroretinographic changes in early diabetic retinopathy. Invest Ophthalmol Vis Sci 33: 2773–2780. [PubMed] [Google Scholar]
- Hood DC, Bach M, Brigell M et al. (2012): ISCEV standard for clinical multifocal electroretinography (mfERG) (2011 edition). Doc Ophthalmol 124: 1–13. [DOI] [PMC free article] [PubMed] [Google Scholar]
- International‐Diabetes‐Federation (2015): International diabetes federation (IDF) DIABETES ATLAS, 7th edn. Brussels, Belgium: Diabetesatlas.org. [Google Scholar]
- Jansson RW, Raeder MB & Krohn J (2015): Photopic full‐field electroretinography and optical coherence tomography in type 1 diabetic retinopathy. Graefes Arch Clin Exp Ophthalmol 253: 989–997. [DOI] [PMC free article] [PubMed] [Google Scholar]
- Jenkins KS, Steel JC & Layton CJ (2018): Systematic assessment of clinical methods to diagnose and monitor diabetic retinal neuropathy. J Ophthalmol 2018: 8479850. [DOI] [PMC free article] [PubMed] [Google Scholar]
- Juen S & Kieselbach GF (1990): Electrophysiological changes in juvenile diabetics without retinopathy. Arch Ophthalmol 108: 372–375. [DOI] [PubMed] [Google Scholar]
- Kim SH, Lee SH, Bae JY, Cho JH & Kang YS (1997): Electroretinographic evaluation in adult diabetics. Doc Ophthalmol 94: 201–213. [DOI] [PubMed] [Google Scholar]
- Klefter ON, Vilsboll T, Knop FK & Larsen M (2015): Retinal vascular and structural dynamics during acute hyperglycaemia. Acta Ophthalmol 93: 697–705. [DOI] [PubMed] [Google Scholar]
- Klemp K, Larsen M, Sander B, Vaag A, Brockhoff PB & Lund‐Andersen H (2004): Effect of short‐term hyperglycemia on multifocal electroretinogram in diabetic patients without retinopathy. Invest Ophthalmol Vis Sci 45: 3812–3819. [DOI] [PubMed] [Google Scholar]
- Klemp K, Sander B, Brockhoff PB, Vaag A, Lund‐Andersen H & Larsen M (2005): The multifocal ERG in diabetic patients without retinopathy during euglycemic clamping. Invest Ophthalmol Vis Sci 46: 2620–2626. [DOI] [PubMed] [Google Scholar]
- Lachapelle P (1994): The human suprathreshold photopic oscillatory potentials: Method of analysis and clinical application. Doc Ophthalmol 88: 1–25. [DOI] [PubMed] [Google Scholar]
- Laron M, Bearse MA Jr, Bronson‐Castain K, Jonasdottir S, King‐Hooper B, Barez S, Schneck ME & Adams AJ (2012): Interocular symmetry of abnormal multifocal electroretinograms in adolescents with diabetes and no retinopathy. Invest Ophthalmol Vis Sci 53: 316–321. [DOI] [PMC free article] [PubMed] [Google Scholar]
- Li X, Sun X, Hu Y, Huang J & Zhang H (1992): Electroretinographic oscillatory potentials in diabetic retinopathy. An analysis in the domains of time and frequency. Doc Ophthalmol 81: 173–179. [DOI] [PubMed] [Google Scholar]
- Longhin E, Tormene AP, Olivato E, Convento E, Vujosevic S, Pilotto E, Kotsafti O & Midena E (2016): Rod function in diabetic patients without and with early diabetic retinopathy. Eur J Ophthalmol 26: 418–424. [DOI] [PubMed] [Google Scholar]
- Luu CD, Szental JA, Lee SY, Lavanya R & Wong TY (2010): Correlation between retinal oscillatory potentials and retinal vascular caliber in type 2 diabetes. Invest Ophthalmol Vis Sci 51: 482–486. [DOI] [PubMed] [Google Scholar]
- Mansour SE, Browning DJ, Wong K, Flynn HW Jr & Bhavsar AR (2020): The evolving treatment of diabetic retinopathy. Clin Ophthalmol 14: 653–678. [DOI] [PMC free article] [PubMed] [Google Scholar]
- McAnany JJ & Park JC (2019): Cone photoreceptor dysfunction in early‐stage diabetic retinopathy: association between the activation phase of cone phototransduction and the flicker electroretinogram. Invest Ophthalmol Vis Sci 60: 64–72. [DOI] [PMC free article] [PubMed] [Google Scholar]
- McAnany JJ, Park JC, Chau FY, Leiderman YI, Lim JI & Blair NP (2019): Amplitude loss of the high‐frequency flicker electroretinogram in early diabetic retinopathy. Retina 39: 2032–2039. [DOI] [PMC free article] [PubMed] [Google Scholar]
- McCulloch DL, Marmor MF, Brigell MG, Hamilton R, Holder GE, Tzekov R & Bach M (2014): ISCEV standard for full‐field clinical electroretinography (2015 update). Doc Ophthalmol 130(1): 1–12. [DOI] [PubMed] [Google Scholar]
- Park SH, Park JW, Park SJ, Kim KY, Chung JW, Chun MH & Oh SJ (2003): Apoptotic death of photoreceptors in the streptozotocin‐induced diabetic rat retina. Diabetologia 46: 1260–1268. [DOI] [PubMed] [Google Scholar]
- Tanikawa A, Suzuki K, Nomura R, Tanaka H, Mizuguchi T, Shimada Y & Horiguchi M (2021): The influence of mild cataract on ISCEV standard electroretinogram recorded from mydriatic eyes. Doc Ophthalmol 142: 177–183. [DOI] [PubMed] [Google Scholar]
- Thomas RL, Dunstan FD, Luzio SD, Chowdhury SR, North RV, Hale SL, Gibbins RL & Owens DR (2015): Prevalence of diabetic retinopathy within a national diabetic retinopathy screening service. Br J Ophthalmol 99: 64–68. [DOI] [PubMed] [Google Scholar]
- Vadala M, Anastasi M, Lodato G & Cillino S (2002): Electroretinographic oscillatory potentials in insulin‐dependent diabetes patients: A long‐term follow‐up. Acta Ophthalmol Scand 80: 305–309. [DOI] [PubMed] [Google Scholar]
- van der Torren K & Mulder P (1993): Comparison of the second and third oscillatory potentials with oscillatory potential power in early diabetic retinopathy. Doc Ophthalmol 83: 111–118. [DOI] [PubMed] [Google Scholar]
- Villarroel M, Ciudin A, Hernandez C & Simo R (2010): Neurodegeneration: An early event of diabetic retinopathy. World J Diabetes 1: 57–64. [DOI] [PMC free article] [PubMed] [Google Scholar]
- Wang H, Li F, J Li, J Lin, Liu M, Wang G, Wang M, Ran L, Robson AG & Li S (2021): Electrophysiology as a prognostic indicator of visual recovery in diabetic patients undergoing cataract surgery. Graefes Arch Clin Exp Ophthalmol 259: 1879‐1887. [DOI] [PMC free article] [PubMed] [Google Scholar]
- Yamamoto S, Kamiyama M, Nitta K, Yamada T & Hayasaka S (1996): Selective reduction of the S cone electroretinogram in diabetes. Br J Ophthalmol 80: 973–975. [DOI] [PMC free article] [PubMed] [Google Scholar]
- Yau JW, Rogers SL, Kawasaki R et al. (2012): Global prevalence and major risk factors of diabetic retinopathy. Diabetes Care 35: 556–564. [DOI] [PMC free article] [PubMed] [Google Scholar]
- Yonemura D, Aoki T & Tsuzuki K (1962): Electroretinogram in diabetic retinopathy. Arch Ophthalmol 68: 19–24. [DOI] [PubMed] [Google Scholar]
- Yoshida A, Kojima M, Ogasawara H & Ishiko S (1991): Oscillatory potentials and permeability of the blood‐retinal barrier in noninsulin‐dependent diabetic patients without retinopathy. Ophthalmology 98: 1266–1271. [DOI] [PubMed] [Google Scholar]
- Zeng Y, Cao D, Yu H et al. (2019): Early retinal neurovascular impairment in patients with diabetes without clinically detectable retinopathy. Br J Ophthalmol 103: 1747–1752. [DOI] [PubMed] [Google Scholar]