

Abstract
Background
Clinical management of shrimp allergy is hampered by the lack of accurate tests. Molecular diagnosis has been shown to more accurately reflect the clinical reactivity but the full spectrum of shrimp allergens and their clinical relevance are yet to be established. We therefore sought to comprehend the allergen repertoire of shrimp, investigate and compare the sensitization pattern and diagnostic value of the allergens in allergic subjects of two distinct populations.
Methods
Sera were collected from 85 subjects with challenge‐proven or doctor‐diagnosed shrimp allergy in Hong Kong and Thailand. The IgE‐binding proteins of Penaeus monodon were probed by Western blotting and identified by mass spectrometry. Recombinant shrimp allergens were synthesized and analyzed for IgE sensitization by ELISA.
Results
Ten IgE‐binding proteins were identified, and a comprehensive panel of 11 recombinant shrimp allergens was generated. The major shrimp allergens among Hong Kong subjects were troponin C (Pen m 6) and glycogen phosphorylase (Pen m 14, 47.1%), tropomyosin (Pen m 1, 41.2%) and sarcoplasmic‐calcium binding protein (Pen m 4, 35.3%), while those among Thai subjects were Pen m 1 (68.8%), Pen m 6 (50.0%) and fatty acid‐binding protein (Pen m 13, 37.5%). Component‐based tests yielded significantly higher area under curve values (0.77–0.96) than shrimp extract‐IgE test (0.70–0.75). Yet the best component test differed between populations; Pen m 1‐IgE test added diagnostic value only in the Thai cohort, whereas sensitizations to other components were better predictors of shrimp allergy in Hong Kong patients.
Conclusion
Pen m 14 was identified as a novel shrimp allergen predictive of challenge outcome. Molecular diagnosis better predicts shrimp allergy than conventional tests, but the relevant component is population dependent.
Keywords: allergen profiling, component‐resolved diagnosis, DBPCFC, shellfish allergy, tropomyosin
Glycogen phosphorylase (GP, Pen m 14) is identified as a new shrimp allergen. Troponin C (Pen m 6), fatty acid‐binding protein (Pen m 13) and Pen m 14 are major allergens apart from tropomyosin (Pen m 1) in shrimp allergic subjects from Hong Kong and Thailand. Molecular diagnostics better predicts shrimp allergy but relevant biomarker is population dependent.Abbreviations: AUC, area under curve; ELISA, enzyme‐linked immunosorbent assay; FABP, fatty acid‐binding protein; GP, glycogen phosphorylase; PSA, probably shrimp allergy; SPT, skin prick test; SDS‐PAGE, sodium dodecyl‐sulfate polyacrylamide gel electrophoresis; TM, tropomyosin; TnC, troponin C
Abbreviations
- AK
arginine kinase
- AUC
area under curve
- CRD
component‐resolved diagnosis
- DBPCFC
double‐blind placebo‐controlled food challenge
- FABP
fatty acid‐binding protein
- GP
glycogen phosphorylase
- Hc
haemocyanin
- HK
Hong Kong
- MLC
myosin light chain
- OD
optical density
- OFC
oral food challenge
- PBS
phosphate‐buffered saline
- PBS‐T
0.05% Tween‐20 in PBS
- PSA
probably shrimp allergy
- PWH
Prince of Wales Hospital
- ROC
receiver operating characteristic
- SCP
sarcoplasmic calcium‐binding protein
- sIgE
serum‐specific IgE
- SPT
skin prick test
- TIM
triosephosphate isomerase
- TM
tropomyosin
- TnC
troponin C
- WHO/IUIS
World Health Organization and International Union of Immunological Societies
1. INTRODUCTION
Shellfish is included among the ‘big eight’ food groups responsible for over 90% of all cases of food allergy. Among US adults, shellfish is the leading cause of food allergy affecting 2.9% of adults comparing with milk (1.9%) and peanut (1.8%). 1 Although shellfish allergy is more common in adults than in children, it affects 1.3% children in the US as compared with the estimated prevalence of peanut allergy ranged from 1.2% to 2.2%. 2 Shellfish allergy is highly prevalent in the Asia‐Pacific region where seafood consumption is high. For instance, epidemiological studies revealed prevalence of shellfish allergy at 5.1% in Guangzhou China, 3 5.2% in Singapore and 5.1% in the Philippines. 4 Shrimp is also the leading allergen source in Hong Kong (1.05%). 5 Among all shellfish, shrimp and crab are the major causes of anaphylaxis, while mollusk allergy is generally less prevalent globally.
Despite the undesirable dietary inconvenience and heavy healthcare burden, diagnosis and treatment options for shrimp allergy remain limited. One of the main challenges in managing patients with suspected shrimp allergy is to distinguish between concurrent allergy and asymptomatic sensitization. Our recent report clearly reveals that diagnosis based on clinical history and extract‐based serum‐specific IgE (sIgE) test was poor in differentiating shrimp allergy and tolerance in a cohort of double‐blind placebo‐controlled food challenge (DBPCFC) proven subjects. 6 While nasal allergen provocation test was also shown as a valuable test differentiating sensitized symptomatic shrimp allergic patients from sensitized tolerant subjects, 7 oral food challenges (OFCs) remain the gold standard in diagnosing shrimp allergy.
Molecular diagnosis using single allergens instead of whole food extracts to quantify sIgE levels were shown to more accurately reflect the clinical reactivity to circumvent the need of OFCs. 8 , 9 The relevant allergen components fit for diagnosis may, however, vary among different geographical locations depending on the dietary habits and disease prevalence. 10 Prior to this study, six shrimp proteins were registered with the World Health Organization and International Union of Immunological Societies (WHO/IUIS): tropomyosin (TM), arginine kinase (AK), myosin light chain (MLC), sarcoplasmic calcium‐binding protein (SCP), troponin C (TnC) and triosephosphate isomerase (TIM). For the black tiger shrimp, Penaeus monodon, one of the most widely farmed and consumed shrimps worldwide, five allergens were registered including Pen m 1 (TM), Pen m 2 (AK), Pen m 3 (MLC), Pen m 4 (SCP) and Pen m 6 (TnC). Several other shrimp proteins, such as fatty acid‐binding protein (FABP) and haemocyanin (Hc), have been reported as potential shrimp allergens despite being less characterized. 11 , 12 Among all registered allergens, TM is the major allergen of shrimp‐sensitized patients. However, we recently reported a sensitization rate to Pen m 1 at 53.3% as similarly reported in Thai (34.2%), Japanese (37%) and Italian (41%) shrimp‐allergic patients, thus challenging the diagnostic suitability of TM in these populations. 6 , 13 , 14 , 15 The clinical relevance of other shrimp allergens in populations with high prevalence of shrimp allergy is also lacking.
The full analysis and characterization of all potential shrimp allergens are eminent to meet the urgently needed component‐resolved diagnosis (CRD). The aim of this study was therefore to comprehend the allergen repertoire of shrimp using P. monodon as the model organism by first probing the IgE‐binding proteins with Western blotting followed by protein identification with mass spectrometry. Furthermore, using recombinant shrimp allergens and IgE binding assays by ELISA, we systematically examined and compared the sensitization pattern and diagnostic value of the identified shrimp components of shrimp‐allergic patients in Hong Kong and Thailand. Our study essentially provides a comprehensive panel of shrimp allergen and highlights the diagnostic potential of the relevant components appropriate for shrimp allergy management in different geographical populations.
2. MATERIALS AND METHODS
2.1. Recruitment of shrimp allergic patients
Eighty‐five subjects were recruited at the Prince of Wales Hospital (PWH), Queen Elizabeth Hospital, Queen Mary Hospital and Yan Chai Hospital in Hong Kong (HK, total = 69 subjects); and the Siriraj Hospital and Samitivej Allergy Institute in Bangkok, Thailand (16 subjects). The inclusion criterion was documented history of immediate allergic reactions within 2 h of shrimp consumption on at least two occasions over the past 5 years. Skin prick test (SPT) was performed over the patients' volar forearm with commercial shellfish extract (ALK‐Abelló, Madrid, Spain) together with histamine (10 mg/ml) and normal saline as positive and negative controls, respectively. For Thai subjects, SPT using in‐house P. monodon protein extracts prepared as described was also performed. 16 The results were read at 15 min; with wheal size measured and mean calculated. A positive sensitization was defined as wheal size ≥3 mm. Plasma was obtained from EDTA‐anticoagulated venous blood of patients for in vitro measurement of sIgE level by shrimp ImmunoCAP (Thermo Fisher Scientific, Uppsala, Sweden, f24) on Phadia 200 using the threshold of ≥0.35 kUA/L. Clotted blood samples were also collected for in‐house immunoassays. Selected patients recruited at PWH underwent DBPCFC (black tiger shrimp) according to the EuroPrevall protocol with slight modifications as described, 6 , 17 and all negative DBPCFCs were confirmed with open shrimp challenges. Blood samples were also collected from ten non‐atopic control subjects from Hong Kong. Participants and/or their parents gave written informed consent. Ethics approvals were obtained from Joint Chinese University of Hong Kong‐New Territories East Cluster Clinical Research Ethics Committee (2017.544 & 2018.484), Hong Kong or the Siriraj Institutional Review Board (SIRB; COA no. si188/2018), Thailand.
2.2. Preparation of shrimp protein extract for protein assays
Frozen black tiger shrimp (P. monodon) was purchased from local supermarkets. Peeled shrimp meat was manually homogenized in ice‐cold phosphate‐buffered saline (PBS) until a smooth paste was achieved. Protein was then extracted in PBS overnight at 4°C with constant stirring. The protein extract was centrifuged, and supernatant was filter‐sterilized through a 0.22 μm polyethersulfone membrane. The concentration of the shrimp protein extract was determined on the NanoDrop OneC spectrophotometer (Thermo Fisher Scientific, Wilmington, DE, USA). The shrimp protein extract was then stored at −20°C until use.
2.3. SDS‐PAGE and immunoblotting
15 μg of shrimp extract was resolved in a 10% SDS‐polyacrylamide gel according to their molecular weights using a Mini PROTEAN SDS‐PAGE system (Bio‐Rad, Hercules, CA, USA). Protein bands were stained with SimplyBlue SafeStain (Thermo Fisher Scientific, Carlsbad, CA, USA) and transferred to PVDF membranes (Bio‐Rad) with the Trans‐Blot Turbo (Bio‐Rad). Non‐specific binding of the membranes was blocked with 5% non‐fat dry milk in 0.05% Tween‐20 in Tris‐buffered saline (TBS‐T, blocking solution) for 1 h at room temperature. Patient sera diluted at 1:10 in blocking solution and HRP‐conjugated anti‐human IgE (Southern Biotech, Birmingham, AL, USA) diluted at 1:2000 in blocking solution were used for probing IgE‐binding proteins. IgE binding was detected by incubating the membranes with SuperSignal West Pico PLUS Chemiluminescent Substrate (Thermo Fisher Scientific), and the signal was acquired with the ChemiDoc MP Imaging System (Bio‐Rad). 18
2.4. Mass spectrometry analysis
The IgE‐reactive bands of shrimp extract were excised from the SimplyBlue SafeStain‐stained SDS‐PAGE gel, destained and digested with trypsin following our laboratory's routine protocol. 19 The tryptic digests were analyzed on the UltrafleXtreme MALDI‐ToF/ToF System (Bruker Daltonik, Bremen, Germany) for obtaining the peptide mass fingerprints. Searches against the entire protein sequence database (NCBI and UniProt) using the MASCOT search engine were then performed for protein identification.
2.5. Preparation of recombinant shrimp allergens
Protein sequences of P. monodon allergens were derived from the Uniprot database (Table S1) and reverse translated by MEGA 11.0. For glycogen phosphorylase (GP), total RNA was extracted from the muscle of P. monodon using the RNeasy mini kit (Qiagen, Valencia, CA, USA), and cDNA was prepared using the M‐MuLV reverse transcriptase (Genesys, Daly City, CA, USA). PCR was then performed to obtain cDNA of GP using specific primers designed based on the nucleotide sequence of GP from P. vannamei (GenBank accession number MK721970.1) and the HotStarTaq master mix kit (Qiagen). Amplified PCR products were subjected to sanger sequencing and the full length sequence of P. monodon GP was deposited on GenBank with accession number OM156460.
The nucleotide sequences encoding the full‐length shrimp allergens were then commercially synthesized and cloned into the His‐tag expression vector pET30(a) + except for haemocyanin (Hc) and GP. His‐tagged recombinant allergens were then expressed in Escherichia coli [BL21 (DE3) or Arctic expression (DE3)] by culturing in MagicMedia (Invitrogen, Carlsbad, CA, USA) following the routine protocol in our laboratory. 20 , 21 , 22 Allergens were then purified using the HisPur cobalt spin columns (Thermo Fisher Scientific, Rockford, IL, USA) as per manufacturer's instructions. For the high molecular weight allergens Hc and GP, target nucleotide sequences were inserted into baculovirus vectors and expressed in insect cells following standard protocol, 23 then purified with nickel affinity columns (Sino Biological, Beijing, China). The concentration and purity of purified recombinant allergens were determined using the NanoDrop OneC spectrophotometer and SDS‐PAGE, respectively. Protein identities of the allergens were confirmed by mass spectrometry as described above while the allergenicity of all the recombinant allergens were validated by basophil activation test with our described protocol. 6
2.6. Enzyme‐linked immunosorbent assay (ELISA)
Purified recombinant shrimp allergens diluted in coating buffer (100 mM Na2CO3, 100 mM NaHCO3, pH 9.6) were coated onto MaxiSorp microtiter plates (Nunc, Carlsbad, CA, USA) and incubated overnight at 4°C. After washing the plates with 0.05% Tween‐20/PBS (PBS‐T) and blocking the plates with 5% foetal bovine serum (Gibco, Thermo Fisher Scientific) diluted in PBS (blocking buffer) at room temperature for 2 h, serum samples diluted at 1:10 in blocking buffer were added for overnight incubation at 4°C. IgE binding was detected by incubating the plates with biotinylated anti‐human IgE antibodies (1:1000 dilution, Vector Labs, Burlingame, CA, USA), HRP avidin D (1:1000 dilution, Vector Labs) and TMB substrate (BD Biosciences, Franklin Lakes, NJ, USA). Upon terminating the reaction with 0.1 M sulfuric acid, the optical density (OD) at 450 nm was measured using a microplate reader (BioTek, Santa Clara, CA, USA). 21 Results were considered positive only at OD >2 fold ± SD over negative controls (sera of ten non‐atopic control subjects).
2.7. Statistical analysis
GraphPad Prism (version 8.0, GraphPad Software) was used for graphical presentation, heatmap building and statistical analyses. Quantitative variables were described by median, range and interquartile range, whereas qualitative variables were described by absolute frequencies and percentages. The Fisher exact test was used to compare frequencies of IgE reactivity between groups. Between‐group differences in sIgE levels towards different recombinant allergens were assessed using the nonparametric Kruskal–Wallis and Dunn's multiple comparison tests. The diagnostic potential of allergy tests was compared by the area‐under‐curve (AUC) value on receiver‐operating‐characteristic (ROC) curves. Statistical comparison of AUC values based on the DeLong's z score was performed with the web tool easyROC. 24 p < .05 was considered as statistical significance.
3. RESULTS
3.1. Patient characteristics
A total of 69 samples collected in HK and 16 collected in Thailand were used in this study. For the HK cohort, sera from 17 subjects who had positive DBPCFC outcome (HK‐Allergic), 20 who had negative DBPCFC outcome (HK‐Tolerant), and 32 subjects with probable shrimp allergy (HK‐PSA) as defined according to the EuroPrevall guideline (documented history of allergic reactions within 2 h of shrimp ingestion and sIgE level to shrimp ≥0.70 kUA/L) were included. In the Thai cohort, sera from 16 subjects with doctor‐diagnosed shrimp allergy were included. Demographics, rate of shrimp sensitization, SPT wheal size, sIgE levels, history of shrimp allergic reactions and DBPCFC outcomes are summarized in Table 1 (details in Tables S2, S3).
TABLE 1.
Demographic features of study participants
| Demographic Features | HK Allergic | HK Tolerant | HK PSA | Thailand |
|---|---|---|---|---|
| N | 17 | 20 | 32 | 16 |
| Gender: male, % (no.) | 64.7 (11) | 45.0 (9) | 62.5 (20) | 50.0 (8) |
| Age (y): median [range] | 24 [4–43] | 28.5 [7–48] | 12.5 [1–50] | 9.5 [1–39] |
| Other food allergies: % (no.) | 58.8 (10) | 30.0 (6) | 50.0 (16) | 50.0 (8) |
| Eczema: % (no.) | 70.6 (12) | 65.0 (13) | 46.9 (15) | 68.8 (11) |
| Asthma/Allergic Rhinitis: % (no.) | 64.7 (11) | 35.0 (7) | 25.0 (8) | 81.3 (13) |
| History of allergic symptoms | + | + | + | + |
| DBPCFC | + | − | ND | ND |
| SPT (shellfish mix) | ||||
| Wheal size (mm): median [range] | 5.5 [0–11] | 3 [0–4.5] | 5 [0–8] | 4.75 [0–10.5] |
| Sensitization rate: % (no.) | 93.8 (15/16) | 72.2 (13/18) | 78.6 (22/28) | 68.8 (11/16) |
| sIgE to shrimp extract | ||||
| Level (kUA/L): median [range] | 2.34 [0.24–34.6] | 1.71 [0.09–11.1] | 6.82 [0.76–>100] | 4.44 [<0.1–96.5] |
| Sensitization rate: % (no.) | 94.1 (16) | 65.0 (13) | 100 (32) | 81.3 (13) |
Note: Values are shown as percentages (number) or median [range]. “+”, positive; “–“, negative.
Abbreviation: PSA, probable shrimp allergy; DBPCFC, double‐blind placebo‐controlled food challenge; ND, not done; SPT, skin prick test; sIgE, specific IgE.
For the four groups of subjects, shellfish SPT wheal size significantly differed only between the HK‐Allergic and HK‐Tolerant subjects (Dunn's multiple comparison test, p = .0152). Significant difference in shrimp‐sIgE level was only detected between HK‐Tolerant and HK‐PSA subjects (p = .004). No between‐group difference could be detected for the rate of positive SPT, while the rate of shrimp‐sIgE sensitization differed significantly only between HK‐Allergic and HK‐Tolerant groups (Fisher exact test, p = .048).
3.2. IgE‐binding proteins of shrimp
Sera from HK‐Allergic and HK‐Tolerant subjects, as well as two non‐atopic control subjects were used to probe the IgE‐binding proteins in raw shrimp extract (Figure 1A) by immunoblotting. A total of 12 distinct IgE‐binding protein bands ranging from 17 to 130 kDa were probed using sera from HK‐Allergic subjects (Figure 1B), while only three distinct bands between 26 and 43 kDa were visualized from HK‐Tolerant subjects (Figure 1C). All protein bands were excised from the SDS‐PAGE for protein identity evaluation on mass spectrometry (Figure 2, Table S4). We identified 10 distinct proteins from these IgE‐reactive bands, with some proteins discovered in several different bands likely due to polymorphism and/or presence of isoforms. The identified IgE‐binding proteins included six known shrimp allergens, namely myosin heavy chain, haemocyanin (Hc), arginine kinase (AK, Pen m 2), tropomyosin (TM, Pen m 1), sarcoplasmic calcium‐binding protein (SCP, Pen m 4) and fatty acid‐binding protein (FABP). Importantly, four IgE‐binding proteins have not been reported as shrimp allergens, including 95 kDa protein glycogen phosphorylase (GP), 50 kDa protein enolase (Eno), 40 kDa protein aldolase (ALDA) and 20 kDa protein reticulon‐like protein. All IgE‐binding proteins except ALDA and AK were reactive to sera of HK‐Allergic subjects only; ALDA was only detected as IgE‐reactive in HK‐Tolerant subjects, while arginine kinase was reactive to sera from both HK‐Allergic and HK‐Tolerant subjects. As expected, sera from non‐atopic subjects did not have IgE reactivity with any shrimp protein.
FIGURE 1.
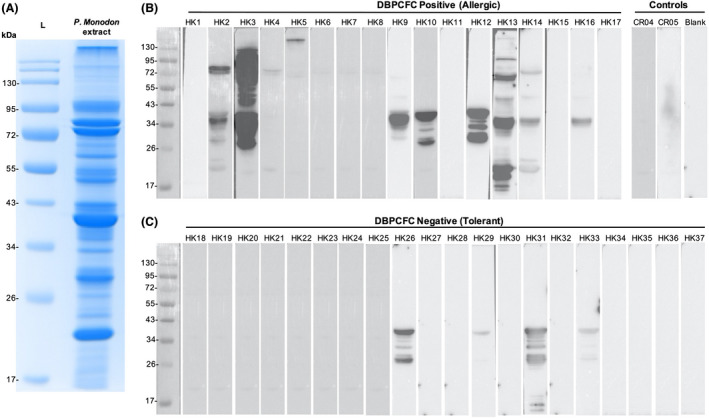
Identification of IgE‐binding proteins of P. monodon. (A) SDS‐PAGE image of the extracted shrimp protein. (B) Western blot images probing the IgE‐binding shrimp proteins using sera of shrimp allergic subjects proven with DBPCFC and non‐atopic controls. (C) Western blot images probing the IgE‐binding shrimp proteins using sera of shrimp tolerant subjects proven with DBPCFC
FIGURE 2.
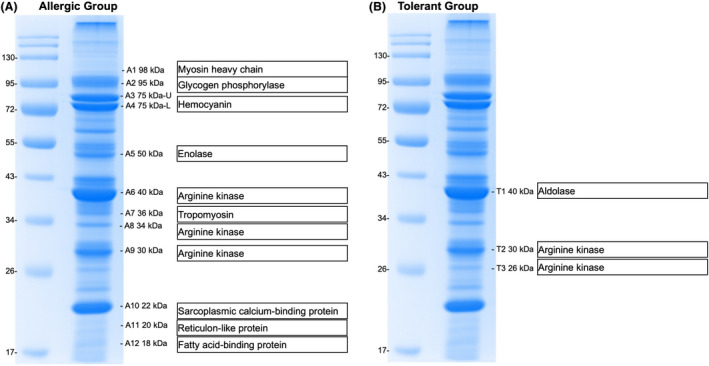
Identity of the IgE‐binding shrimp proteins identified by mass spectrometry. IgE‐binding proteins were identified using sera of (A) shrimp allergic and (B) tolerant subjects
3.3. Recombinant expression of shrimp allergens
To further our analysis with respect to sensitization pattern, all the identified shrimp allergens were expressed as recombinant proteins except myosin heavy chain and reticulon‐like protein that were reactive to only one subject in the HK cohort. Apart from shrimp allergens detected by Western blotting, other known shrimp allergens including myosin light chain (MLC, Pen m 3), troponin C (TnC, Pen m 6) and triosephosphate isomerase (TIM) were synthesized. All proteins except the high molecular weight proteins Hc and GP could be successfully prepared using the E. coli expression system with >90% purity as assessed on SDS‐PAGE (Figure S1). These two proteins were recombinantly produced using the insect cell expression system at a purity of >90%.
3.4. IgE recognition of recombinant shrimp allergens
Specific IgE reactivity of the recombinant shrimp allergens was demonstrated by immunoblotting using sera of HK‐Allergic subject and pooled sera of non‐atopic controls (n = 10; Figure S2). We then evaluated the sensitization pattern of all the 85 collected samples by ELISA with the highly purified recombinant shrimp allergens. For HK‐Allergic and HK‐PSA subjects, as well as shrimp allergic Thai subjects, sensitization to multiple allergens was common as shown on the heatmaps in Figure 3. Although a remarkable proportion of tolerant subjects had a positive shrimp sIgE level (13/20, 65%; Table 1), the frequency and intensity of IgE binding towards the shrimp allergen panel were lower in the HK‐Tolerant subjects (Figure 3B). Among the 13 HK‐Tolerant subjects with positive shrimp sIgE level, we only found eight subjects who displayed IgE reactivity towards at least one shrimp allergen of our panel with AK being the top sensitizer.
FIGURE 3.
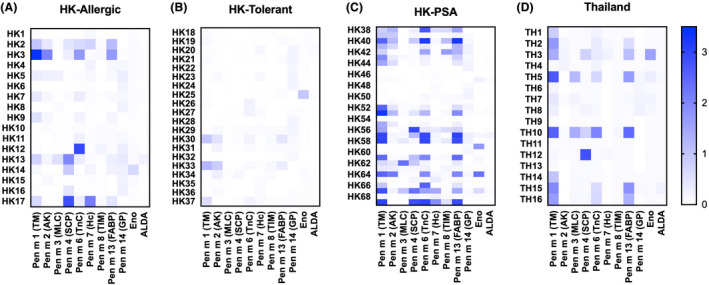
Heat maps of sensitization profile. Sensitization patterns to our define shrimp allergen panel of allergic and tolerant subjects proven with DBPCFC in HK, as well as of subjects with probable shrimp allergy (PSA) in HK and subjects with self‐reported shrimp allergy in Thailand were compared
The sensitization rates to our shrimp allergen panel are summarized in Figure 4 and Table S1. A positive sensitization was defined at OD >2 fold ± SD over negative controls. Fifteen HK‐Allergic subjects (88.2%) and 81.3% of subjects from HK‐PSA and Thai allergic groups were IgE reactive to at least one recombinant shrimp allergen. Among these allergens, the recognition frequency to MLC, Eno and ALDA remained low in all groups. For both HK‐PSA and Thai subjects, the major shrimp allergen was TM with sensitization rates >60%. TnC was another allergen showing >50% sensitization beyond TM in both cohorts of subjects, while FABP showed 59.4% sensitization among HK‐PSA subjects. Interestingly, for HK‐Allergic subjects confirmed by DBPCFC, the major allergens were TnC and GP (47.1%) rather than TM (41.2%). Based on our results, Hc, TIM, FABP and GP were registered as new P. monodon allergens with the WHO/IUIS as Pen m 7, Pen m 8, Pen m 13 and Pen m 14, respectively.
FIGURE 4.
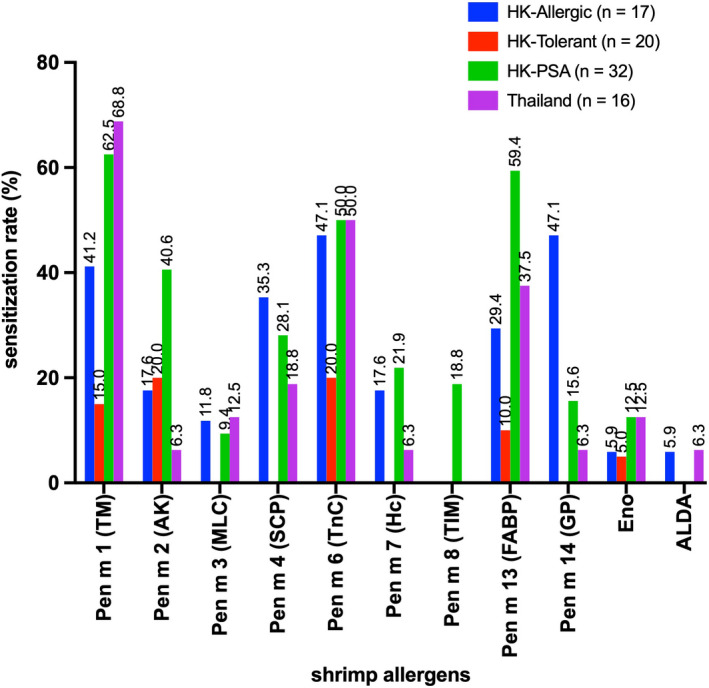
Sensitization rates to the defined shrimp allergen panel
While comparing between the HK‐Allergic and HK‐Tolerant groups, only SCP and GP differed significantly (p = .0053 and .0006, respectively), in terms of the recognition frequency, while SCP, TnC and FABP differed significantly by their strength of IgE recognition (p = .01 and .0092, respectively) (Figure 3, Table S1). Comparing between HK‐Tolerant subjects and allergic Thai subjects, TM, SCP, TnC and FABP differed significantly in OD 450 nm values, while only TM differed significantly in recognition frequency between these two groups.
3.5. Diagnostic potential of the shrimp allergen components
We evaluated the diagnostic potential of shrimp allergens with conventional allergy tests (i.e. SPT and sIgE determination based on shrimp extract) based on ROC curves generated by comparing the HK‐Allergic and PSA groups against HK‐Tolerant groups, as well as by comparing the Thai allergic group against HK‐Tolerant group. Only allergens with significant differences in recognition frequency or affinity were analyzed. For both populations, Pen m 14 (GP)‐sIgE had the lowest AUC probably due to the lower sensitization rates. Among HK subjects, component‐sIgE assays would generate higher AUCs than conventional test, by which Pen m 6 (TnC)‐sIgE test had the highest diagnostic potential with AUC of 0.78 (Figure 5A). On the contrary, Pen m 1 (TM) had the lowest diagnostic potential with AUC of 0.70, which was lower than that of SPT and shrimp‐sIgE. Whereas for shrimp allergic Thai subjects, Pen m 4 (SCP) offered the best diagnostic potential (AUC = 0.96), followed by Pen m 1 (AUC = 0.89) and Pen m 6 (AUC = 0.86) (Figure 5B). AUC value of Pen m 4‐sIgE test was also statistically higher than that of shrimp‐sIgE and SPT tests, with z scores of 2.61 (p = .0091) and 2.42 (p = .0151), respectively.
FIGURE 5.
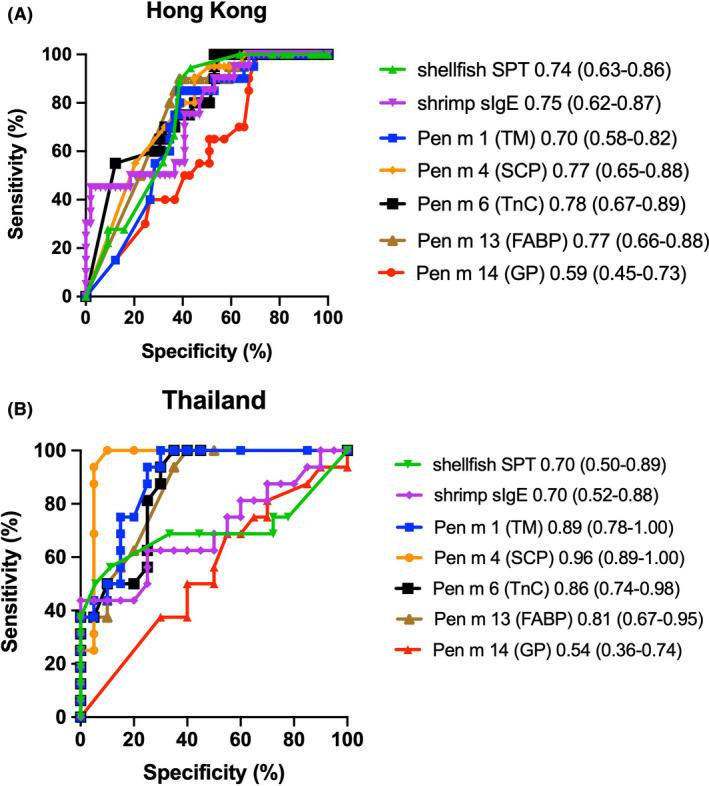
ROC curves plotting the proportion of allergic and tolerant subjects, The curves comparing (A) Hong Kong allergic and tolerant subjects and (B) Thailand allergic and Hong Kong tolerant subjects are illustrated
4. DISCUSSION
This study delineates the allergen repertoire of the highly consumed shrimp species P. monodon using a cohort of well‐characterized shrimp allergic subjects whose diagnosis was confirmed by DBPCFC. Based on our results, four new P. monodon allergens are now registered with WHO/IUIS. Previously identified allergens including Pen m 1 (TM) Pen m 4 (SCP), Pen m 6 (TnC) and Pen m 13 (FABP) are also potential molecular candidates in CRD as determined from shrimp allergic subjects from both Hong Kong and Thailand.
In this study, we detailed the profile of IgE‐binding proteins of shrimp, comprising 10 distinct proteins. Although Karnaneedi et al. recently reported up to 50 shrimp allergens with five unreported potential allergens including enolase 3–2 and aldolase A, the discovery was generated from transcriptomes and BLAST analyses against all known allergens without validations with immunological assays. 25 Our study is the first to report GP, Eno and ALDA as new crustacean allergens confirmed by both Western blotting and ELISA. In contrast to similar studies by Bauermeister et al. who identified MLC 1 (Cra c 5), TnC (Cra c 6) and TIM (Cra c 8) as allergens of the North Sea shrimp Crangon crangon, 26 these allergens could not be detected in our Western blot experiments. The deviation could be partly due to the low abundance of these proteins in the extract prepared from P. monodon using standard protein extraction methodology. Among the newly reported allergens, the heat‐labile Eno and ALDA had very low sensitization rates in both HK and Thai cohorts due to the usual practice of heat treatment prior to shrimp consumption. On the contrary, GP (Pen m 14) was the leading shrimp allergen among HK‐Allergic subjects. Despite its low IgE avidity (i.e. low OD450), sensitization to Pen m 14 differentiated shrimp allergic and tolerant subjects in HK and Pen m 14‐sIgE test was more predictive of shrimp allergy than Pen m 1(TM)‐sIgE test. It is noteworthy that sensitization rates to Pen m 14 were low among Thai subjects and HK subjects with self‐reported shrimp allergy. Pen m 14 might thus be a less dominant sensitizing allergen but IgE binding to this protein is associated with clinical manifestation. GP is crucial in carbohydrate metabolism in animals where it was predominantly expressed in brain and muscle, as shown in Litopenaeus vannamei. 27 Little is known about the role of GP in shrimp, which was reported to be involved in development and response to hormone stimulation and environmental stress. The molecular property of GP as a shrimp allergen and its sensitization pattern in other cohorts require further investigations.
In this study, we generated a comprehensive panel of 11 recombinant shrimp allergens and evaluated their IgE reactivity in shrimp allergic subjects. The strength of our current study is the inclusion of challenge‐proven shrimp allergic and tolerant subjects to characterize the sensitization profile in relation to clinical reactivity to shrimp. We also included subjects with history of shrimp allergy from both HK and Thailand to address the allergen specificity for molecular diagnosis of shrimp allergy in two different Asian populations. We noticed that 7/17 samples from challenge‐proven allergic subjects did not show IgE binding to any shrimp proteins in Western blotting while in ELISA, these samples showed positive IgE binding to recombinant Pen m 6 (TnC), Pen m 7 (Hc) and/or Pen m 14 (GP). Specially, two samples (HK7 and HK17) showed strong IgE binding to recombinant Pen m 1 and Pen m 13 as well. This deviation might be due to the difference in assay sensitivity between ELISA and Western blotting, and/or the lower abundance of these allergens in the natural shrimp extracts. In both populations, individuals with shrimp allergy are more diversified in IgE recognition than tolerant subjects. Comparatively, HK‐PSA subjects displayed a more intense and diverse IgE binding pattern than HK‐Allergic subjects. This could be attributed to a higher shrimp‐sIgE level in the HK‐PSA group (Table 1), but it should be noted that these patients were grouped based on positive sensitization and self‐reported history whom can be ‘truly’ allergic or tolerant to P. monodon upon challenge confirmation. More to note, ImmunoCAP ISAC consisting of three shrimp allergens (Pen m 1, Pen m 2 and Pen m 4) only had 44% detectability compared with shrimp sIgE, 28 whereas our recombinant allergen panel yielded a much higher detection rate of >80% that highlights the higher coverage of our reported allergen panel.
Tropomyosin (Pen m 1) is the leading IgE‐binding protein in both HK‐PSA group (62.5%) and Thai allergic group (68.8%), followed by Pen m 6 (TnC) and Pen m 13 (FABP). In contrast, we could not find any major allergen displaying >50% sensitization among shrimp allergic subjects confirmed by DBPCFC; only 41.2% of subjects were sIgE positive to Pen m 1, while the leading allergens are Pen m 6 and Pen m 14 (47.1% sensitization). A multi‐centre study from USA, Brazil and Spain reported that 82.8% of challenge‐proven shrimp allergic subjects were IgE‐positive to the recombinant TM Lit v 1, 29 while Gámez et al. detected 98% sensitization to rPen a 1 in shrimp allergic Spanish subjects. 30 The lower sensitization rate to TM especially among ‘true’ shrimp allergic subjects reported herein coincides with studies from Japan and Italy. Our results thus highlight that the major shrimp allergens could differ among populations, and TM is a common sensitizing allergen across populations but IgE binding to TM is associated with clinical manifestation of shrimp allergy only in selected cohorts. Our present analysis also illustrates that SCP, TnC, FABP and GP are clinically relevant shrimp allergens besides TM.
This study extends our understanding to the diagnostic potential of the shrimp allergens. In concordance to our previous report, 6 shellfish SPT and shrimp‐sIgE level are poor predictors of shrimp allergy with low AUC values and specificity. Significant proportion of tolerant subjects had positive shellfish SPT and shrimp sIgE, implying that IgE reactivity to whole allergen extracts has poor correlation with clinical reactions but indicates cross‐reacting allergens. Studies by Pascal et al. and Gamez et al. highlighted the role of AK as a cross‐reactive marker on top of the pan‐allergen TM. 29 , 31 Coherently, our shrimp tolerant subjects showed IgE reactivity to Pen m 1 (3/20), Pen m 2 (4/20) and Pen m 6 (4/20). It is therefore plausible that sensitization to AK could be a biomarker of cross‐reactivity rather than clinical reactivity.
Several studies suggest that component‐based sIgE analyses are better predictor for food allergies. For instance, tropomyosin‐sIgE yielded higher specificity (0.77), positive predictive value (PPV, 0.72) and negative predictive value (NPV, 0.91) than SPT and shrimp extract‐sIgE. 30 Pascal et al, on the contrary, reported that sensitization to SCP was superior to shrimp extract in predicting shrimp allergy (AUC 0.641 versus to 0.616) despite its low sensitization rate (29.3%–34.5%). 29 Although we did not determine the sensitivity, specificity, PPV and NPV of the component tests, our data are concordant to previous reports that component‐based diagnostics are more predictive than shrimp extract‐sIgE tests based on AUC values except Pen m 14‐sIgE assay due to the lower recognition frequency to this novel allergen. Our results also illustrate that Pen m 4‐sIgE test was the second‐best diagnostics in HK (AUC 0.77) and the best diagnostics in Thai subjects (AUC 0.96). Interestingly, our analysis shows that Pen m 1‐sIgE test was the weakest diagnostic test in HK (AUC 0.70) among all the known biomarkers, but it was the second‐best diagnostics among Thai subjects (AUC 0.89). We are aware that the Thai patients were characterized as doctor‐diagnosed shrimp allergy and comparison was made with tolerant subjects from HK that the ROC curve analysis could be biased. But taken together the results from similar studies, Pen m 1 sensitization only adds diagnostic accuracy in selected populations. Other allergic components such as Pen m 4, Pen m 6 and Pen m 13 might offer better predictive power at AUCs at 0.77–0.78 in populations with low TM sensitization. Incorporating these component tests as a second‐step test following SPT in the diagnostic workflow might improve the diagnostic accuracy for shrimp allergy.
Our current study is limited by small sample size, but our data emphasize that the optimal allergenic components for shrimp allergy diagnosis differ among different populations due to presumably differences in genetic backgrounds, environmental exposures and dietary preferences. Screening for the relevant components would therefore be essential with the aim of precision diagnosis of shrimp allergy. Another limitation is the lack of challenge‐proven shrimp allergy in Thai subjects. We compared doctor‐diagnosed shrimp allergy in Thailand and challenge‐proven shrimp tolerant subjects in HK, which might result in differences in AUCs. In addition, this study has not investigated the performances of different allergen component tests such as their sensitivity, specificity, PPV and NPV as there was no agreed standard/optimal decision point for ELISA. Each allergen might also display different IgE binding kinetics in ELISA that leads to signal visualization bias, thus limiting accurate cross‐comparison of absorbance signals among different allergens. Our findings need to be replicated in larger cohorts of challenge‐proven shrimp allergic and tolerant subjects from other countries and latitudes, on different immunological platforms, and evaluate the effects on possibility of allergy among shrimp species (e.g. between seawater and freshwater shrimps).
In summary, this study expands the allergen profile of shrimp with the identification of GP (Pen m 14) as a novel shrimp allergen. We provide strong evidence on clinically relevant components in shrimp allergy such as SCP, TnC, FABP and GP that sensitization to these allergens is associated with positive shrimp DBPCFC and are relevant biomarkers for shrimp allergy diagnosis. We also illustrated that TM is not the major allergen in DBPCFC‐proven shrimp allergic subjects that only provides added diagnostic value in selected populations. Overall, this study shows that component‐based approach enhances the diagnostic resolution for shrimp allergy in independent Asian populations.
AUTHOR CONTRIBUTIONS
CYYW, NYHL and TFL conceptualized this study. CYYW, NYHL, SMN, SP, SSL and KJYX performed laboratory assays and contributing to data analysis. ASYL, PP, JSDRD, MYWK, OJ, WHC, GTC, QUL, PKH, JSCW and TFL contributed to subject recruitment and sample collection. CYYW and NYHL involved in writing the original draft; SMN, OJ, GWKW, KHC, PSCL, PV and TFL involved in funding acquisition and work supervision. All the authors have read and approved the manuscript.
CONFLICT OF INTEREST
All authors declared no competing interest exist.
Supporting information
Figure S1‐S3
Table S1‐S4
ACKNOWLEDGMENTS
We are grateful to Dr. Ivan CS Lam for supporting subject recruitment and Miss Helen Tsai for her technical support. We thank all subjects and their parents for participation, and Yuki Shum, Chloris Leung, Ann Au, Nicole Li, Maco Lam, Cecily Leung, Annerliza Kwok, Nancy Cheng, Suk Tak Lee and Rain Cheng for supporting DBPCFCs.
Wai CYY, Leung NYH, Leung ASY, et al. Comprehending the allergen repertoire of shrimp for precision molecular diagnosis of shrimp allergy. Allergy. 2022;77:3041‐3051. doi: 10.1111/all.15370
Co‐first authors: CYY Wai and NYH Leung contributed equally to this paper.
Funding information
CYY Wai was supported by an AXA Postdoctoral Fellowship. This project was fully funded by Health and Medical Research Fund (06170856 and 08191436); Research Impact Fund (R4035‐19) of Research Grants Council (RGC), Hong Kong SAR Government; Faculty of Medicine Siriraj Hospital, Mahidol University, Grant Number (IO) R016431038; and RGC‐AoE Center for Genomic Studies on Plant‐Environment Interaction for Sustainable Agriculture and Food Security (AoE/M‐403/16).
Contributor Information
Pakit Vichyanond, Email: pakitv@gmail.com.
Ting Fan Leung, Email: tfleung@cuhk.edu.hk.
REFERENCES
- 1. Gupta RS, Warren CM, Smith BM, et al. Prevalence and severity of food allergies among US adults. JAMA Netw Open. 2019;2(1):e185630. [DOI] [PMC free article] [PubMed] [Google Scholar]
- 2. Wang HT, Warren CM, Gupta RS, Davis CM. Prevalence and characteristics of shellfish allergy in the pediatric population of the United States. J Allergy Clin Immunol Pract. 2020;8(4):1359‐1370. [DOI] [PMC free article] [PubMed] [Google Scholar]
- 3. Li J, Ogorodova LM, Mahesh PA, et al. Comparative study of food allergies in children from China, India, and Russia: the EuroPrevall‐INCO surveys. J Allergy Clin Immunol Pract. 2020;8(4):1349‐1358. [DOI] [PubMed] [Google Scholar]
- 4. Shek LP, Cabrera‐Morales EA, Soh SE, et al. A population‐based questionnaire survey on the prevalence of peanut, tree nut, and shellfish allergy in 2 Asian populations. J Allergy Clin Immunol. 2010;126(2):324‐331. [DOI] [PubMed] [Google Scholar]
- 5. Leung TF, Yung E, Wong YS, Lam CW, Wong GW. Parent‐reported adverse food reactions in Hong Kong Chinese pre‐schoolers: epidemiology, clinical spectrum and risk factors. Pediatr Allergy Immunol. 2009;20(4):339‐346. [DOI] [PubMed] [Google Scholar]
- 6. Wai CYY, Leung NYH, Leung ASY, et al. Cell‐based functional IgE assays are superior to conventional allergy tests for shrimp allergy diagnosis. J Allergy Clin Immunol Pract. 2021;9(1):236‐244. [DOI] [PubMed] [Google Scholar]
- 7. Gelis S, Rueda M, Pascal M, et al. Usefulness of the allergen specific nasal provocation test in the diagnosis of shellfish allergy. J Investig Allergol Clin Immunol. 2021. doi: 10.18176/jiaci.0736 [DOI] [PubMed] [Google Scholar]
- 8. Masthoff LJ, Mattsson L, Zuidmeer‐Jongejan L, et al. Sensitization to Cor a 9 and Cor a 14 is highly specific for a hazelnut allergy with objective symptoms in Dutch children and adults. J Allergy Clin Immunol. 2013;132(2):393‐399. [DOI] [PubMed] [Google Scholar]
- 9. Nicolaou N, Poorafshar M, Murray C, et al. Allergy or tolerance in children sensitized to peanut: prevalence and differentiation using component‐resolved diagnostics. J Allergy Clin Immunol. 2010;125(1):191‐197. [DOI] [PubMed] [Google Scholar]
- 10. Suratannon N, Ngamphaiboon J, Wongpiyabovorn J, Puripokai P, Chatchatee P. Component‐resolved diagnostics for the evaluation of peanut allergy in a low‐prevalence area. Pediatr Allergy Immunol. 2013;24(7):665‐670. [DOI] [PubMed] [Google Scholar]
- 11. Wai CYY, Leung NYH, Chu KH, et al. Overcoming shellfish allergy: how far have we come? Int J Mol Sci. 2020;21(6):2234. [DOI] [PMC free article] [PubMed] [Google Scholar]
- 12. Ruethers T, Taki AC, Johnston EB, et al. Seafood allergy: a comprehensive review of fish and shellfish allergens. Mol Immunol. 2018;100:28‐57. [DOI] [PubMed] [Google Scholar]
- 13. Thalayasingam M, Gerez IF, Yap GC, et al. Clinical and immunochemical profiles of food challenge proven or anaphylactic shrimp allergy in tropical Singapore. Clin Exp Allergy. 2015;45(3):687‐697. [DOI] [PubMed] [Google Scholar]
- 14. Tsedendorj O, Chinuki Y, Ueda K, Kohno K, Adachi A, Morita E. Tropomyosin is a minor but distinct allergen in patients with shrimp allergies in Japan. J Cutan Immunol all. 2018;1(3):100‐108. [Google Scholar]
- 15. Asero R, Mistrello G, Amato S, et al. Shrimp allergy in Italian adults: a multicenter study showing a high prevalence of sensitivity to novel high molecular weight allergens. Int Arch Allergy Immunol. 2012;157(1):3‐10. [DOI] [PubMed] [Google Scholar]
- 16. Pariyaprasert W, Piboonpocanun S, Jirapongsananuruk O, Visitsunthorn N. Stability and potency of raw and boiled shrimp extracts for skin prick test. Asian Pac J Allergy Immunol. 2015;33(2):136‐142. [DOI] [PubMed] [Google Scholar]
- 17. Wong GW, Mahesh PA, Ogorodova L, et al. The EuroPrevall‐INCO surveys on the prevalence of food allergies in children from China, India and Russia: the study methodology. Allergy. 2010;65(3):385‐390. [DOI] [PubMed] [Google Scholar]
- 18. Leung NYH, Leung ASY, Xu KJY, et al. Molecular and immunological characterization of grass carp (Ctenopharyngodon idella) parvalbumin Cten i 1: a major fish allergen in Hong Kong. Pediatr Allergy Immunol. 2020;31(7):792‐804. [DOI] [PubMed] [Google Scholar]
- 19. Wang YD, Wang X, Ngai SM, Wong YS. Comparative proteomics analysis of selenium responses in selenium‐enriched rice grains. J Proteome Res. 2013;12(2):808‐820. [DOI] [PubMed] [Google Scholar]
- 20. Leung NYH, Wai CYY, Shu SA, Chang CC, Chu KH, Leung PSC. Low‐dose allergen‐specific immunotherapy induces tolerance in a murine model of shrimp allergy. Int Arch Allergy Immunol. 2017;174(2):86‐96. [DOI] [PubMed] [Google Scholar]
- 21. Wai CYY, Leung NYH, Ho MH, et al. Immunization with hypoallergens of shrimp allergen tropomyosin inhibits shrimp tropomyosin specific IgE reactivity. PLoS One. 2014;9(11):e111649. [DOI] [PMC free article] [PubMed] [Google Scholar]
- 22. Leung PSC, Chu KH, Chow WK, et al. Cloning, expression, and primary structure of Metapenaeus ensis tropomyosin, the major heat‐stable shrimp allergen. J Allergy Clin Immunol. 1994;94(5):882‐890. [DOI] [PubMed] [Google Scholar]
- 23. Jarvis DL. Chapter 14 Baculovirus–insect cell expression systems. Method Enzymol. 2009;463:191‐222. [DOI] [PubMed] [Google Scholar]
- 24. Goksuluk D, Korkmaz S, Zararsiz G, Karaagaoglu AE. easyROC: an interactive web‐tool for ROC curve analysis using R language environment. R Journal. 2016;8(2):213‐230. [Google Scholar]
- 25. Karnaneedi S, Huerlimann R, Johnston EB, et al. Novel allergen discovery through comprehensive De novo transcriptomic analyses of five shrimp species. Int J Mol Sci. 2021;22(1):32. [DOI] [PMC free article] [PubMed] [Google Scholar]
- 26. Bauermeister K, Wangorsch A, Garoffo LP, et al. Generation of a comprehensive panel of crustacean allergens from the North Sea shrimp Crangon crangon. Mol Immunol. 2011;48(15–16):1983‐1992. [DOI] [PubMed] [Google Scholar]
- 27. Zhang YS, Li FX, Yao CL. Glycogen phosphorylase of shrimp (Litopenaeus vannamei): structure, expression and anti‐WSSV function. Fish Shellfish Immunol. 2019;91:275‐283. [DOI] [PubMed] [Google Scholar]
- 28. Ukleja‐Sokolowska N, Gawronska‐Ukleja E, Lis K, Zbikowska‐Gotz M, Bartuzi Z. Analysis of the allergen profile of patients sensitized to shrimp based on ImmunoCAP immune solid‐phase allergen chip results. Ann Allergy Asthma Immunol. 2020;125(3):355‐357. [DOI] [PubMed] [Google Scholar]
- 29. Pascal M, Grishina G, Yang AC, et al. Molecular diagnosis of shrimp allergy: efficiency of several allergens to predict clinical reactivity. J Allergy Clin Immunol Pract. 2015;3(4):521‐529 e510. [DOI] [PubMed] [Google Scholar]
- 30. Gamez C, Sanchez‐Garcia S, Ibanez MD, et al. Tropomyosin IgE‐positive results are a good predictor of shrimp allergy. Allergy. 2011;66(10):1375‐1383. [DOI] [PubMed] [Google Scholar]
- 31. Gamez C, Zafra M, Boquete M, et al. New shrimp IgE‐binding proteins involved in mite‐seafood cross‐reactivity. Mol Nutr Food Res. 2014;58(9):1915‐1925. [DOI] [PubMed] [Google Scholar]
Associated Data
This section collects any data citations, data availability statements, or supplementary materials included in this article.
Supplementary Materials
Figure S1‐S3
Table S1‐S4