

Abstract
Introduction
Measurement of physical activity (PA) using commercial activity trackers such as Fitbit devices has become increasingly popular, also for people with haemophilia (PWH). The accuracy of the Fitbit model Charge 3 has not yet been examined.
Aims
To compare the Fitbit Charge 3 against the research‐grade accelerometer ActiGraph GT3X‐BT in measuring average daily steps and minutes spent in different PA intensities.
Methods
Twenty‐four young PWH wore a wrist‐worn Fitbit Charge 3 and hip‐worn ActiGraph GT3X‐BT simultaneously for seven consecutive days in free‐living conditions. Correlation of and differences between the devices for daily averages of PA parameters were assessed using Pearson's correlation coefficient and paired t‐test, respectively. Agreement between devices was assessed using Bland‐Altman plots.
Results
Twenty participants (mean age 21.8) were included in the analyses. We found moderate to high correlations between Fitbit and ActiGraph measured daily averages for all PA variables, but statistically significant differences between devices for all variables except daily minutes of moderate PA. Fitbit overestimated average daily steps, minutes of light, vigorous and moderate‐to‐vigorous PA. Bland‐Altman plots showed a measurement bias between devices for all parameters with increasing overestimation by the Fitbit for higher volumes of PA.
Conclusion
The Fitbit Charge 3 overestimated steps and minutes of light, moderate and moderate‐to‐vigorous PA as compared to the ActiGraph GT3X‐BT, and this bias increased with PA volume. The Fitbit should therefore be used with caution in research, and we advise users of the device to be cognizant of this overestimation.
Keywords: ActiGraph, agreement, comparison, Fitbit, haemophilia, physical activity
1. INTRODUCTION
Physical activity (PA) has numerous health benefits, and may improve joint‐, bone‐, and muscle health for people with haemophilia (PWH). 1 People of all ages, including PWH, are recommended to engage in regular and adequate levels of PA. 2 , 3 PA can be measured using monitors able to quantify the duration, frequency and intensity of PA. 4 Research‐grade activity monitors such as ActiGraph accelerometers are developed for and evaluated in research studies, and the triaxial GT3X model is considered one of the most accurate and widely‐used research‐grade instruments used to assess free‐living PA. 5 , 6 , 7 ActiGraph estimated PA energy expenditure shows moderate correlation with doubly labelled water 8 and strong correlation with indirect calorimetry. 9 Recently, consumer‐grade activity monitors have become popular amongst both researchers and general consumers. Those devices are commercially available in electronic stores, primarily designed for use by individuals to track PA and less evaluated in research. 4 Fitbit is one of the world's largest and most popular wearable device companies 10 and their activity trackers are among the most frequently utilised consumer‐grade devices in PA research. 11 The Charge 3 model was one of Fitbit's most recent products when this study was conducted. Lately, Fitbit devices have been used in published research involving PWH. 12 , 13 , 14 , 15 , 16 These devices are also being utilised in ongoing studies in the haemophilia population, among others to measure PA endpoints in interventional studies. It is therefore necessary to evaluate the accuracy of these monitors in measuring the PA of PWH.
The validity of various Fitbit models has been investigated both in laboratory and free‐living settings, including healthy participants as well as people with various chronic diseases and with mobility limitations, 10 , 17 , 18 , 19 but not PWH. Previous validation study results are not necessarily generalisable to PWH since their PA behaviour may differ from other populations. Validation studies performed in free‐living conditions show results ranging from acceptable to various degrees of overestimation for steps count and time spent in higher intensity PA as compared to direct observation/manual step counting and/or reference devices (e.g., pedometers and research‐grade accelerometers). 10 , 17 , 18 Previous Fitbit models have been compared to ActiGraph accelerometers specifically, 7 , 20 , 21 , 22 , 23 , 24 , 25 , 26 , 27 , 28 , 29 , 30 , 31 , 32 , 33 , 34 , 35 but to the best of our knowledge, there has not yet been performed such an evaluation of the Fitbit Charge 3′s accuracy. Therefore, the aim of this study was to examine the validity of the wrist‐worn Fitbit Charge 3 against the hip‐worn ActiGraph GT3X‐BT in measuring average daily steps and the time spent in light‐ (LPA), moderate‐ (MPA), vigorous‐ (VPA), and moderate to vigorous‐intensity (MVPA) PA over a 7‐day period.
2. MATERIALS AND METHODS
2.1. Participant recruitment
Data were collected as part of a larger study investigating PA levels in teenagers and young adults with haemophilia A residing in Norway, the “HemFitBit study” (ClinicalTrials.gov NCT04181697). Ethical approval for the study was obtained from the Regional Committee for Medical and Health Research Ethics South East and the Oslo University Hospital Data protection officer. All participants (and/or their guardians) provided written informed consent prior to participation in the study. Data were collected between December 2019 and March 2020. Haemophilia A is a bleeding disorder characterised by an X‐linked genetic deficiency in coagulation factor VIII, thus mainly affecting males. 36 This is why solely males were included in the study. All participants had either moderate or severe haemophilia and were receiving continuous prophylaxis, that is, regular injections of the missing/deficient coagulation factor. For the current validation study, 24 participants were convenience sampled from the main study. The target number of 24 participants was based on previous comparison studies in the field, 37 , 38 , 39 time frame and logistics. Based on their time for inclusion corresponding with the start of this validation sub‐study, the first 24 participants (out of 40 in total) were included.
2.2. Procedures
Each participant wore an ActiGraph GT3X‐BT (ActiGraph LLC, Pensacola, FL, USA) accelerometer over the right hip bone with an elastic belt and a Fitbit Charge 3 (Fitbit Inc, San Francisco, CA, USA) on the non‐dominant wrist simultaneously for seven consecutive days in free‐living conditions. Participants visited our centre once for inclusion in the study. Proper use of the devices was demonstrated and instruction sheets including photos depicting correct placement were provided.
2.3. Devices, settings and output
2.3.1. ActiGraph
The ActiGraph GT3X is a hip‐worn accelerometer measuring PA based on motion sensors across three axes. Raw data is called activity counts, which is a summary metric quantifying of the magnitude of acceleration the monitor is exposed to. The device provides data on energy expenditure, steps taken, and activity/sedentary bouts via publicly available validated algorithms. ActiGraphs were initialized to a sampling rate of 30 Hertz. Start time was set to 06:00 AM on day one and stop time to 11:59 PM on day 7. ActiLife software (ActiGraph, LLC, Pensacola, Florida, USA) was used to download and inspect raw data and for subsequent data processing including data reduction in KineSoft analytical software version 3.3.80 (KineSoft, Loughborough, UK). Activity counts per minute were translated into sedentary time and minutes in LPA, MPA and VPA based on the cut‐offs by Troiano et al. 40 Data were extracted in 10 s epochs. This was chosen because short epoch lengths are recommended to capture sporadic short burst of PA. However, an epoch length of one second generates a lot of “noise”/disturbance, whilst a 60 s epoch is too imprecise. 41 Number of axes was set to one (the vertical/y‐axis on the accelerometer). Non‐wear periods were defined as continuous 0‐registrations lasting at least 60 min (with 2 min of counts > 0 allowed), and such periods were excluded from the analyses. A valid ActiGraph day was defined as ≥600 min wear time.
2.3.2. Fitbit
The Fitbit Charge 3 is a wrist‐worn consumer‐grade activity tracker featuring heartrate monitoring and tracking of steps, distance, calories burned, floors climbed, active minutes and sleep duration. Thresholds for Fitbit PA intensity categories are based on METs (metabolic equivalent of tasks), which is an absolute rate of energy expenditure described as a multiple of resting energy expenditure. 4 The device does not store raw data on acceleration and the algorithm from which steps and intensity categories is calculated is unknown outside the Fitbit Company. Fitbit study accounts were created for each participant and connected to the research platform “Fitabase” (Small Steps Lab, San Diego, CA, USA) from where data were accessed and downloaded. A valid Fitbit day was defined as a day with > 1000 steps. 12
2.3.3. Covariates
Participant information was collected on age, haemophilia severity, body weight, height and Haemophilia Joint Health Score (HJHS) 42 (measured/tested at study visit). Body mass index (BMI) was calculated by dividing body weight in kilograms (kg) by height in meters (m) squared (BMI = kg/m2).
2.4. Statistical analyses
Statistical analyses were conducted using STATA version 16.0 (StataCorp LLC, College Station, TX, USA). For each participant, we extracted the valid days when both devices were worn simultaneously. Participants with ≥4 valid ActiGraph days and corresponding valid Fitbit days were included in the analyses. A p‐value of < .05 was considered statistically significant. Data were approximately normally distributed. Descriptive statistics are presented as means with standard deviations (SDs) for continuous data and numbers with percentages for categorical variables. One overall daily average for each PA parameter (steps and minutes in LPA, MPA, VPA, and MVPA) was computed for each participant. Measurements of sedentary time was not compared between the devices as we could not distinguish between sedentary time and sleep. We compared the correlation of each continuous outcome between the devices using Pearson's correlation coefficient. The interpretation of the strength of the coefficients was defined as weak (r < .4), moderate (r = .40–.69), strong (r = .70–.89) and excellent (≥.9). 43 Differences between the devices were tested using paired t‐tests for each of the outcomes. Agreement between devices was assessed using Bland‐Altman plots including 95% limits of agreement (LoA [±1.96 SD]). The Bland‐Altman plot allows to identify proportional bias, 44 and whether the difference between measurements of PA variables for the two devices are equal throughout the range of measurements. All data points would lie at a horizontal line at zero if there was complete agreement of measurements between devices. We used linear regression models to test whether the slope of the Bland‐Altman regression was significantly different from zero. We used mean absolute percentage error (MAPE) to assess the mean bias of Fitbit measurements with reference to ActiGraph, calculated via the following formula: (mean difference/ActiGraph mean)*100. We also investigated agreement between ActiGraph and Fitbit regarding the proportion of teenagers and adults meeting weekly MVPA recommendations (defined as ≥420 and ≥150 min, respectively).
3. RESULTS
Twenty‐four male PWH were invited to participate and all accepted the invitation. A 7‐day measurement period for each of the 24 participants generated data on PA measured by ActiGraph and Fitbit simultaneously for a total of 163 days (two accelerometers malfunctioned and only contributed to three and six measurement days, respectively). There were 30/163 (18.4%) non‐valid ActiGraph days (defined as < 600 min wear time/day) and 7/163 (4.3%) non‐valid Fitbit days (defined as ≤1000 steps/day). Two non‐valid Fitbit days remained after non‐valid ActiGraph days were removed. Four participants were excluded from the analyses due to having < 4 valid ActiGraph days (8 days removed) (Figure 1). Thus, a total of 20 participants (83.3% of 24) and 123 matched days (75.5% of 163) were included in the analysis. Participants consisted of 8 teenagers (aged 13–17) and 12 adults (aged 18–30) with an overall mean age of 21.8 (SD 6.6) years and BMI 24.3 (SD 5.1). Almost all (n = 19) had severe haemophilia and the mean HJHS score was low (Table 1).
FIGURE 1.
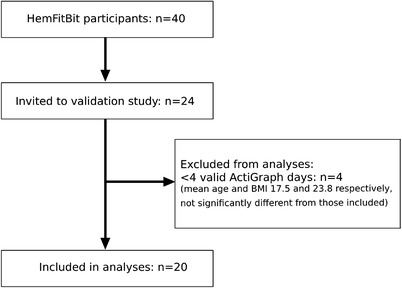
Participant flow chart
TABLE 1.
Participant characteristics
| Mean (SD) | |
|---|---|
| Age | 21.8 (6.6) |
| Teenagers | 14.3 (1.5) |
| Adults | 26.8 (2.5) |
| Body mass index | 24.3 (5.1) |
| Teenagers | 19.8 (2.5) |
| Adults | 27.4 (4.0) |
| HJHS 2.1 score | 7.0 (6.7) |
| Teenagers | 2.5 (2.8) |
| Adults | 9.9 (7.0) |
| Haemophilia A severity | Number (%) |
| Moderate (Factor VIII level 1%–5%) | 1 (5) |
| Severe (Factor VIII level < 1%) | 19 (95) |
Note: All participants included in the analyses n = 20. Teenagers (age 13–17) n = 8, adults (age 18–30) n = 12. HJHS = Haemophilia Joint Health Score. Score min ‐ max = 0–124. Low scores equal little joint damage and mobility limitations. SD, standard deviation.
3.1. Physical activity levels
Daily averages of steps and minutes in the various intensity categories for both devices are presented in Table 2. Most of the PA was performed in low intensity.
TABLE 2.
Mean daily steps and PA intensity category minutes for ActiGraph and Fitbit with correlations and mean differences between devices
| Mean (SD) ActiGraph | Mean (SD) Fitbit | r | p‐Value corr | Mean diff | MAPE | p‐Value (95% CI) | |
|---|---|---|---|---|---|---|---|
| Steps/day all | 8012 (2572) | 11400 (3817) | .908 | <.001 | − 3,388 | 42% | <.001 (−4246 to −2529) |
| Teenagers | 9007 (3558) | 12116 (5036) | |||||
| Adults | 7349 (1476) | 10924 (2899) | |||||
| LPA/day all | 167.8 (48.1) | 244.61 (62.5) | .760 | <.001 | −76.7 | 45% | <.001 (−95.8 to −57.8) |
| Teenagers | 177.6 (48.4) | 232.1 (50.5) | |||||
| Adults | 161.3 (48.8) | 253.0 (70.2) | |||||
| MPA/day all | 49.3 (19.0) | 39.0 (29.2) | .543 | .013 | 10.2 | 21% | .080 (−1.3 to 21.8) |
| Teenagers | 56.8 (23.4) | 36.9 (23.4) | |||||
| Adults | 44.2 (14.4) | 40.5 (33.4) | |||||
| VPA/day all | 5.3 (7.7) | 33.4 (17.5) | .657 | .002 | −28.1 | 530% | <.001 (−34.6 to −21.7) |
| Teenagers | 8.2 (10.0) | 35.2 (18.8) | |||||
| Adults | 3.4 (5.3) | 32.2 (17.4) | |||||
| MVPA/day all | 54.6 (23.4) | 72.5 (43.6) | .679 | .001 | −17.9 | 32% | .024 (−33.2 to −2.6) |
| Teenagers | 65.0 (28.9) | 72.1 (38.2) | |||||
| Adults | 47.6 (16.9) | 72.7 (48.6) |
Note: Difference between ActiGraph and Fitbit tested via paired t‐test. Positive values indicate an underestimation by the Fitbit as compared to ActiGraph, and negative values indicate an overestimation. Due to small numbers, we did not test for differences between devices stratified for adults and teenagers. Because PA recommendations differ for teenagers and adults, we present the descriptive results stratified for both groups. MAPE (mean bias of Fitbit measurements with reference to ActiGraph) calculated in percentage via the following formula: (mean difference/ActiGraph mean) * 100 = mean absolute percentage error. Exemplified for steps this equals: (3388/8012) * 100 = 42.
Abbreviations: CI, confidence Interval; corr, correlation; diff, difference; LPA, light intensity physical activity; MAPE, mean absolute percentage error; MPA, moderate intensity physical activity; MVPA, moderate and vigorous intensity physical activity; r, Pearson's r; SD, standard deviation; VPA, vigorous intensity physical activity.
3.2. Comparison of devices
The correlations between devices of daily averages were r = .91 for steps, .76 for minutes of LPA, .54 for MPA, .66 for VPA and .68 for MVPA (Table 2 and Figure 2).
FIGURE 2.

Correlations of daily means for PA variables between ActiGraph and Fitbit with inserted regression lines. (A) Steps, (B) LPA, (C) MPA, (D) VPA, (E) MVPA. LPA, low intensity physical activity; MPA, moderate intensity physical activity; MVPA, moderate and vigorous intensity physical activity; VPA, vigorous intensity physical activity
There were statistically significant differences between ActiGraph and Fitbit for all measured PA variables except mean daily MPA (Table 2). Bland‐Altman plots showed a measurement bias between devices for all parameters with wide LoA and an increasing overestimation by the Fitbit with higher volumes of PA (Figure 3).
FIGURE 3.

Bland‐Altman plots illustrating level of agreement between ActiGraph and Fitbit. (A) Steps, (B) LPA, (C) MPA, (D) VPA, (E) MVPA. LPA, low intensity physical activity; MPA, moderate intensity physical activity; MVPA, moderate and vigorous intensity physical activity; VPA, vigorous intensity physical activity. Legend: The dotted lines show the mean of the differences between devices, the dashed lines show 95% limits of agreement (±1.96 SD) and the solid black lines show the estimated linear regression lines. b = slope of the estimated regression line. The p‐values show whether the regression slopes are significantly different from zero. Positive values indicate an underestimation by the Fitbit as compared to ActiGraph, and negative values indicate an overestimation
There was complete agreement between ActiGraph and Fitbit regarding the proportion of teenagers and adults meeting weekly MVPA recommendations (defined as ≥420 and ≥150 min, respectively).
4. DISCUSSION
In this study conducted in free‐living conditions including young PWH we compared PA measurements between the research‐grade ActiGraph GT3X‐BT accelerometer as the reference device and the consumer‐grade Fitbit Charge 3 activity monitor. We found moderate to excellent correlations (Pearson's r = .54–.91) between the devices for mean daily steps and minutes of LPA, MPA, VPA, and MVPA. This is consistent with what one would expect from two devices designed to measure the same parameters, and strong correlation alone should not be taken as evidence for good agreement between the two. This becomes apparent when looking into results from the Bland‐Altman analyses, where we found fairly good agreement between the devices for MPA, but large discrepancies between the devices for the other PA variables. On average, the Fitbit estimated a higher number of daily steps and minutes of LPA, VPA, and MVPA compared to the ActiGraph. MAPE were large. LoA were wide for all variables. This is due to the small sample size and large variation in measurements between the devices. We found a higher proportion of non‐valid measurement days for ActiGraph (18%) than Fitbit (4%). It is unclear whether this difference is related to wear time adherence or discrepant definitions of a valid day between the devices.
Previous PA monitor validity research performed in free‐living conditions is limited, with only four other studies investigating the validity of a wrist‐worn Fitbit model against hip‐worn ActiGraph GT3X with study protocols similar to ours (Troiano cut‐points for intensities, 7‐day wear period and ≥600 min wear time as a valid day). One of the studies investigated steps only, 21 one steps and PA intensities, 29 and the remaining two assessed only PA intensities. 28 , 32 These studies included predominantly healthy adults (≥18 years) and one group with knee problems.
4.1. Steps
We found excellent correlation (r = .91) between ActiGraph and Fitbit measured steps. This is similar to the correlation of r = .89 found by Chu et al. 21 However, we found a large and statistically significant mean difference of 3388 steps (95% CI: 4246–2529) between the devices, with a bias of increasing difference with increasing number of steps. This overestimation by the Fitbit is considerably divergent from the suggested acceptable mean deviation of 10% from a gold standard in free‐living conditions. 45 Our finding of Fitbit step overestimation is higher than, but still in line with Chu et al.’s results. 21 They demonstrated a significant median difference between ActiGraph and Fitbit Flex measured steps of 1300/day. Reid et al. 29 did on the other hand not find a significant difference (mean 633 steps/day) between ActiGraph GT3X and Fitbit Flex. The reason for the divergent findings between these studies is unclear. Better agreement of measured steps between ActiGraphs and various Fitbit models has been shown in laboratory‐based studies. 10 , 19
A plausible explanation for the discrepant findings between ActiGraph and Fitbit measured steps in some studies is the respective wrist versus waist monitor placement. Non‐identical body positions of devices clearly limit comparability of data as acceleration is different between the two body parts, and wrist wear has been found to increase error associated with hand movement. 4 , 46 Such error is likely higher in free‐living conditions where there is more variation in movements than in the laboratory. Nevertheless, some studies have also found hip‐worn Fitbit devices to overestimate steps (and minutes in various PA intensities). 7 , 24 , 27 These findings indicate that other factors besides wear location impact the results.
4.2. Intensity categories
We found the Fitbit Charge 3 to overestimate daily minutes of LPA, VPA and MVPA as compared to the ActiGraph, despite acceptable correlation of these outcomes between the devices. The relatively steep negative slopes of the estimated regression lines in the Bland‐Altman plots indicate an increasing discrepancy as PA volume increases. Although most of the points are within the LoA, these limits are very wide.
Here, we focus our discussion on MVPA, as this is the primary focus of PA guidelines. We found nearly the exact same correlation of MVPA/day between devices in our study (r = .68) as did Redenius et al. (r = .65). 28 This moderate correlation is acceptable, but could preferably have been higher. Furthermore, we found an overestimation of daily MVPA by Fitbit compared to ActiGraph of 18 min (LoA −82 to 46). This range of 128 min/day inter‐device measurement variability is substantial. Our result is similar to the findings of Semanik et al. 32 who found a significant mean daily difference between ActiGraph and Fitbit Flex of 19 min (LoA −22 to 59). Even larger differences have been shown by others; Reid et al. found Fitbit Flex to overestimate MVPA by 58 min compared to ActiGraph, 29 and Redenius et al. 28 showed an overestimation by the Fitbit Flex of 78 min/day (LoA −128 to −30). Similar to our findings, these studies demonstrate that the overestimation increases with PA volume, suggesting that Fitbit devices overestimate mean daily MVPA in active individuals as compared to the ActiGraph. 28 , 32 The overall high PA level in our population could hence be part of the explanation for the large measurement discrepancies between the devices in our study. Other possible explanations for the discrepant results between ActiGraph and Fitbit measured PA parameters between devices could be related to wear location, differences in the devices’ measurement properties, data filtering algorithms, intensity cut‐off equations and data processing. It is also possible that the devices perform differently between various types of activities.
4.3. Strengths and limitations
This is the first study to our knowledge investigating the validity of PA measurements between the consumer‐grade PA monitor Fitbit Charge 3 against the research‐grade accelerometer ActiGraph GT3X‐BT, and evaluating the accuracy of the Fitbit in measuring the PA of PWH. We obtained adequate data to include a high proportion of participants (83%) and matched measurement days (75%) in our analyses. We have followed the recommendations for number of days (three to nine) and wear time (10 h/day) needed to capture sufficient valid data 47 , 48 and applied well‐established ActiGraph cut points for PA intensity thresholds. 40 We have assessed agreement between the devices not only via correlations but also using Bland‐Altman plots. Furthermore, the study was conducted in free‐living conditions, which may enhance the external validity of the results. Our population was, however, only a small group of young (age 13–30 years) male participants with haemophilia A and high PA levels, and the results might not be generalisable to other populations. Since we did not perform a power calculation for this study, and considering the limited sample size, the lack of statistically significant differences in MPA between devices may be due to type II statistical error. From the reasonable width of the 95% confidence intervals for between‐device differences, it does however appear that we can assume reasonable power.
We acknowledge that the discrepant definitions of a valid day between the devices is a limitation of this study and that some of the differences between the devices may be related to potential differences in wear time. We were regrettably not able to extract wear time in minutes per day for Fitbit, and thus the criterion of > 1000 steps/day was chosen as the cut‐off for a valid day based on previous research in PWH. 12 Considering that only two non‐valid Fitbit days remained after removal of non‐valid ActiGraph days, it seems that the two different definitions corresponded well. Very good agreement (98.9%) between valid day definitions based on a step count > 1000 versus wear‐time derived from heart rate readings has been found also outside the haemophilia population. 49 Furthermore, this approach for defining a valid day is a pragmatic solution which helps simplify data programming for those using Fitbit devices in clinical research. Since Fitbit, unfortunately, does not publish their algorithms used to estimate intensities it is unknown how Fitbit‐derived PA indexes compare to those by ActiGraph. This hinders the possibility to ascertain accurate comparisons. The proprietary algorithms amongst consumer‐grade activity monitor companies as well as lack of consensus on how wearable monitor data is calibrated, translated to behaviour information, analysed and interpreted are common methodological challenges for researchers in this field. 4 Furthermore, we acknowledge that the ActiGraph is not a true criterion‐measure for assessing PA related energy expenditure, and that it has limitations including insensitivity to capturing PA with little trunk movement and that wear‐compliance may be lower as compared to wrist‐worn devices.
Although the Fitbit Charge 3 appears to overestimate PA parameters compared to the research‐grade ActiGraph accelerometer, it is still more objective than self‐report assessment of PA and valid for surveillance of PA over time within an individual. It is also more user friendly and less burdensome to wear for the individual than a hip‐worn device. A plethora of wearable PA devices are now available, and new monitors are continuously appearing on the market, replacing old types. Brands from larger companies, such as Fitbit, are, compared with smaller brands, likely to survive longer. 11 Another advantage of Fitbit devices is that they are frequently utilised in research, hence providing numerous studies to compare against. 11 Thus, the use of Fitbits will probably still be attractive for both researchers and consumers interested in monitoring PA in the future.
5. CONCLUSION
In this study including young PWH we found the commercial Fitbit Charge 3 activity tracker to overestimate average daily steps and minutes of LPA, VPA and MVPA as compared to the research‐accelerometer ActiGraph GT3X‐BT. This overestimation seems to increase with PA volume, and we conclude that the Fitbit Charge 3 should be used with caution in research. Given the popularity and high wear compliance of Fitbit devices we anticipate that these monitors will continue to be utilised by both consumers and researchers in the future, including the haemophilia population. We, therefore, advice users to be cognisant that PA metrics are likely not equivalent to those obtained from the ActiGraph and to take into account that the device appears to overestimate PA in free‐living conditions.
DISCLOSURES
PAH and REM have received funding to institution from Bayer HealthCare for research carried out in this work. HG, CSR and MG stated that they had no interests which may be perceived as posing a conflict or bias.
AUTHOR CONTRIBUTIONS
Ruth Elise D. Matlary, Pål André Holme, Heidi Glosli, Corina Silvia Rueegg and May Grydeland designed the study. REDM collected the clinical data. REDM and CSR analysed and interpreted the data. REDM drafted the manuscript. All authors contributed to revision of the manuscript and approved the final version.
6.
ACKNOWLEDGEMENTS
The HemFitBit‐study is financially supported by an unrestricted research grant from Bayer HealthCare. We would like to thank the participants who took part in the study and all clinicians who aided data collection. Thanks also to Mari Bratteteig for assistance with ActiGraph data processing.
Matlary RED, Holme PA, Glosli H, Rueegg CS, Grydeland M. Comparison of free‐living physical activity measurements between ActiGraph GT3X‐BT and Fitbit Charge 3 in young people with haemophilia. Haemophilia. 2022;28:e172–e180. 10.1111/hae.14624
DATA AVAILABILITY STATEMENT
The data supporting the study findings are not publicly available due to privacy or ethical restrictions. Data may be made available upon reasonable request to the corresponding author.
REFERENCES
- 1. Wang M, Ãlvarez‐Romãn MT, Chowdary P, Quon DV, Schafer K. Physical activity in individuals with haemophilia and experience with recombinant factor VIII Fc fusion protein and recombinant factor IX Fc fusion protein for the treatment of active patients. Blood Coagul Fibrinolysis. 2016;27(7):737‐744. [DOI] [PMC free article] [PubMed] [Google Scholar]
- 2. World Health Organization . Guidelines on physical activity and sedentary behaviour. WHO Press; 2020. [PubMed] [Google Scholar]
- 3. Srivastava A, Santagostino E, Dougall A, et al. WFH guidelines for the management of hemophilia, 3rd edition. Haemophilia. 2020;26(S6):1‐158. [DOI] [PubMed] [Google Scholar]
- 4. Arvidsson D, Fridolfsson J, Börjesson M. Measurement of physical activity in clinical practice using accelerometers. J Intern Med. 2019;286(2):137‐153. [DOI] [PubMed] [Google Scholar]
- 5. Bassett DR, Troiano RP, Mcclain JJ, Wolff DL. Accelerometer‐based physical activity: total volume per day and standardized measures. Med Sci Sports Exerc. 2015;47(4):833‐838. [DOI] [PubMed] [Google Scholar]
- 6. Montoye AHK, Moore RW, Bowles HR, Korycinski R, Pfeiffer KA. Reporting accelerometer methods in physical activity intervention studies: a systematic review and recommendations for authors. Br J Sports Med. 2018;52(23):1507‐1516. [DOI] [PubMed] [Google Scholar]
- 7. Gomersall SR, Ng N, Burton NW, Pavey TG, Gilson ND, Brown WJ. Estimating physical activity and sedentary behavior in a free‐living context: a pragmatic comparison of consumer‐based activity trackers and ActiGraph accelerometry. J Med Internet Res. 2016;18(9):e239. [DOI] [PMC free article] [PubMed] [Google Scholar]
- 8. Chomistek AK, Yuan C, Matthews CE, et al. Physical activity assessment with the ActiGraph GT3X and doubly labeled water. Med Sci Sports Exerc. 2017;49(9):1935‐1944. [DOI] [PMC free article] [PubMed] [Google Scholar]
- 9. Van Remoortel H, Raste Y, Louvaris Z, et al. Validity of six activity monitors in chronic obstructive pulmonary disease: a comparison with indirect calorimetry. PLoS One. 2012;7(6):e39198. [DOI] [PMC free article] [PubMed] [Google Scholar]
- 10. Feehan LM, Geldman J, Sayre EC, et al. Accuracy of fitbit devices: systematic review and narrative syntheses of quantitative data. JMIR Mhealth Uhealth. 2018;6(8):e10527. [DOI] [PMC free article] [PubMed] [Google Scholar]
- 11. Henriksen A, Haugen Mikalsen M, Woldaregay AZ, et al. Using fitness trackers and smartwatches to measure physical activity in research: analysis of consumer wrist‐worn wearables. J Med Internet Res. 2018;20(3):e110. [DOI] [PMC free article] [PubMed] [Google Scholar]
- 12. Carrasco JJ, Pérez‐Alenda S, Casaña J, Soria‐Olivas E, Bonanad S, Querol F. Physical activity monitoring and acceptance of a commercial activity tracker in adult patients with haemophilia. Int J Environ Res Public Health. 2019;16(20). [DOI] [PMC free article] [PubMed] [Google Scholar]
- 13. Perez‐Alenda S, Carrasco JJ, Megias‐Vericat JE, Poveda JL, Bonanad S, Querol F. Quantification of physical activity in adult patients with haemophilic arthropathy in prophylaxis treatment using a fitness tracker. Haemophilia. 2018;24(1):e28‐e32. [DOI] [PubMed] [Google Scholar]
- 14. Khair K, Holland M, Dodgson S, Mclaughlin P, Fletcher S, Christie D. Fitness enhances psychosocial well‐being and self‐confidence in young men with hemophilia: results from project GYM. Res Pract Thromb Haemost. 2021;5(8). [DOI] [PMC free article] [PubMed] [Google Scholar]
- 15. Konkle BA, Quon DV, Raffini L, et al. A prospective observational study of antihemophilic factor (recombinant) prophylaxis related to physical activity levels in patients with hemophilia A in the United States (SPACE). J Blood Med. 2021;12:883‐896. [DOI] [PMC free article] [PubMed] [Google Scholar]
- 16. Hendriks MAL, Wanroij JWM, Larosâ‐Van Gorkom BAP, Nijhuisâ‐Van Der Sanden MWG, Hoogeboom TJ. The SLIM study‐shared medical appointments to change lifestyles of overweight people with haemophilia: a randomized multiple baseline (n‐of‐1) design. Haemophilia. 2021;27(4):606‐617. [DOI] [PMC free article] [PubMed] [Google Scholar]
- 17. Fuller D, Colwell E, Low J, et al. Reliability and validity of commercially available wearable devices for measuring steps, energy expenditure, and heart rate: systematic review. JMIR Mhealth Uhealth. 2020;8(9):e18694. [DOI] [PMC free article] [PubMed] [Google Scholar]
- 18. Straiton N, Alharbi M, Bauman A, et al. The validity and reliability of consumer‐grade activity trackers in older, community‐dwelling adults: a systematic review. Maturitas. 2018;112:85‐93. [DOI] [PubMed] [Google Scholar]
- 19. Evenson KR, Goto MM, Furberg RD. Systematic review of the validity and reliability of consumer‐wearable activity trackers. Int J Behav Nutr Phys Act. 2015;12:159. [DOI] [PMC free article] [PubMed] [Google Scholar]
- 20. Brewer W, Swanson BT, Ortiz A. Validity of Fitbit's active minutes as compared with a research‐grade accelerometer and self‐reported measures. BMJ Open Sport Exerc Med. 2017;3(1):e000254. [DOI] [PMC free article] [PubMed] [Google Scholar]
- 21. Chu AHY, Ng SHX, Paknezhad M, et al. Comparison of wrist‐worn Fitbit Flex and waist‐worn ActiGraph for measuring steps in free‐living adults. PLoS One. 2017;12(2):e0172535. [DOI] [PMC free article] [PubMed] [Google Scholar]
- 22. Dominick GM, Winfree KN, Pohlig RT, Papas MA. Physical activity assessment between consumer‐ and research‐grade accelerometers: a comparative study in free‐living conditions. JMIR Mhealth Uhealth. 2016;4(3):e110. [DOI] [PMC free article] [PubMed] [Google Scholar]
- 23. Farina N, Lowry RG. The validity of consumerlevel activity‐monitors in healthy older adults in free‐living conditions. J Aging Phys Act. 2017;26(1):128‐135. [DOI] [PubMed] [Google Scholar]
- 24. Ferguson Ty, Rowlands AV, Olds T, Maher C. The validity of consumer‐level, activity monitors in healthy adults worn in free‐living conditions: a cross‐sectional study. Int J Behav Nutr Phys Act. 2015;12:42. [DOI] [PMC free article] [PubMed] [Google Scholar]
- 25. Imboden MT, Nelson MB, Kaminsky LA, Montoye AHk. Comparison of four Fitbit and Jawbone activity monitors with a research‐grade ActiGraph accelerometer for estimating physical activity and energy expenditure. Br J Sports Med. 2018;52(13):844‐850. [DOI] [PubMed] [Google Scholar]
- 26. Jones D, Crossley K, Dascombe B, Hart HF, Kemp J. Validity and reliability of the Fitbit Flex™ and actigraph Gt3x+ at jogging and running speeds. Int J Sports Phys Ther. 2018;13(5):860‐870. [PMC free article] [PubMed] [Google Scholar]
- 27. Middelweerd A, Van Der Ploeg HP, Van Halteren A, Twisk JWR, Brug J, Te Velde SJ. A validation study of the Fitbit one in daily life using different time intervals. Med Sci Sports Exerc. 2017;49(6):1270‐1279. [DOI] [PubMed] [Google Scholar]
- 28. Redenius N, Kim Y, Byun W. Concurrent validity of the Fitbit for assessing sedentary behavior and moderate‐to‐vigorous physical activity. BMC Med Res Methodol. 2019;19(1):29. [DOI] [PMC free article] [PubMed] [Google Scholar]
- 29. Reid RER, Insogna JA, Carver TE, et al. Validity and reliability of Fitbit activity monitors compared to ActiGraph GT3X+ with female adults in a free‐living environment. J Sci Med Sport. 2017;20(6):578‐582. [DOI] [PubMed] [Google Scholar]
- 30. Rosenberger ME, Buman MP, Haskell WL, Mcconnell MV, Carstensen LL. Twenty‐four hours of sleep, sedentary behavior, and physical activity with nine wearable devices. Med Sci Sports Exerc. 2016;48(3):457‐465. [DOI] [PMC free article] [PubMed] [Google Scholar]
- 31. Schneider M, Chau L. Validation of the Fitbit Zip for monitoring physical activity among free‐living adolescents. BMC Res Notes. 2016;9(1):448. [DOI] [PMC free article] [PubMed] [Google Scholar]
- 32. Semanik P, Lee J, Pellegrini CA, Song J, Dunlop DD, Chang RW. Comparison of physical activity measures derived from the Fitbit flex and the ActiGraph GT3X+ in an employee population with chronic knee symptoms. ACR Open Rheumatol. 2020;2(1):48‐52. [DOI] [PMC free article] [PubMed] [Google Scholar]
- 33. Sushames A, Edwards A, Thompson F, Mcdermott R, Gebel K. Validity and reliability of Fitbit flex for step count, moderate to vigorous physical activity and activity energy expenditure. PLoS One. 2016;11(9):e0161224. [DOI] [PMC free article] [PubMed] [Google Scholar]
- 34. Tedesco S, Sica M, Ancillao A, Timmons S, Barton J, O'Flynn B. Accuracy of consumer‐level and research‐grade activity trackers in ambulatory settings in older adults. PLoS One. 2019;14(5):e0216891. [DOI] [PMC free article] [PubMed] [Google Scholar]
- 35. Van Blarigan EL, Kenfield SA, Tantum L, Cadmus‐Bertram LA, Carroll PR, Chan JM. The Fitbit one physical activity tracker in men with prostate cancer: validation study. JMIR Cancer. 2017;3(1):e5. [DOI] [PMC free article] [PubMed] [Google Scholar]
- 36. Peyvandi F, Jayandharan G, Chandy M, et al. Genetic diagnosis of haemophilia and other inherited bleeding disorders. Haemophilia. 2006;12:82‐89. [DOI] [PubMed] [Google Scholar]
- 37. Henriksen A, Svartdal F, Grimsgaard S, Hartvigsen G, Hopstock LA. Polar vantage and oura physical activity and sleep trackers: validation and comparison study. JMIR Form Res. 2022;6(5):e27248. [DOI] [PMC free article] [PubMed] [Google Scholar]
- 38. Ried‐Larsen M, Brønd JC, Brage S, et al. Mechanical and free living comparisons of four generations of the Actigraph activity monitor. Int J Behav Nutr Phys Act. 2012;9(113). [DOI] [PMC free article] [PubMed] [Google Scholar]
- 39. Hermann A, Ried‐Larsen M, Kryger Jensen A, et al. Low validity of the Sensewear Pro3 activity monitor compared to indirect calorimetry during simulated free living in patients with osteoarthritis of the hip. BMC Musculoskelet Disord. 2014;15(43). [DOI] [PMC free article] [PubMed] [Google Scholar]
- 40. Troiano RP, Berrigan D, Dodd KW, Mã Sse LC, Tilert T, Mcdowell M. Physical activity in the United States measured by accelerometer. Med Sci Sports Exerc. 2008;40(1):181‐188. [DOI] [PubMed] [Google Scholar]
- 41. Aadland E, Andersen LBo, Anderssen SA, Resaland GK, Kvalheim OM. Associations of volumes and patterns of physical activity with metabolic health in children: a multivariate pattern analysis approach. Prev Med. 2018;115:12‐18. [DOI] [PubMed] [Google Scholar]
- 42. Hilliard P, Funk S, Zourikian N, et al. Hemophilia joint health score reliability study. Haemophilia. 2006;12(5):518‐525. [DOI] [PubMed] [Google Scholar]
- 43. Schober P, Boer C, Schwarte LA. Correlation coefficients: appropriate use and interpretation. Anesth Analg. 2018;126(5):1763‐1768. [DOI] [PubMed] [Google Scholar]
- 44. Martin Bland J, Altman D. Statistical methods for assessing agreement between two methods of clinical measurement. The Lancet. 1986;327(8476):307‐310. [PubMed] [Google Scholar]
- 45. Tudor‐Locke C, Sisson SB, Lee SM, Craig CL, Plotnikoff RC, Bauman A. Evaluation of quality of commercial pedometers. Can J Public Health. 2006;97(1):S10‐S16. [DOI] [PMC free article] [PubMed] [Google Scholar]
- 46. Tudor‐Locke C, Barreira TV, Schuna JM. Comparison of step outputs for waist and wrist accelerometer attachment sites. Med Sci Sports Exerc. 2015;47(4):839‐842. [DOI] [PubMed] [Google Scholar]
- 47. Matthews CE, Hagstrã Mer M, Pober DM, Bowles HR. Best practices for using physical activity monitors in population‐based research. Med Sci Sports Exerc. 2012;44(Suppl 1):S68. [DOI] [PMC free article] [PubMed] [Google Scholar]
- 48. Rich C, Geraci M, Griffiths L, Sera F, Dezateux C, Cortina‐Borja M. Quality control methods in accelerometer data processing: defining minimum wear time. PLoS One. 2013;8(6):e67206. [DOI] [PMC free article] [PubMed] [Google Scholar]
- 49. Orstad SL, Gerchow L, Patel NR, et al. Defining valid activity monitor data: a multimethod analysis of weight‐loss intervention participants’ barriers to wear and first 100 days of physical activity. Informatics. 2021;8(2). [DOI] [PMC free article] [PubMed] [Google Scholar]
Associated Data
This section collects any data citations, data availability statements, or supplementary materials included in this article.
Data Availability Statement
The data supporting the study findings are not publicly available due to privacy or ethical restrictions. Data may be made available upon reasonable request to the corresponding author.