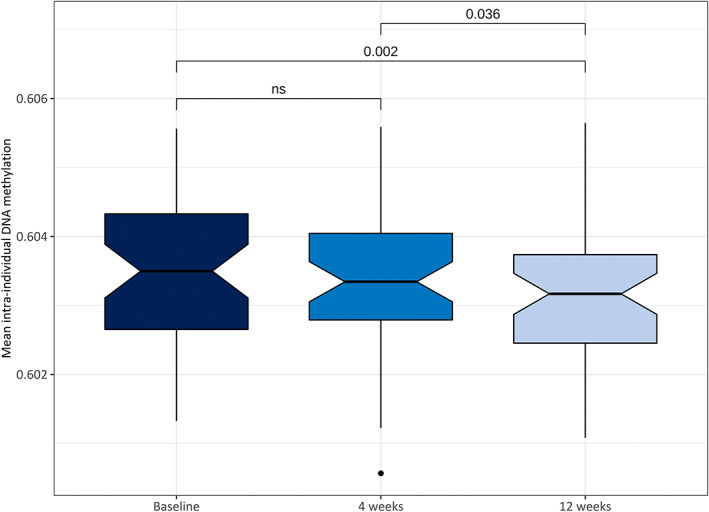
FIGURE 2.

Intraindividual differences in mean global DNA methylation level across all time points (n = 47). Global DNA methylation levels were reduced after 4 and 12 weeks of dietary treatment; this was statistically significant between baseline and 12 weeks (p = .002), and between 4 and 12 weeks of dietary treatment (p = .036). Values are shown as boxplots (center lines, medians; notches, 95% confidence interval of medians; box limits, upper and lower quartiles; whiskers, 1.5 × interquartile range; points, outliers). ns, not significant.
