

Abstract
Convergent evolution of phytopathogenicity is poorly described, especially among multiple strains of a single microbial species. We investigated this phenomenon with genetically diverse isolates of Fusarium oxysporum f. sp. fragariae (Fof) that cause one of two syndromes: chlorosis and wilting (the ‘yellows‐fragariae’ pathotype), or only wilting (the ‘wilt‐fragariae’ pathotype). We challenged strawberry (Fragaria × ananassa) plants to root infection by five fungal isolates: three yellows‐fragariae, one wilt‐fragariae and one that is not pathogenic to strawberry. All Fof isolates had chromosome‐level assemblies; three were newly generated. The two pathotypes triggered distinct host responses, especially among phytohormone‐associated genes; yellows‐fragariae isolates strongly induced jasmonic acid‐associated genes, whereas the wilt‐fragariae isolate primarily induced ethylene biosynthesis and signalling. The differentially expressed genes on fungal accessory chromosomes were almost entirely distinct between pathotypes. We identified an ~150 kbp ‘pathogenicity island’ that was horizontally transferred between wilt‐fragariae strains. This predicted pathogenicity island was enriched with differentially expressed genes whose predicted functions were related to plant infection, and only one of these genes was also upregulated in planta by yellows‐fragariae isolates. These results support the conclusion that wilt‐ and yellows‐fragariae cause physiologically distinct syndromes by the expression of discrete repertoires of genes on accessory chromosomes.
INTRODUCTION
Convergent evolution describes the emergence of a common trait among evolutionarily distinct populations; this trait can arise by the same or different mechanisms (Lee & Coop, 2017). Most examples of this phenomenon among plant pathogens involve mutations of single genes that confer an increased cultivar host range or fungicide resistance (Biju et al., 2016; de Vries et al., 2020). There are few well‐characterized examples of convergently evolved polygenic mechanisms for host‐specific pathogenicity, especially among strains of a single species (Carlier et al., 2021). A greater understanding of this phenomenon could help to define the consistency of susceptibility‐associated responses across pathosystems and the dispensability of microbial pathogenicity factors.
The Fusarium wilt of strawberry pathosystem provides an attractive opportunity for studying convergent evolution. The causal agents of this disease include all strains of F. oxysporum that are pathogenic to strawberry (Fragaria × ananassa); they are collectively referred to as F. oxysporum f. sp. fragariae (Fof). Although described by a single name, pathotypes causing one of two syndromes have been reported among isolates of Fof: ‘yellows‐fragariae’ isolates cause chlorosis and wilting, whereas ‘wilt‐fragariae’ isolates only cause wilting (Henry et al., 2021). Comparative genomics of the two pathotypes suggested they evolved independently and then diversified through horizontal chromosome transfer (Henry et al., 2021). If true, these pathotypes convergently evolved the ability to cause wilting on strawberry; wilting is the most obvious symptom in the field and the cause of plant mortality. However, the hypothesis of convergent evolution lacks evidence from the genetic determinants of pathogenicity in both pathotypes and the extent of host physiological differences manifested by the two syndromes.
In F. oxysporum, the genetic determinants of host specificity typically reside on ‘pathogenicity chromosomes’ that are not conserved across the species and can be horizontally transferred (Li et al., 2020a; Ma et al., 2010; van Dam et al., 2017). These non‐conserved, ‘accessory’ genomic regions supplement ~11 ‘core’ chromosomes that are conserved in F. oxysporum (Ma et al., 2010). A putative pathogenicity chromosome, chrY‐frag, was identified in yellows‐fragariae, and variants of this chromosome were found in all yellows‐fragariae isolates (Henry et al., 2021). Given the genetic variance of chrY‐frag, it is not clear which genes are essential to pathogenicity. Pathogenicity chromosomes have not been identified for the wilt‐fragariae pathotype. This knowledge could illustrate the potential for distinct pathogenicity factors to emerge independently among closely related strains.
It is possible that variation in phytohormone activation underlies differences in symptom expression and could be elucidated by transcriptomics. Phytohormone pathways are central to the network of responses involved in a conducive disease reaction and can be manipulated by F. oxysporum isolates to promote susceptibility (Di et al., 2016). Most functional characterization of phytohormone genes has been conducted in the model plant species, Arabidopsis thaliana (Berens et al., 2017). Because phytohormone pathways are largely conserved across plant species, homologues can be identified by gene similarity searches in non‐model organisms (Berens et al., 2017). To our knowledge, a comprehensive search for phytohormone gene homologues has not been conducted in octoploid strawberry.
Previous work in other Fusarium wilt pathosystems has shown that phytohormones can have pathosystem‐specific effects on susceptibility or resistance. For example, jasmonic acid (JA) and ethylene (ET) pathways are associated with resistance (Kavroulakis et al., 2007; Thaler et al., 2004) or susceptibility (Cole et al., 2014; Thatcher et al., 2009), depending on the pathosystem. The effects of other phytohormones are more consistent, such as the salicylic acid (SA) phytohormone pathway, which generally contributes to Fusarium wilt resistance (Miyaji et al., 2017; Xue et al., 2015), or the auxin pathway that is typically associated with susceptibility (Kidd et al., 2011; Lyons et al., 2015). Multiple Fusarium wilt pathogens are differentiated into ‘yellows’ and ‘wilts’ disease phenotypes (Edel‐Hermann & Lecompte, 2019; Jacobson & Gordon, 1988), and an exploration of phytohormone activation in the Fof pathosystem could broadly help to explain these differences.
The present study is our attempt to address these knowledge gaps by: (i) evaluating host and pathogen transcriptional dynamics during infection, and (ii) generating new chromosome‐scale assemblies for Fof isolates. We had complementary objectives for analysis of the plant‐ and fungal‐associated reads. To enable comparisons of phytohormone responses, we conducted a comprehensive search for strawberry homologues of key phytohormone‐related genes from model plant systems. With homologues identified, we characterized the phytohormone and general transcriptional responses of the susceptible strawberry cultivar (‘Camarosa’) to five F. oxysporum isolates. The cultivar, Camarosa, was selected because it (i) had a high‐quality reference assembly available at the time the experiments were conducted, (ii) was known to be susceptible and express different symptoms to the two pathotypes. Our objectives in analysing the fungal transcriptome were to: (i) determine if the expression of genes on core chromosomes is associated with pathotype, (ii) identify genes that are commonly differentially expressed among diverse yellows‐fragariae isolates during infection and (iii) identify putative pathogenicity determinants for wilt‐fragariae isolates. High‐quality Fof genome assemblies enabled the identification of accessory chromosomes with common characteristics of pathogenicity chromosomes, such as enrichment with genes upregulated during infection, secreted in xylem (SIX) effector genes and miniature impala (mimp) non‐autonomous transposons (Ayukawa et al., 2021; Schmidt et al., 2013; van Dam et al., 2016). The result is a detailed investigation of strawberry transcriptional responses to challenge by Fof and a confirmation that yellows‐ and wilt‐fragariae deploy distinct repertoires of independently evolved pathogenicity genes.
EXPERIMENTAL PROCEDURES
Genomic resources
We utilized the existing assemblies for GL1381 and GL1804, retrieved from the NCBI GenBank accessions WIMJ00000000 (version 2) and WIMB00000000 (version 1), respectively, and obtained the Fragaria × ananassa cultivar Camarosa version 1.0 genome assembly and annotation from https://www.rosaceae.org/species/fragaria_x_ananassa/genome_v1.0.a1 (Edger et al., 2019).
Transcriptomic experiments
The transcriptomic results for isolate GL1381 were first published as part of Henry et al. (2021). Here, we include results for additional isolates using the same methods of plant inoculation, growth, sampling, RNA extraction, sequencing, and differential expression analysis, and a re‐analysis of reads reported for GL1381.
Potting soil was gently washed away from the roots of tissue‐cultured strawberry plants (cultivar ‘Camarosa’). Roots were dipped in 5 x 10⁶ conidia per ml of 0.1% water agar for 7 min and planted into sterile sand (n = 10 plants per fungal isolate and a sterile 0.1% water agar negative control). Plants were maintained in a growth chamber with a 12‐h photoperiod and 28°C high/20°C low‐temperature setting. At each timepoint (6‐ and 13‐ days post‐inoculation), the roots of five plants per treatment were washed in sterile, de‐ionized water, patted dry with sterile paper towels and flash‐frozen in liquid nitrogen. To provide an in vitro control for each fungal isolate, we inoculated potato dextrose agar with a suspension of conidia and mycelial fragments and incubated Petri plates for 72 h at 23°C. Mycelia were then scraped from the surface of the agar with a sterile glass slide and flash‐frozen in liquid nitrogen. We extracted RNA from all tissues with the 3% CTAB #1 method described in Yu et al. (2012). RNA samples were provided to the UC Davis DNA Technologies Core Facility, where RNA integrity was quantified with an Agilent Bioanalyzer. 3′ QuantSeq (Lexogen, USA) libraries were prepared and sequenced on an Illumina NovaSeq with 150 bp paired‐end reads.
Preprocessing and mapping reads
Reads were pre‐processed with HTStream (version 1.0.0) as described in Henry et al. (2021). Forward reads were aligned to either the Fragaria × ananassa Camarosa Genome Assembly v1.0 (Edger et al., 2019) or the inoculated fungal isolate's assembly with STAR (version 2.6.1a) (Dobin et al., 2013) using the following parameters: ‘‐‐runThreadN 8, ‐‐outSAMtype BAM SortedByCoordinate, ‐‐outReadsUnmapped Fastx, ‐‐outFilterType BySJout, ‐‐outFilterMultimapNmax 20, ‐‐alignSJoverhangMin 8, ‐‐alignSJDBoverhangMin 1, ‐‐outFilterMismatchNmax 999, ‐‐outFilterMismatchNoverLmax 0.1, ‐‐alignIntronMin 20, ‐‐alignIntronMax 5000, ‐‐alignMatesGapMax 6000’. The sorted bam output files from STAR were then indexed with samtools version 0.1.19 deduplicated based on both mapped position and UMI with UMI Tools (version 1.0.0) (Li et al., 2009; Smith et al., 2017).
Quantifying reads
To obtain read counts, we used a modified version of the count function in HTSeq version 0.6.1p1 (Anders et al., 2015). Our custom version of HTSeq considered both UTR and CDS features for counting: when UTR and CDS features from different genes overlapped, the read was counted for the UTR. This modified HTSeq program was used with GFF annotations where a 1000 bp 3′ UTR feature was added to the end of each gene (Supporting Information Tables S5 and S6) and is available from https://github.com/pmhenry/Publications/tree/master/Frag_Fof_TAGseq_Jenner_2020/HTSeq-TAG-Counts.
Differential expression analysis
Differential expression analysis was completed in R using edgeR version 3.36 (Robinson et al., 2010). We used ‘filterByExpr’, ‘voom’ and ‘lmFit’ functions to filter, transform and fit linear models for read counts of each gene in each sample. Correction for multiple testing used the Benjamini–Hochberg method. Analysis of transcriptomic changes in F. × ananassa cv. Camarosa utilized the same annotated genes, as all reads were aligned to the strawberry genome. For these comparisons we contrasted expression across timepoints and treatments. Differential expression for fungal isolates was calculated both individually (i.e. for each isolate between timepoints and in vitro vs. in planta) and between isolates (i.e. contrasting expression of the previously identified core genome homologues). We considered genes with a log fold change ±1.5 with an adjusted p‐value of ≤0.05 to be differentially expressed. Genes with fewer than two mapped reads in all samples of a treatment were considered unexpressed.
Functional analysis of differentially expressed transcripts in Fragaria × ananassa Camarosa
We reviewed the literature to identify genes involved in the JA, SA, ET and auxin pathways in response to phytopathogens (Supporting Information Table S1). Using KEGG databases and GenBank homologues from Arabidopsis thaliana, Fragaria vesca, or other Rosaceae genomes, we used BLASTn to search for homologues in the predicted Camarosa transcripts version 1.2 (filename = Fxa_v1.2_makerStandard_transcripts_woTposases.fasta). Transcripts with a match greater than 80% sequence identity and reciprocal coverage were considered homologues. Genes encoding cell wall modifying enzymes were annotated with dbcan2, which uses three methods to classify genes (Zhang et al., 2018). We considered annotations valid if classified as a CAZyme by two of the three methods. Expansins were identified by the reciprocal best BLAST hit search method against (i) F. × ananassa homologues in GenBank, and (ii) F. vesca expansin genes identified in Dong et al. (2022). Using the previously identified gene ontology annotations (Edger et al., 2019), we conducted an enrichment analysis with topGO (version 2.46.0) (Alexa & Rahnenfuhrer, 2021). Significance testing was done using Fisher's Exact test with topGo's ‘elim’ algorithm. p‐values were left unadjusted to avoid overcorrection; this can occur when subjects have complex dependence relationships (Meijer & Goeman, 2016).
DNA extraction for high‐throughput sequencing
Isolates BRIP62122 and MAFF727510 were grown in Kerr's broth amended with 100 mg/L kanamycin for 7 days and GL1315 was grown on potato dextrose agar plates for 14 days. Conidia were collected, washed and lyophilized as described in Henry et al. (2021). DNA was extracted from lyophilized conidia by the modified phenol‐chloroform extraction method described in Kaur et al. (2017).
DNA library preparation and sequencing
PacBio continuous long read Express Library Preparations (version 1) were conducted with high‐molecular‐weight DNA from MAFF727510 and BRIP62122, size selected for fragments greater than 20 kbp and sequenced on a PacBio Sequel II with 30‐h movies. A PacBio SMRTbell library was prepared for GL1315, size‐selected to fragments greater than 15 kbp in length and sequenced on an RSII with P6‐C4 chemistry at the University of California at Davis DNA Technologies Core (Davis, CA). A ProxiMeta Hi‐C library was additionally prepared for isolate GL1315 as per the manufacturer's instructions. The resulting library was BluePippin size selected for fragments between 350 and 800 bp and sequenced on an Illumina NovaSeq (150 bp paired‐end) at the University of California, San Francisco Genomics Core facility.
Genome assembly
The BRIP62122 and MAFF727510 assemblies were constructed by canu (version 1.8) run with the following parameters: ‘genomeSize = 55 m corOutCoverage = 40’ (Koren et al., 2017). The input read length and composition for BRIP62122 caused excessive completion times with the default ‘ovl’ read overlapper, so this assembly was conducted with ‘overlapper = mhap’ and ‘utgReAlign = true’. BRIP62122 was assembled from 54,530 trimmed and corrected reads with an N50 of 16,489, a maximum length of 119,143 bp and representing approximately 35× coverage of the resulting genome. MAFF727510 was assembled from 60,449 trimmed/corrected reads with an N50 of 21,144, a maximum length of 112,778, and approximately 33× coverage of the resulting genome. Previously published Illumina HiSeq reads (150 bp paired‐end) for these isolates (SRR10313864 for MAFF727510 and SRR10313845 for BRIP62122) were quality‐filtered (with HTStream version 1.3.2), aligned to their respective reference assembly with Bowtie2 (version 2.3.5.1) and the assembly error corrected with Pilon (version 1.23) (Langmead & Salzberg, 2012; Walker et al., 2014).
The GL1315 genome was assembled using a hybrid long‐ and short‐read approach based on the method identified in Chakraborty et al. (2016). First, Platanus (version 1.2.1) was used to construct contigs with 150 bp paired‐end Illumina reads with default parameters (Kajitani et al., 2014). The longest reads (minimum length = 19,757 bp) that would give 30× coverage of a 50 Mbp genome were used to fill gaps between scaffolds with DBG2OLC (version 20160220) using the following parameters: kmer size = 17, adaptive threshold = 0.01, kmer matching threshold = 3, and minimum overlap score = 15 (Ye et al., 2016). An initial error correction was conducted by the DBG2OLC consensus module and was followed by Pilon (version 1.23) error correction with Bowtie2 (version 2.3.5.1) mapped Illumina reads (GenBank SRA accession for Illumina reads: SRR10313880) (Langmead & Salzberg, 2012; Walker et al., 2014). The resulting assembly was scaffolded by Proximo (Phase Genomics, LLC) and gap‐filled by PBJelly (version 15.8.24) run with proovread (version 2.14.0) error‐corrected PacBio reads (English et al., 2012; Hackl et al., 2014).
Genome annotation
Annotation of fungal genomes was conducted with CodingQuarry (version 2.0) run in default and ‘pathogen mode’ (Testa et al., 2015), using pre‐trained gene models as described in Henry et al. (2021). From the gene models annotated by CodingQuarry, we predicted secreted proteins with signalP4.1 (run mode = ‘best’). EffectorP (versions 1.0 and 2.0) was used to predict effectors from genes with a signal peptide (Nielsen, 2017; Sperschneider et al., 2016; Sperschneider et al., 2018). CAZymes were annotated by dbcan2 as mentioned above. Transposable elements were annotated with Repeatmodeler (v1.0.11) and Repeatmasker (v.4.0.8) (Tarailo‐Graovac & Chen, 2009). Miniature impala transposons were identified by the mimp_finder.py function of Repertoire (version 6), which discovers mimps with TIRmite (version 1.1.3) (https://github.com/Adamtaranto/TIRmite) as described in Henry et al. (2021) (https://github.com/SamuelBrinker/Repertoire_v6). For all assemblies, mitochondrial sequences were circularized by trimming duplicated ends after self‐alignment using ‘dottup’ in Geneius Prime version 2019.0.4.
Identification of fungal gene homologues to facilitate between‐isolate differential expression analysis
To facilitate differential expression analysis between fungal strains, we identified gene homologues on core chromosomes. The ‘core’, Fusarium oxysporum chromosomes were identified by aligning each assembly to the reference isolate, Fusarium oxysporum f. sp. lycopersici 4287 (Fol4287; GenBank accession: GCA_000149955.2) with ‘nucmer’ from MUMmer (version 3.23) and parsing the output with the following script: https://github.com/LikeFokkens/FOSC_multi-speed-genome/blob/master/whole_genome_alignments/run_nucmer__and__get_coords.py.
We compared the genes predicted on homologous chromosomes between strains with reciprocal best BLAST hit matching. First, pairwise comparisons were conducted between genes annotated on each chromosome of GL1381 and genes annotated on the homologous chromosome of each other strain. Then, we used a python script to match reciprocal best BLAST hits between GL1381 and the other fungal genomes (https://github.com/bnjenner/Publications/tree/master/Frag_Fof_TAGseq_Jenner_2020/RBBH). This list was filtered in R to only include genes that had a homologue in all five fungal isolates. To identify genes in accessory genome regions, we filtered out all genes identified on core chromosomes from each isolate's annotation file. We then used the same reciprocal best BLAST hit matching method to determine homologues between genes on accessory chromosomes for all pairwise comparisons between strains.
Identification of putative horizontally transferred accessory genome regions within Fusarium oxysporum f. sp. fragariae
Conserved accessory genome regions were identified by read mapping as described in Henry et al. (2021). Briefly, 5.5 Gbp of quality‐filtered reads were aligned to reference assemblies with BWA‐mem [v.0.7.17‐r1188; (Li & Durbin, 2009)]. Regions with greater than 9× coverage were considered ‘present’ in the query isolate and coverage between query isolates was assessed with bedtools ‘intersect’ and ‘subtract’ (Quinlan & Hall, 2010). Genomes were visualized with Circos version (version 0.69‐9) and ggplot2 (version 3.3.3) (Krzywinski et al., 2009; Wickham, 2016).
RESULTS
Symptom development and broad transcriptional changes in strawberry
We sequenced RNA that was extracted from roots inoculated with one of five fungal isolates or non‐inoculated control plants. All five isolates had core genomes in the sub‐specific ‘clade 2’ sensu O'Donnell et al. (1998) or ‘clade 2B’ sensu Henry et al. (2021). Three isolates were yellows‐fragariae and had distinct core and accessory genomes: GL1381 (Y3/T1381), GL1315 (Y2/T1) and MAFF727510 (Y8/T3), where ‘Y#’ indicates the isolate's monophyletic clade (based on the core genome) and ‘T#’ indicates the chrY‐frag type, as described in Henry et al. (2021). The isolate representing wilt‐fragariae in this study, BRIP62122, is part of the ‘W2’ core genome lineage from Australia; the other wilt‐fragariae lineages are ‘W1’ and ‘W3’ found in Australia and Spain, respectively (Henry et al., 2021). Lastly, we included an isolate of F. oxysporum f. sp. mori, GL1804, which causes Fusarium wilt of blackberry and can asymptomatically colonize strawberry (unpublished data) (Pastrana et al., 2017).
Root tissues were harvested at timepoints targeting key stages during symptom development [Figure 1(A)]. As shown in previous studies, symptom onset occurred earlier in plants inoculated with yellows‐fragariae isolates than wilt‐fragariae (Henry et al., 2021). At the first timepoint of 6 days post‐inoculation (dpi), mild stunting was already apparent in yellows‐fragariae treatments, but plants inoculated with a wilt‐fragariae isolate remained asymptomatic (Figure 1). By 13 dpi, symptom severity for yellows‐fragariae had increased; extreme chlorosis was observed on newly formed leaves, and some outer leaves were beginning to wilt. In the wilt‐fragariae treatment, 13 dpi represented the beginning of symptom onset: mild wilting symptoms on outer leaves were observed at this timepoint (Figure 1). Plants inoculated with the non‐pathogenic (GL1804) and water treatments remained healthy and asymptomatic for the duration of the experiment (Figure 1).
FIGURE 1.

Overview of treatments, timepoints and symptoms observed in the experiment. (A) Depiction of symptoms observed at 6 and 13 days post‐inoculation (dpi). Rows correspond to treatments grouped by symptom phenotype. The ‘controls’ include non‐inoculated (water) and non‐strawberry‐pathogen inoculated (isolate GL1804) plants that remained healthy at both timepoints. The wilt‐fragariae isolate, BRIP62122, caused no symptoms at 6 dpi and outer‐leaf wilting by 13 dpi. Yellows‐fragariae isolates (GL1315, GL1381 and MAFF727510) caused stunting and chlorosis on the youngest leaf at 6 dpi and chlorosis on all leaves by 13 dpi. (B) Photos of healthy leaves (left) and leaves with chlorosis induced by yellows‐fragariae (right)
Host responses to yellows‐ and wilt‐fragariae were partitioned by phytohormone activation and different magnitudes of transcriptional reprogramming
Concurrent with increased symptom severity, the number of differentially expressed genes (DEGs) was always greater in plants inoculated with yellows‐fragariae isolates compared with the wilt‐fragariae or non‐pathogenic isolates [Figure 2(A)]. By 13 dpi, the magnitude of transcriptional reprogramming in yellows‐fragariae‐inoculated plants dwarfed that which occurred in response to the wilt‐fragariae isolate [Figure 2(A)]. At both timepoints, transcriptome patterns were distinct between yellows‐ and wilt‐fragariae [Figure 2(B)]. Moreover, there was an association between transcriptional differences and symptom phenotype [Figures 1 and 2(A,B)]. For example, very few genes (<0.002%) were differentially expressed between treatments where all plants were asymptomatic [Figures 1 and 2(A)]. Likewise, for treatments where all plants showed the same disease phenotype, such as yellows‐fragariae‐inoculated at 6 or 13 dpi, there were similar host transcriptional responses [Figures 1 and 2(A,B)].
FIGURE 2.

Transcriptional responses of strawberry cultivar ‘Camarosa’ to five isolates of Fusarium oxysporum. (A) The number of differentially expressed genes at 6‐ and 13‐days post‐inoculation (dpi) to isolates of F. oxysporum compared to the uninoculated control. (B) Principal component analysis of log2(counts per million) for each sample at 6 dpi (left) and 13 dpi (right). (C) Heatmap of phytohormone pathway genes hierarchically clustered by log2‐fold change versus the uninoculated control at the same timepoint. Columns depict individual genes whose name is shown at the bottom and colour‐coded blocks at the top indicate the associated phytohormone (row 1) and whether the gene functions in phytohormone biosynthesis or downstream signalling (row 2). (D) Heatmap of hierarchically clustered CAZyme log2‐fold changes compared with the uninoculated control at the same timepoint. Each column depicts a different gene whose predicted CAZyme function is colour‐coded in the top row
Substantial differences were observed in the phytohormone responses to the two pathotypes [Figure 2(C)]. In total, 190 strawberry genes were identified that were homologous to previously characterized phytohormone pathway genes in other plant species; 57 were in the JA pathway, 57 were associated with ET, 47 were associated with SA and 29 were auxin‐associated (Supporting Information Table S1). Of these 190 genes, 51 were differentially expressed in response to at least one treatment [Figure 2(C)]. Three JA and three ET genes were differentially expressed in response to both yellows‐ and wilt‐fragariae isolates at 13 dpi. Most phytohormone genes commonly induced by yellows‐fragariae isolates were associated with the JA pathway at both timepoints [9 JA/11 total at 6 dpi and 25 JA/29 total at 13 dpi; Figure 2(C)]. In contrast, the wilt‐fragariae isolate induced differential expression for fewer phytohormone genes overall and half were ET‐related at each timepoint [1 ET/2 total at 6 dpi and 7 ET/14 total at 13 dpi; Figure 2(C)]. Gene ontology analysis supported a distinction between yellows‐ and wilt‐fragariae based on activation of JA‐related genes; ‘JA biosynthetic process’ was consistently enriched at 6 and 13 dpi in plants inoculated with yellows‐fragariae isolates compared to inoculation with the wilt‐fragariae isolate (Supporting Information Figure S1).
SA and auxin‐related genes did not show strong pathotype‐specific patterns of expression, and few genes related to these hormone pathways were differentially expressed. However, some evidence for suppression of SA and defence‐related gene expression was observed in yellows‐fragariae‐inoculated plants. At 13 dpi all four homeologs of NAC072 (NAC = ‘petunia N AC and Arabidopsis A TAF1, ATAF2 and C UC2’ transcription factor) were upregulated in response to all yellows‐fragariae isolates and one was upregulated in response to BRIP62122 [Figure 2(C)]. NAC072 functions in JA‐mediated suppression of SA accumulation in Arabidopsis thaliana (Zheng et al., 2012). More robust upregulation of NAC072 in yellows‐fragariae‐infected plants compared with wilt‐fragariae is consistent with greater induction of JA‐related genes. Additionally, all four MYC2 genes, which suppress JA‐related defences and upregulate the senescence‐associated genes in Arabidopsis thaliana (Kidd et al., 2011; Lorenzo et al., 2004), were upregulated only in response to yellows‐fragariae [Figure 2(C)]. These data suggest that JA activation could be a susceptibility factor in the strawberry/yellows‐fragariae interaction by suppressing SA activation and promoting senescence‐associated responses.
Wilt‐fragariae symptoms were associated with activation of ET pathway and genes involved in cell wall reorganization
Compared to the non‐pathogenic isolate or water controls, many transcriptional differences in wilt‐fragariae‐inoculated plants at 13 dpi were associated with cell wall re‐organization or have characterized roles in fruit softening. For example, multiple carbohydrate‐active enzyme (CAZyme)‐associated GO terms were enriched at this timepoint relative to the non‐pathogen (GL1804) treatment: ‘carbohydrate metabolic process’, ‘cell wall macromolecule catabolic process’, ‘cellulose biosynthetic process’ and ‘chitin catabolic process’ (Supporting Information Figure S2; Supporting Information Table S2). Among dbCAN2‐annotated CAZymes, there were 75 DEGs in response to BRIP62122; only eight of these were also differentially expressed in response to GL1804 [Figure 2(D); Supporting Information Table S3]. In addition, seven expansin genes (out of 17 total expansin homologues) were highly upregulated at 13 dpi in BRIP62122‐inoculated plants (relative to either the water or non‐pathogenic F. oxysporum controls; Supporting Information Table S4). Three of these expansins were commonly DE by all pathogenic isolates at 13 dpi, but not by the non‐pathogenic isolate, compared to the water control (Supporting Information Table S4). Expansins non‐enzymatically promote cell wall loosening and are associated with strawberry fruit softening and root symbioses with arbuscular mycorrhizae (Harrison et al., 2001; Mohanty et al., 2018).
The non‐pathogenic isolate induced minimal plant responses
There were remarkably few transcriptional differences between the water‐inoculated control plants and plants inoculated with GL1804. Between 78,508 and 84,485 strawberry genes (out of 108,087 total predicted genes) showed evidence of expression in plants inoculated with GL1804 (Supporting Information Table S5); only three and 131 genes were differentially expressed at 6‐ and 13‐days post‐inoculation, respectively [Figure 2(A)]. The only significantly enriched GO term at 6‐days post‐inoculation was ‘response to oxidative stress’, associated with a catalase‐peroxidase gene. At 13‐days post‐inoculation, the most enriched GO term was ‘oxidation–reduction process’ (Supporting Information Figure S3).
Fungal genome assemblies
The three new fungal assemblies were chromosome‐scale, with most core chromosomes assembled in a single contig and several assembled with telomeric repeats on both 5′ and 3′ ends (Table 1). Each yellows‐ and wilt‐fragariae assembly had 2–5 contigs representing >95% of the accessory genome; these were potentially full‐length accessory chromosomes.
TABLE 1.
Fungal genome assembly statistics
| Isolate a | Pathotype b | Assembly length (bp) | Num. scaffolds | Num. contigs | N50 (Mbp) | Assembly version c | GenBank accession d |
|---|---|---|---|---|---|---|---|
| BRIP62122 | Wilt‐fragariae | 51,483,211 | 30 | 30 | 4.95 | Version 2 | WIMV00000000 |
| MAFF727510 | Yellows‐fragariae | 57,345,529 | 41 | 41 | 4.48 | Version 2 | WILW00000000 |
| GL1315 | Yellows‐fragariae | 56,139,770 | 99 | 177 | 4.76 | Version 2 | WIMK00000000 |
| GL1381 | Yellows‐fragariae | 56,962,690 | 33 | 60 | 4.36 | Version 2 | WIMJ00000000 |
| GL1804 | f. sp. mori | 51,609,418 | 1169 | 1190 | 0.34 | Version 1 | WIMB00000000 |
The ID for each isolate of Fusarium oxysporum.
The F. oxysporum f. sp. fragariae pathotype or alternate forma specialis (f. sp.).
The genome assembly version for each isolate. The assemblies for GL1381 and GL1804 were previously published in Henry et al., 2021.
The GenBank accession for the genome sequencing project.
Conserved gene expression was minimally impacted by pathotype
The core chromosomes of each fungal isolate were very similar based on gene content and transcriptomic patterns. Each isolate contained between 12,593 and 13,784 predicted genes on core chromosomes (Supporting Information Table S7). Of these, 10,640 predicted genes were identified as homologues present in all isolates and ~12%–18% were differentially expressed in planta [Figure 3(A); Supporting Information Table S7]. The percentage of reads from inoculated roots that mapped to fungal genomes ranged between 0.6% and 17.7% of the total (Supporting Information Table S6). In planta expression patterns for conserved genes strongly differed from in vitro expression patterns for all isolates (Supporting Information Figure S4). However, the overall in planta expression patterns among these conserved genes did not clearly differentiate the pathotypes [Figure 3(B)]. Furthermore, while plant expression of CAZymes was distinct for yellows‐fragariae‐infected plants at 13 dpi, fewer differences were observed among patterns of fungal CAZyme expression [Figure 3(C); Supporting Information Table S8]. The yellows‐fragariae isolates at 13 dpi hierarchically clustered with the non‐pathogenic isolate's 6 dpi expression pattern [Figure 3(C)].
FIGURE 3.
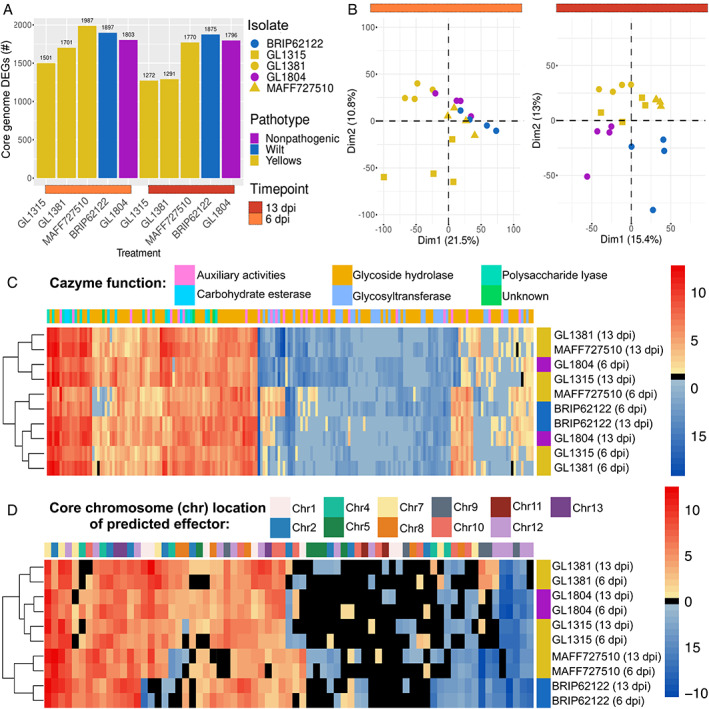
Core genome homologues for five Fusarium oxysporum isolates with differential expression during strawberry root colonization versus in vitro growth. (A) The number of differentially expressed genes that were conserved across the five fungal isolates and located on core chromosomes. (B) Principal component analysis of log2(counts per million) gene expression during strawberry root infection. (C) Differential expression of predicted CAZYmes. Each column depicts a different gene whose predicted CAZyme function is colour coded in the row at the top. (D) Heatmap of hierarchically clustered differentially expressed core genome effectors. The core chromosome upon which each effector was identified is colour‐coded in the first row
Differential expression of core genome effectors does not distinguish pathogenic and non‐pathogenic isolates
On the F. oxysporum core chromosomes, we identified 79 DEGs that were predicted to be effectors (Supporting Information Table S9). The majority (n = 69; 87% of total) of these genes had no pathogen or pathotype‐specific patterns of expression; they were either not commonly DE by any group (n = 41) or were commonly DE by all isolates [n = 28; Figure 3(D)]. Only six of these genes differentiated yellows‐ from wilt‐fragariae, and four were commonly DE by yellows‐ and wilt‐fragariae but not the non‐pathogen [Figure 3(D)]. Overall, these data suggest that expression of effectors on core chromosomes may be generally required for root colonization, even by non‐pathogenic isolates.
A small number of accessory genes are upregulated in planta by all yellows‐fragariae isolates and located on predicted pathogenicity chromosomes
There were 39, 35 and 40 DEGs on accessory chromosomes (in planta vs. in vitro) for GL1381, GL1315 and MAFF727510, respectively (Figure 4). With homologues identified using 80% reciprocal best BLAST hit sequence similarity and coverage thresholds, 15 of these genes were determined to be homologues and upregulated by all three yellows‐fragariae isolates (Table 2, Supporting Information Figure S5, Supporting Information Table S10). Thus, 37%–42% of yellows‐fragariae DE accessory genes were commonly upregulated during root infection. This group of commonly upregulated genes included six predicted effectors (by either EffectorP version 1 or 2), and several genes with possible functions associated with secondary metabolite biosynthesis or transcriptional regulation (Table 2, Supporting Information Table S10).
FIGURE 4.

Commonly upregulated yellows‐fragariae genes on putative pathogenicity chromosomes. (A) Ideograms depict accessory chromosomes with a predicted function in strawberry pathogenicity for GL1381 (dark blue), GL1080 (light tan), MAFF727510 (teal) and GL1315 (yellow). Red lines on the ideogram indicate the positions of miniature impala (mimp) transposons. Minor ticks are spaced at 100 kbp intervals; major ticks are at 1 Mbp intervals. Tracks B–E depict the proportion of each 10 kbp window covered with: (B) DNA transposons, (C) LTRs, (D) LINEs, (E) coding sequences and (F) sequences conserved across 27 isolates of yellows‐fragariae representing eight core‐genome phylogenetic lineages. Track (G) indicates the log2 fold change of differentially expressed genes on a scale of −10 to 14. Links between ideograms illustrate the positions of 15 homologues that are commonly upregulated during strawberry root infection
TABLE 2.
Fifteen genes commonly upregulated during strawberry infection by yellows‐fragariae isolates
| Homologue ID a | GL1381 gene ID b | Min. logFC (13 dpi) c | Min. percent identity d | Annotation e | Predicted function f |
|---|---|---|---|---|---|
| 1a | gl1381.NS.00017* | 3.8 | 99.9% | Effector (Pep1) | Host defence manipulation |
| 2a | gl1381.NS.00459 | 5.2 | 100.0% | Acetyl‐CoA synthetase‐like | SM biosynthesis |
| 3a | gl1381.NS.00457 | 7.6 | 100.0% | Cytochrome P450, E class, Type IV | SM biosynthesis |
| 4a | gl1381.NS.00451 | 6.4 | 94.0% | SAM‐dependent methyltransferase | Epigenetic regulation, SM biosynthesis |
| 5a | gl1381.NS.00450 | 3.9 | 99.9% | FAD/NAD(P)‐binding | SM biosynthesis |
| 6a | gl1381.NS.00121 | 8.9 | 100.0% | Effector | Host defence manipulation |
| 7a | gl1381.NS.00122 | 9.2 | 100.0% | Effector | Host defence manipulation |
| 8a | gl1381.NS.00493 | 7.2 | 99.9% | Possible G‐coupled protein receptor | N/A |
| 9a | gl1381.PGN.00539 | 10.4 | 98.7% | Effector | Host defence manipulation |
| 10a | gl1381.NS.00505 | 9.9 | 99.9% | Hydroxylase/desaturase AsaB‐like | SM biosynthesis |
| 11a | gl1381.NS.00504 | 9.0 | 100.0% | Cytochrome P450, E class, Type I | SM biosynthesis |
| 12a | gl1381.PGN.00540* | 10.2 | 99.7% | Effector | Host defence manipulation |
| 13a | gl1381.NS.00458 | 7.1 | 99.9% | Nitrogen metabolite repression protein NMRA family member | Gene regulation |
| 14a | gl1381.NS.00456 | 6.5 | 94.8% | SAM‐dependent methyltransferase | Epigenetic regulation |
| 15a | gl1381.NS.00497* | 4.4 | 97.7% | Effector | Host defence manipulation |
The yellows‐fragariae homologue ID corresponding to Supplementary Table S10.
The gene ID for the sequence representative from GL1381. Bolded gene IDs with an asterisk have a homologue in BRIP62122 above 80% reciprocal sequence identity and coverage thresholds. Only Pep1 (gl1381.NS.00017) was also differentially expressed by BRIP62122 in planta.
The minimum logFC observed at 13 days post‐inoculation (dpi) for the homologue in GL1381, GL1315 and MAFF727510.
The minimum percent identity between the homologous sequence in GL1381, GL1315, MAFF727510 and GL1080.
The predicted annotation for each gene.
The predicted function during plant colonization.
For GL1381, all 15 of these commonly expressed accessory genes were on the predicted pathogenicity chromosome, chrY‐frag.T1381. However, for MAFF727510 and GL1315 these genes were found on two different contigs (Figure 4). For all isolates, the accessory regions containing these genes were enriched with miniature impala (mimp) transposons that have previously been associated with phytopathogenicity‐related genes (Figure 4) (Schmidt et al., 2013; van Dam et al., 2016).
A putative ‘pathogenicity island’ identified on a wilt‐fragariae accessory chromosome contains upregulated genes associated with pathogenicity
The BRIP62122 accessory genome was primarily comprised of two contigs: both were chromosome‐length (1.23 and 1.14 Mbp), both contained an A/T‐rich, putative centromeric, region. One contig (tig00026388) was fully assembled as a chromosome with both 5′ and 3′ telomeric repeats. The majority (n = 15) of this isolate's in planta DE accessory genes (n = 26 total) were clustered in a ~150 kbp region of one accessory chromosome (ChrW2‐frag) (Figure 5; Supporting Information Table S11). This region coincided with an ‘island’ of sequences that were highly conserved in both W1 and W2 genotypes of Australian wilt‐fragariae (Henry et al., 2021), enriched with mimps (1 per 50 kbp in this region versus 1 per 95 kbp on the other accessory chromosome or 1 per 1259 kbp genome‐wide) and contained all SIX genes in this isolate's genome [SIX1a, SIX1b, SIX1c and SIX13; Figure 5(C)]. The SIX genes identified here were identical to those reported for this isolate by Czislowski et al. (2018).
FIGURE 5.
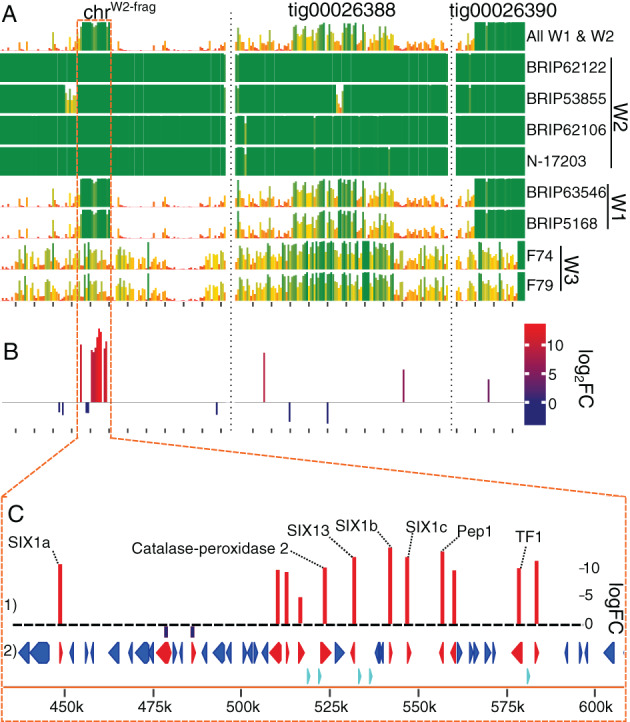
The predicted ‘pathogenicity island’ on a BRIP62122 accessory chromosome. (A) Conservation of BRIP62122's three accessory contigs (chrW2‐frag, tig00026388 and tig00026390) across eight wilt‐fragariae isolates. These isolates represent three core genome phylogenetic lineages (W1, W2 and W3) indicated next to the isolate ID. The y‐axis depicts the proportion of each 10 kbp window that is present in the isolate indicated on the right side of the graph, and x‐axis ticks are every 100 kbp. Sequences present in all six W1 and W2 isolates are shown in the uppermost graph. (B) Bar graph showing the location and log2(fold‐change) (log2FC) of differentially expressed genes on the chromosomes shown in panel (A). (C) Higher resolution depiction of the predicted pathogenicity island outlined with a dashed orange line in panels (A) and B. (1) Differentially expressed genes and their annotations. (2) Predicted coding sequences in this region; those differentially expressed are coloured red, while those not differentially expressed are in blue. Teal triangles denote the positions of miniature impala (mimp) sequences. Base‐pair coordinates for this region on chrW2‐frag are indicated at the bottom
Most genes in this ~150 kbp region that were upregulated in planta have been assigned virulence functions in other Fusarium wilt pathosystems. For example, all four of the SIX genes in this cluster were highly upregulated in planta (logFC >10.6). SIX1 was identified as a virulence factor in multiple Fusarium wilt pathosystems (Li et al., 2016; Widinugraheni et al., 2018). There was also a TF1 transcription factor homologue in this region; homologues of this gene have been shown to regulate expression of SIX genes and their disruption reduces virulence (Niño‐Sánchez et al., 2016). The catalase‐peroxidase gene could have a function in responding to plant‐induced oxidative stress (Blackman & Hardham, 2008). Pep1 has been assigned a virulence function in other Fusarium wilt pathosystems (Coleman et al., 2011), and was upregulated by all five F. oxysporum isolates, although in the accessory genome Pep1 homologues are frequently upregulated during infection by diverse F. oxysporum isolates (Henry et al., 2020; van Dam et al., 2016). Therefore, we considered this region a putative ‘pathogenicity island’ that likely carries essential virulence factors for pathogenicity on strawberry.
DISCUSSION
The infection‐specific transcriptomes of strawberry and Fof demonstrate that closely related strains can harbour multiple, polygenic mechanisms for the same host‐specific pathogenicity phenotype. Upregulated, pathogenicity‐associated genes on accessory chromosomes were almost entirely distinct and lacked homologues between these pathotypes. These distinctions suggest the pathotypes convergently evolved the ability to cause strawberry wilting without selection for the same ancestral genes and without horizontal transfer of pathogenicity determinants.
Furthermore, these data suggest that strawberry pathogenicity independently arose at least two times among isolates classified as wilt‐fragariae. Of the three genotypes of wilt‐fragariae identified in Henry et al. (2021), the isolate profiled by transcriptomics in this study, BRIP62122 (W2), was from Australia and its putative pathogenicity island was only found in the other Australian wilt‐fragariae genotype (W1), and not in the genotype from Spain (W3; Figure 5). This strongly suggests that W1 and W2 share pathogenicity determinants that are distinct from those in the W3 genotype. Moreover, we hypothesize that genes in the W2 pathogenicity island are also DE by W1 isolates; this assertion is supported by the observation that accessory DEGs are commonly upregulated by yellows‐fragariae isolates. Future work is necessary to experimentally test this hypothesis.
Given the differentiation between W1/W2, W3 and yellows‐fragariae accessory genomes, the ability to cause strawberry wilt disease must have independently evolved at least three times in F. oxysporum. Agricultural production systems select for microbes that can exploit host tissues for their reproductive potential. By chance, strains may be adapted for host‐specific pathogenicity and selected from the resident microbiota (Stukenbrock & McDonald, 2008). Given the lack of commonality between DE accessory genes, these data suggest strawberry cultivation selected from endemic strains with pre‐adapted pathogenic potential in Australia (wilt‐fragariae W1 and W2), Spain (wilt‐fragariae W3) and East Asia (yellows‐fragariae) (Henry et al., 2021).
Although we only included one representative of the wilt‐fragariae pathotype (W2) for transcriptome profiling, we believe it is reasonable to assume that another wilt‐fragariae isolate from W1 and W2 would cause a similar transcriptional response under the tested conditions. This supposition is based on the observations that: (i) host responses were remarkably consistent for three yellows‐fragariae isolates, (ii) the W1 and W2 genotypes share putative pathogenicity determinants (Figure 5) and (iii) host transcriptomic response was broadly associated with symptom phenotype [Figures 1 and 2(A,B)]. Additional work is needed to test the generality of these findings across timepoints, environmental conditions, cultivars and isolates of wilt‐fragariae.
Regardless of the generality of responses to other W1 and W2 wilt‐fragariae isolates, representatives of the two pathotypes in this study clearly induced different symptoms and host transcriptomic responses. In this study, the cultivar ‘Camarosa’ acted as a ‘differential’ to examine the symptom‐associated differences in transcriptional response. These observations demonstrate that host responses can be highly divergent for isolates in a single forma specialis. There is high genetic variability in F. oxysporum, and our results indicate that susceptibility‐associated responses may not be conserved between pathosystems.
The search for common features of susceptibility‐associated responses remains worthwhile and could accelerate with an increasing number of studies conducted in non‐model organisms. Potentially generalizable hypotheses arising from the present study are that JA responses contribute to the development of chlorosis, or that ‘yellows’ syndromes caused by F. oxysporum are broadly reliant on JA‐dependent susceptibility. An association between JA responses and chlorosis has now been documented in at least two formae speciales: F. oxysporum f. sp. conglutinans (Foc) and yellows‐fragariae. In A. thaliana and Brassica oleracea, JA activation is a susceptibility factor for Foc, which causes foliar periveinal chlorosis (Cole et al., 2014; Thatcher et al., 2009). Because of chlorosis symptoms, disease caused by Foc is called ‘Fusarium yellows’ (American Phytopathological Society list of crucifer diseases, accessed January 2022; https://www.apsnet.org/edcenter/resources/commonnames/Pages/Crucifers.aspx). However, chlorosis in yellows‐fragariae‐infected strawberry plants is initially most severe on newly formed leaves and is observed later in older leaves. Future investigations are needed to clarify whether there is a causal relationship between JA responses and chlorosis and whether this relationship can be generalized across formae speciales.
Reorganization of cell walls by plant CAZymes and expansins was associated with symptom formation for both pathotypes. Plants infected with yellows‐fragariae isolates had widespread CAZyme re‐programming of hundreds of genes at 13 dpi and seven out of 17 expansins were commonly differentially expressed by all yellows‐fragariae isolates. There was a simultaneous re‐programming of yellows‐fragariae CAZyme expression; the CAZyme expression profiles for the three yellows‐fragariae isolates at 13 dpi clustered together, distinct from most other treatments and timepoints. In response to wilt‐fragariae, the differential expression of CAZymes and upregulation of expansin genes occurred at the time of symptom onset, 13 dpi. Upregulation of expansins in these root tissues in response to both pathotypes is notable, as they are not known to be highly expressed in strawberry roots (Harrison et al., 2001; Mut et al., 2008). Given their function in cell wall expansion, fruit softening and mycorrhizal symbiosis (Mohanty et al., 2018), these genes may be acting as susceptibility factors that facilitate fungal colonization.
There are few observations similar to an ~150 kbp horizontally transferred region integrated into an accessory chromosome that lacks the signatures of horizontal transfer. Typically, accessory chromosomes are transferred in their entirety or not at all (Li et al., 2020a; van Dam et al., 2017; Vlaardingerbroek et al., 2016). In other fungal species, smaller regions of 11 kbp have also been horizontally transferred by an unknown mechanism (Friesen et al., 2006). The most similar example may be from yellows‐fragariae, where less than half of chrY‐frag.T1381 is conserved across all yellows‐fragariae isolates, suggesting these sequences merged with lineage‐specific accessory regions multiple times (Henry et al., 2021). Chromosome rearrangements are common in Fusarium oxysporum (Boehm et al., 1994), and the pathogenicity island could have been integrated into the accessory chromosome after transfer as part of a mobile chromosome. Regardless of the mechanism, colocalization of virulence factors could improve the fitness of these genetic elements that together confer new adaptations to their recipient (van der Does & Rep, 2007).
In addition to colocalization, there would be an evolutionary advantage for smaller numbers of genes to confer host‐specific pathogenicity, as this would increase the likelihood of phenotype gain upon horizontal transfer. The results of this study indicate that relatively few accessory genes may be needed to determine host‐specific pathogenicity in F. oxysporum. Only 15 genes on accessory chromosomes were commonly DE (and all were upregulated) by the three yellows‐fragariae isolates during infection. For the wilt‐fragariae isolate, there were 15 DEGs in the predicted pathogenicity island. Congruent with these observations, past work demonstrated that a partial pathogenicity chromosome was sufficient to confer virulence on tomato (Li et al., 2020b), and single gene disruptions altered the host ranges of Foc and F. oxysporum f. sp. radicis‐cucumerinum (Ayukawa et al., 2021; Li et al., 2021). Combined, these studies suggest that drastic differences in disease outcomes may result from a small number of genes.
It is possible that the number of DEGs we discovered was artificially low due to methodological limitations. The abundance of host mRNA for all samples limited the depth of coverage we could achieve for the in planta fungal transcriptomes and restricted our observations to the most highly upregulated genes (Supporting Information Table S5). However, multiple studies show known virulence genes, such as SIX genes, are among the most highly upregulated during infection (Thatcher et al., 2016; van Dam et al., 2016), which indicates that our methods were sufficient for identifying key virulence factors. Functional genetics studies can build upon our observations to define the minimum number of genes that confer host‐specific pathogenicity on strawberry.
Although the pathogenicity‐associated DEGs in yellows‐ and wilt‐fragariae were mostly not homologous, some commonalities were observed between their predicted functions. Many upregulated accessory genes were predicted effectors; there were six effectors out of 15 for common DEGs in yellows‐fragariae and five effectors out of 15 wilt‐fragariae pathogenicity island DEGs (Table 2; Supplementary Table S11). Potentially, these distinct repertoires of effectors enabled the two pathotypes to suppress host defences by different mechanisms. Both pathotypes had two upregulated accessory homologues of S‐adenosyl‐methionine (SAM) methyltransferases (Table 2; Supplementary Table S11), which are a diverse class of enzymes with potential functions in epigenetic transcriptional regulation, secondary metabolite biosynthesis and others (Luo et al., 2019). Notably, SAM methyltransferase homologues from Plasmodiophora brassicae suppress plant SA‐dependent defence responses by methylating SA (Ludwig‐Müller et al., 2015). These similarities show that some common types of virulence‐associated genes are present in both pathotypes, although we postulate that, given the difference in chlorosis symptoms, different host targets are involved.
Consistent with past observations (Guo et al., 2021), we did not uncover evidence that the F. oxysporum core genome was responsible for host‐specific pathogenicity. Effectors and CAZymes can play important roles during plant colonization and pathogenesis (Menna et al., 2021; Zhao et al., 2013), but the expression of predicted effectors and fungal CAZymes on core chromosomes was mostly consistent across all isolates. There were similar numbers of DEGs in the core genome for each isolate. Broad expression patterns profiled by principal component analysis somewhat differentiated the pathotypes at 13 dpi. This could be a result of metabolic reprogramming to hosts that, by 13 dpi, presented substantially different growth environments due to symptom formation. By contrast, the pathotypes had almost entirely distinct accessory genome DEGs. Almost half of accessory yellows‐fragariae DEGs were commonly differentially expressed by all isolates of this pathotype. Although the core genome may be essential to endophytic plant colonization, these and past observations indicate the genes required for host‐specific pathogenicity reside on accessory chromosomes.
Convergent evolution among fungal plant pathogens is an important phenomenon for identifying effective management responses. Differentiation between independently evolved pathotypes provides a rational basis for developing phytosanitary regulations and efforts to breed durably resistant strawberry cultivars. Molecular diagnostic markers may also need to differentiate convergently evolved lineages. Therefore, understanding the frequency and mechanisms of convergent evolution is an important objective for the study of pathogen evolutionary biology. This exploration of host and pathogen transcription during symptom formation demonstrates that convergently evolved pathogens can have divergent mechanisms of pathogenicity that induce distinct host responses. These data provide the basis for future dissection of susceptibility factors in strawberry and pathogenicity factors in Fof.
CONFLICT OF INTEREST
The authors declare that they have no conflict of interest regarding this work.
Supporting information
SUPPORTING INFORMATION FIGURE S1 Significantly enriched Gene Ontology (GO) terms for yellows‐fragariae treatments (GL1315, GL1381, MAFF727510) contrasted with wilt‐fragariae (BRIP62122). The isolate and timepoint are listed on the bottom of the x‐axis, where ‘6 dpi’ = 6 days post‐inoculation and ‘13 dpi’ = 13 days post‐inoculation
SUPPORTING INFORMATION FIGURE S2 Significantly enriched Gene Ontology (GO) terms for strawberry‐pathogenic treatments (yellows‐ and wilt‐fragariae: GL1315, GL1381, MAFF727510, and BRIP62122) versus the non‐pathogenic isolate treatment (GL1804). The isolate and timepoint are listed on the bottom of the x‐axis, where ‘6 dpi’ = 6 days post‐inoculation and ‘13 dpi’ = 13 days post‐inoculation
SUPPORTING INFORMATION FIGURE S3 Significantly enriched Gene Ontology (GO) terms for F. oxysporum‐inoculated treatments (GL1315, GL1381, MAFF727510, BRIP62122, and GL1804) versus the uninoculated control treatment. The isolate and timepoint are listed on the bottom of the x‐axis, where ‘6 dpi’ = 6 days post‐inoculation and ‘13 dpi’ = 13 days post‐inoculation
SUPPORTING INFORMATION FIGURE S4 Principal components analysis of log2(counts per million) gene expression on fungal genomes from all in planta and in vitro samples. Isolate codes are as follows: ‘1315’ = GL1315, ‘1381’ = GL1381, ‘1804’ = GL1804, ‘621’ = BRIP62122, and ‘727’ = MAFF727510. To the right of isolate codes is the timepoint, where ‘6d’ = 6 days post‐inoculation in planta, ‘13d’ = 13 days post‐inoculation in planta, and ‘IV’ = 72 h post‐inoculation in vitro on potato dextrose agar
SUPPORTING INFORMATION FIGURE S5 Venn diagram of homology between differentially expressed accessory genes in GL1381, GL1315, and MAFF727510
SUPPORTING INFORMATION TABLE S1 Phytohormone homologues identified from annotated Camarosa transcripts, citations (DOIs) for their role in phytohormone pathways, whether their role was in biosynthesis or signalling, and logFC compared to water for each treatment/timepoint
SUPPORTING INFORMATION TABLE S2 Significant GO terms from the comparison of strawberry gene expression between BRIP62122 (wilt‐fragariae) and GL1804 (non‐pathogen) at 13 dpi.
SUPPORTING INFORMATION TABLE S3 Annotation and log‐fold change of strawberry CAZymes.
SUPPORTING INFORMATION TABLE S4 Camarosa expansin genes that were differentially expressed in response to BRIP62122 infection
SUPPORTING INFORMATION TABLE S5 Statistics on read alignment to the Camarosa genome, UMI detection, and gene feature counts
SUPPORTING INFORMATION TABLE S6 Statistics on read alignment to the fungal genomes, UMI detection, and gene feature counts
SUPPORTING INFORMATION TABLE S7 The number of predicted genes (with and without transposons) in each core and accessory genome, and the number of homologues on each core chromosome
SUPPORTING INFORMATION TABLE S8 Annotation and log‐fold change of fungal core genome CAZymes. Only the gene ID for GL1381 is shown, but a homologue was identified in each isolate
SUPPORTING INFORMATION TABLE S9 Table about the fungal core genome effectors. Contains log‐fold change (logFC) values for each isolate/timepoint combination and the core chromosome where they reside
SUPPORTING INFORMATION TABLE S10 Yellows‐fragariae accessory genome differentially expressed genes. Homologous genes between yellows‐fragariae isolates are depicted in the same row
SUPPORTING INFORMATION TABLE S11 Wilt‐fragariae accessory genome differentially expressed genes
SUPPORTING INFORMATION TABLE S12 National Center for Biotechnology Information (NCBI) Sequence Read Archive (SRA) accessions for raw reads corresponding to each sample, treatment, and timepoint presented in this study
ACKNOWLEDGEMENTS
This manuscript is dedicated to the memory of our mentor, Dr. Thomas R. Gordon. We thank Christine Singh for technical assistance, the Foundation Plant Services (University of California, Davis) for donating tissue‐cultured strawberry plants for this study, and Dr. Lynn Epstein for conducting a pre‐submission review.
Jenner, B.N. & Henry, P.M. (2022) Pathotypes of Fusarium oxysporum f. sp. fragariae express discrete repertoires of accessory genes and induce distinct host transcriptional responses during root infection. Environmental Microbiology, 24(10), 4570–4586. Available from: 10.1111/1462-2920.16101
Funding information Agricultural Research Service; National Institute of Food and Agriculture, Grant/Award Number: 2017‐51181‐26833; NSF Graduate Research Fellowship Program; University of California, Davis DNA Technologies Core
DATA AVAILABILITY STATEMENT
All raw reads and assemblies associated with this project are available from PRJNA578477. Specific sequence read archive (SRA) accessions can be found in Supporting Information Table S12 and assembly accessions are provided in Table 1. Any additional information will be made available upon request.
REFERENCES
- Alexa, A. & Rahnenfuhrer, J. (2021) topGO: Enrichment Analysis for Gene Ontology. R package version 2.46.0.
- Anders, S. , Pyl, P.T. & Huber, W. (2015) HTSeq: a python framework to work with high‐throughput sequencing data. Bioinformatics, 31, 166–169. [DOI] [PMC free article] [PubMed] [Google Scholar]
- Ayukawa, Y. , Asai, S. , Gan, S. , Tsushima, A. , Ichihashi, Y. , Shibata, A. et al. (2021) A pair of effectors encoded on a conditionally dispensable chromosome of Fusarium oxysporum suppress host‐specific immunity. Nature Communications Biology, 4, 1–12. [DOI] [PMC free article] [PubMed] [Google Scholar]
- Berens, M.T. , Berry, H.M. , Mine, A. , Argueso, C.T. & Tsuda, K. (2017) Evolution of hormone signaling networks in plant defense. Annual Review of Phytopathology, 55, 401–425. [DOI] [PubMed] [Google Scholar]
- Biju, V.C. , Fokkens, L. , Houterman, P.M. , Rep, M. & Cornelissen, B.J.C. (2016) Multiple evolutionary trajectories have led to the emergence of races in Fusarium oxysporum f. sp. lycopersici . Applied and Environmental Microbiology, 83, 1–20. [DOI] [PMC free article] [PubMed] [Google Scholar]
- Blackman, L.M. & Hardham, A.R. (2008) Regulation of catalase activity and gene expression during Phytophthora nicotianae development and infection of tobacco. Molecular Plant Pathology, 9, 495–510. [DOI] [PMC free article] [PubMed] [Google Scholar]
- Boehm, E.W.A. , Ploetz, R. & Kistler, H.C. (1994) Statistical analysis of electrophoretic karyotype variation among vegetative compatibility groups of Fusarium oxysporum f. sp. cubense . Molecular Plant Microbe Interactions, 7, 196–207. [Google Scholar]
- Carlier, J. , Bonnot, F. , Roussel, V. , Ravel, S. , Martinez, R.T. , Perez‐Vicente, L. et al. (2021) Convergent adaptation to quantitative host resistance in a major plant pathogen. mBio, 12, 1–18. [DOI] [PMC free article] [PubMed] [Google Scholar]
- Chakraborty, M. , Baldwin‐Brown, J.G. , Long, A.D. & Emerson, J.J. (2016) Contiguous and accurate de novo assembly of metazoan genomes with modest long read coverage. Nucleic Acids Research, 44, 1–12. [DOI] [PMC free article] [PubMed] [Google Scholar]
- Cole, S.J. , Yoon, A.J. , Faull, K.F. & Diener, A.C. (2014) Host perception of jasmonates promotes infection by Fusarium oxysporum formae speciales that produce isoleucine‐ and leucine‐conjugated jasmonates. Molecular Plant Pathology, 15, 589–600. [DOI] [PMC free article] [PubMed] [Google Scholar]
- Coleman, J.J. , Wasmann, C.C. , Usami, T. , White, G.J. , Temporini, E.D. , McCluskey, K. et al. (2011) Characterization of the gene encoding pisatin demethylase (FoPDA1) in Fusarium oxysporum . Molecular Plant Microbe Interactions, 24, 1482–1491. [DOI] [PubMed] [Google Scholar]
- Czislowski, E. , Fraser‐Smith, S. , Zander, M. , O'Neill, W.T. , Meldrum, R. , Tran‐Nguyen, L.T.T. et al. (2018) Investigation of the diversity of effector genes in the banana pathogen, Fusarium oxysporum f. sp. cubense, reveals evidence of horizontal gene transfer. Molecular Plant Pathology, 19, 1155–1171. [DOI] [PMC free article] [PubMed] [Google Scholar]
- van Dam, P. , Fokkens, L. , Schmidt, S.M. , Linmans, J.H.J. , Kistler, H.C. , Ma, L. et al. (2016) Effector profiles distinguish formae speciales of Fusarium oxysporum . Environmental Microbiology, 18, 4087–4102. [DOI] [PubMed] [Google Scholar]
- van Dam, P. , Fokkens, L. , Ayukawa, Y. , van der Gragt, M. , ter Horst, A. , Brankovics, B. et al. (2017) A mobile pathogenicity chromosome in Fusarium oxysporum for infection of multiple cucurbit species. Scientific Reports, 7, 1–15. [DOI] [PMC free article] [PubMed] [Google Scholar]
- Di, X. , Takken, F.L.W. & Tintor, N. (2016) How phytohormones shape interactions between plants and the soil‐borne fungus Fusarium oxysporum . Frontiers in Plant Science, 7, 170. [DOI] [PMC free article] [PubMed] [Google Scholar]
- Dobin, A. , Davis, C.A. , Schlesinger, F. , Drenkow, J. , Zalenski, C. , Jha, S. et al. (2013) STAR: Ultrafast universal RNA‐seq aligner. Bioinformatics, 29, 15–21. [DOI] [PMC free article] [PubMed] [Google Scholar]
- van der Does, H.C. & Rep, M. (2007) Virulence genes and the evolution of host specificity in plant‐pathogenic fungi. Molecular Plant Microbe Interactions, 10, 1175–1182. [DOI] [PubMed] [Google Scholar]
- Dong, C. , Zou, X. & Gao, Q.‐H. (2022) Genome‐wide identification of expansin in Fragaria vesca and expression profiling analysis of the FvEXPs in different fruit development. Gene, 814, 1–10. [DOI] [PubMed] [Google Scholar]
- Edel‐Hermann, V. & Lecompte, C. (2019) Current status of Fusarium oxysporum formae speciales and races. Phytopathology, 109, 512–530. [DOI] [PubMed] [Google Scholar]
- Edger, P.P. , Poorten, T.J. , VanBuren, R. , Hardigan, M.A. , Colle, M. , McKain, M.R. et al. (2019) Origin and evolution of the octoploid strawberry genome. Nature Genetics, 51, 541–547. [DOI] [PMC free article] [PubMed] [Google Scholar]
- English, A.C. , Richards, S. , Han, Y. , Wang, M. , Vee, V. , Qu, J. et al. (2012) Mind the gap: upgrading genomes with Pacific biosciences RS long‐read sequencing technology. PLoS One, 7, 1–12. [DOI] [PMC free article] [PubMed] [Google Scholar]
- Friesen, T.L. , Stukenbrock, E.H. , Liu, Z. , Meinhardt, S. , Ling, H. , Faris, J.D. et al. (2006) Emergence of a new disease as a result of interspecific virulence gene transfer. Nature Genetics, 38, 953–956. [DOI] [PubMed] [Google Scholar]
- Guo, L. , Yu, H. , Wang, B. , Vescio, K. , Delulio, G.A. , Yang, H. et al. (2021) Metatranscriptomic comparison of endophytic and pathogenic Fusarium–Arabidopsis interactions reveals plant transcriptional plasticity. Molecular Plant Microbe Interactions, 34, 1071–1083. [DOI] [PMC free article] [PubMed] [Google Scholar]
- Hackl, T. , Hedrich, R. , Schultz, J. & Förster, F. (2014) proovread: large‐scale high‐accuracy PacBio correction through iterative short read consensus. Bioinformatics, 30, 3004–3011. [DOI] [PMC free article] [PubMed] [Google Scholar]
- Harrison, E.P. , McQueen‐Mason, S.J. & Manning, K. (2001) Expression of six expansin genes in relation to extension activity in developing strawberry fruit. Journal of Experimental Botany, 52, 1437–1446. [DOI] [PubMed] [Google Scholar]
- Henry, P.M. , Kaur, S. , Pham, Q.A. , Barakat, R. , Brinker, S. , Haensel, H. et al. (2020) Genomic differences between the new Fusarium oxysporum f. sp. apii (Foa) race 4 on celery, the less virulent Foa races 2 and 3, and the avirulent on celery f. sp. coriandrii . BMC Genomics, 21, 730. [DOI] [PMC free article] [PubMed] [Google Scholar]
- Henry, P.M. , Pincot, D.D.A. , Jenner, B.N. , Borrero, C. , Avilés, M. , Nam, M.H. et al. (2021) Horizontal chromosome transfer and independent evolution drive diversification in Fusarium oxysporum f. sp. fragariae . New Phytologist, 230, 327–340. [DOI] [PMC free article] [PubMed] [Google Scholar]
- Jacobson, D.J. & Gordon, T.R. (1988) Vegetative compatibility and self‐incompatibility within Fusarium oxysporum f. sp. melonis . Phytopathology, 78, 668–672. [Google Scholar]
- Kajitani, R. , Toshimoto, K. , Noguchi, H. , Toyoda, A. , Ogura, Y. , Okuno, M. et al. (2014) Efficient de novo assembly of highly heterozygous genomes from whole‐genome shotgun short reads. Genome Research, 24, 1384–1395. [DOI] [PMC free article] [PubMed] [Google Scholar]
- Kaur, S. , Pham, Q.A. & Epstein, L. (2017) High quality DNA from Fusarium oxysporum conidia suitable for library preparation and long read sequencing with PacBio. protocolsio: 1‐7.
- Kavroulakis, N. , Ntougia, S. , Zervakis, G.I. , Ehaliotis, C. , Haralampidis, K. & Papadopoulou, K.K. (2007) Role of ethylene in the protection of tomato plants against soil‐borne fungal pathogens conferred by an endophytic Fusarium solani strain. Journal of Experimental Botany, 58, 3853–3864. [DOI] [PubMed] [Google Scholar]
- Kidd, B.N. , Kadoo, N.Y. , Dombrecht, B. , Tekeoglu, M. , Gardiner, D.M. , Thatcher, L.F. et al. (2011) Auxin signaling and transport promote susceptibility to the root‐infecting fungal pathogen Fusarium oxysporum in Arabidopsis . Molecular Plant Microbe Interactions, 24, 733–748. [DOI] [PubMed] [Google Scholar]
- Koren, S. , Walenz, B.P. , Berlin, K. , Miller, J.R. , Bergman, N.H. & Phillippy, A.M. (2017) Canu: scalable and accurate long‐read assembly via adaptive k‐mer weighting and repeat separation. Genome Research, 27, 722–736. [DOI] [PMC free article] [PubMed] [Google Scholar]
- Krzywinski, M.I. , Schein, J.E. , Birol, I. , Connors, J. , Gascoyne, R. , Horsman, D. et al. (2009) Circos: an information aesthetic for comparative genomics. Genome Research, 19, 1639–1645. 10.1101/gr.092759.109 [DOI] [PMC free article] [PubMed] [Google Scholar]
- Langmead, B. & Salzberg, S.L. (2012) Fast gapped‐read alignment with Bowtie2. Nature Methods, 9, 357–360. [DOI] [PMC free article] [PubMed] [Google Scholar]
- Lee, K.M. & Coop, G. (2017) Distinguishing among modes of convergent adaptation using population genomic data. Genetics, 207, 1591–1619. [DOI] [PMC free article] [PubMed] [Google Scholar]
- Li, H. & Durbin, R. (2009) Fast and accurate short read alignment with Burrows‐Wheeler transform. Bioinformatics, 25, 1754–1760. [DOI] [PMC free article] [PubMed] [Google Scholar]
- Li, H. , Handsaker, B. , Wysoker, A. , Fennell, T. , Ruan, J. , Holmer, N. et al. (2009) The sequence alignment map format and SAMtools. Bioinformatics, 25, 2078–2079. [DOI] [PMC free article] [PubMed] [Google Scholar]
- Li, E. , Wang, G. , Xiao, J. , Ling, J. , Yang, Y. & Xie, B. (2016) A SIX1 homolog in Fusarium oxysporum f. sp. conglutinans is required for full virulence on cabbage. PLoS One, 11, 1–15. [DOI] [PMC free article] [PubMed] [Google Scholar]
- Li, J. , Fokkens, L. , van Dam, P. & Rep, M. (2020a) Related mobile pathogenicity chromosomes in Fusarium oxysporum determine host range on cucurbits. Molecular Plant Pathology, 21, 761–776. [DOI] [PMC free article] [PubMed] [Google Scholar]
- Li, J. , Fokkens, L. , Conneely, L.J. & Rep, M. (2020b) Partial pathogenicity chromosomes in Fusarium oxysporum are sufficient to cause disease and can be horizontally transferred. Environmental Microbiology, 22, 4985–5004. [DOI] [PMC free article] [PubMed] [Google Scholar]
- Li, J. , Fokkens, L. & Rep, M. (2021) A single gene in Fusarium oxysporum limits host range. Molecular Plant Pathology, 22, 108–116. [DOI] [PMC free article] [PubMed] [Google Scholar]
- Lorenzo, O. , Chico, J.M. , Sánchez‐Serrano, J.J. & Solano, R. (2004) JASMONATE‐INSENSITIVE1 encodes a MYC transcription factor essential to discriminate between different jasmonate‐regulated defense responses in Arabidopsis . The Plant Cell, 16, 1938–1950. [DOI] [PMC free article] [PubMed] [Google Scholar]
- Ludwig‐Müller, J. , Jülke, S. , Geiß, K. , Richter, F. , Mithöfer, A. , Šola, I. et al. (2015) A novel methyltransferase from the intracellular pathogen Plasmodiophora brassicae methylates salicylic acid. Molecular Plant Pathology, 16, 394–364. [DOI] [PMC free article] [PubMed] [Google Scholar]
- Luo, H. , Hansen, A.S.L. , Yang, L. , Schneider, K. , Kristensen, M. , Christensen, U. et al. (2019) Coupling S‐adenosylmethionine‐dependent methylation to growth: design and uses. PLoS Biology, 17, 1–13. [DOI] [PMC free article] [PubMed] [Google Scholar]
- Lyons, R. , Stiller, J. , Powell, J. , Rusu, A. , Manners, J.M. & Kazan, K. (2015) Fusarium oxysporum triggers tissue‐specific transcriptional reprogramming in Arabidopsis thaliana . PLoS One, 10, 1–23. [DOI] [PMC free article] [PubMed] [Google Scholar]
- Ma, L. , van der Does, H.C. , Borkovich, K.A. , Coleman, J.J. , Daboussi, M. , Di Pietro, A. et al. (2010) Comparative genomics reveals mobile pathogenicity chromosomes in Fusarium . Nature, 464, 367–373. [DOI] [PMC free article] [PubMed] [Google Scholar]
- Meijer, R.J. & Goeman, J.J. (2016) Multiple testing of gene sets from gene ontology: possibilities and pitfalls. Briefings in Bioinformatics, 17, 808–818. [DOI] [PubMed] [Google Scholar]
- Menna, A. , Dora, S. , Sancho‐Andrés, G. , Kashyap, A. , Meena, M.K. , Sklodowski, K. et al. (2021) A primary cell wall cellulose‐dependent defense mechanism against vascular pathogens revealed by time‐resolved dual transcriptomics. BMC Biology, 19, 1–20. [DOI] [PMC free article] [PubMed] [Google Scholar]
- Miyaji, N. , Shimizu, M. , Miyazaki, J. , Osabe, K. , Sato, M. , Ebe, Y. et al. (2017) Comparison of transcriptome profiles by Fusarium oxysporum inoculation between Fusarium yellows resistant and susceptible lines in Brassica rapa L. Plant Cell Reports, 36, 1841–1854. [DOI] [PubMed] [Google Scholar]
- Mohanty, S.K. , Arthikala, M.‐J. , Nanjareddy, K. & Lara, M. (2018) Plant‐symbiont interactions: the functional role of expansins. Symbiosis, 74, 1–10. [Google Scholar]
- Mut, P. , Bustamante, C. , Martínez, G. , Alleva, K. , Sutka, M. , Civello, M. et al. (2008) A fruit‐specific plasma membrane aquaporin subtype PIP1;1 regulated during strawberry (Fragaria × ananassa) fruit ripening. Physiologia Plantarum, 132, 538–551. [DOI] [PubMed] [Google Scholar]
- Nielsen, H. (2017) Predicting secretory proteins with SignalP. In: Kihara, D. (Ed.) Protein function prediction: methods in molecular biology. New York, NY: Humana Press, pp. 59–73. [DOI] [PubMed] [Google Scholar]
- Niño‐Sánchez, J. , Castillo, V.C. , Tello, V. , de Vega‐Bartol, J.J. , Ramos, B. , Sukno, S.A. et al. (2016) The FTF gene family regulates virulence and expression of SIX effectors in Fusarium oxysporum . Molecular Plant Pathology, 17, 1124–1139. [DOI] [PMC free article] [PubMed] [Google Scholar]
- O'Donnell, K. , Kistler, H.C. , Cigelnik, E. & Ploetz, R. (1998) Multiple evolutionary origins of the fungus causing Panama disease of banana: concordant evidence from nuclear and mitochondrial gene genealogies. Proceedings of the National Academy of Sciences of the United States of America, 95, 2044–2049. [DOI] [PMC free article] [PubMed] [Google Scholar]
- Pastrana, A.M. , Kirkpatrick, S.C. , Kong, M. , Broome, J.C. & Gordon, T.R. (2017) Fusarium oxysporum f. sp. mori, a new forma specialis causing Fusarium wilt of blackberry. Plant Disease, 101, 2066–2072. [DOI] [PubMed] [Google Scholar]
- Quinlan, A.R. & Hall, I.M. (2010) BEDTools: a flexible suite of utilities for comparing genomic features. Bioinformatics, 26, 841–842. [DOI] [PMC free article] [PubMed] [Google Scholar]
- Robinson, M.D. , McCarthy, D.J. & Smyth, G.K. (2010) edgeR: a Bioconductor package for differential expression analysis of digital gene expression data. Bioinformatics, 26, 139–140. [DOI] [PMC free article] [PubMed] [Google Scholar]
- Schmidt, S.M. , Houterman, P.M. , Schreiver, I. , Ma, L. , Amyotte, S. , Chellappan, B. et al. (2013) MITEs in the promoters of effector genes allow prediction of novel virulence genes in Fusarium oxysporum . BMC Genomics, 14, 1–21. [DOI] [PMC free article] [PubMed] [Google Scholar]
- Smith, T. , Heger, A. & Sudbery, I. (2017) UMI‐tools: modeling sequencing errors in unique molecular identifiers to improve quantification accuracy. Genome Research, 27, 491–499. [DOI] [PMC free article] [PubMed] [Google Scholar]
- Sperschneider, J. , Gardiner, D.M. , Dodds, P.N. , Tini, F. , Covarelli, L. , Singh, K.B. et al. (2016) EffectorP: predicting fungal effector proteins from secretomes usimg machine learning. New Phytologist, 210, 743–761. [DOI] [PubMed] [Google Scholar]
- Sperschneider, J. , Dodds, P.N. , Gardiner, D.M. , Singh, K.B. & Taylor, J.M. (2018) Improved prediction of fungal effector proteins from secretomes with EffectorP 2.0. Molecular Plant Pathology, 19, 2094–2110. [DOI] [PMC free article] [PubMed] [Google Scholar]
- Stukenbrock, E.H. & McDonald, B.A. (2008) The origins of plant pathogens in agro‐ecosystems. Annual Review of Phytopathology, 46, 75–100. [DOI] [PubMed] [Google Scholar]
- Tarailo‐Graovac, M. & Chen, N. (2009) Using RepeatMasker to identify repetitive elements in genomic sequences. Current Protocols in Bioinformatics, 4, 1–14. [DOI] [PubMed] [Google Scholar]
- Testa, A.C. , Hane, J.K. , Ellwood, S.R. & Oliver, R.P. (2015) CodingQuarry: highly accurate hidden Markov model gene prediction in fungal genomes using RNA‐seq transcripts. BMC Genomics, 16, 1–12. [DOI] [PMC free article] [PubMed] [Google Scholar]
- Thaler, J.S. , Owen, B. & Higgins, V.J. (2004) The role of the jasmonate response in plant susceptibility to diverse pathogens with a range of lifestyles. Plant Physiology, 135, 530–538. [DOI] [PMC free article] [PubMed] [Google Scholar]
- Thatcher, L.F. , Manners, J.M. & Kazan, K. (2009) Fusarium oxysporum hijacks COI1‐mediated jasmonate signaling to promote disease development in Arabidopsis. The Plant Journal, 58, 927–939. [DOI] [PubMed] [Google Scholar]
- Thatcher, L.F. , Williams, A.H. , Garg, G. , Buck, S.G. & Singh, K.B. (2016) Transcriptome analysis of the fungal pathogen Fusarium oxysporum f. sp. medicaginis during colonisation of resistant and susceptible Medicago truncatula hosts identifies differential pathogenicity profiles and novel candidate effectors. BMC Genomics, 17, 1–19. [DOI] [PMC free article] [PubMed] [Google Scholar]
- Vlaardingerbroek, I. , Beerens, B. , Rose, L. , Fokkens, L. , Cornelissen, B.J.C. & Rep, M. (2016) Exchange of core chromosomes and horizontal transfer of lineage‐specific chromosomes in Fusarium oxysporum . Environmental Microbiology, 18, 3702–3713. [DOI] [PubMed] [Google Scholar]
- de Vries, S. , Stukenbrock, E.H. & Rose, L.E. (2020) Rapid evolution in plant‐microbe interactions — an evolutionary genomics perspective. New Phytologist, 226, 1256–1262. [DOI] [PubMed] [Google Scholar]
- Walker, B.J. , Abeel, T. , Shea, T. , Priest, M. , Abouelliel, A. , Sakthikumar, S. et al. (2014) Pilon: an integrated tool for comprehensive microbial variant detection and genome assembly improvement. PLoS One, 9, e112963. [DOI] [PMC free article] [PubMed] [Google Scholar]
- Wickham, H. (2016) ggplot2: elegant graphics for data analysis. New York: Springer‐Verlag. [Google Scholar]
- Widinugraheni, S. , Niño‐Sánchez, J. , van der Does, H.C. , van Dam, P. , García‐Bastidas, F.A. , Subandiyah, S. et al. (2018) A SIX1 homolog in Fusarium oxysporum f.sp. cubense tropical race 4 contributes to virulence towards Cavendish banana. PLoS One, 13, 1–12. [DOI] [PMC free article] [PubMed] [Google Scholar]
- Xue, R. , Wu, J. , Zhu, Z. , Wang, L. , Wang, X. , Wang, S. et al. (2015) Differentially expressed genes in resistant and susceptible common bean (Phaseolus vulgaris L.) genotypes in response to Fusarium oxysporum f. sp. phaseoli . PLoS One, 10, e0127698. [DOI] [PMC free article] [PubMed] [Google Scholar]
- Ye, C. , Hill, C.M. , Wu, S. , Ruan, J. & Zhanshan, M. (2016) DBG2OLC: efficient assembly of large genomes using long erroneous reads of the third generation sequencing technologies. Scientific Reports, 6, 31900. [DOI] [PMC free article] [PubMed] [Google Scholar]
- Yu, D. , Tang, H. , Zhang, Y. , Yu, H. & Chen, Q. (2012) Comparison and improvement of different methods of RNA isolation from strawberry. Journal of Agricultural Science, 4, 51–56. [Google Scholar]
- Zhang, H. , Yohe, T. , Huang, L. , Entwistle, S. , Wu, P. , Yang, Z. et al. (2018) dbCAN2: a meta server for automated carbohydrate‐active enzyme annotation. Nucleic Acids Research, 46, W95–W101. [DOI] [PMC free article] [PubMed] [Google Scholar]
- Zhao, Z. , Liu, H. , Wang, C. & Xu, J.‐R. (2013) Comparative analysis of fungal genomes reveals different plant cell wall degrading capacity in fungi. BMC Genomics, 14, 1–15. [DOI] [PMC free article] [PubMed] [Google Scholar]
- Zheng, X.‐Y. , Spivey, N.W. , Zheng, W. , Liu, P.‐P. , Fu, Z.Q. , Klessig, D.F. et al. (2012) Coronatine promotes Pseudomonas syringae virulence in plants by activating a signaling cascade that inhibits salicylic acid accumulation. Cell Host and Microbe, 11, 587–596. [DOI] [PMC free article] [PubMed] [Google Scholar]
Associated Data
This section collects any data citations, data availability statements, or supplementary materials included in this article.
Supplementary Materials
SUPPORTING INFORMATION FIGURE S1 Significantly enriched Gene Ontology (GO) terms for yellows‐fragariae treatments (GL1315, GL1381, MAFF727510) contrasted with wilt‐fragariae (BRIP62122). The isolate and timepoint are listed on the bottom of the x‐axis, where ‘6 dpi’ = 6 days post‐inoculation and ‘13 dpi’ = 13 days post‐inoculation
SUPPORTING INFORMATION FIGURE S2 Significantly enriched Gene Ontology (GO) terms for strawberry‐pathogenic treatments (yellows‐ and wilt‐fragariae: GL1315, GL1381, MAFF727510, and BRIP62122) versus the non‐pathogenic isolate treatment (GL1804). The isolate and timepoint are listed on the bottom of the x‐axis, where ‘6 dpi’ = 6 days post‐inoculation and ‘13 dpi’ = 13 days post‐inoculation
SUPPORTING INFORMATION FIGURE S3 Significantly enriched Gene Ontology (GO) terms for F. oxysporum‐inoculated treatments (GL1315, GL1381, MAFF727510, BRIP62122, and GL1804) versus the uninoculated control treatment. The isolate and timepoint are listed on the bottom of the x‐axis, where ‘6 dpi’ = 6 days post‐inoculation and ‘13 dpi’ = 13 days post‐inoculation
SUPPORTING INFORMATION FIGURE S4 Principal components analysis of log2(counts per million) gene expression on fungal genomes from all in planta and in vitro samples. Isolate codes are as follows: ‘1315’ = GL1315, ‘1381’ = GL1381, ‘1804’ = GL1804, ‘621’ = BRIP62122, and ‘727’ = MAFF727510. To the right of isolate codes is the timepoint, where ‘6d’ = 6 days post‐inoculation in planta, ‘13d’ = 13 days post‐inoculation in planta, and ‘IV’ = 72 h post‐inoculation in vitro on potato dextrose agar
SUPPORTING INFORMATION FIGURE S5 Venn diagram of homology between differentially expressed accessory genes in GL1381, GL1315, and MAFF727510
SUPPORTING INFORMATION TABLE S1 Phytohormone homologues identified from annotated Camarosa transcripts, citations (DOIs) for their role in phytohormone pathways, whether their role was in biosynthesis or signalling, and logFC compared to water for each treatment/timepoint
SUPPORTING INFORMATION TABLE S2 Significant GO terms from the comparison of strawberry gene expression between BRIP62122 (wilt‐fragariae) and GL1804 (non‐pathogen) at 13 dpi.
SUPPORTING INFORMATION TABLE S3 Annotation and log‐fold change of strawberry CAZymes.
SUPPORTING INFORMATION TABLE S4 Camarosa expansin genes that were differentially expressed in response to BRIP62122 infection
SUPPORTING INFORMATION TABLE S5 Statistics on read alignment to the Camarosa genome, UMI detection, and gene feature counts
SUPPORTING INFORMATION TABLE S6 Statistics on read alignment to the fungal genomes, UMI detection, and gene feature counts
SUPPORTING INFORMATION TABLE S7 The number of predicted genes (with and without transposons) in each core and accessory genome, and the number of homologues on each core chromosome
SUPPORTING INFORMATION TABLE S8 Annotation and log‐fold change of fungal core genome CAZymes. Only the gene ID for GL1381 is shown, but a homologue was identified in each isolate
SUPPORTING INFORMATION TABLE S9 Table about the fungal core genome effectors. Contains log‐fold change (logFC) values for each isolate/timepoint combination and the core chromosome where they reside
SUPPORTING INFORMATION TABLE S10 Yellows‐fragariae accessory genome differentially expressed genes. Homologous genes between yellows‐fragariae isolates are depicted in the same row
SUPPORTING INFORMATION TABLE S11 Wilt‐fragariae accessory genome differentially expressed genes
SUPPORTING INFORMATION TABLE S12 National Center for Biotechnology Information (NCBI) Sequence Read Archive (SRA) accessions for raw reads corresponding to each sample, treatment, and timepoint presented in this study
Data Availability Statement
All raw reads and assemblies associated with this project are available from PRJNA578477. Specific sequence read archive (SRA) accessions can be found in Supporting Information Table S12 and assembly accessions are provided in Table 1. Any additional information will be made available upon request.