

Abstract
Donor–recipient human leukocyte antigen (HLA) compatibility has not been considered to significantly affect liver transplantation (LT) outcomes; however, its significance in living‐donor LT (LDLT), which is mostly performed between blood relatives, remains unclear. This retrospective cohort study included 1954 LDLTs at our institution (1990–2020). The primary and secondary endpoints were recipient survival and the incidence of T cell–mediated rejection (TCMR) after LDLT, respectively, according to the number of HLA mismatches at all five loci: HLA‐A, HLA‐B, HLA‐C, HLA‐DR, and HLA‐DQ. Subgroup analyses were also performed in between‐siblings that characteristically have widely distributed 0–10 HLA mismatches. A total of 1304 cases of primary LDLTs were finally enrolled, including 631 adults (recipient age at LT ≥18 years) and 673 children (<18 years). In adult‐to‐adult LDLT, the more HLA mismatches at each locus, the significantly worse the recipient survival was (p = 0.03, 0.01, 0.03, 0.001, and <0.001 for HLA‐A, HLA‐B, HLA‐C, HLA‐DR, and HLA‐DQ, respectively). This trend was more pronounced when multiple loci were combined (all p < 0.001 for A + B + DR, A + B + C, DR + DQ, and A + B + C + DR + DQ). Notably, a total of three or more HLA‐B + DR mismatches was an independent risk factor for both TCMR (hazard ratio [HR] 2.66, 95% confidence interval [CI] 1.21–5.87; p = 0.02) and recipient survival (HR 2.44, 95% CI 1.11–5.35; p = 0.03) in between‐siblings. By contrast, HLA mismatch did not affect pediatric LDLT outcomes at any locus or in any combinations; however, it should be noted that all donor–recipient relationships are parent‐to‐child that characteristically possesses one or less HLA mismatch at each locus and maximally five or less mismatches in total. In conclusion, HLA mismatch significantly affects not only TCMR development but also recipient survival in adult LDLT, but not in children.
Abbreviations
- CI
confidence interval
- CPT
Child–Pugh–Turcotte
- DDLT
deceased‐donor liver transplantation
- D–R
donor–recipient
- GRWR
graft‐to‐recipient body weight ratio
- HCV
hepatitis C virus
- HLA
human leukocyte antigen
- HR
hazard ratio
- ICU
intensive care unit
- IQR
interquartile range
- LDLT
living‐donor liver transplantation
- LT
liver transplantation
- MELD
Model for End‐Stage Liver Disease
- PBC
primary biliary cholangitis
- PCR
polymerase chain reaction
- TCMR
T cell–mediated rejection
- WIT
warm ischemia time
INTRODUCTION
Since the discovery of human leukocyte antigens (HLAs) in the 1950s,[ 1 ] the significance of HLA compatibility between the donor and the recipient in solid organ transplantation has long been debated.[ 2 , 3 , 4 , 5 , 6 , 7 , 8 , 9 , 10 , 11 ] Although many studies have been performed in various organs, just an HLA‐DR mismatch only in kidney transplantation has been universally recognized as a risk factor for graft loss.[ 2 , 3 ] By contrast, the influence of HLA mismatch on liver transplantation (LT) has been sporadically reported in deceased‐donor and living‐donor LT (DDLT and LDLT, respectively).[ 4 , 5 , 6 , 12 , 13 , 14 , 15 , 16 , 17 , 18 , 19 ] Although some of these studies have suggested an association between HLA mismatch and rejections[ 6 , 12 , 14 , 15 ] or patient/graft survival,[ 17 , 19 ] it is widely recognized that HLA mismatch only has a relatively little impact on LT outcomes.[ 20 ] Therefore, HLA mismatch has not been considered for liver allocations in DDLT or donor selection in LDLT so far.
Unlike DDLT, LDLT is mostly performed between blood relatives; therefore, the impact of HLA mismatch on the LT outcomes may be different because of the genetic proximity between the donor and the recipient. Given the favorable outcome of LDLT between identical twins without any immunosuppression,[ 21 , 22 ] we hypothesized a similar scenario, that is, the fewer the HLA mismatches, the lower the incidence of rejections, and thus, the better the prognosis. In general, the donor–recipient (D–R) relationships in LDLT are classified into the following four groups[ 23 ]: child‐to‐parent, parent‐to‐child, between‐siblings, and between‐spouses. In the former two combinations, there should only be up to 5 mismatches at HLA‐A, HLA‐B, HLA‐C, HLA‐DR, and HLA‐DQ loci, while there are theoretically 0–10 mismatches in between‐siblings, and most likely 5–10 mismatches in between‐spouses similar to those in DDLT. Therefore, D–R relationships should be considered to elucidate the impact of HLA mismatch on LDLT outcomes.
This study was thus aimed to investigate the prognostic impact of HLA mismatches on rejections and patient survival after LDLT according to the donor–recipient (D–R) relationship using our relatively large cohorts of both adult and pediatric LDLTs.
PATIENTS AND METHODS
Patients
Overall, 1954 patients (1017 adults [recipient age at LT ≥18 years] and 937 children [<18 years]) underwent LT at our single center between June 1990 and March 2020. Of these, patients undergoing DDLT (59 adults and 21 children), ABO blood–type incompatible cases (168 adults and 125 children), those with acute liver failure (73 adults and 42 children), undergoing retransplantations or re‐retransplantations (41 adults and 51 children), and with rare D–R relationships (13 adults and 15 children; e.g., nephew, cousin, grandfather/grandmother, or father‐in‐law) were excluded. Thus, 1304 recipients (631 adults and 673 children) were enrolled in the final analysis (Figure S1). The median follow‐up period was 12.8 years (range 0–30 years). Written informed consent was obtained from each patient or his/her parents. This study was approved by the Ethics Committee of Kyoto University (approval number: R1473‐3) and was conducted in accordance with the institutional guidelines, as well as with the ethical guidelines mandated by the Declaration of Helsinki (2013).
Perioperative management
The indications for LT, donor selection criteria, perioperative patient care, surgical procedures, and immunosuppression regimens are detailed elsewhere.[ 23 , 24 , 25 , 26 , 27 ] In brief, the lower limit of graft‐to‐recipient body weight ratio (GRWR) has been gradually decreased to maximize the donor safety as follows: ≥0.8% until November 2007, ≥0.7% between December 2007 and March 2009, and ≥0.6% since April 2009.[ 28 , 29 ] For biliary reconstruction, choledocho‐choledochostomy was the first choice in adult LT. Portal venous pressure was adjusted to ≤15 mm Hg at the end of surgery.[ 28 , 29 ] During the first several days after LDLT, recipients were managed in intensive/high care units. Blood tests and Doppler ultrasonography were performed daily until stabilization. The standard immunosuppression regimens including tacrolimus, mycophenolate mofetil, and steroids were employed.[ 27 ] A liver biopsy was performed when rejection was clinically suspected (e.g., elevated liver enzymes, reduced bile discharge, or elevated inflammatory response). Rejections were histopathologically diagnosed according to the criteria proposed by the Banff working group.[ 30 , 31 , 32 ] Anti‐HLA antibodies (donor‐specific antibodies) were routinely measured preoperatively using Luminex technology since 2009 and were checked annually after transplantation. In addition, we perform C4d staining or donor‐specific antibody measurement when antibody‐mediated rejection is suspected or the cause of deteriorated liver function is unknown. In pediatric LT, briefly, the upper limit of GRWR was 4.0%, and in cases with GRWR >4%, a reduced, hyperreduced, or S2‐monosegment graft was chosen.[ 33 ] Choledochojejunostomy was mostly used for biliary reconstruction because more than two‐thirds of pediatric cases underwent Kasai's procedure for biliary atresia. A standard immunosuppression protocol consisting of tacrolimus and steroids was employed.
Variables
The clinical variables included recipient/donor age at LT, recipient/donor sex, underlying liver etiologies, malignant or benign diseases, ABO blood–type compatibility (identical or compatible), preoperative recipient status (at‐home, hospitalized, or intensive care unit bound), Model for End‐Stage Liver Disease (MELD) score, Child–Pugh–Turcotte score, the number of D–R HLA mismatches at each locus (A, B, C, DR, and DQ) and their combination, graft type (left or right lobe), GRWR, operation time, intraoperative blood loss, cold ischemia time, and warm ischemia time.
HLA typing
HLA mismatches were counted as the number of donor HLAs that the recipient did not have. HLA‐A, HLA‐B, HLA‐C, HLA‐DR (DRB1), and HLA‐DQ (DQB1) were typed throughout the entire period; however, typing methods used were naturally changed over time and classified into the following three patterns according to the era: during the first decade (1990–2000), serological HLA typing was performed using the National Institutes of Health lymphocyte cytotoxicity test (antisera prepared by the Kyoto Red Cross Blood Center).[ 34 ] HLA typing by polymerase chain reaction (PCR) with sequence‐specific primers (Micro SSP Japanese HLA DNA Typing Tray, One Lambda, Canoga Park, CA, USA) was adopted between 2000 and 2009, followed by PCR genotyping with sequence‐specific oligonucleotide probes (SSOPs; WAKFlow HLA Typing kit; Wakunaga, Hiroshima, Japan; and Luminex xMAP Technology; Luminex, Austin, TX, USA) since July 2009. Although 4‐digit allele typing has currently been applied in clinical practice, the universal 2‐digit serotypes were consistently used in this study to standardize HLA types throughout the long study period of 30 years.
Because of altered recognition of HLAs over time, there are some inconsistencies between previous and current HLAs. In particular, in HLA‐C and HLA‐DQ loci, the former Cw3 has become the recent Cw9 or Cw10, and similarly, the previous DQ1 and DQ3 are now DQ5/6 and DQ7/8/9, respectively. To eliminate miscounts as much as possible, such antigens were excluded from the analyses; therefore, there were inevitably more missing values in HLA‐C and HLA‐DR counts than in HLA‐A, HLA‐B, and HLA‐DR loci.
Statistical analysis
Data are presented as the median with interquartile range (IQR) for continuous variables and counts for categorical variables. Comparisons of continuous variables and categorical variables were performed using the Mann–Whitney U test and chi‐squared test, respectively. Prognostic factors for recipients and risk factors for T cell–mediated rejection (TCMR) occurrence were analyzed using the Cox proportional hazards model. Variables with p < 0.10 in the univariate analysis were included in the multivariable analysis. Cumulative survival and incidence were estimated by the Kaplan–Meier method, followed by a log‐rank test. All analyses were two‐sided, and p < 0.05 was considered statistically significant. All statistical analyses were performed using JMP Pro15 (SAS Institute Inc., Cary, NC, USA).
RESULTS
HLA mismatch and recipient survival in adult and pediatric LDLT
Recipient survival rates in 631 adult and 673 pediatric LDLTs were separately analyzed according to HLA mismatches. As shown in Figures 1 and 2, two mismatches at each HLA locus were significantly associated with worse recipient survival in adult LDLT at all the loci: HLA‐A (p = 0.03 for 0 vs. 2 mismatches); HLA‐B (p < 0.001 for 1 vs. 2 mismatches and p = 0.01 for 0 vs. 2); HLA‐C (p = 0.04 for 0 vs. 2); HLA‐DR (p = 0.006 for 1 vs. 2 and p = 0.001 for 0 vs. 2); and HLA‐DQ (p = 0.003 for 1 vs. 2 and p < 0.001 for 0 vs. 2). Notably, the higher the number of mismatches, the worse the recipient survival rate tended to be.
FIGURE 1.

Patient survival after LDLT according to HLA class I mismatch. Cumulative recipient survival according to the number of HLA class I mismatches at HLA‐A (A: adults, *p = 0.03; and B: children, p = 0.61), HLA‐B (C: adults, † p = 0.01 and *p < 0.001; and D: children, p = 0.50), and HLA‐C (E: adults, *p = 0.03; and F: children, p = 0.16). At all the loci, recipient survival with two mismatches was significantly worse than that with zero mismatches in adults, but not in children. Considering no two‐mismatch cases in children (all cases are from parent‐to‐child), as well as no survival difference between zero and one mismatch in adults, these results can be interpreted that two mismatches at any locus may be the true risk than being adult or child. Hereafter, all analyses were performed by the Kaplan–Meier method followed by a log‐rank test, unless otherwise indicated.
FIGURE 2.

Patient survival after LDLT according to HLA class II mismatch. Cumulative recipient survival according to the number of HLA class II mismatches at HLA‐DR (A: adults, † p = 0.001 and *p = 0.006; and B: children, p = 0.41), HLA‐DQ (C: adults, † p < 0.001 and *p = 0.003; and D: children, p = 0.29), and HLA class II (DR + DQ) mismatches (E: adult, p < 0.001; and F: p = 0.80). In adults, recipient survival with two mismatches at either DR or DQ was significantly worse than that with zero and one mismatch, and higher number of total mismatch counts in all the five HLA loci (>5) significantly worsened recipient survival compared with that with ≤5. By contrast, no difference was observed in children. As all the donor–recipient relationships in the pediatric cohort are parent‐to‐child that characteristically possesses one or less mismatch at each locus and less than five mismatches in total, two mismatches at each or six or more in total may be a risk for recipient survival, regardless of recipient age.
Considering the clinical significance, we also analyzed recipient survival according to the total number of HLA mismatches in the following four HLA combinations: HLA‐A + B + DR; A + B + C (Class I); DR + DQ (Class II); and A + B + C + DR + DQ (Class I + II), in both adult and pediatric cohorts. As shown in Figures 2 and 3, the survival difference was more pronounced in adults when multiple loci were combined (all p < 0.001 for A + B + DR, A + B + C, DR + DQ, and A + B + C + DR + DQ).
FIGURE 3.

Patient survival after LDLT according to combined HLA class I and II mismatches. Cumulative recipient survival according to combined HLA class I (A + B + C) mismatches (A: adult, p < 0.001; and B: children, p = 0.21), HLA‐A + B + DR (C: adults, p < 0.001; and D: children, p = 0.27), and combined HLA class I + II (A + B + C + DR + DQ) mismatches (E: adults, p < 0.001; and F: children, p = 0.29). In adults, recipient survival was significantly deteriorated in the group with higher number of mismatches in any HLA combination, but not in children. However, it should also be noted that there were no combinations with high HLA mismatches in children.
By contrast, HLA mismatch did not affect pediatric LDLT outcomes at any locus or in any combinations. From different points of view, however, there was no significant difference even in adult recipient survival between zero and one mismatch at any HLA locus. As D–R relationships in pediatric LDLTs are all parent‐to‐child that characteristically possesses zero or one mismatch per locus, these results may indicate that the presence of two mismatches at one HLA locus, rather than being an adult or child, worsened recipient prognosis.
Patient characteristics and perioperative variables
Patient characteristics and perioperative variables are summarized in Table S1. In general, the D–R relationships in adult LDLT are classified into the following four groups[ 23 ]: child‐to‐parent (n = 218), between‐spouses (n = 180), between‐siblings (n = 138), and parent‐to‐child (n = 89). These four combinations accounted for 98.2% of adult‐to‐adult LDLTs. In pediatric LDLTs, all the 673 cases enrolled were parent‐to‐child.
HLA mismatches and recipient survival according to donor–recipient relationships
Characteristically, the number of HLA mismatches in HLA Class I and II loci in between‐siblings was widely distributed between 0 and 10 (Figure 4A). By contrast, HLA mismatches in child‐to‐parent and parent‐to‐child naturally ranged between 0 and 5, whereas that in between‐spouses were mainly 5–10 because they were nonconsanguineous to each other like the DDLT/domino LT cohort. As presented in Figure 4B, adult recipient survival in child‐to‐parent was comparable to that in pediatric LDLT recipients, which was significantly better than those in the other relationships, namely, parent‐to‐child, between‐spouses, and between‐siblings (p < 0.001, 0.001, and 0.03, respectively). It is also noteworthy that recipient survival in between‐siblings surpassed that in between‐spouses (p = 0.047; Figure 4B).
FIGURE 4.
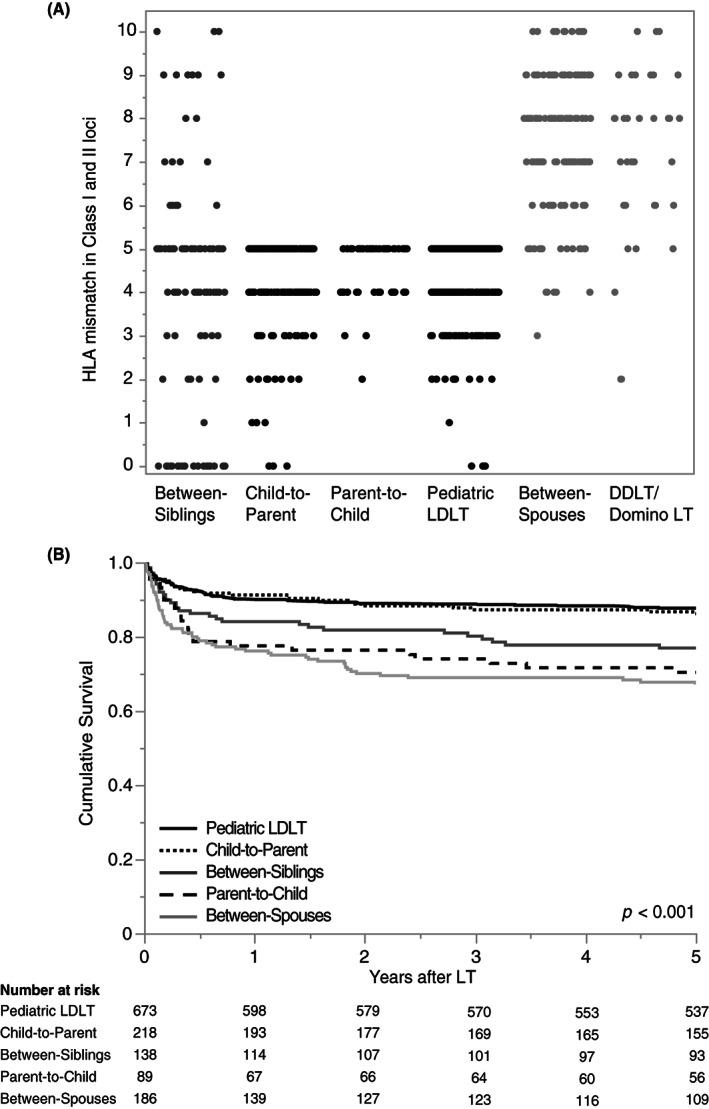
HLA mismatch counts and recipient survival according to the donor–recipient relationship. (A) The total number of HLA mismatches according to the donor–recipient relationship is characteristically classified into the following four combinations that accounted for 98.2% of our LDLT cohort: child‐to‐parent (0–5 mismatches); parent‐to‐child (0–5 mismatches); between‐spouses (mostly 5–10 mismatches similar to DDLT); and between‐siblings (widely distributed 0–10 mismatches at all HLA loci). (B) Child‐to‐parent showed significantly better recipient survival than between‐spouses, parent‐to‐child, and between‐siblings (p < 0.001, 0.001, and 0.03, respectively). In addition, between‐siblings demonstrated significantly better recipient survival than between‐spouses (p = 0.047).
Patient characteristics and perioperative variables in between‐siblings
As HLA mismatch in between‐siblings is widely distributed from 0 to 10, we analyzed the association between the number of HLA mismatches and LDLT outcomes using 138 cases in between‐siblings. Their patient characteristics and perioperative variables are summarized in Table S2. The median donor and recipient ages at LT were 46 and 47 years, respectively. The most common etiology for LT was hepatocellular carcinoma in 41 (30%) patients, followed by cholestatic cirrhosis (primary biliary cholangitis [PBC] and primary sclerosing cholangitis) in 33 (24%) patients and viral cirrhosis without hepatocellular carcinoma (hepatitis B and C) in 27 (20%) patients. After excluding ABO blood–type–incompatible cases, 122 (88%) were ABO‐identical and the remaining 16 (12%) were compatible combinations. The median MELD score was 19 (IQR 17–24). The number of HLA mismatches at each locus is detailed in Table 2. The median GRWR was 1.01% (IQR 0.86%–1.23%).
TABLE 2.
Risk factors for TCMR after LDLT between‐siblings
| Factors | Univariable analysis | p value | Multivariable analysis | p value | ||
|---|---|---|---|---|---|---|
| HR | 95% CI | HR | 95% CI | |||
| Recipient age, years | 0.97 | 1.01–1.03 | 0.13 | |||
| Recipient sex (female/male) | 2.57 | 1.21–5.44 | 0.01 | 1.74 | 0.72–4.25 | 0.22 |
| HCV/non‐HCV | 0.80 | 0.36–1.75 | 0.57 | |||
| Benign/malignant | 4.05 | 1.23–13.4 | 0.02 | |||
| PBC/non‐PBC | 3.33 | 1.59–6.99 | 0.001 | 2.86 | 1.20–6.78 | 0.02 |
| ABO identical/compatible | 1.20 | 0.36–3.95 | 0.77 | |||
| Preoperative recipient status at home/hospitalized or ICU bound | 0.60 | 0.29–1.25 | 0.17 | |||
| CPT score (C/A and B) | 0.98 | 0.46–2.08 | 0.96 | |||
| MELD score | 1.02 | 0.98–1.06 | 0.34 | |||
| HLA‐A mismatch (2/0–1) | 1.01 | 0.24–4.27 | 0.99 | |||
| HLA‐B mismatch (2/0–1) | 2.92 | 1.32–6.45 | 0.008 | |||
| HLA‐C mismatch (2/0–1) | 1.58 | 0.53–4.73 | 0.41 | |||
| HLA‐DR mismatch (2/0–1) | 1.60 | 0.65–3.94 | 0.31 | |||
| HLA‐DR mismatch (1–2/0) | 3.07 | 1.06–8.84 | 0.04 | |||
| HLA‐DQ mismatch (2/0–1) | 2.53 | 1.004–6.37 | 0.049 | |||
| HLA‐DQ mismatch (1–2/0) | 2.94 | 1.005–8.60 | 0.049 | |||
| HLA‐B and HLA‐DR mismatch (3–4/0–2) | 2.57 | 1.19–5.57 | 0.02 | 2.66 | 1.21–5.87 | 0.02 |
| Donor age, years | 0.98 | 0.95–1.02 | 0.37 | |||
| Graft type (left/right side) | 1.48 | 0.65–3.34 | 0.35 | |||
| GRWR ≥0.8%/not | 0.88 | 0.34–2.31 | 0.80 | |||
Note: p values <0.05 are highlighted in bold.
Abbreviations: CI, confidence interval; CPT, Child–Pugh–Turcotte; GRWR, graft‐versus‐recipient weight ratio; HCV, hepatitis C virus; HLA, human leukocyte antigen; HR, hazard ratio; ICU, intensive care unit; LDLT, living‐donor liver transplantation; MELD, Model for End‐Stage Liver Disease; PBC, primary biliary cholangitis; TCMR, T‐cell mediated rejection.
Recipient survival in between‐siblings according to HLA mismatch
In between‐siblings, two mismatches at each of HLA‐B, HLA‐DR, and HLA‐DQ were significantly associated with worse recipient survival compared with zero mismatches (p = 0.04, 0.006, and 0.003, respectively; Figure 5). Furthermore, three or four mismatches in HLA‐B and HLA‐DR were significantly associated with worse recipient survival than zero to two mismatches (p = 0.01; Figure 5F). By contrast, no significant difference was observed in recipient survival according to the number of HLA mismatches in the other relationships (child‐to‐parent, parent‐to‐child, and between‐spouses; Figure [Link], [Link]).
FIGURE 5.

Patient survival in between‐siblings according to HLA mismatches at each locus. Cumulative recipient survival was shown according to the number of HLA mismatches at (A) HLA‐A, (B) HLA‐B, (C) HLA‐C, (D) HLA‐DR, (E) HLA‐DQ, and (F) HLA‐B + HLA‐DR. Although statistically not significant at HLA‐A and HLA‐C, recipient survival with two mismatches at HLA‐B, HLA‐DR, and HLA‐DQ was significantly worse than the respective zero mismatches (*p = 0.04, 0.006, and 0.003, respectively). Moreover, recipient survival with a total of three or four mismatches at HLA‐B + DR was significantly deteriorated than with zero to two mismatches (p = 0.01).
Risk factors for recipient survival in between‐siblings
As with the exclusion of ABO blood–type–incompatible cases, a patient with high‐titer preformed donor‐specific antibodies to multiple HLA loci was excluded from the analyses. Univariable Cox regression analysis revealed that female recipient (hazard ratio [HR] 2.13, 95% confidence interval [CI] 1.03–4.38; p = 0.04) and two mismatches at HLA‐B (HR 2.43, 95% CI 1.06–5.54; p = 0.04), HLA‐DR (HR 2.46, 95% CI 1.07–5.61; p = 0.03), and HLA‐DQ (HR 3.14, 95% CI 1.29–7.65; p = 0.01) were significant risk factors for recipient survival in between‐siblings. As HLA‐B, HLA‐DR, and HLA‐DQ loci are correlated with each other, and there was a high missing rate (18%) in the DQ locus, a multivariable model was created with the female recipient and the number of HLA mismatch in HLA‐B and HLA‐DR loci. Notably, three to four HLA mismatches in HLA‐B + HLA‐DR loci were identified as an independent risk factor for 5‐year recipient survival in between‐siblings (HR 2.44, 95% CI 1.11–5.35; p = 0.03; Table 1).
TABLE 1.
Risk factors for recipient survival after LDLT between‐siblings
| Factors | Univariable analysis | p value | Multivariable analysis | p value | ||
|---|---|---|---|---|---|---|
| HR | 95% CI | HR | 95% CI | |||
| Recipient age, years | 1.01 | 0.97–1.06 | 0.47 | |||
| Recipient sex (female/male) | 2.13 | 1.03–4.38 | 0.04 | 1.90 | 0.89–4.08 | 0.10 |
| HCV/non‐HCV | 1.38 | 0.67–2.83 | 0.39 | |||
| Malignant/benign | 1.42 | 0.68–2.99 | 0.35 | |||
| PBC/non‐PBC | 1.30 | 0.56–3.02 | 0.55 | |||
| ABO identical/compatible | 1.23 | 0.37–4.05 | 0.74 | |||
| Preoperative recipient status at home/hospitalized or ICU bound | 0.59 | 0.29–1.21 | 0.15 | |||
| MELD score | 1.03 | 0.99–1.07 | 0.13 | |||
| CPT score (C/A and B) | 1.50 | 0.69–3.28 | 0.31 | |||
| HLA‐A mismatch (2/0–1) | 1.75 | 0.53–5.80 | 0.36 | |||
| HLA‐B mismatch (2/0–1) | 2.43 | 1.06–5.54 | 0.04 | |||
| HLA‐C mismatch (2/0–1) | 1.32 | 0.45–3.88 | 0.61 | |||
| HLA‐DR mismatch (2/0–1) | 2.46 | 1.07–5.61 | 0.03 | |||
| HLA‐DQ mismatch (2/0–1) | 3.14 | 1.29–7.65 | 0.01 | |||
| HLA‐B and HLA‐DR mismatch (3–4/0–2) | 2.59 | 1.18–5.66 | 0.02 | 2.44 | 1.11–5.35 | 0.03 |
| Donor age, years | 1.02 | 0.98–1.06 | 0.36 | |||
| Donor sex (female/male) | 1.30 | 0.38–1.58 | 0.48 | |||
| Graft type (left/right side) | 1.63 | 0.75–3.56 | 0.22 | |||
| GRWR ≥0.8%/not | 1.77 | 0.54–5.84 | 0.35 | |||
Note: p values <0.05 are highlighted in bold.
Abbreviations: CI, confidence interval; CPT, Child–Pugh–Turcotte; GRWR, graft‐versus‐recipient weight ratio; HCV, hepatitis C virus; HLA, human leukocyte antigen; HR, hazard ratio; ICU, intensive care unit; LDLT, living‐donor liver transplantation; MELD, Model for End‐Stage Liver Disease; PBC, primary biliary cholangitis.
Diagnosis and severity of TCMR
Of the 138 patients in between‐siblings, 29 (21%) were diagnosed with TCMR, all of which occurred within 6 months after transplantation (median interval from LT to TCMR diagnosis: 19 days [range 5–176 days]). Of these, 28 of 29 patients were histopathologically diagnosed with TCMR according to the Banff criteria,[ 30 , 31 , 32 ] just except for one patient who was clinically and serologically diagnosed with TCMR without liver biopsy due to massive ascites. In summary, the severity of TCMR was mild, mild‐to‐moderate, moderate, and moderate‐to‐severe in 9, 1, 17, and 2 patients, respectively, and the median rejection activity index score was 5 (range 2–7).
Risk factors for TCMR in between‐siblings
Univariable Cox regression analysis revealed that female recipient (HR 2.57, 95% CI 1.21–5.44; p = 0.01), benign liver disease (HR 4.05, 95% CI 1.23–13.4; p = 0.02), PBC (HR 3.33, 95% CI 1.59–6.99; p = 0.001), two mismatches at HLA‐B locus (HR 2.92, 95% CI 1.32–6.45; p = 0.008), one to two mismatches at HLA‐DR (HR 3.07, 95% CI 1.06–8.84; p = 0.04), and two mismatches at HLA‐DQ (HR 2.94, 95% CI 1.00–6.37; p = 0.049) were significant risk factors for TCMR development. Benign disease was excluded from the candidates for multivariable analysis because of a strong correlation with PBC. For HLA‐B, HLA‐DR, and HLA‐DQ loci, we adopted the combination of the HLA‐B and HLA‐DR loci for the aforesaid reasons. Multivariable Cox regression analysis demonstrated that PBC (HR 2.86, 95% CI 1.20–6.78; p = 0.02) and three to four mismatches in B and DR loci (HR 2.66, 95% CI 1.21–5.87; p = 0.02) were independent risk factors for TCMR in between‐siblings (Table 2).
Cumulative incidence of TCMR
Finally, the cumulative incidence of TCMR was investigated according to the number and loci of HLA mismatches. As shown in Figure 6, the more mismatches in HLA‐B, HLA‐DR, and HLA‐DQ, the more frequently TCMR occurred (HLA‐B: p = 0.02 for 0 vs. 2 mismatches and p = 0.01 for 1 vs. 2; HLA‐DR: p = 0.04 for 0 vs. 1 and p = 0.04 for 0 vs. 2; HLA‐DQ: p = 0.009 for 0 vs. 2). Likewise, significantly more TCMR occurred in recipients with three to four mismatches than with zero to two in HLA‐B + DR (p = 0.01; Figure 6F).
FIGURE 6.

Cumulative incidence of TCMR according to the number of HLA mismatches in between‐siblings. (A–E) Although not significant at HLA‐A and HLA‐C, TCMR incidence with two mismatches at HLA‐B was significantly higher than those with zero and one mismatch (*p = 0.02 and †0.01, respectively). Notably, one and two mismatches at HLA‐DR and two mismatches at HLA‐DQ also resulted in significantly higher incidence of TCMR than those without (*p = 0.04, 0.04, and 0.009, respectively). (F) The incidence of TCMR with three of four mismatches at HLA‐B + DR loci was significantly higher than those with zero to two mismatches (p = 0.01).
DISCUSSION
To date, D–R HLA compatibility has been thought to have little influence on LT outcomes, especially on graft/recipient survival, and has not been considered in both liver allocation for DDLT and donor selection for LDLT.[ 4 , 5 , 12 , 15 ] In DDLT, because the donor and recipient are not related with each other, the numbers of D–R HLA mismatch are inevitably high in almost all cases, and analyses in such populations have led to the seemingly plausible observation that HLA mismatch does not affect LT outcomes.[ 4 , 15 ] In fact, HLA mismatch showed no significant influence on recipient prognosis in our cohort of DDLT, domino LT, and LDLT between‐spouses, that is, LTs between non‐blood relatives with mostly five or more HLA mismatches (data not shown). By contrast, the number of HLA mismatch is five or fewer in not only pediatric but also adult LDLTs from parent‐to‐child and child‐to‐parent that account for half of all adult cases. These characteristic D–R relationships result in five or less HLA mismatches in >80% of all LDLTs, leading again to the misunderstanding that HLA mismatch is not a significant prognostic factor in LDLT.[ 5 , 18 ]
In the present study, we demonstrated that the number of HLA mismatches was significantly associated with recipient survival in adult LDLTs at all the five loci, HLA‐A, HLA‐B, HLA‐C, HLA‐DR, and HLA‐DQ. The higher the number of mismatches, the worse the recipient survival rate. This trend was more evident when multiple loci were combined, for example, A + B + DR, A + B + C (class I), DR + DQ (class II), and A + B + C + DR + DQ (class I + II). By contrast, HLA mismatch did not affect recipient survival in pediatric LDLT at any locus or in any combinations.
Although several studies have investigated the influence of HLA mismatch on post‐LT outcomes,[ 4 , 5 , 6 , 12 , 13 , 14 , 15 , 16 , 17 , 18 , 19 ] there are no consistent findings on its prognostic impact thus far (Table S3). This is probably because previous studies have not focused on the D–R relationship that invariably determines the number of HLA mismatches in LDLT. D–R relationships in adult‐to‐adult LDLT and HLA mismatches therein are characteristically classified into the following four combinations: child‐to‐parent (0–5 mismatches), parent‐to‐child (0–5 mismatches), between‐spouses (mostly 5–10 mismatches, similar to that in DDLTs), and between‐siblings (widely distributed 0–10 mismatches in all HLA loci). These four combinations accounted for 98.2% of our LDLT cohort. The significance of HLA mismatch was thus comprehensively compared among the four groups, demonstrating that three or more mismatches in HLA‐B and HLA‐DR were independent risk factors in LDLT between‐siblings. Moreover, the number of HLA mismatches in HLA‐B, HLA‐DR, and HLA‐DQ loci was significantly associated with both TCMR incidence and recipient survival. These consistent results were characteristically observed in between‐siblings, in which zero to two mismatches are widely found at each HLA locus.
In contrast to the significant impact of HLA‐B, HLA‐DR, and HLA‐DQ mismatches, HLA‐A mismatch affected neither TCMR incidence nor patient survival, even in between‐siblings. As a possible explanation for this discrepancy, limited expression patterns at HLA‐A locus might be involved. Characteristically, HLA‐A expression is classified into six major types that account for 98.2% of the total Japanese population (Table S4).[ 35 ] This may be related to the fact that Japan is an island nation that has long been relatively free from miscegenation with other races historically.[ 36 ] Because of the fewer incidence of two mismatches at the A locus (just 7%) than at B and DR loci (16% each; Table S2), HLA‐A mismatch may have less influence on rejection or patient survival in the Japanese population. Although HLA‐DQ also has just six principal patterns like the A locus, two mismatches in DQ corresponded to 13% of the whole cohort and were significantly associated with higher TCMR occurrence and worse recipient survival than in zero mismatches. HLA‐DQ was excluded from the multivariable analysis due to the high rate of missing values; however, its impact on rejection and recipient survival are both significant, and further detailed validation is expected in the near future.
Of interest, higher HLA mismatches resulted in significantly worse recipient survival than those with corresponding zero mismatches at all loci in adults but had no impact on children. This may be interpreted as a result from immunologically immature age of recipients; however, it should be noted that there were no two‐mismatch cases at any locus in children, as all cases were parent‐to‐child combination after excluding rare relationships of <3%, such as grandparent‐to‐grandchild. Even if these rare combinations were not excluded, >97% of pediatric LDLTs were parent‐to‐child at our center. This is a characteristic feature in pediatric LDLT that seems to be universal regardless of countries, regions, or eras. Moreover, it should be noted that, even in adults, there was no difference in recipient survival between zero and one mismatch at any HLA locus. Taken together, having two mismatches at any locus or six or more mismatches in total may be a real risk factor rather than being an adult or child.
This study has several limitations. First, this is a retrospective cohort study conducted at a single institution; therefore, there may be potential selection bias or limited statistical power. More large‐scale, multicenter studies are required to validate our findings. Second, our results were obtained from a long history (30 years). In the meanwhile, the assays for HLA typing have evolved from 2‐digit serotyping to 4‐digit allele level, which has allowed to evaluate epitope mismatches using free software (e.g., HLAMatchmaker).[ 37 , 38 ] However, due to its versatility and the vast knowledge accumulated, HLA serotyping remains the global gold standard in clinical practice for solid organ transplantation. In the near future, large studies using the 4‐digit allele typing are preferred. Third, there were some missing values in HLA‐C and HLA‐DQ loci, which were unavoidable due to historical advances in HLA determination. In particular, further investigation of HLA‐DQ mismatch is warranted, as it certainly affects TCMR development and recipient survival in LDLT. Last but not least, HLA expression profiles, distributions, and their diversity vary greatly by race, country, and region. To fully address these challenging issues, a global survey across races and countries and multiple surveys per race and region are hopefully both required.
In conclusion, we demonstrated the significant prognostic impact of HLA mismatches on recipient survival in adult LDLT. A total of three or more mismatches in HLA‐B and HLA‐DR loci may be a significant risk factor for not only TCMR development but also recipient survival. HLA mismatch, particularly two mismatches per locus, should be considered a significant risk factor for TCMR and recipient survival in adult LDLT. Future studies should include molecular‐level analyses using larger populations with widely distributed 0–10 HLA mismatches to determine which factors directly influence TCMR and recipient survival in adult LDLT.
CONFLICT OF INTEREST
Nothing to report.
Supporting information
Fig. S1
Fig. S2
Fig. S3
Fig. S4
Appendix S1
Tajima T, Hata K, Kusakabe J, Miyauchi H, Yurugi K, Hishida R, et al. The impact of human leukocyte antigen mismatch on recipient outcomes in living‐donor liver transplantation. Liver Transpl. 2022;28:1588–1602. 10.1002/lt.26511
REFERENCES
- 1. Dausset J. Iso‐leuco‐anticorps [Iso‐leuko‐antibodies]. Acta Haematol. 1958;20:156–66. [DOI] [PubMed] [Google Scholar]
- 2. Opelz G, Mytilineos J, Scherer S, Dunckley H, Trejaut J, Chapman J, et al. Survival of DNA HLA‐DR typed and matched cadaver kidney transplants. The collaborative transplant study. Lancet. 1991;338:461–3. [DOI] [PubMed] [Google Scholar]
- 3. Opelz G, Döhler B. Association of HLA mismatch with death with a functioning graft after kidney transplantation: a collaborative transplant study report. Am J Transplant. 2012;12:3031–8. [DOI] [PubMed] [Google Scholar]
- 4. Navarro V, Herrine S, Katopes C, Colombe B, Spain CV. The effect of HLA class I (a and B) and class II (DR) compatibility on liver transplantation outcomes: an analysis of the OPTN database. Liver Transpl. 2006;12:652–8. [DOI] [PubMed] [Google Scholar]
- 5. Jakab SS, Navarro VJ, Colombe BW, Daskalakis C, Herrine SK, Rossi S. Human leukocyte antigen and adult living donor liver transplantation outcomes: an analysis of the organ procurement and transplantation network database. Liver Transpl. 2007;13:1405–13. [DOI] [PubMed] [Google Scholar]
- 6. Lan X, Zhang MM, Pu CL, Guo CB, Kang Q, Li YC, et al. Impact of human leukocyte antigen mismatching on outcomes of liver transplantation: a meta‐analysis. World J Gastroenterol. 2010;16:3457–64. [DOI] [PMC free article] [PubMed] [Google Scholar]
- 7. Opelz G, Wujciak T. The influence of HLA compatibility on graft survival after heart transplantation. The collaborative transplant study. N Engl J Med. 1994;330:816–9. [DOI] [PubMed] [Google Scholar]
- 8. Smith JD, Rose ML, Pomerance A, Burke M, Yacoub MH. Reduction of cellular rejection and increase in longer‐term survival after heart transplantation after HLA‐DR matching. Lancet. 1995;346:1318–22. [DOI] [PubMed] [Google Scholar]
- 9. Quantz MA, Bennett LE, Meyer DM, Novick RJ. Does human leukocyte antigen matching influence the outcome of lung transplantation? An analysis of 3549 lung transplantations. J Heart Lung Transplant. 2000;19:473–9. [DOI] [PubMed] [Google Scholar]
- 10. van den Berg JW, Hepkema BG, Geertsma A, Koëter GH, Postma DS, de Boer WJ, et al. Long‐term outcome of lung transplantation is predicted by the number of HLA‐DR mismatches. Transplantation. 2001;71:368–73. [DOI] [PubMed] [Google Scholar]
- 11. Rudolph EN, Dunn TB, Mauer D, Noreen H, Sutherland DE, Kandaswamy R, et al. HLA‐A, ‐B, ‐C, ‐DR, and ‐DQ matching in pancreas transplantation: effect on graft rejection and survival. Am J Transplant. 2016;16:2401–12. [DOI] [PubMed] [Google Scholar]
- 12. Doran TJ, Geczy AF, Painter D, McCaughan G, Sheil AG, Süsal C, et al. A large, single center investigation of the immunogenetic factors affecting liver transplantation. Transplantation. 2000;69:1491–8. [DOI] [PubMed] [Google Scholar]
- 13. Kasahara M, Kiuchi T, Uryuhara K, Uemoto S, Fujimoto Y, Ogura Y, et al. Role of HLA compatibility in pediatric living‐related liver transplantation. Transplantation. 2002;74:1175–80. [DOI] [PubMed] [Google Scholar]
- 14. Sugawara Y, Makuuchi M, Kaneko J, Saiura A, Imamura H, Kokudo N. Risk factors for acute rejection in living donor liver transplantation. Clin Transplant. 2003;17:347–52. [DOI] [PubMed] [Google Scholar]
- 15. Neumann UP, Guckelberger O, Langrehr JM, Lang M, Schmitz V, Theruvath T, et al. Impact of human leukocyte antigen matching in liver transplantation. Transplantation. 2003;75:132–7. [DOI] [PubMed] [Google Scholar]
- 16. Sieders E, Hepkema BG, Peeters PM, TenVergert EM, de Jong KP, Porte RJ, et al. The effect of HLA mismatches, shared cross‐reactive antigen groups, and shared HLA‐DR antigens on the outcome after pediatric liver transplantation. Liver Transpl. 2005;11:1541–9. [DOI] [PubMed] [Google Scholar]
- 17. Balan V, Ruppert K, Demetris AJ, Ledneva T, Duquesnoy RJ, Detre KM, et al. Long‐term outcome of human leukocyte antigen mismatching in liver transplantation: results of the National Institute of Diabetes and Digestive and Kidney Diseases liver transplantation database. Hepatology. 2008;48:878–88. [DOI] [PubMed] [Google Scholar]
- 18. Na GH, Kim EY, Hong TH, You YK, Kim DG. Effects of preoperative positive cross‐match and HLA mismatching on early acute cellular rejection and graft survival in living donor liver transplantation. Ann Transplant. 2015;20:553–60. [DOI] [PubMed] [Google Scholar]
- 19. Shin M, Kim JM, Kwon CH, Kim SJ, Joh JW. Role of human leukocyte antigen compatibility in graft outcomes after living donor liver transplantation. Transplant Proc. 2016;48:1123–9. [DOI] [PubMed] [Google Scholar]
- 20. Patel YA, Henson JB, Wilder JM, Zheng J, Chow SC, Berg CL, et al. The impact of human leukocyte antigen donor and recipient serotyping and matching on liver transplant graft failure in primary sclerosing cholangitis, autoimmune hepatitis, and primary biliary cholangitis. Clin Transplant. 2018;32:e13388. [DOI] [PMC free article] [PubMed] [Google Scholar]
- 21. Liu LU, Schiano TD, Min AD, Kim‐Schluger L, Schwartz ME, Emre S, et al. Syngeneic living donor liver transplantation without the use of immunosuppression. Gastroenterology. 2002;123:1341–5. [DOI] [PubMed] [Google Scholar]
- 22. Yoshizawa A, Takada Y, Fujimoto Y, Koshiba T, Haga H, Nabeshima S, et al. Liver transplantation from an identical twin without immunosuppression, with early recurrence of hepatitis C. Am J Transplant. 2006;6:2812–6. [DOI] [PubMed] [Google Scholar]
- 23. Kubota T, Hata K, Sozu T, Ueda Y, Hirao H, Okamura Y, et al. Impact of donor age on recipient survival in adult‐to‐adult living donor liver transplantation. Ann Surg. 2018;267:1126–33. [DOI] [PubMed] [Google Scholar]
- 24. Tanaka K, Kiuchi T, Kaihara S. Living related liver donor transplantation: techniques and caution. Surg Clin North Am. 2004;84:481–93. [DOI] [PubMed] [Google Scholar]
- 25. Morioka D, Egawa H, Kasahara M, Ito T, Haga H, Takada Y, et al. Outcomes of adult‐to‐adult living donor liver transplantation: a single institution's experience with 335 consecutive cases. Ann Surg. 2007;245:315–25. [DOI] [PMC free article] [PubMed] [Google Scholar]
- 26. Kusakabe J, Hata K, Tanaka S, Omae K, Okamura Y, Tajima T, et al. Prognostic index consisting of early post‐transplant variables <2 weeks in adult living donor liver transplantation. Hepatol Res. 2020;50:741–53. [DOI] [PMC free article] [PubMed] [Google Scholar]
- 27. Tajima T, Hata K, Haga H, Nishikori M, Umeda K, Kusakabe J, et al. Post‐transplant lymphoproliferative disorders after liver transplantation: a retrospective cohort study including 1954 transplants. Liver Transpl. 2021;27:1165–80. [DOI] [PMC free article] [PubMed] [Google Scholar]
- 28. Uemura T, Wada S, Kaido T, Mori A, Ogura Y, Yagi S, et al. How far can we lower graft‐to‐recipient weight ratio for living donor liver transplantation under modulation of portal venous pressure? Surgery. 2016;159:1623–30. [DOI] [PubMed] [Google Scholar]
- 29. Ogura Y, Hori T, El Moghazy WM, Yoshizawa A, Oike F, Mori A, et al. Portal pressure <15 mm hg is a key for successful adult living donor liver transplantation utilizing smaller grafts than before. Liver Transpl. 2010;16:718–28. [DOI] [PubMed] [Google Scholar]
- 30. Banff schema for grading liver allograft rejection: an international consensus document. Hepatology. 1997;25:658–63. [DOI] [PubMed] [Google Scholar]
- 31. Demetris A, Adams D, Bellamy C, Blakolmer K, Clouston A, Dhillon AP, et al. Update of the international Banff schema for liver allograft rejection: working recommendations for the histopathologic staging and reporting of chronic rejection. An international panel. Hepatology. 2000;31:792–9. [DOI] [PubMed] [Google Scholar]
- 32. Demetris AJ, Bellamy C, Hübscher SG, O'Leary J, Randhawa PS, Feng S, et al. 2016 comprehensive update of the Banff working group on liver allograft pathology: introduction of antibody‐mediated rejection. Am J Transplant. 2016;16:2816–35. [DOI] [PubMed] [Google Scholar]
- 33. Shehata MR, Yagi S, Okamura Y, Iida T, Hori T, Yoshizawa A, et al. Pediatric liver transplantation using reduced and hyper‐reduced left lateral segment grafts: a 10‐year single‐center experience. Am J Transplant. 2012;12:3406–13. [DOI] [PubMed] [Google Scholar]
- 34. Ray JG. NIH lymphocyte microcytotoxicity technique. NIAID manual of tissue typing techniques (DHEW publication [NIH] 77–545). Department of Health, Education, and Welfare: Washington, DC; 1977. [Google Scholar]
- 35.[cited 2021 Jun]. Available from: http://www.wakunagahla.jp/products/wakflow/img/wakflow_hal_201608.pdf
- 36. Allele Frequency Net Database. [cited 2021 Aug]. Available from: http://www.allelefrequencies.net/default.asp [Google Scholar]
- 37. Duquesnoy RJ. Clinical usefulness of HLAMatchmaker in HLA epitope matching for organ transplantation. Curr Opin Immunol. 2008;20:594–601. [DOI] [PubMed] [Google Scholar]
- 38. Wiebe C, Pochinco D, Blydt‐Hansen TD, Ho J, Birk PE, Karpinski M, et al. Class II HLA epitope matching—a strategy to minimize de novo donor‐specific antibody development and improve outcomes. Am J Transplant. 2013;13:3114–22. [DOI] [PubMed] [Google Scholar]
Associated Data
This section collects any data citations, data availability statements, or supplementary materials included in this article.
Supplementary Materials
Fig. S1
Fig. S2
Fig. S3
Fig. S4
Appendix S1