

Abstract
Speciation is driven by the evolution of reproductive isolating barriers that reduce, and ultimately prevent, substantial gene flow between lineages. Despite its central role in evolutionary biology, the process can be difficult to study because it proceeds differently among groups and may occur over long timescales. Due to this complexity, we typically rely on generalizations of empirical data to describe and understand the process. Previous reviews of reproductive isolation (RI) in flowering plants have suggested that prezygotic or extrinsic barriers generally have a stronger effect on reducing gene flow compared to postzygotic or intrinsic barriers. Past conclusions have rested on relatively few empirical estimates of RI; however, RI data have become increasingly abundant over the past 15 years. We analyzed data from recent studies quantifying multiple pre‐ and postmating barriers in plants and compared the strengths of isolating barriers across 89 taxa pairs using standardized RI metrics. Individual prezygotic barriers were on average stronger than individual postzygotic barriers, and the total strength of prezygotic RI was approximately twice that of postzygotic RI. These findings corroborate that ecological divergence and extrinsic factors, as opposed to solely the accumulation of genetic incompatibilities, are important to speciation and the maintenance of species boundaries in plants. Despite an emphasis in the literature on asymmetric postmating and postzygotic RI, we found that prezygotic barriers acted equally asymmetrically. Overall, substantial variability in the strengths of 12 isolating barriers highlights the great diversity of mechanisms that contribute to plant diversification.
Keywords: Gene flow, isolating barriers, postzygotic, prezygotic, reproductive isolation, speciation
“Unfortunately, only a few studies provide comprehensive estimates of isolation between pairs of sibling species…. Our understanding of reproductive isolation will…be enhanced by additional field‐based estimates of isolation across all life history stages.”
– Rieseberg and Willis (2007)
“There is no denying that the estimation of RI [reproductive isolation] is difficult: direct estimates of total RI require a barrage of field and laboratory studies, which is challenging for many organisms…, (yet) many researchers have risen to the challenge of estimating RI for the organisms that they study….”
– Stankowski and Ravinet (2021)
The existence of clustered biological diversity (i.e., species) and the process generating this diversity (i.e., speciation) have fascinated evolutionary biologists for generations (Darwin 1859; Turesson 1922; Stebbins 1950; Grant 1981; Schemske 2000; Coyne and Orr 2004; Sobel et al. 2010; Coughlan and Matute 2020). Speciation under the Biological Species Concept is characterized by the evolution of reproductive barriers, resulting in a substantial reduction or the complete cessation of gene flow between diverging lineages (Coyne and Orr 2004; Schemske 2010). Conceptually, a splitting of ancestral lineages may seem straightforward, yet this apparent simplicity belies the great complexity of the speciation process and the fact that it may proceed heterogeneously in different groups (Baack et al. 2015). Substantial strides over the past decade in genomics (Brandvain et al. 2014a; Todesco et al. 2020; Nelson et al. 2021) and comparative phylogenetic methods (Pérez‐Escobar et al. 2017; Price‐Waldman et al. 2020) have given researchers the ability to increasingly dissect the genetic underpinnings and macroevolutionary outcomes of speciation. In addition to these methodological advances that can be applied to well‐developed study systems, there remains a great deal to be learned about mechanisms that generate and maintain species‐level diversity by accumulating empirical evidence on the strength of multiple reproductive isolating barriers across a great variety of study systems (Turelli et al. 2001; Rieseberg and Willis 2007; Baack et al. 2015; Hernández‐Hernández et al. 2021; Stankowski and Ravinet 2021).
One major focus of plant speciation research has been to determine the relative strength of different isolating barriers (Chari and Wilson 2001; Ramsey et al. 2003; Husband and Sabara 2004; Kay 2006; Martin and Willis 2007). Findings from individual case studies quantifying the strength of various components of reproductive isolation (RI) can be informative about which barriers contribute most strongly to the generation and maintenance of species boundaries in specific systems. Taken together, patterns of RI gleaned from multiple systems can illuminate generalities of the speciation process (reviewed in Lowry et al. 2008; Widmer et al. 2009; Schemske 2010; Sobel et al. 2010; Baack et al. 2015; Hernández‐Hernández et al. 2021). Despite the promise of comparing data across systems, prior to 2007 studies quantifying multiple premating and postmating reproductive barriers in the same system, and particularly in the same individual study, were relatively rare (as noted by Rieseberg and Willis 2007; and see Results).
In 2008, Lowry et al. (2008) leveraged the available data on the strength of reproductive isolating barriers in 19 plant taxa pairs (ecotypes or species) to examine patterns of RI across angiosperms. One major finding showed that total prezygotic barrier strength was roughly twice as strong as total postzygotic barrier strength (Lowry et al. 2008), implicating extrinsic barriers and ecological divergence as primary drivers of angiosperm divergence and/or the maintenance of contemporary species boundaries. The data reviewed in Lowry et al. (2008) also suggested that individual species pairs often showed either complete prezygotic RI or complete postzygotic RI, but rarely both, suggesting that divergent lineages are often chiefly isolated by either extrinsic barriers or intrinsic ones. Thus, even if less common overall, this pattern suggested that intrinsic barriers and genetic incompatibilities may be important drivers of divergence and/or may act to maintain the integrity of species boundaries in some systems (e.g., Chen et al. 2014; Johnson et al. 2015; Coughlan and Matute 2020; Sandstedt et al. 2021). Lastly, Lowry et al. (2008) found that barrier asymmetry (i.e., the relative difference in how a specific isolating barrier affects one of the parental species or directions of a cross) was substantially stronger for postmating compared to premating barriers, as might be expected given the existence of the variety of mechanisms contributing to asymmetrical postmating and postzygotic RI (Tiffin et al. 2001; Turelli and Moyle 2007; Barnard‐Kubow and Galloway 2017; Broz and Bedinger 2021).
In 2015, Baack et al. (2015) surveyed 124 studies that had cited Lowry et al. (2008) and identified 13 additional plant studies quantifying multiple pre‐ and postzygotic barriers. Again, the cumulative data supported the conclusion that prezygotic barriers were generally stronger compared to postzygotic barriers, and thus contributed more to total RI in flowering plants (Baack et al. 2015). As with the earlier interpretation of the available data, this conclusion again was based on relatively few studies (32) and limited taxonomic coverage (including the chiefly temperate genera Iris, Mimulus, and Helianthus, as well as several orchid species pairs). Since that time, however, studies amassing empirical estimates of RI in plants have steadily increased (see Results). As noted by Stankowski and Ravinet (2021), despite the difficulties of quantifying multiple components of RI, many researchers have invested significant effort in determining the strength of various components of RI in their study systems. Perhaps previous reviews (Lowry et al. 2008; Widmer et al. 2009; Baack et al. 2015) and commentaries (Rieseberg and Willis 2007; Schemske 2010; Sobel et al. 2010) illustrating the utility of such an approach have motivated this work, although in any case, we have amassed substantially more RI data than were previously available, and such studies have increased in their breadth and sophistication.
The influx of RI data since the last comprehensive reviews of RI in flowering plants (Lowry et al. 2008; Widmer et al. 2009; Baack et al. 2015) now entails a much deeper sampling of angiosperm (and seed plant) taxa pairs (∼5× more taxa pairs than Lowry et al. [2008] and ∼3× more than Baack et al. [2015]), and a much broader sampling of families, genera, and tropical taxa, providing a more substantial cross section of plant diversity. Importantly, we can now employ unified RI metrics (see below) that allow for equivalent comparisons between prezygotic and postzygotic barrier strengths (Sobel and Chen 2014). We utilize a meta‐analysis approach to (1) revisit previous findings regarding the relative strengths of different isolating barriers, their asymmetries, and the relative contributions of premating and postmating barriers to total RI; (2) summarize geographic, taxonomic, and life‐history attributes of the taxa used in studies quantifying multiple components of RI to determine how generalizable findings might be across plants or flowering plants; and (3) discuss the future prospects of empirical studies of RI, and if and how they might continue to advance our understanding of plant speciation in the future.
Methods
LITERATURE SEARCHES AND INCLUSION CRITERIA
We searched the literature for studies quantifying RI in plant taxa pairs by identifying studies cited in previous reviews (Lowry et al. 2008; Widmer et al. 2009; Baack et al. 2015), associated methods papers (Sobel and Chen 2014), and then by searching Google Scholar using the phrases “reproductive isolation and plants,” “isolating barriers and plants,” “ barriers to gene flow and plants,” “pre‐pollination and post‐pollination and plants,” “premating and postmating and plants,” and “prezygotic and postzygotic and plants.” We searched the literature for peer‐reviewed manuscripts published prior to January 15, 2021; we did not include unpublished preprints. We followed the same chief inclusion criterion as Lowry et al. (2008), in that studies were only included if they directly quantified barrier strengths; studies with only qualitative assessments of RI such as “species mostly co‐flower” or “species share pollinators” were excluded. Due to the abundance of currently available data, and in contrast to Lowry et al., we required that at least a single premating and a single postmating barrier be quantified in the same publication. We did not amalgamate data from the same study system published separately. Studies that only quantified multiple postmating barriers (e.g., pollen‐pistil interactions and hybrid sterility) were not included. We included studies of taxa arising from hybrid or polyploid origin if they adhered to the other criteria and quantified additional barriers beyond those associated solely with interploidy compatibility. Lastly, we included studies that mechanistically examined a single or several species pairs; large comparative analyses across clades (e.g., Jewell et al. 2012; Larcombe et al. 2015; Kostyun and Moyle 2017) were not included, as such “Coyne and Orr” studies may trade breadth for depth when quantifying premating barriers (Christie and Strauss 2018) compared to the other detailed case studies included here.
DATA EXTRACTION AND CALCULATING BARRIER STRENGTHS
We included data from publications that provided direct empirical estimates of RI for which we were able to extract the raw data from the main text, tables, figures, or supplements. If provided, we extracted numerical RI data from the text and tables; when data were only presented graphically, we used ImageJ to extract the raw data from figures. We used the methods of Sobel and Chen (2014) (hereafter “S + C”) to calculate barrier strengths. Specifically, we used Equation RI4C:
to calculate the strength of some premating barriers, where S and U represent shared and unshared reproductive opportunities, respectively (e.g., shared and unshared geographic areas, flowering days, or pollinators). This metric is bound by zero (no RI) and one (total RI). We used Equation RI4A:
to calculate the strength of other premating barriers (those directly quantifying fitness components or mating attempts such as immigrant inviability or pollinator transitions) and all postmating barriers. Here, H and C represent heterospecific and conspecific fitness, respectively (e.g., the fitness of hybrid crosses compared to that of intraspecific crosses, or the fitness of F1s compared to that of parental types). This metric is bound by –1 (complete heterosis) and one (complete RI). These unified RI metrics allow for an accurate comparison between premating and postmating barrier strengths, as both equations directly relate RI to the probability of gene flow (Sobel and Chen 2014). By employing S + C RI metrics, we implicitly required that studies provide raw data (Table S1) for both intraspecific and interspecific comparisons such that we could calculate RI using the above equations. Publications that used other RI metrics without providing the raw data used in their calculations were excluded. If authors provided RI estimates using S + C metrics, we took their estimates directly from the manuscripts, regardless of whether they calculated barrier strengths using Equations RI4C and RI4A or using more sophisticated versions of these equations appropriate to their systems (Sobel and Chen 2014).
For each taxa pair and isolating barrier, we calculated the strength of RI for each parental taxon from its perspective as the maternal plant (for premating barriers), and in each direction of the cross (for postmating barriers). We averaged these directional values to calculate mean barrier strengths for each taxa pair and isolating barrier. We assessed overall differences in the strengths of isolating barriers using ANOVA (Anova function from the car package) (Fox et al. 2019) in R (R Core Team 2021). For all possible pairwise combinations of isolating barriers (e.g., immigrant inviability‐phenology, immigrant inviability‐F1 sterility, etc.) we compared pairwise barrier strengths using the emmeans and pairs functions from the emmeans package (Lenth 2021) in R.
BARRIER ASYMMETRY
We calculated barrier asymmetry by taking the absolute value of the differences in barrier strengths between the two parental taxa or crossing directions, as in Lowry et al. (2008). Here, barrier asymmetry values are bound by 0 and 2, with a value of 0 indicating that RI is the same or symmetrical between parents or crossing directions. A value of 2 would represent an extreme case in which one parent shows completely assortative mating or complete intrinsic RI (RI = 1) and the other shows complete disassortative mating or complete heterosis (RI = −1). We tested for differences in the asymmetry of barrier strengths between pre‐ and postzygotic barriers using a Wilcoxon test in R.
TOTAL RI
We extracted data for premating barriers that affected co‐occurrence, premating and prezygotic barriers that did not affect co‐occurrence, and postzygotic barriers (see below). For each taxa pair, we calculated total prezygotic RI, total postzygotic RI (in the absence of prezygotic barriers), and total cumulative RI resulting from the sequential action of all barriers following Equation RI4E from Sobel and Chen (2014). Our implementation of Equation RI4E assumes that barriers act independently of one another. We tested for differences in the overall strength of pre‐ and postzygotic barriers using a Wilcoxon test.
REPRODUCTIVE ISOLATING BARRIERS
In total, we extracted data for 12 isolating barriers, including five premating barriers (ecogeographic isolation, immigrant inviability, flowering time or phenology differences, mating system differences, and floral isolation), one measure of postmating prezygotic isolation (pollen‐pistil interactions), and six postzygotic barriers (fruit production, seed production, F1 germination, F1 viability, F1 sterility, and extrinsic postzygotic isolation). In cases in which authors estimated RI across multiple study sites, in different years, or using multiple genotypes pairs (e.g., if RI associated with seed production was estimated from multiple sympatric population pairs), we took the mean of these individual components to calculate a species‐level average estimate of RI for that isolating barrier. In cases in which authors provided multiple individual measures of RI falling within one of our barrier categories (e.g., estimates of RI associated with both pollinator assemblages and pollinator transitions, or estimates of RI associated with both seed number and seed mass), we used the maximum RI value associated with that component of RI. We provide a description of each isolating barrier and additional details regarding how both we and primary authors calculated each component of RI in the Supporting Information (Description of Isolating Barriers).
Results
We surveyed 70 studies published between 1996 and 2021 that quantified multiple reproductive isolating barriers in plants, and otherwise met our inclusion criteria. Of these 70 publications, 10 were also included in Lowry et al. (2008), and 60 new studies quantifying multiple components of RI have been published since. Nine publications originally included in Lowry et al. (2008) did not meet our more stringent inclusion criteria; specifically, these publications only provided data for a single isolating barrier, and we did not aggregate RI data within study systems from across multiple publications. Studies quantifying RI were published at a relatively low but steady rate of approximately two per year between 1996 and 2012; however, since 2012 such studies have become increasingly common (Fig. 1a). Of these 70 publications, 60 quantified RI in a single taxa pair, and 10 quantified RI in more than one pair (two pairs n = 2, three pairs n = 7, four pairs n = 1), resulting in RI data for 89 taxa pairs (Table S2). The available data predominantly included angiosperms (n = 86 angiosperm pairs); however, we did find one study quantifying RI in gymnosperms (n = 3 gymnosperm pairs).
Figure 1.

Summary statistics for publications quantifying multiple components of reproductive isolation in plants. (a) Publications by year. (b) Most frequent families. (c) Most frequent genera. (d) Taxonomic rank of study pairs. (e) Lifeform of study taxa. (f) Life history of study taxa. (g) Geography of study taxa. (h) Number of isolating barriers quantified. (i) Use of Sobel and Chen (S + C) RI metrics in studies published since 2015.
Primary researchers quantified RI in 31 flowering plant families (as well as one gymnosperm family, the Pinaceae) and 50 genera. The Orchidaceae (17% of all taxa pairs), Orobanchaceae (11%), and Asteraceae (10%) were the best represented families (Fig. 1b). Ophrys (8% of all taxa pairs), Pedicularis (8%), Mimulus (synonym: Erythranthe) (6%), Senecio (6%), Centaurium (4%), and Primula (4%) were the best represented genera (Fig. 1c). Species represented 75% of taxa pairs, ecotypes represented 16%, cytotypes represented 7%, and subspecies represented 2% of studied pairs (Fig. 1d). We grouped subspecies (n taxa pairs = 2) with ecotypes in subsequent figures, as both represent groupings of populations within species. Herbaceous taxa (78%) predominated the dataset; there were only a few shrubs (15%) and trees (7%), and very few grasses (1%) (Fig. 1e). Most taxa pairs were perennial (83%); relatively few had annual (8%), biennial (2%), or some combination of annual, biennial, and perennial (A/B/P) life histories (7%) (Fig. 1f). Seventy‐five percent of taxa pairs were sympatric at least in part of their ranges (and studies overwhelmingly focused on sympatric populations when they were available), whereas 18% of taxa pairs were parapatric or occurred along contact zones, and only 7% were strictly allopatric (Fig. 1g). Eighteen percent of taxa pairs were from the tropics (<23.5 degrees latitude), whereas 82% of all taxa pairs were from the temperate zone.
The number of reproductive isolating barriers that each study quantified varied tremendously, ranging from two to eight individual barriers (Fig. 1h). We required that publications quantify at least a single premating and a single postmating isolating barrier, thus at minimum, two total barriers were required for inclusion. The bulk of studies meeting our inclusion criteria quantified three to six barriers (interquartile range), and the mode was five barriers (Fig. 1h). Of studies published since 2015, 53% used the unified RI metrics proposed by Sobel and Chen (2014), whereas 47% used alternative metrics of RI (Fig. 1i).
BARRIER STRENGTHS
There was substantial variation in barrier strength (BS) across all 12 of the isolating barriers for which we had available data (Table 1; Fig. 2). Besides mating system differences (BS = −0.05 to–0.29) and F1 viability (BS = −0.53 to 0.64) that were the weakest isolating barriers on average, all other isolating barriers ranged in strength from close to 0 (or less than 0) to almost 1, indicating that across study systems individual barriers can have no effect on reducing gene flow (RI = 0) or can act as complete barriers (RI = 1) entirely on their own. Overall, there was a significant difference in strength among isolating barriers (ANOVA F 11,388 = 9.76, P < 0.001, Type III sum of squares).
Table 1.
Summary of barrier strengths (BS), including mean, median, minimum, maximum, and interquartile ranges
| Isolating Barrier | Life History Stage | n Taxa Pairs | Percentage of Pairs with RI Data | BS Mean | BS Median | BS Minimum | BS Maximum | BS Interquartile Range |
|---|---|---|---|---|---|---|---|---|
| Ecogeographic isolation | Premating | 26 | 29.21 | 0.589 | 0.630 | 0.210 | 0.937 | 0.433–0.720 |
| Geography | 22 | 24.72 | 0.589 | 0.606 | 0.210 | 0.937 | 0.428–0.737 | |
| Microhabitat | 6 | 6.74 | 0.462 | 0.454 | 0.226 | 0.720 | 0.282–0.632 | |
| Immigrant inviability | Premating | 22 | 24.72 | 0.523 | 0.580 | −0.002 | 1.000 | 0.251–0.833 |
| Phenology | Premating | 52 | 58.43 | 0.375 | 0.299 | 0.001 | 1.000 | 0.166–0.560 |
| Mating system | Premating | 10 | 11.24 | 0.066 | 0.001 | −0.048 | 0.285 | 0.000–0.111 |
| Floral isolation | Premating | 59 | 66.29 | 0.611 | 0.760 | −0.490 | 1.000 | 0.308–0.977 |
| Pollinator assemblages | 25 | 28.09 | 0.464 | 0.372 | −0.115 | 1.000 | 0.216–0.819 | |
| Pollinator transitions | 26 | 29.21 | 0.624 | 0.774 | −0.490 | 1.000 | 0.386–0.969 | |
| Pollen deposition | 18 | 20.22 | 0.720 | 0.928 | −0.038 | 1.000 | 0.500–1.000 | |
| Pollen pistil interactions | Postmating prezygotic | 30 | 33.71 | 0.441 | 0.486 | −0.120 | 1.000 | 0.134–0.792 |
| _ _ _ _ _ _ _ _ _ _ _ _ _ _ _ _ _ _ _ _ _ _ _ _ _ _ _ _ _ _ _ _ _ _ _ _ _ _ _ _ _ _ _ _ _ _ _ _ _ _ _ _ _ _ _ _ _ _ _ _ _ _ _ _ _ _ _ _ _ _ _ _ _ _ _ _ _ _ _ _ _ _ _ _ _ _ _ _ _ _ _ _ _ | ||||||||
| Fruit production | Postzygotic | 40 | 44.94 | 0.202 | 0.121 | −1.000 | 1.000 | −0.001 to 0.397 |
| Seed production | Postzygotic | 62 | 69.66 | 0.226 | 0.181 | −1.000 | 1.000 | 0.037–0.401 |
| F1 germination | Postzygotic | 33 | 37.08 | 0.227 | 0.076 | −0.408 | 1.000 | 0.000–0.521 |
| F1 viability | Postzygotic | 25 | 28.09 | 0.068 | 0.017 | −0.525 | 0.635 | −0.022 to 0.210 |
| F1 sterility | Postzygotic | 21 | 23.60 | 0.325 | 0.208 | −0.013 | 0.982 | 0.020–0.663 |
| Extrinsic postzygotic isolation | Postzygotic | 20 | 22.47 | 0.333 | 0.356 | −0.158 | 1.000 | 0.138–0.522 |
Note: The dashed line delineates prezygotic from postzygotic barriers. In addition to overall summary statics, we provide additional summary statistics for subcategories within the Ecogeographic Isolation (geographic isolation and microhabitat isolation) and Floral Isolation (pollinator assemblages, pollinator transitions, and pollen deposition) barriers. Italics denote subcategories.
Figure 2.

Density plots of barrier strengths for 12 reproductive isolating barriers as assessed in 89 plant taxa pairs. Barriers are organized along the x‐axis by the order in which they act throughout an organisms’ life history. Numbers in parentheses refer to the number of taxa pairs for which RI data were available. Barrier strengths are estimated using Sobel and Chen RI metrics and range from –1 (complete disassortative mating or heterosis) to 1 (complete RI). Small colored points represent mean barrier strengths for individual taxa pairs; large black points represent the overall mean strength of each isolating barrier. A dashed vertical line delineates prezygotic from postzygotic barriers. We grouped subspecies (n pairs = 2) with ecotypes here as both represent groupings of populations within species.
On average, floral isolation (mean BS = 0.61), ecogeographic isolation (mean BS = 0.59), and immigrant inviability (mean BS = 0.52) were the strongest premating barriers and the strongest barriers overall. Pollen‐pistil interactions (mean BS = 0.44) had a slightly lower average barrier strength compared to these earlier‐acting premating barriers but were generally stronger than later‐acting postzygotic barriers. Four of five intrinsic postzygotic barriers had average barrier strengths of RI = 0.20–0.33, whereas F1 viability was notably ineffective in reducing gene flow overall (mean BS = 0.07) (Table 1; Fig. 2). Extrinsic postzygotic RI (mean BS = 0.33) was the strongest postzygotic barrier.
Given the great variability in the strength of each individual isolating barrier (Fig. 2), only 29% of all possible pairwise comparisons among individual barriers (e.g., immigrant inviability‐phenology, immigrant inviability‐F1 sterility, etc.) were significantly different after correcting for multiple comparisons with Tukey's HSD (Fig. S1). All but two of the significant pairwise differences involved one of the three strongest isolating barriers—floral isolation, ecogeographic isolation, and immigrant inviability (Fig. S2).
Floral isolation (66% of taxa pairs) and phenology (58% of taxa pairs) were the most commonly quantified premating barriers; the outcome of pollen‐pistil interactions (i.e., postmating prezygotic isolation) was quantified in one third of all taxa pairs (34%); and seed production in hybrid crosses was the most commonly quantified postzygotic barrier (70% of taxa pairs). Aside from mating system differences that were only pertinent in a few taxa pairs (n = 10), extrinsic postzygotic isolation (n pairs = 20), F1 sterility (n pairs = 21), and immigrant inviability (n pairs = 22) were the least‐commonly quantified barriers (Table 1).
TAXONOMIC CLASSIFICATIONS, GEOGRAPHIC CONTEXT, AND INDIVIDUAL BARRIER STRENGTHS
The dataset was skewed toward species pairs (n = 67) with relatively few cytotype (n = 6) or ecotype (n = 14) pairs, and most taxa pairs were also at least partially sympatric (75%) or parapatric (18%). Given this uneven sampling, we did not test for differences in barrier strengths among taxonomic groups or across geographies; however, several interesting trends emerged when qualitatively examining these differences. Ecotypes showed stronger immigrant inviability and extrinsic postzygotic isolation than did species (Fig. S3), highlighting strong ecological differences in taxa pairs with weak intrinsic postzygotic RI. Floral isolation was strongest among species pairs, specifically sympatric species pairs. Fruit production and seed production in hybrid crosses had equal strengths across all taxonomic groups, and it was not until the F1 generation that species or cytotype pairs showed stronger intrinsic RI than ecotypes (Fig. S3).
ESTIMATES OF TOTAL RI, AND THE RELATIVE STRENGTHS OF PREZYGOTIC AND POSTZYGOTIC RI
When accounting for the action of multiple individual isolating barriers, study pairs on average showed very high levels of total RI (mean = 0.84; median = 0.98; interquartile range = 0.82–1.00). Twenty four of 89 taxa pairs (27%) showed complete RI (RI = 1), and 53% of taxa pairs showed near complete RI (RI > 0.95). Overall, the strength of total prezygotic RI differed significantly from that of total postzygotic RI (Wilcoxon test, P < 0.001). Total prezygotic RI was approximately twice as strong (mean = 0.73, median = 0.88) as total postzygotic RI (mean = 0.41, median = 0.49). Seventeen of 89 taxa pairs (19%) were completely isolated by prezygotic barriers alone, 32 of 89 pairs (36%) showed substantial prezygotic isolation (RI > 0.95), and 61% of taxa pairs were very strongly isolated by prezygotic barriers (RI > 0.75) (Fig. 3, medium shading at right). Conversely, only seven of 89 pairs (8%) were completely isolated by postzygotic barriers, 10 of 89 pairs (11%) showed near complete postzygotic RI (RI > 0.95), and 24% of pairs were strongly isolated by postzygotic barriers (Fig. 3, medium shading at top). Overall, 17% of taxa pairs were strongly isolated (RI > 0.75) by both prezygotic RI and postzygotic RI (Fig. 3, dark shading at top right), whereas 33% of taxa pairs were relatively weakly isolated (RI < 0.75) by both prezygotic and postzygotic barriers (Fig. 3, light shading in center). There was no correlation between the strength of total prezygotic and total postzygotic RI (Pearson's r = −0.12; P = 0.27).
Figure 3.
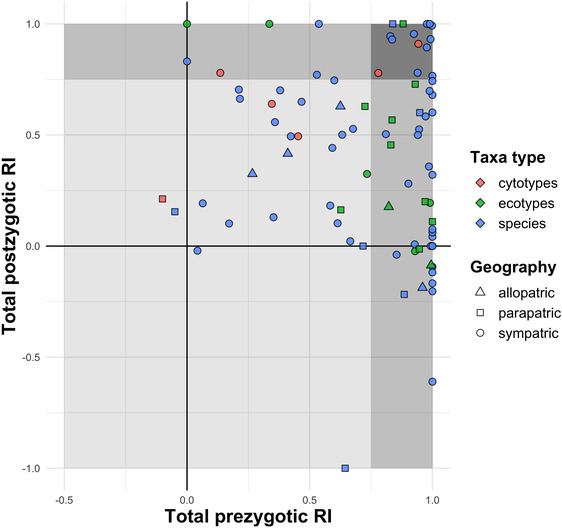
Comparison of total prezygotic to total postzygotic RI for 89 taxa pairs. Points represent the cumulative strength of all measured prezygotic and postzygotic barriers for each taxa pair. The strength of postzygotic barriers is calculated independently of the effect of earlier acting prezygotic barriers. Negative values for prezygotic RI represent instances in which there is a higher likelihood of interspecific compared to intraspecific mating opportunities; negative values for postzygotic RI reflect heterosis, or instances in which interspecific crosses had higher fitness than intraspecific crosses. Light shading indicates that neither total prezygotic or total postzygotic RI is >0.75; medium shading indicates that either total pre‐ or total postzygotic RI is >0.75; dark shading indicates that both prezygotic and postzygotic RI are >0.75.
There was no correlation between the number of barriers quantified and total RI (Pearson's r = 0.03, P = 0.81); however, there was a significant correlation between total prezygotic RI and the number of prezygotic barriers measured (Pearson's r = 0.26; P = 0.01), as well as between total postzygotic barrier strength and the number of postzygotic barriers assessed (Pearson's r = 0.22; P < 0.05).
BARRIER STRENGTH ESTIMATES FROM LOWRY ET AL. (2008) COMPARED TO THE CURRENT DATASET
Lowry et al. (2008) included 19 taxa pairs in their analysis of RI in flowering plants. We included data from 10 of those pairs here, as well as newly published data from 79 additional taxa pairs. There was a remarkable concordance in estimates of total RI, total prezygotic RI, and total postzygotic RI between the data in Lowry et al. and the current dataset. Calculating estimates of RI using Sobel and Chen (2014) RI metrics, taxa pairs from Lowry et al. had an average RITOTAL = 0.80, RIPRE = 0.70, and RIPOST = 0.43, compared to values of RITOTAL = 0.84, RIPRE = 0.73, and RI = 0.41, respectively, for the current dataset. The average number of barriers measured was equivalent in both datasets (mean ± SD = 4.40 ± 2.07 and 4.51 ± 1.77, respectively).
BARRIER ASYMMETRY
All isolating barriers excluding immigrant inviability, mating system, and extrinsic postzygotic RI displayed pear‐shaped distributions (Fig. 4), indicating that on average most barriers acted symmetrically between both directions of potential mating and/or both directions of a cross. Every isolating barrier also showed substantial variability in asymmetry, often ranging from 0 to 1 (i.e., instances in which RI is complete for one parent or direction of the cross, but entirely absent for the other), indicating substantial differences in the directionality of potential gene flow. Phenology (mean asymmetry = 0.15), fruit production (0.17), and F1 sterility (0.17) were the least asymmetric barriers, whereas mating system (0.73), pollen‐pistil interactions (0.31), and immigrant inviability (0.31) were the most asymmetric (Fig. 4). Overall, there was no difference in the asymmetry of total prezygotic RI (mean asymmetry = 0.25) and total postzygotic RI (mean asymmetry = 0.22) (Wilcoxon test, P = 0.56).
Figure 4.

Density plots of barrier asymmetry, calculated as the absolute value of the difference in barrier strength between parents, and/or crossing directions. Values of zero indicate that barriers act symmetrically, whereas the most asymmetric barriers are theoretically bound by a value of two. Small colored points represent values for individual taxa pairs; large black points represent the mean asymmetry for each isolating barrier. A dashed vertical line delineates prezygotic from postzygotic barriers.
Discussion
A surge of studies quantifying multiple reproductive barriers in plants over the past 15 years has provided a wealth of empirical data from across numerous study systems. Using a meta‐analysis approach, we leveraged newly available data to uncover generalities about the complex and heterogeneous nature of plant speciation. We found great variability in the strength of all isolating barriers, suggesting that myriad factors can reduce or prevent gene flow between diverging lineages. In agreement with previous reviews of the strength of RI in flowering plants (Lowry et al. 2008; Baack et al. 2015), we found that on average total prezygotic RI was approximately twice as strong as total postzygotic RI. Many more taxa pairs were strongly isolated by prezygotic barriers alone compared to those isolated by postzygotic barriers alone, further suggesting a disproportionate effect of extrinsic barriers in minimizing contemporary gene flow. In contrast to the findings of Lowry et al. (2008) and the past emphasis in the literature on asymmetric postzygotic RI, we found that postzygotic barriers were no more asymmetric in their effects than prezygotic barriers. We discuss how generalizable these findings might be across plants and flowering plants at large, and the prospects of such empirical studies of RI to continue advancing our understanding of plant speciation.
WHAT ARE THE RELATIVE STRENGTHS OF REPRODUCTIVE ISOLATING BARRIERS ACROSS LIFE HISTORY STAGES?
A major goal of recent speciation research in plants has been to understand the relative contributions of premating and postmating barriers in reducing gene flow between divergent lineages (Baack et al. 2015; Rabosky 2016; Stankowski and Ravinet 2021). A finding of relatively stronger premating barriers would lend support to the prevalence of ecological or extrinsic barriers in driving divergence or maintaining species integrity (Schluter 2009; Schemske 2010). A finding of relatively stronger postmating or postzygotic barriers would suggest that intrinsic barriers are more crucial to the generation and maintenance of species diversity, particularly given that extrinsic barriers can break down under environmental perturbation (Ortego et al. 2017; Schumer et al. 2017; Grabenstein and Taylor 2018). Alternatively, genetic incompatibilities resulting in intrinsic reproductive barriers may evolve directly with adaptive alleles or indirectly as a by‐product of selection on other traits (Coyne and Orr 2004); thus, multiple prezygotic and postzygotic isolating barriers may evolve in concert, jointly driving the speciation process. Ultimately, the ability of diverging lineages to persist long enough for the completion of speciation (i.e., the evolution of substantial barriers to gene flow that prevent lineage reabsorption) hinges on the extent of their ecological divergence, genetic incompatibility, and geographic context (Germain et al. 2021). Documenting taxa pairs at different points along this continuum is an important step in linking the evolution of reproductive barriers with the generation and maintenance of species‐level diversity.
After surveying more than four times more taxa pairs (n = 89) than Lowry et al. (2008), we found a remarkable concordance of results—in both datasets, the cumulative strength of prezygotic barriers was approximately twice that of postzygotic barriers (RIPRE = 0.70 vs. RIPOST = 0.43 in the original review, and RIPRE = 0.73 vs. RIPOST = 0.41 in the present analysis). We calculated total postzygotic RI irrespective of the strength of earlier acting barriers, so this finding is not explained by the sequential action of barriers (i.e., that prezygotic barriers have a chance to act before postzygotic barriers). Within individual study systems, we found that 61% of taxa pairs were very strongly isolated by prezygotic barriers alone (RI > 0.75) compared to only 24% that were strongly isolated by postzygotic barriers alone (Fig. 3). These patterns suggest that in aggregate, as well as in most cases, earlier acting extrinsic barriers are on average more important in reducing contemporary gene flow in divergent plant taxa.
Despite an overall trend for stronger prezygotic barriers, there was substantial variability in the strength of almost all individual isolating barriers (Fig. 2). For nine of the 12 barriers surveyed, a single barrier could have no effect whatsoever on reducing gene flow (RI = 0) or could substantially reduce gene flow entirely on its own (RI ≥ 0.95), highlighting the truly remarkable diversity of mechanisms that can reduce or prevent gene flow in flowering plants.
In agreement with the vast literature documenting the role of pollinators in angiosperm diversification (Grant 1994; Kay and Sargent 2009; Van der Niet et al. 2014), floral isolation was on average the strongest single isolating barrier (Table 1). Species pairs, and specifically sympatric species pairs, showed extremely high levels of floral isolation (Figs. 2, S3), suggesting that closely related plant species that co‐occur likely infrequently experience heterospecific pollen transfer and gene exchange due to differences in pollinator and pollination dynamics. Although intrinsic barriers may prevent less gene flow than extrinsic barriers on average, they too can be potent and presumably causative agents of speciation in some cases (Figs. 2, 3). We found no correlation between the strength of total prezygotic and postzygotic barriers, suggesting that intrinsic and extrinsic barriers generally evolve unpredictably. Thus, for example, even if local adaptation indirectly selects for intrinsic RI (e.g., if genes associated with differential soil adaptation and hybrid sterility are closely linked; Wright et al. 2013), it seems unlikely that we will be able to predict the magnitude of how extrinsic barriers might drive intrinsic ones, or how genetic incompatibilities might relate to ecological divergence.
BARRIER ASYMMETRY
Asymmetric postzygotic RI is common in plants (Tiffin et al. 2001) and typically results from cytoplasmic‐nuclear interactions or other uniparentally inherited genetic factors (Turelli and Moyle 2007; Brandvain et al. 2014b; Barnard‐Kubow and Galloway 2017; Coughlan et al. 2020). Asymmetric RI at the postmating prezygotic stage is also common (Broz and Bedinger 2021), typically due to differences in style length (Keller et al. 2016) or mating system between parents (Ishizaki et al. 2013; Briscoe Runquist et al. 2014) and the resulting outcomes of pollen competition. Such asymmetry or directionality of potential gene flow can have major implications for the dynamics of introgression (e.g., Jacquemyn et al. 2012; Kenney and Sweigart 2016; Hu et al. 2021; Ostevik et al. 2021), yet this phenomenon is not only restricted to postmating life history stages. For example, asymmetric patterns of heterospecific pollen transfer are common (Moreira‐Hernández and Muchhala 2019) and may result from differences in floral morphology (Minnaar et al. 2019) or pollinator behavior (Christie et al. 2021; Keller et al. 2021).
In contrast to Lowry et al. (2008), we found no differences in the asymmetry of total prezygotic compared to total postzygotic RI. Although pollen‐pistil interactions and mating system differences were relatively strongly asymmetric as expected (Fig. 4), another premating barrier, immigrant inviability, was also among the most asymmetric. Conversely, none of the intrinsic postzygotic isolating barriers were particularly asymmetric in their effects (Fig. 4). Asymmetric postmating RI, particularly that associated with hybrid viability and hybrid sterility, has been dubbed Darwin's Corollary to Haldane's Rule (Turelli and Moyle 2007; Brandvain et al. 2014b), referring to the idea that one direction of a cross (as opposed to the heterogametic sex as in Haldane's Rule) may suffer a greater fitness cost than the other. Here, cyto‐nuclear Dobzhansky‐Muller incompatibilities (DMIs) may underlie asymmetric RI (Turelli and Moyle 2007), whereas RI stemming from chromosomal rearrangements is expected to be symmetric (Tiffin et al. 2001). Across 89 taxa pairs, neither RI associated with seed production in hybrid crosses (n = 62 taxa pairs), F1 viability (n = 25 pairs), or F1 sterility (n = 21 pairs) acted particularly asymmetrically on average (Fig. 4), suggesting that pronounced asymmetry at postzygotic life history stages may be the exception rather than the rule in plants. The relatively modest levels of asymmetry associated with F1 viability and F1 sterility (Fig. 4) suggest that nuclear‐nuclear DMIs or chromosomal rearrangements may be more prevalent than cyto‐nuclear DMIs or other uniparentally inherited genetic factors in driving postzygotic RI in plants.
LOCAL ADAPTATION AND EXTRINSIC POSTZYGOTIC RI
A rich literature documents local adaptation in plants (reviewed in Leimu and Fischer 2008; Hereford 2009; Briscoe Runquist et al. 2020), yet relatively less work has documented the connection between local adaptation and the evolution of RI (e.g., Wright et al. 2013; Melo et al. 2014; Richards and Ortiz‐Barrientos 2016; Wilkinson et al. 2021), despite past commentaries advocating for such an approach (Givnish 2010; Schemske 2010; Sobel et al. 2010). Interestingly, the ecotypes examined here tended to have much stronger levels of RI associated with immigrant inviability and extrinsic postzygotic isolation but lower levels of intrinsic RI acting on F1s than did “species” (Fig. S3), potentially highlighting different stages of the speciation continuum or alternative divergence processes. If local selective pressures contribute to immigrant inviability, we might also expect that F1s with intermediate phenotypes should show reduced fitness compared to parental taxa (Schluter 2001; Rundle 2002; Nosil et al. 2005). Immigrant inviability is often a stronger reproductive barrier than extrinsic postzygotic RI (Figs. 2, S1), perhaps due to heterotic effects in F1s (Lowry et al. 2008; Melo et al. 2014). Lowry et al. (2008) found no correlation between the strength of immigrant inviability and extrinsic postzygotic RI. Here, consistent with the qualitative conclusions of Baack et al. (2015), we found a significant positive correlation between extrinsic barriers acting at both prezygotic and postzygotic life history stages (Pearson's rho = 0.58, P = 0.02; n = 16 taxa pairs). Overall, less than 20% of studies quantified the fitness of both migrants and F1s under field conditions, yet these studies support divergent natural selection as a potent driver of RI (Schluter 2009).
Immigrant inviability (mean asymmetry = 0.31) was one of the most asymmetric barriers examined (Fig. 4), with one parent often incurring substantially stronger fitness losses when colonizing a foreign habitat compared to the other. This result perhaps reflects varying costs of local adaptation, in which colonization of new habitats is associated with trade‐offs for one parental species, but the magnitude of such trade‐offs is not strong enough to preclude the other parent from occupying a novel habitat (Hereford 2009). For example, a generalist lineage occupying a specialized habitat may be able to survive sufficiently well, whereas a specialist lineage might show high mortality outside of its favored habitat, resulting in high asymmetry for immigrant inviability. Further explorations of asymmetric immigrant inviability and extrinsic postzygotic RI combined with concomitant genetic analyses will provide additional insight into the role of asymmetric extrinsic RI in driving patterns of introgression in plants.
WHAT TYPES OF TAXA AND DIVERGENCE SCENARIOS IS THIS DATASET RELEVANT TO?
Quantifying multiple components of RI in individual study systems can be a powerful way to understand mechanisms that reduce gene flow and contribute to the generation and maintenance of species boundaries; however, this approach has been applied very unevenly across plants. To date, empirical estimates of RI from across multiple life history stages have been collected from exceedingly few gymnosperms (although we did include one study that examined RI in three Pinus species pairs), <10% of flowering plant families, and from only a miniscule fraction of the approximately 13,000 extant angiosperm genera (Salamin et al. 2005) (Fig. 1). Moreover, these estimates have been largely restricted to herbaceous perennials (Fig. 1), particularly those from the temperate zone (only 18% of taxa pairs were from the tropics). Studies included in this analysis were strongly biased toward species pairs, as less than 20% of taxa pairs consisted of ecotypes or subspecies (Fig. 1). Excluding the potential difficulties of using rank‐based taxonomy to describe shared evolutionary history (Barraclough and Humphreys 2015) or the degree of genetic differentiation (Lowry 2012), one could argue that “species” by definition should show greater levels of total RI than “ecotypes.” If so, species would fall further toward the “complete RI” end of the speciation continuum (Stankowski and Ravinet 2021) and may have accumulated additional RI even after gene flow has ceased (Rieseberg and Blackman 2010; Schemske 2010; Sobel et al. 2010; Kulmuni et al. 2020). Thus, estimates of RI included here could be skewed toward those barriers that prevent contemporary gene flow, as opposed to those that contributed to initial divergence.
Determining the likelihood and prevalence of different geographic modes of speciation has received a great deal of attention in the literature (e.g., Coyne and Orr 2004; Savolainen et al. 2006; Stuessy 2006; Bolnick and Fitzpatrick 2007; Skeels and Cardillo 2019). In a recent review of 622 sister species pairs, 30% of plant sister pairs were allopatric and the remaining 70% were either fully (18%) or partially (52%) sympatric (Hernández‐Hernández et al. 2021), suggesting that most instances of plant speciation entail at least some phase of sympatry. Seventy‐five percent of taxa pairs in our analysis shared at least some degree of range overlap (Fig. 3), thus our findings may be applicable to many divergence scenarios in plants. Strictly allopatric taxa pairs (7%) were strongly underrepresented, however; thus, patterns documented here offer little help in explaining mechanisms contributing to RI in such pairs (e.g., Boucher et al. 2016; Sandstedt et al. 2021). Our inclusion criteria (i.e., studies had to quantify at least a single premating and a single postmating barrier) may have also generated ascertainment bias for sympatric study systems as it can be unclear whether field‐based estimates of prezygotic RI are meaningful for entirely allopatric pairs (Coyne and Orr 2004). The presence of extremely strong and putatively causal individual mechanisms of divergence, for example, cases of strong floral isolation driving divergence, may have skewed the dataset. Furthermore, publication bias may have resulted in studies documenting strong ecological divergence, perhaps to the exclusion of those documenting strong postzygotic RI in the absence of ecological divergence. Studies aimed at detailing specific mechanisms of postzygotic isolation (e.g., Zuellig and Sweigart 2018; Coughlan et al. 2020; Sandstedt et al. 2021) were commonly omitted because they did not quantify prezygotic barriers, even if postzygotic RI was the putative driver of divergence.
F2s AND BEYOND: POTENTIAL TENSION BETWEEN HETEROSIS AND INTRINSIC POSTZYGOTIC RI
Several studies in this analysis quantified extrinsic postzygotic RI in both F1s and F2s (Emms and Arnold 1997; Koelling and Mauricio 2010; Karrenberg et al. 2019), and it has been well‐appreciated that heterotic effects in F1s might dilute the strength of selection on hybrids occupying parental habitats (Lowry et al. 2008; Melo et al. 2014). The analogous phenomenon of heterosis in F1s masking the effects of intrinsic postzygotic RI seems to have been dramatically underexplored. None of the 70 studies quantified intrinsic RI in F2s, despite the possibility of hybrid breakdown manifesting as increased intrinsic RI in F2s or beyond (Bertel et al. 2016; Chapman et al. 2016; Zuellig and Sweigart 2018). This omission may have resulted from a variety of factors including a known absence of hybrid breakdown in the study system (Ramsey et al. 2003), uncertainty as to the biological relevance of quantifying RI in F2s due to the unknown relative frequency of F2s versus backcrosses in nature, or due to strong intrinsic RI in F1s resulting in very small sample sizes available for generating F2s or backcrosses (Christie and Strauss 2019). That said, few studies provided rationale for excluding F2s, and we suspect that this hurdle may have been mostly practical given the logistical challenges and time required to quantify RI across multiple generations. Approximately 15% of taxa pairs in this analysis showed very strong or complete prezygotic RI, but negative values for postzygotic RI (Fig. 3). If intrinsic incompatibilities are to some extent masked in F1s, a focus on solely first‐generation hybrids may be underestimating the true effect of intrinsic postzygotic isolation, particularly if recessive incompatibility alleles are involved (Zuellig and Sweigart 2018). Thus, future efforts to quantify intrinsic RI in F2s and/or backcrosses may shed additional light on whether heterosis in F1s consistently dampens the strength of intrinsic postzygotic RI.
MOVING FORWARD: WHAT MORE CAN WE LEARN FROM ADDITIONAL CASE STUDIES OF RI?
Two of our major findings corroborate earlier findings from Lowry et al's (2008) review of the strength of RI in flowering plants—prezygotic barriers on average reduced twice as much gene flow as postzygotic barriers, yet there was also incredible variability in the strength of barriers across systems. If 15 years of additional research output by the plant speciation community and RI data for 79 additional taxa pairs tell us much the same thing as did a significantly smaller dataset, what more is there to be learned from studies quantifying multiple components of RI? The current dataset has been substantially expanded compared to 2008, yet it remains woefully lacking for many taxonomic groups including gymnosperms, taxa pairs at early stages of divergence, both annual and woody lifeforms, allopatric taxa pairs, and taxa from the tropics. Although providing additional resolution of patterns of RI in angiosperms—the present analysis supported a much different conclusion regarding the relative asymmetry of prezygotic and postzygotic barriers than the original review—our conclusions still largely pertain to herbaceous perennials experiencing some degree of sympatry. We suspect that most studies included in our analysis were designed as components of broader research programs for species that were otherwise of interest (see below). Moving forward, diversifying sampling efforts might entail selecting taxa pairs with life‐history attributes that have been underexplored or quantifying extrinsic barriers in systems known to have high levels of intrinsic RI but for which ecological barriers have not yet been quantified.
Overall, we found no correlation between the number of barriers quantified and total RI. This may have resulted from the disproportionate effect prezygotic barriers have on total barrier strength; alternatively, it may suggest that authors quantified the most important barriers in their systems. Regardless, more thorough assessments of all isolating mechanisms will provide greater resolution for understanding relationships among barriers. Studies comprehensively quantifying multiple barriers to gene flow offer a greater ability to assess potential associations among barriers (Kostyun and Moyle 2017) and may offer insights into correlated trait evolution, the joint accumulation of premating and postmating RI, and reproductive character displacement and reinforcement (Suni and Hopkins 2018; Christie et al. 2021).
Studies quantifying RI provide the requisite evolutionary natural history knowledge necessary to answer deeper, process‐based questions. For example, several of the research groups cited in this analysis began by quantifying multiple barriers to gene flow in their systems and used initial findings as springboards for subsequent research. For example, in a comprehensive assessment of isolating barriers in Clarkia xantiana ssp. xantiana and ssp. parviflora, Briscoe Runquist et al. (2014) established that strong mating system, pollinator preference, and pollen competition barriers contributed to directional hybridization. This research group then used these findings to explore how patterns of co‐occurrence affected floral trait evolution (Briscoe Runquist and Moeller 2014), and how geographic variation in mating system was associated with population structure (Pettengill et al. 2016). Another thorough survey of reproductive barriers in Helianthus petiolaris ecotypes identified strong RI associated with immigrant inviability and extrinsic postzygotic RI (Ostevik et al. 2016), and follow‐up work identified structural rearrangements associated with this adaptive divergence (Huang et al. 2020).
Findings from individual studies will enable future comparative analyses across the speciation continuum, yet the efficient use of such data requires that RI estimates are comparable and accessible (Stankowski and Ravinet 2021). To this end, 47% of studies published since 2015 did not employ the unified S + C RI metrics (Sobel and Chen 2014), but to our knowledge none offered justification for using alternative metrics. This alone did not hinder the extraction of RI data from original publications, even if tedious; however, the exclusion of raw data from text, tables, and supplements makes empirical work invisible to future comparative analyses. We were forced to exclude many studies simply because they did not provide the data necessary to calculate RI in a standardized fashion. Empirical estimates of RI, if properly archived, will continue to act as invaluable foundations for future work both within and across systems.
A next step in advancing the study of speciation undoubtedly is to link organismal and microevolutionary processes, specifically the evolution of different components of RI, with macroevolutionary outcomes (Rieseberg and Willis 2007; Coughlan and Matute 2020; Matute and Cooper 2021). Why, for example, might plants show higher diversification rates compared to other kingdoms (Hernández‐Hernández et al. 2021), yet appear to have fewer examples of adaptive radiations (Martin and Richards 2019)? Is the remarkably uneven distribution of species diversity in angiosperms associated with different reproductive barrier strengths (Vamosi et al. 2018)? Does RI associated with floral isolation and geographic differences predict species diversity within angiosperms, as well as it does across land plants at large (Hernández‐Hernández and Wiens 2020)? Answer to these questions hinges on future comparative phylogenetic analyses, which themselves are predicated on empirical estimates of RI from across a variety of study systems. The “case studies” included in this analysis lack a phylogenetic dimension, whereas large‐scale comparative “Coyne and Orr” studies often lack ecological resolution. One potentially powerful approach to better understand the evolution of RI would be to combine aspects of both approaches—by carefully quantifying multiple intrinsic and extrinsic barriers to gene flow in the field and greenhouse in several population pairs with different levels of divergence or several closely related species pairs with different spanning divergence times.
Conclusions
Case studies quantifying multiple components of RI have provided insights on the relative strengths of pre‐ and postmating barriers in flowering plants for over 40 years (e.g., Kiang and Hamrick 1978; Misiewicz et al. 2020). Individually, such studies provide the vital evolutionary natural history information needed to further explore process‐based phenomena in specific systems (e.g., Briscoe Runquist and Moeller 2014; Pettengill et al. 2016; Ostevik et al. 2016; Christie and Strauss 2020). A surge of such studies over the past 15 years has provided the invaluable prerequisite data needed to move beyond system‐specific conclusions, facilitating more generalizable and comparative insights across broader taxonomic and phylogenetic groups. Although quantifying multiple isolating barriers is rather traditional and tedious compared to more modern high‐throughput research programs, such work continues to hold great promise for improving our understanding of plant speciation (Stankowski and Ravinet 2021). Future work using empirical RI data within a phylogenetic framework will allow us to explore the relationship between the strengths of specific isolating barriers and macroevolutionary patterns of diversification (Matute and Cooper 2021). We argue that hard work associated with quantifying multiple pre‐ and postmating reproductive barriers is time well spent and will continue to illuminate the causes and consequences of speciation in plants.
AUTHOR CONTRIBUTIONS
DBL and KC designed the study. KC and LSF extracted data from the primary literature. KC conducted analyses. KC and DBL wrote the manuscript.
DATA ARCHIVING
Data are archived in the Dryad Digital Repository (https://doi.org/10.25338/B8GS8S).
CONFLICT OF INTEREST
The authors declare no conflict of interest.
Associate Editor: J. W. Busch
Handling Editor: T. Chapman
Supporting information
Supplementary information
Supplementary information
Supplementary information
ACKNOWLEDGMENTS
First and foremost, we thank the primary authors for quantifying reproductive barriers in their study systems and generating the invaluable data used in this analysis. We encourage others to continue in their footsteps. We made every effort to be comprehensive in our literature search; we sincerely apologize if we overlooked your study for inclusion. We thank the participants of the Mechanisms of Plant Speciation Colloquium at 2021 Botanical Society of America meeting for their thoughtful comments about the project. We thank W. Mallory for assisting with early phases of data extraction. One anonymous reviewer and Associate Editor J. Busch provided insightful critiques of the manuscript. This work was supported by Michigan State University and by a National Science Foundation Postdoctoral Research Fellowship in Biology (1906759) to KC.
REFERENCES
- Baack, E. , Melo, M.C. , Rieseberg, L.H. & Ortiz‐Barrientos, D. (2015) The origins of reproductive isolation in plants. New Phytol., 207, 968–984. [DOI] [PubMed] [Google Scholar]
- Barnard‐Kubow, K.B. & Galloway, L.F. (2017) Variation in reproductive isolation across a species range. Ecol. Evol., 7, 9347–9357. [DOI] [PMC free article] [PubMed] [Google Scholar]
- Barraclough, T.G. & Humphreys, A.M. (2015) The evolutionary reality of species and higher taxa in plants: a survey of post‐modern opinion and evidence. New Phytol., 207, 291–296. [DOI] [PubMed] [Google Scholar]
- Bertel, C. , Hülber, K. , Frajman, B. & Schönswetter, P. (2016) No evidence of intrinsic reproductive isolation between two reciprocally non‐monophyletic, ecologically differentiated mountain plants at an early stage of speciation. Evol. Ecol., 30, 1031–1042. [Google Scholar]
- Bolnick, D.I. & Fitzpatrick, B.M. (2007) Sympatric speciation: models and empirical evidence. Annu. Rev. Ecol. Evol. Syst., 38, 459–487. [Google Scholar]
- Boucher, F.C. , Zimmermann, N.E. & Conti, E. (2016) Allopatric speciation with little niche divergence is common among alpine Primulaceae. J. Biogeogr., 43, 591–602. [Google Scholar]
- Brandvain, Y. , Kenney, A.M. , Flagel, L. , Coop, G. & Sweigart, A.L. 2014a. Speciation and introgression between Mimulus nasutus and Mimulus guttatus . PLoS Genet., 10, e1004410. [DOI] [PMC free article] [PubMed] [Google Scholar]
- Brandvain, Y. , Pauly, G.B. , May, M.R. & Turelli, M. 2014b. Explaining Darwin's corollary to Haldane's rule: the role of mitonuclear interactions in asymmetric postzygotic isolation among toads. Genetics, 197, 743–747. [DOI] [PMC free article] [PubMed] [Google Scholar]
- Briscoe Runquist, R.D. & Moeller, D.A. (2014) Floral and mating system divergence in secondary sympatry: testing an alternative hypothesis to reinforcement in Clarkia . Ann. Bot., 113, 223–235. [DOI] [PMC free article] [PubMed] [Google Scholar]
- Briscoe Runquist, R.D. , Chu, E. , Iverson, J.L. , Kopp, J.C. & Moeller, D.A. (2014) Rapid evolution of reproductive isolation between incipient outcrossing and selfing Clarkia species. Evolution; Internation Journal of Organic Evolution, 68, 2885–2900. [DOI] [PubMed] [Google Scholar]
- Briscoe Runquist, R.D. , Gorton, A.J. , Yoder, J.B. , Deacon, N.J. , Grossman, J.J. , Kothari, S. , Lyons, M.P. , Sheth, S.N. , Tiffin, P. & Moeller, D.A. (2020) Context dependence of local adaptation to abiotic and biotic environments: a quantitative and qualitative synthesis. Am. Nat., 195, 412–431. [DOI] [PubMed] [Google Scholar]
- Broz, A.K. & Bedinger, P.A. (2021) Pollen‐pistil interactions as reproductive barriers. Annu. Rev. Plant Biol., 72, 615–639. [DOI] [PubMed] [Google Scholar]
- Chapman, M.A. , Hiscock, S.J. & Filatov, D.A. (2016) The genomic bases of morphological divergence and reproductive isolation driven by ecological speciation in Senecio (Asteraceae). J. Evol. Biol., 29, 98–113. [DOI] [PubMed] [Google Scholar]
- Chari, J. & Wilson, P. (2001) Factors limiting hybridization between Penstemon spectabilis and Penstemon centranthifolius . Can. J. Bot., 79, 1439–1448. [Google Scholar]
- Chen, S. , Luo, Z. & Zhang, D. (2014) Pre‐ and post‐zygotic reproductive isolation between co‐occurring Mussaenda pubescens var. alba and M. shikokiana (Rubiaceae). J. Integr. Plant Biol., 56, 411–419. [DOI] [PubMed] [Google Scholar]
- Christie, K. , Fraser, L.S. & Lowry, D.B. (2022) Data and code used in: The strength of reproductive isolating barriers in seed plants: insights from studies quantifying premating and postmating reproductive barriers over the past 15 years. Dryad Dataset. 10.25338/B8GS8S. [DOI] [PMC free article] [PubMed]
- Christie, K. & Strauss, S.Y. (2018) Along the speciation continuum: quantifying intrinsic and extrinsic isolating barriers across five million years of evolutionary divergence in California jewelflowers. Evolution; Internation Journal of Organic Evolution, 72, 1063–1079. [DOI] [PubMed] [Google Scholar]
- ———. (2019) Reproductive isolation and the maintenance of species boundaries in two serpentine endemic Jewelflowers. Evolution; Internation Journal of Organic Evolution, 73, 1375–1391. [DOI] [PubMed] [Google Scholar]
- ———. (2020) Frequency‐dependent fitness and reproductive dynamics contribute to habitat segregation in sympatric jewelflowers. Proc. R. Soc. B Biol. Sci., 287, 20200559. [DOI] [PMC free article] [PubMed] [Google Scholar]
- Christie, K. , Doan, J.P. , Mcbride, W.C. & Strauss, S.Y. (2021) Asymmetrical reproductive barriers in sympatric jewelflowers: are floral isolation, genetic incompatibilities and floral trait displacement connected? Biol. J. Linn. Soc., 133, 835–852. [Google Scholar]
- Coughlan, J.M. & Matute, D.R. (2020) The importance of intrinsic postzygotic barriers throughout the speciation process. Philos. Trans. R. Soc. B Biol. Sci., 375, 20190533. [DOI] [PMC free article] [PubMed] [Google Scholar]
- Coughlan, J.M. , Brown, M.W. & Willis, J.H. (2020) Patterns of hybrid seed inviability in the Mimulus guttatus sp. complex reveal a potential role of parental conflict in reproductive isolation. Curr. Biol., 30, 83–93. [DOI] [PMC free article] [PubMed] [Google Scholar]
- Coyne, J.A. & Orr, H.A. (2004) Speciation. Sinauer Associates, Sunderland, MA. [Google Scholar]
- Darwin, C. (1859) On the origin of species by means of natural selection, or, the preservation of favoured races in the struggle for life. John Murray, Lond. [PMC free article] [PubMed] [Google Scholar]
- Emms, S.K. & Arnold, M.L. (1997) The effect of habitat on parental and hybrid fitness: transplant experiments with Louisiana irises. Evolution; Internation Journal of Organic Evolution, 51, 1112–1119. [DOI] [PubMed] [Google Scholar]
- Fox, J. , Weisberg, S. , Price, B. , Adler, D. , Bates, D. , Baud‐Bovy, G. & Bolker, B. (2019) car: companion to applied regression. R package version 3.0‐2.
- Germain, R.M. , Hart, S.P. , Turcotte, M.M. , Otto, S.P. , Sakarchi, J. , Rolland, J. , Usui, T. , Angert, A.L. , Schluter, D. & Bassar, R.D. (2020) On the origin of coexisting species. Trends Ecol. Evol., 36, 284–293. [DOI] [PubMed] [Google Scholar]
- Givnish, T.J. (2010) Ecology of plant speciation. Taxon, 59, 1326–1366. [Google Scholar]
- Grabenstein, K.C. & Taylor, S.A. (2018) Breaking barriers: causes, consequences, and experimental utility of human‐mediated hybridization. Trends Ecol. Evol., 33, 198–212. [DOI] [PubMed] [Google Scholar]
- Grant, V. (1981) Plant speciation. Columbia Univ. Press, New York. [Google Scholar]
- ———. (1994) Modes and origins of mechanical and ethological isolation in angiosperms. Proc. Natl. Acad. Sci. USA, 91, 3–10. [DOI] [PMC free article] [PubMed] [Google Scholar]
- Hereford, J. (2009) A quantitative survey of local adaptation and fitness trade‐offs. Am. Nat., 173, 579–588. [DOI] [PubMed] [Google Scholar]
- Hernández‐Hernández, T. & Wiens, J.J. (2020) Why are there so many flowering plants? A multiscale analysis of plant diversification. Am. Nat., 195, 948–963. [DOI] [PubMed] [Google Scholar]
- Hernández‐Hernández, T. , Miller, E.C. , Román‐Palacios, C. & Wiens, J.J. (2021) Speciation across the tree of life. Biol. Rev., 96, 1205–1242. [DOI] [PubMed] [Google Scholar]
- Hu, L. , Yang, R. , Yang, G. , Sun, G. & Gong, X. (2021) Morphological distinctiveness of Ligularia tongolensis and L. cymbulifera is maintained between habitats despite bidirectional and asymmetrical introgression in multiple hybrid zones. J. Syst. Evol., 10.1111/jse.12756. [DOI] [Google Scholar]
- Huang, K. , Andrew, R.L. , Owens, G.L. , Ostevik, K.L. & Rieseberg, L.H. (2020) Multiple chromosomal inversions contribute to adaptive divergence of a dune sunflower ecotype. Mol. Ecol., 29, 2535–2549. [DOI] [PubMed] [Google Scholar]
- Husband, B.C. & Sabara, H.A. (2004) Reproductive isolation between autotetraploids and their diploid progenitors in fireweed, Chamerion angustifolium (Onagraceae). New Phytol., 161, 703–713. [DOI] [PubMed] [Google Scholar]
- Ishizaki, S. , Abe, T. & Ohara, M. (2013) Mechanisms of reproductive isolation of interspecific hybridization between Trillium camschatcense and T. tschonoskii (Melanthiaceae). Plant Species Biol, 28, 204–214. [Google Scholar]
- Jacquemyn, H. , Brys, R. , Honnay, O. & Roldán‐Ruiz, I. (2012) Asymmetric gene introgression in two closely related Orchis species: evidence from morphometric and genetic analyses. BMC Evol. Biol, 12, 1–11. [DOI] [PMC free article] [PubMed] [Google Scholar]
- Jewell, C. , Papineau, A.D. , Freyre, R. & Moyle, L.C. (2012) Patterns of reproductive isolation in Nolana (Chilean bellflower). Evol. Int. J. Org. Evol, 66, 2628–2636. [DOI] [PubMed] [Google Scholar]
- Johnson, M.A. , Price, D.K. , Price, J.P. & Stacy, E.A. (2015) Postzygotic barriers isolate sympatric species of Cyrtandra (Gesneriaceae) in Hawaiian montane forest understories. Am. J. Bot., 102, 1870–1882. [DOI] [PubMed] [Google Scholar]
- Karrenberg, S. , Liu, X. , Hallander, E. , Favre, A. , Herforth‐Rahmé, J. & Widmer, A. (2019) Ecological divergence plays an important role in strong but complex reproductive isolation in campions (Silene). Evolution; Internation Journal of Organic Evolution, 73, 245–261. [DOI] [PubMed] [Google Scholar]
- Kay, K.M. (2006) Reproductive isolation between two closely related hummingbird pollinated neotropical gingers. Evolution; Internation Journal of Organic Evolution, 60, 538–552. [PubMed] [Google Scholar]
- Kay, K.M. & Sargent, R.D. (2009) The role of animal pollination in plant speciation: integrating ecology, geography, and genetics. Annu. Rev. Ecol. Evol. Syst., 40, 637–656. [Google Scholar]
- Keller, B. , de Vos, J.M. , Schmidt‐Lebuhn, A.N. , Thomson, J.D. & Conti, E. (2016) Both morph‐and species‐dependent asymmetries affect reproductive barriers between heterostylous species. Ecol. Evol., 6, 6223–6244. [DOI] [PMC free article] [PubMed] [Google Scholar]
- Keller, B. , Ganz, R. , Mora‐Carrera, E. , Nowak, M.D. , Theodoridis, S. , Koutroumpa, K. & Conti, E. (2021) Asymmetries of reproductive isolation are reflected in directionalities of hybridization: integrative evidence on the complexity of species boundaries. New Phytol., 229, 1795–1809. [DOI] [PubMed] [Google Scholar]
- Kenney, A.M. & Sweigart, A.L. (2016) Reproductive isolation and introgression between sympatric Mimulus species. Mol. Ecol., 25, 2499–2517. [DOI] [PubMed] [Google Scholar]
- Kiang, Y.T. & Hamrick, J.L. (1978) Reproductive isolation in the Mimulus guttatus–M. nasutus complex. Am. Midl. Nat., 100, 269–276. [Google Scholar]
- Koelling, V.A. & Mauricio, R. (2010) Genetic factors associated with mating system cause a partial reproductive barrier between two parapatric species of Leavenworthia (Brassicaceae). Am. J. Bot., 97, 412–422. [DOI] [PMC free article] [PubMed] [Google Scholar]
- Kostyun, J.L. & Moyle, L.C. (2017) Multiple strong postmating and intrinsic postzygotic reproductive barriers isolate florally diverse species of Jaltomata (Solanaceae). Evolution; Internation Journal of Organic Evolution, 71, 1556–1571. [DOI] [PMC free article] [PubMed] [Google Scholar]
- Kulmuni, J. , Butlin, R.K. , Lucek, K. , Savolainen, V. & Westram, A.M. (2020) Towards the completion of speciation: the evolution of reproductive isolation beyond the first barriers. The Royal Society, Lond. [DOI] [PMC free article] [PubMed] [Google Scholar]
- Larcombe, M.J. , Holland, B. , Steane, D.A. , Jones, R.C. , Nicolle, D. , Vaillancourt, R.E. & Potts, B.M. (2015) Patterns of reproductive isolation in Eucalyptus—a phylogenetic perspective. Mol. Biol. Evol., 32, 1833–1846. [DOI] [PubMed] [Google Scholar]
- Leimu, R. & Fischer, M. (2008) A meta‐analysis of local adaptation in plants. Plos One, 3, e4010. [DOI] [PMC free article] [PubMed] [Google Scholar]
- Lenth, R.V. (2021) emmeans: estimated marginal means, aka least‐squares means. R package version 1.6. 1.
- Lowry, D.B. (2012) Ecotypes and the controversy over stages in the formation of new species. Biol. J. Linn. Soc., 106, 241–257. [Google Scholar]
- Lowry, D.B. , Modliszewski, J.L. , Wright, K.M. , Wu, C.A. & Willis, J.H. (2008) The strength and genetic basis of reproductive isolating barriers in flowering plants. Philos. Trans. R. Soc. B Biol. Sci., 363, 3009–3021. [DOI] [PMC free article] [PubMed] [Google Scholar]
- Martin, C.H. & Richards, E.J. (2019) The paradox behind the pattern of rapid adaptive radiation: how can the speciation process sustain itself through an early burst? Annu. Rev. Ecol. Evol. Syst., 50, 569–593. [DOI] [PMC free article] [PubMed] [Google Scholar]
- Martin, N.H. & Willis, J.H. (2007) Ecological divergence associated with mating system causes nearly complete reproductive isolation between sympatric Mimulus species. Evolution; Internation Journal of Organic Evolution, 61, 68–82. [DOI] [PubMed] [Google Scholar]
- Matute, D.R. & Cooper, B.S. (2021) Comparative studies on speciation: 30 years since Coyne and Orr. Evolution; Internation Journal of Organic Evolution, 75, 764–778. [DOI] [PMC free article] [PubMed] [Google Scholar]
- Melo, M.C. , Grealy, A. , Brittain, B. , Walter, G.M. & Ortiz‐Barrientos, D. (2014) Strong extrinsic reproductive isolation between parapatric populations of an Australian groundsel. New Phytol., 203, 323–334. [DOI] [PubMed] [Google Scholar]
- Minnaar, C. , de Jager, M.L. & Anderson, B. (2019) Intraspecific divergence in floral‐tube length promotes asymmetric pollen movement and reproductive isolation. New Phytol., 224, 1160–1170. [DOI] [PubMed] [Google Scholar]
- Misiewicz, T.M. , Simmons, T.S. & Fine, P.V. (2020) The contribution of multiple barriers to reproduction between edaphically divergent lineages in the Amazonian tree Protium subserratum (Burseraceae). Ecol. Evol., 10, 6646–6663. [DOI] [PMC free article] [PubMed] [Google Scholar]
- Moreira‐Hernández, J.I. & Muchhala, N. (2019) Importance of pollinator‐mediated interspecific pollen transfer for angiosperm evolution. Annu. Rev. Ecol. Evol. Syst., 50, 191–217. [Google Scholar]
- Nelson, T.C. , Stathos, A.M. , Vanderpool, D.D. , Finseth, F.R. , Yuan, Y. & Fishman, L. (2021) Ancient and recent introgression shape the evolutionary history of pollinator adaptation and speciation in a model monkeyflower radiation (Mimulus section Erythranthe). PLoS Genet., 17, e1009095. [DOI] [PMC free article] [PubMed] [Google Scholar]
- Nosil, P. , Vines, T.H. & Funk, D.J. (2005) Reproductive isolation caused by natural selection against immigrants from divergent habitats. Evolution; Internation Journal of Organic Evolution, 59, 705–719. [PubMed] [Google Scholar]
- Ortego, J. , Gugger, P.F. & Sork, V.L. (2017) Impacts of human‐induced environmental disturbances on hybridization between two ecologically differentiated Californian oak species. New Phytol., 213, 942–955. [DOI] [PubMed] [Google Scholar]
- Ostevik, K.L. , Andrew, R.L. , Otto, S.P. & Rieseberg, L.H. (2016) Multiple reproductive barriers separate recently diverged sunflower ecotypes. Evolution; Internation Journal of Organic Evolution, 70, 2322–2335. [DOI] [PubMed] [Google Scholar]
- Ostevik, K.L. , Rifkin, J.L. , Xia, H. & Rausher, M.D. (2021) Morning glory species co‐occurrence is associated with asymmetrically decreased and cascading reproductive isolation. Evol. Lett., 5, 75–85. [DOI] [PMC free article] [PubMed] [Google Scholar]
- Pérez‐Escobar, O.A. , Chomicki, G. , Condamine, F.L. , Karremans, A.P. , Bogarín, D. , Matzke, N.J. , Silvestro, D. & Antonelli, A. (2017) Recent origin and rapid speciation of Neotropical orchids in the world's richest plant biodiversity hotspot. New Phytol., 215, 891–905. [DOI] [PMC free article] [PubMed] [Google Scholar]
- Pettengill, J.B. , Briscoe Runquist, R.D. & Moeller, D.A. (2016) Mating system divergence affects the distribution of sequence diversity within and among populations of recently diverged subspecies of Clarkia xantiana (Onagraceae). Am. J. Bot., 103, 99–109. [DOI] [PubMed] [Google Scholar]
- Price‐Waldman, R.M. , Shultz, A.J. & Burns, K.J. (2020) Speciation rates are correlated with changes in plumage color complexity in the largest family of songbirds. Evolution; Internation Journal of Organic Evolution, 74, 1155–1169. [DOI] [PubMed] [Google Scholar]
- R Core Team . (2021) R: a language and environment for statistical computing. R Foundation for Statistical Computing, Vienna. [Google Scholar]
- Rabosky, D.L. (2016) Reproductive isolation and the causes of speciation rate variation in nature. Biol. J. Linn. Soc., 118, 13–25. [Google Scholar]
- Ramsey, J. , Bradshaw, H.D. Jr. & Schemske, D.W. (2003) Components of reproductive isolation between the monkeyflowers Mimulus lewisii and M. cardinalis (Phrymaceae). Evolution; Internation Journal of Organic Evolution, 57, 1520–1534. [DOI] [PubMed] [Google Scholar]
- Richards, T.J. & Ortiz‐Barrientos, D. (2016) Immigrant inviability produces a strong barrier to gene flow between parapatric ecotypes of Senecio lautus . Evolution; Internation Journal of Organic Evolution, 70, 1239–1248. [DOI] [PubMed] [Google Scholar]
- Rieseberg, L.H. & Blackman, B.K. (2010) Speciation genes in plants. Ann. Bot., 106, 439–455. [DOI] [PMC free article] [PubMed] [Google Scholar]
- Rieseberg, L.H. & Willis, J.H. (2007) Plant speciation. Science, 317, 910–914. [DOI] [PMC free article] [PubMed] [Google Scholar]
- Rundle, H.D. (2002) A test of ecologically dependent postmating isolation between sympatric sticklebacks. Evolution; Internation Journal of Organic Evolution, 56, 322–329. [DOI] [PubMed] [Google Scholar]
- Salamin, N. , Hodkinson, T.R. & Savolainen, V. (2005) Towards building the tree of life: a simulation study for all angiosperm genera. Syst. Biol., 54, 183–196. [DOI] [PubMed] [Google Scholar]
- Sandstedt, G.D. , Wu, C.A. & Sweigart, A.L. (2021) Evolution of multiple postzygotic barriers between species of the Mimulus tilingii complex. Evolution; Internation Journal of Organic Evolution, 75, 600–613. [DOI] [PMC free article] [PubMed] [Google Scholar]
- Savolainen, V. , Anstett, M.‐C. , Lexer, C. , Hutton, I. , Clarkson, J.J. , Norup, M.V. , Powell, M.P. , Springate, D. , Salamin, N. & Baker, W.J. (2006) Sympatric speciation in palms on an oceanic island. Nature, 441, 210–213. [DOI] [PubMed] [Google Scholar]
- Schemske, D.W. (2000) Understanding the origin of species. Evolution; Internation Journal of Organic Evolution, 54, 1069–1073. [Google Scholar]
- ———. (2010) Adaptation and the origin of species. Am. Nat., 176, S4–S25. [DOI] [PubMed] [Google Scholar]
- Schluter, D. (2001) Ecology and the origin of species. Trends Ecol. Evol., 16, 372–380. [DOI] [PubMed] [Google Scholar]
- ———. (2009) Evidence for ecological speciation and its alternative. Science, 323, 737–741. [DOI] [PubMed] [Google Scholar]
- Schumer, M. , Powell, D.L. , Delclós, P.J. , Squire, M. , Cui, R. , Andolfatto, P. & Rosenthal, G.G. (2017) Assortative mating and persistent reproductive isolation in hybrids. Proc. Natl. Acad. Sci. USA, 114, 10936–10941. [DOI] [PMC free article] [PubMed] [Google Scholar]
- Skeels, A. & Cardillo, M. (2019) Reconstructing the geography of speciation from contemporary biodiversity data. Am. Nat., 193, 240–255. [DOI] [PubMed] [Google Scholar]
- Sobel, J.M. & Chen, G.F. (2014) Unification of methods for estimating the strength of reproductive isolation. Evolution; Internation Journal of Organic Evolution, 68, 1511–1522. [DOI] [PubMed] [Google Scholar]
- Sobel, J.M. , Chen, G.F. , Watt, L.R. & Schemske, D.W. (2010) The biology of speciation. Evol. Int. J. Org. Evol., 64, 295–315. [DOI] [PubMed] [Google Scholar]
- Stankowski, S. & Ravinet, M. (2021) Defining the speciation continuum. Evolution; Internation Journal of Organic Evolution, 75, 1256–1273. [DOI] [PubMed] [Google Scholar]
- Stebbins, G.L. (1950) Variation and evolution in plants. Columbia Univ. Press, New York. [Google Scholar]
- Stuessy, T.F. (2006) Sympatric plant speciation in islands? Nature, 443, E12. [DOI] [PubMed] [Google Scholar]
- Suni, S.S. & Hopkins, R. (2018) The relationship between postmating reproductive isolation and reinforcement in Phlox . Evolution; Internation Journal of Organic Evolution, 72, 1387–1398. [DOI] [PubMed] [Google Scholar]
- Tiffin, P. , Olson, S. & Moyle, L.C. (2001) Asymmetrical crossing barriers in angiosperms. Proc. R. Soc. Lond. B Biol. Sci., 268, 861–867. [DOI] [PMC free article] [PubMed] [Google Scholar]
- Todesco, M. , Owens, G.L. , Bercovich, N. , Légaré, J.‐S. , Soudi, S. , Burge, D.O. , Huang, K. , Ostevik, K.L. , Drummond, E.B. & Imerovski, I. (2020) Massive haplotypes underlie ecotypic differentiation in sunflowers. Nature, 584, 602–607. [DOI] [PubMed] [Google Scholar]
- Turelli, M. & Moyle, L.C. (2007) Asymmetric postmating isolation: Darwin's corollary to Haldane's rule. Genetics, 176, 1059–1088. [DOI] [PMC free article] [PubMed] [Google Scholar]
- Turelli, M. , Barton, N.H. & Coyne, J.A. (2001) Theory and speciation. Trends Ecol. Evol., 16, 330–343. [DOI] [PubMed] [Google Scholar]
- Turesson, G. (1922) The species and the variety as ecological units. Hereditas, 3, 100–113. [Google Scholar]
- Vamosi, J.C. , Magallón, S. , Mayrose, I. , Otto, S.P. & Sauquet, H. (2018) Macroevolutionary patterns of flowering plant speciation and extinction. Annu. Rev. Plant Biol., 69, 685–706. [DOI] [PubMed] [Google Scholar]
- Van der Niet, T. , Peakall, R. & Johnson, S.D. (2014) Pollinator‐driven ecological speciation in plants: new evidence and future perspectives. Ann. Bot., 113, 199–212. [DOI] [PMC free article] [PubMed] [Google Scholar]
- Widmer, A. , Lexer, C. & Cozzolino, S. (2009) Evolution of reproductive isolation in plants. Heredity, 102, 31–38. [DOI] [PubMed] [Google Scholar]
- Wilkinson, M.J. , Roda, F. , Walter, G.M. , James, M.E. , Nipper, R. , Walsh, J. , Allen, S.L. , North, H.L. , Beveridge, C.A. & Ortiz‐Barrientos, D. (2021) Adaptive divergence in shoot gravitropism creates hybrid sterility in an Australian wildflower. Proc. Natl. Acad. Sci. USA, 118, e2004901118. [DOI] [PMC free article] [PubMed] [Google Scholar]
- Wright, K.M. , Lloyd, D. , Lowry, D.B. , Macnair, M.R. & Willis, J.H. (2013) Indirect evolution of hybrid lethality due to linkage with selected locus in Mimulus guttatus . PLoS Biol., 11, e1001497. [DOI] [PMC free article] [PubMed] [Google Scholar]
- Zuellig, M.P. & Sweigart, A.L. (2018) A two‐locus hybrid incompatibility is widespread, polymorphic, and active in natural populations of Mimulus . Evolution; Internation Journal of Organic Evolution, 72, 2394–2405. [DOI] [PMC free article] [PubMed] [Google Scholar]
Associated Data
This section collects any data citations, data availability statements, or supplementary materials included in this article.
Supplementary Materials
Supplementary information
Supplementary information
Supplementary information
Data Availability Statement
Data are archived in the Dryad Digital Repository (https://doi.org/10.25338/B8GS8S).