

Abstract
We aimed to develop a prediction model for intensive care unit (ICU) hospitalization of Coronavirus disease-19 (COVID-19) patients using artificial neural networks (ANN). We assessed 25 laboratory parameters at first from 248 consecutive adult COVID-19 patients for database creation, training, and development of ANN models. We developed a new alpha-index to assess association of each parameter with outcome. We used 166 records for training of computational simulations (training), 41 for documentation of computational simulations (validation), and 41 for reliability check of computational simulations (testing). The first five laboratory indices ranked by importance were Neutrophil-to-lymphocyte ratio, Lactate Dehydrogenase, Fibrinogen, Albumin, and D-Dimers. The best ANN based on these indices achieved accuracy 95.97%, precision 90.63%, sensitivity 93.55%. and F1-score 92.06%, verified in the validation cohort. Our preliminary findings reveal for the first time an ANN to predict ICU hospitalization accurately and early, using only 5 easily accessible laboratory indices.
Keywords: COVID-19, SARS-CoV2, Laboratory indices, Artificial intelligence, Artificial neural networks
1. Introduction
The Coronavirus disease-19 (COVID-19) pandemic has unprecedented impact on all aspects of human activity worldwide. Although vaccination, anti-viral treatment and monoclonal antibodies have positively impacted the course of this pandemic [1], reduction of morbidity and mortality due to severe COVID-19remains an unmet clinical need. In this context, several groups worldwide have investigated routine laboratory, biochemical and coagulation indices in severe COVID-19. Summarizing the early studies, Terpos et al. have highlighted that lymphopenia, neutrophil/lymphocyte ratio (NLR), inflammatory indices, including lactate dehydrogenase (LDH), and C-reactive protein (CRP), as well coagulation abnormalities, such as prothrombin (PT) time prolongation, are important in COVID-19 [2]. In addition, systematic reviews and meta-analyses have tried to identify biomarkers associated with COVID-19 progression [3,4]. Among them, NLR, ferritin and LDH have been the major markers recognized as predictors of high-risk patients [5,6].
During the last two years, a plethora of studies employing ANNs have also emerged focusing on COVID-19 prediction problems [[7], [8], [9], [10], [11], [12], [13]]. Development of artificial neural networks (ANNs) is based on the concept of the biological neural network of the human brain and was initially used for medicine research purposes to simulate strongly non-linear relationships between numerous input and output parameters [[14], [15], [16], [17], [18], [19], [20]]. ANN models were subsequently introduced into the wider context of engineering disciplines [[21], [22], [23]], which significantly enriched the mathematical background underpinning ANN.
Despite scientific breakthroughs during COVID-19, there is no risk prediction model that can be used in clinical practice to identify COVID-19 severity early in the disease course. Our group has recently described risk prediction models and artificial neural networks (ANN)with high sensitivity and specificity for prediction of both morbidity and mortality from COVID-19 [8]. Nevertheless, these models were based on genetic susceptibility identifying complement genetic variants in COVID-19 patients [7,24,25], requiring genetic screening for several mutations which cannot be applied in the general population.
Therefore, we designed the present study aiming to provide a risk prediction model of COVID-19 outcome using ANN and the minimum number of routine laboratory indices. To increase the value of our model as an early predictor for clinical practice, we utilized laboratory indices from the day of first presentation to the Emergency department that will be further referred to as admission.
2. Materials and methods
2.1. Artificial neural networks
The basic building block of ANNs is the artificial neuron, which is a mathematical model mimicking the behavior of the biological neuron. Information is passed onto the artificial neuron as a vector of input parameters and is then processed using a mathematical function to derive an output which determines the behavior of the neuron (similar to the fire-or-not situation of the biological neuron). Before the information enters the neuron, it is weighted in order to process the inputs collectively. More precisely, each artificial neuron has inputs and produces a single output which can be sent to multiple other neurons. The inputs can be the feature values of a sample of external data, such as the values of a set of indicators, or they can be the outputs of other neurons. The outputs of the final output neurons of the neural network accomplish the task, such as classifying the input vectors. A group of such neurons comprise an ANN, similar to the structure of biological neural networks. To define an ANN, (i) the architecture of the ANN, (ii) the training algorithm used during the ANN's training stage and (iii) the mathematical functions underpinning the mathematical model are required. The architecture of the ANN defines how the artificial neurons are organized and how the information flows within the network. In most applications the neurons are organized in a series of layers comprising a network called a multilayer ANN. The training stage can be considered as a function minimization problem, in which the optimum weight values need to be determined by minimizing an error function which is the sum of squared differences between outputs of each neuron in the last layer to each component of the vector of observations. This is done by a special learning algorithm that adjusts the values of the weights of each neuron successively for each layer to achieve convergence to the minimum error and corresponding optimal values for the whole of weights.
2.2. Study population
We enrolled consecutive adult patients with COVID-19 from Attikon Hospital, Athens, Greece (May 2020–April 2021). All 248 patients met the following inclusion criteria: 1. routine laboratory testing (hematology, biochemical and coagulation profile) at admission, 2. RT-PCR test positive for SARS-COV2, 3. no history of COVID-19 vaccination. Table 1 summarizes demographics according to age, gender and disease severity (requiring or not hospitalization in intensive care unit (ICU)). The study was performed according to the Helsinki Declaration and approved by the Ethics Committee of Attikon Hospital (9.16/6/2020).
Table 1.
Study population categorized by age, gender and disease severity (requiring or not hospitalization in intensive care unit (ICU)).
| Severe | Age | All patients | Male | Female |
|---|---|---|---|---|
| All patients (not in ICU and in ICU) | Up to 65 | 142 | 85 | 57 |
| Over 65 | 106 | 65 | 41 | |
| All Ages | 248 | 150 | 98 | |
| not in ICU | Up to 65 | 24 | 17 | 7 |
| Over 65 | 38 | 27 | 11 | |
| All Ages | 62 | 44 | 18 | |
| ICU | Up to 65 | 118 | 68 | 50 |
| Over 65 | 68 | 38 | 30 | |
| All Ages | 186 | 106 | 80 |
2.3. Compiled database
Laboratory parameters at admission were used for the creation of the database and the subsequent training and development of the ANN models. More specifically, 25 laboratory indices for each patient were determined which they comprised the input parameters of ANN models while output parameter was defined to be the outcome of the hospitalization for the patient. The output value is a binary parameter that takes value 2 or 1 according to the need for hospitalization or not of the patient in intensive care unit (ICU).
Table 2 presents statistical indices (minimum, average and maximum value as well as the standard deviation) for each of the 25 laboratory indices. The database with the patients' hematological indices is appended to this paper as supplementary material in the excel file entitled Database – Hematological indices.
Table 2.
Database statistics. Minimum, average, maximum and standard deviation of the input parameters (25 hematological indices) and the output parameter (COVID-19 Severe, value equal to 1 means that the effected patient is requiring hospitalization in intensive care unit (ICU) while value equal to 2 means that the effected patient is not requiring hospitalization in intensive care unit (ICU).
| Nr | Variable | Symbol | Units | Statistics |
|||
|---|---|---|---|---|---|---|---|
| Min | Average | Max | STD | ||||
| 1 | White Blood Cell count per volume | WBC | 4–10.5 kcell/μL | 1.16 | 7.01 | 38.60 | 3.82 |
| 2 | Neutrophil count per volume | Neut | 0.9–7 kcell/μL | 0.59 | 5.17 | 35.30 | 3.58 |
| 3 | Lymphocyte count per volume | Lympo | 0.7–3.7 kcell/μL | 0.25 | 1.19 | 16.90 | 1.16 |
| 4 | Neutrophil-to-lymphocyte ratio | NLR | 0.8–3.6 (ratio) | 0.19 | 6.14 | 36.31 | 5.94 |
| 5 | Immature Granulocyte count per volume | IG | <0.03 kcell/μL | 0.00 | 0.04 | 1.31 | 0.11 |
| 6 | IG-to-lymphocyte ratio | IGLR | 0.5–4.8 (ratio x100) | 0.00 | 4.23 | 124.76 | 12.09 |
| 7 | Hemoglobin concentration | Hb | 12.0–16.9 g/dL | 7.63 | 13.02 | 16.70 | 1.88 |
| 8 | Mean Cell Volume of RBCs | MCV | 79–98 fL | 54.40 | 84.89 | 98.90 | 7.71 |
| 9 | Red cell Distribution Width | RDW | 11.5–14% | 10.50 | 13.41 | 27.40 | 1.99 |
| 10 | Percent microcytic RBCs | %MIC | 0.2–2.5% | 0.45 | 6.53 | 75.80 | 12.24 |
| 11 | Percent macrocytic BCs | %MAC | 0.1–9.1% | 0.01 | 0.25 | 4.66 | 0.57 |
| 12 | Percentage of hypochromic BCs | %HPO | 0.1–1.4% | 0.36 | 6.47 | 82.00 | 13.22 |
| 13 | Hemoglobin Distribution Width | HDW | 4.0–5.9% | 5.03 | 7.13 | 15.40 | 1.85 |
| 14 | Platelet cell count per volume | PLT | 140–440 kcell/μL | 40.30 | 219.90 | 766.00 | 94.24 |
| 15 | D-Dimers | D-Dimers | <500 ng/mL | 170.70 | 1134.04 | 8901.80 | 1258.01 |
| 16 | C-reactive protein | CRP | 0.00–6 mg/L | 3.11 | 73.42 | 1170.00 | 98.80 |
| 17 | Fibrinogen | Fib | 200–400 mg/dL | 199.00 | 489.39 | 948.50 | 149.55 |
| 18 | Ferritin | Ferritin | 13–150 ng/mL | 5.00 | 748.66 | 17,158.00 | 1317.50 |
| 19 | Pro-brain natriuretic peptide | ProBNP | < 125 pg/mL | 5.30 | 1082.27 | 38,000.00 | 4259.80 |
| 20 | Procalcitonin | pCT | <0.5 ng/mL | 0.02 | 11.32 | 721.00 | 49.59 |
| 21 | Lactate Dehydrogenase | LDH | 135–225 U/L | 103.00 | 316.22 | 1652.00 | 187.61 |
| 22 | Total bilirubin | Tbil | < 1.20 mg/dL | 0.11 | 0.50 | 5.02 | 0.42 |
| 23 | Albumin | Alb | 3.5–5.2 g/dL | 1.90 | 3.92 | 5.50 | 0.52 |
| 24 | Calcium (serum) | Ca + 2 | 8.6–10.3 mg/dL | 6.40 | 8.74 | 11.30 | 0.64 |
| 25 | Creatinine (serum) | Creat | 0.5–0.9 mg/dL | 0.30 | 1.24 | 11.40 | 1.49 |
| 26 | COVID-19 Severe | COVID-19 Severe | 1: not in ICU while 2: in ICU | 1.00 | 1.25 | 2.00 | 0.43 |
2.4. Proposed index for the assessment of laboratory indices
The training and development procedure of a mathematical simulation for prediction of disease outcome using the database of 25 laboratory indices, presented in the previous section, is considered challenging, given the huge number of possible combinations among them. More specifically, the possible combinations of the 25 laboratory indices are described by the following equation:
| (1) |
It should be also noted that for each of the above different combinations it is necessary to investigate 1.500.000 different architectures ANNs. For this purpose, in the present work a new index, the alpha-index is proposed, that has aimed to metrize each one of the 25 laboratory indices according to their impact on COVID-19 severity. Additionally, we aimed that this index is simple and clinically meaningful.
According to these, the below alpha-index is proposed based on the variation of the mean value of the laboratory index of patients that did not require ICU hospitalization compared to the mean value of the laboratory index of the patients that required ICU admission (Fig. 1 ):
| (2) |
where
Fig. 1.

Shape, parameters and terminology of Gaussian function of the study population categorized by the need of requiring or not hospitalization in intensive care unit (ICU).
i is the laboratory index i (i = 1 to 25),
μi not in ICU the mean value of laboratory index i for COVID-19 infected patients who did not require hospitalization in ICU,
μi in ICU the mean value of laboratory index I for COVID-19 infected patients who require hospitalization in ICU,
min(i) the minimum value of laboratory index i for all COVID-19 infected patients, and.
max(i) the maximum value of laboratory index i for all COVID-19 infected patients.
According to the above definition, a value of the index greater than zero means that increase of the value of the laboratory index drives into ICU, whereas value of the index less than zero means that decrease of the value of the laboratory index predicts ICU hospitalization. It is noteworthy that the index takes values between −100 and 100.
2.5. Performance analysis indices
For assessing the performance of the computational models that were trained and developed in the present study, we used the classical indices that are widely acceptable in the international literature for the assessment of binary classification problems, as shown below [1].
| (3) |
| (4) |
| (5) |
| (6) |
For the successful application of the indices above, we clarified which are the two states that the computational models are required to estimate. With the term Positive we defined the case of the patient with COVID-19 hospitalized in ICU while the term Negative characterized the patient who did not require ICU hospitalization.
3. Results
3.1. Ranking of laboratory indices based on the proposed new alpha-index
With use of the proposed alpha index, the values for each one of the 25 laboratory indices were computed. According to these, the laboratory indices were ranked in decreasing order, as presented in Fig. 2 . The first five ranked by importance were Neutrophil-to-lymphocyte ratio (NLR), Lactate Dehydrogenase (LDH), Fibrinogen (Fib), Albumin (Alb) and D-Dimers. The reliability check of the proposed index was documented with the feasibility, the training, and development of ANN models with small number of laboratory indices and additionally those according to the importance ranking (input parameters) that predict reliably if the patient shall be admitted to ICU or not.
Fig. 2.
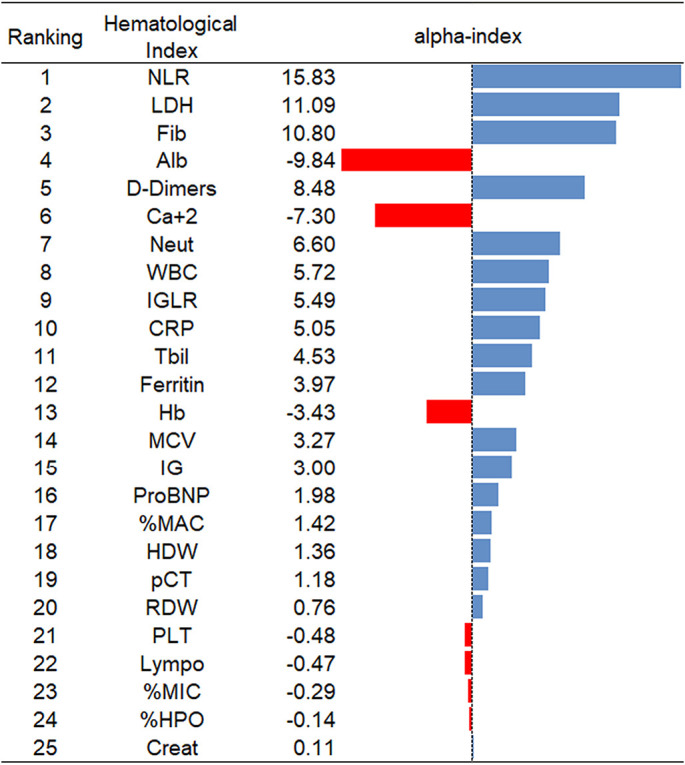
Ranking of the hematological indices based on the proposed new alpha-index.
3.2. Development of ANN models
In the current section we present the process of training and development of ANN models for the estimation of COVID-19 outcome. More specifically, models were trained and developed with respect to the number of laboratory indices they use as input parameters. That is 10 different cases of ANN models with 1 to 10 with step 1 laboratory indices as input parameters following the order with which they were ranked according to the alpha index (Fig. 2).
ANN models were trained and designed with the use of the database comprised of 248 records. The 248 records correspond to the 248 patients studied. Εach is comprised from 25 values of laboratory indices and the outcome of hospitalization of each patient. The 248 records were split in three parts and specifically, i) 166 (66.94%) records used for the training of the computational simulations (training dataset), ii) 41 (16.54%) records used for documentation of the computational simulations (validation dataset) and iii) 41 (16.54%) records used for the reliability check of the computational simulations(testing dataset).
Namely, for the work presented herein the testing datasets have been used as a cohort study to further support our findings. Table 3 shows a detailed presentation of the key parameters used for the training and development of the optimum ANN models, including the training algorithms, the number of neurons per hidden layer and the cost and transfer functions.
Table 3.
Training parameters of ANN models.
| Parameter | Value |
|---|---|
| Training Algorithm | Levenberg–Marquardt algorithm (LM) algorithm particle swarm optimization (PSO) algorithm Grey Wolf Optimization (GWO) Algorithm algorithm |
| Normalization | Minmax in the range 0.10–0.90, 0.00–1.00 -1.00-1.00 |
| Number of Hidden Layers | 1 |
| Number of Neurons per Hidden Layer | 1 to 50 by step 1 |
| Control random number generation | 10 different random generation |
| Maximum number of Epochs | 250 |
| Cost Function | Mean Square Error (MSE) Sum Square Error (SSE) |
| Transfer Functions | Hyperbolic Tangent Sigmoid transfer function (HTS) Log-sigmoid transfer function (LS) Linear transfer function (Li) Positive linear transfer function (PLi) Symmetric saturating linear transfer function (SSL) Soft max transfer function (SM) Competitive transfer function (Co) Triangular basis transfer function (TB) Radial basis transfer function (RB) Normalized radial basis transfer function (NRB) |
According to parameters used, models were trained and developed 1.500.000 different architectures ANN's for each one of the 10 different cases with respect to the number of laboratory indices as input parameters. Table 4 presents the respective 10 best architectures together with the performance indices for each one of them. According to this, the best ANN architecture model corresponds to the one with only 5 input parameters as follows:
-
1.
Neutrophil-to-lymphocyte ratio (NLR),
-
2.
Lactate Dehydrogenase (LDH),
-
3.
Fibrinogen (Fib),
-
4.
Albumin (Alb), and
-
5.
D-Dimers.
Table 4.
Performance indices of the 10 developed Artificial Neural models. The number of models declare the number of hematological indices used as input parameters for the prediction of COVID-19 Patients outcome.
| Model | Hematological Indices |
Performance Indices |
|||||||||||
|---|---|---|---|---|---|---|---|---|---|---|---|---|---|
| CRP | IGLR | WBC | Neut | Ca + 2 | D-Dimers | Alb | Fib | LDH | NLR | Accuracy | Sensitivity or Recall | F1 − Score | |
| 1 | • | 50.00 | 50.00 | 66.67 | |||||||||
| 2 | • | • | 79.03 | 79.03 | 88.29 | ||||||||
| 3 | • | • | • | 87.10 | 87.10 | 93.10 | |||||||
| 4 | • | • | • | • | 91.94 | 91.94 | 95.80 | ||||||
| 5 | • | • | • | • | • | 93.55 | 93.55 | 96.67 | |||||
| 6 | • | • | • | • | • | • | 90.32 | 90.32 | 94.92 | ||||
| 7 | • | • | • | • | • | • | • | 91.94 | 91.94 | 95.80 | |||
| 8 | • | • | • | • | • | • | • | • | 88.71 | 88.71 | 94.02 | ||
| 9 | • | • | • | • | • | • | • | • | • | 88.71 | 88.71 | 94.02 | |
| 10 | • | • | • | • | • | • | • | • | • | • | 90.32 | 90.32 | 94.92 |
The ANN model with only these five laboratory indices achieves extremely high performances with respect to the outcome of COVID-19. Furthermore, to the best of authors' knowledge, it achieves the best prediction from the totality of the computational models that have been proposed at present in the literature. More specifically it achieves accuracy 95.97%, precision 90.63%, sensitivity or recall 93.55% and F1-score 92.06%. Cross-validation techniques have been also used in our work presented here. It is worth stressing that the same results have been deduced both at the two halves of the database and at the whole. Five-fold cross-validation has been applied based on accuracy. The implementation and the achieved accuracy values are presented in detail in Fig. 3 .
Fig. 3.

Implementation of 5-fold cross validation based on accuracy index.
In addition, Table 4 documents the reliability of the proposed alpha-index. We also observe that NLR that has the greatest value of the alpha-index achieving significant prediction level which increases as other laboratory indices are added such as LDH that has the second greatest value of the alpha-index. The prediction level continues to increase as other laboratory indices are included with respect to their ranking per alpha-index.
Fig. 4 presents the architecture of the best ANN model including the whole of the parameters of this, required for its design.
Fig. 4.

Architecture of the optimum developed ANN 5–24-1 model.
In an effort to better understand the role of additional indices, we also performed a correlation analysis of the critical five laboratory indices with respect to the remaining 20 laboratory indices. The results of this calculation that corresponds to the Pearson correlation coefficient are presented at Table 5 . Specifically, in this table the values in blue correspond to correlation coefficient greater than 0.30, with p-value<0.001.
Table 5.
Correlation of the 5 hematological indices included in the proposed ANN model with the 20 hematological indices not included in the proposed ANN model based on Pearson correlation coefficient (Marked values with blue color correspond to correlation coefficient greater than 0.30, with p-value<0.001).

We observed that the 5 laboratory indices determined to be critical are in significant association with 9 other laboratory indices. Specifically,
-
•
Neutrophil-to-lymphocyte ratio (NLR) has a strong correlation with the Neutrophil count per volume (Neut), the Lymphocyte count per volume (Lympo), the Immature Granulocyte count per volume (IG), the IG-to-lymphocyte ratio (IGLR) and the C-reactive protein (CRP),
-
•
Lactate Dehydrogenase (LDH) is strongly correlated with Ferritin and Total bilirubin (Tbil),
-
•
Fibrinogen (Fib) has a strong relation with Neutrophil count per volume (Neut) and C-reactive protein (CRP),
-
•
Albumin (Alb) has a strong relation with White Blood Cell count per volume (WBC), Neutrophil count per volume (Neut), Immature Granulocyte count per volume (IG), the IG-to-lymphocyte ratio (IGLR), Hemoglobin concentration (Hb) and the Calcium (serum) (Ca + 2).
4. Discussion
Our study reveals for the first time 5 easily accessible laboratory markers of high importance for predicting COVID-19 severity, that were assessed through a novel alpha-index. Ranking these markers by importance and utilizing a training, validation, and testing dataset, we develop an ANN that can be used in clinical practice to accurately predict ICU hospitalization in COVID-19 early in the hospital course. Importantly, we also describe associations between laboratory indices that may better delineate several pathophysiological processes in COVID-19.
So far, risk prediction models for severe COVID-19 are rare and limited by several factors. An existing model widely used to identify deteriorating hospitalized patients in the United Kingdom (UK), National Early Warning Score 2 (NEWS2), has shown a low positive predictive value (PPV) 0.53 (0.47–0.59), but good negative predictive value (NPV) 0.96 (0.90–1.00)to identify inpatient COVID-19 deterioration [26]. Only the NPV of NEWS2 monitoring was higher than that of other earlier scores including Modified Early Warning Score (MEWS) and Sepsis Related Organ Failure Assessment (qSOFA) score. Another prediction model using demographics, comorbidities and laboratory tests at the initial presentation yielded moderate but significant accuracy with an area under the curve of 0.74 for ICU hospitalization. Machine learning models have tried to improve predictive values. Some models have focused only on mortality in the ICU or days of ICU hospitalization [[27], [28], [29], [30]].
However, early prediction of ICU hospitalization is equally or even more important for the healthcare systems worldwide. In this context, machine learning was used to predict progression to a score ≥ 5 (WHO Clinical Progression Scale) before patients required mechanical ventilation. Strongest predictors of clinical deterioration were arterial blood oxygen partial pressure, followed by age, procalcitonin, LDH, CRP and alterations in blood count and coagulation. In the validation set, the CatBoost AUROC was 0.79, AUPRC 0.21 and Hosmer–Lemeshow test statistic 0.36 [31]. As a result, our ANN prediction model has several strengths not only because it utilizes early and routine laboratory values but also because it has very high accuracy.
It is also noteworthy that several publications have aimed to determine the most critical laboratory indices for ICU admission. Some of these studies suggest laboratory indices that are included in the five laboratory indices proposed in the present study as critical. In particular, our machine learning approach confirms the predictive value of NLR which has been previously associated with severe COVID-19 [[32], [33], [34]].Before COVID-19, NLR had already generated a lot of interest as a systemic inflammatory index and a potential prognostic factor in many clinical conditions [35].In COVID-19, its role has been highlighted by meta-analyses showing an association of NLR with morbidity and mortality of COVID-19 [[36], [37], [38]]. Our approach however clarifies that only one marker is not enough to maximize the predictive value. Except for NLR, our model has identified LDH, fibrinogen and d-dimers as additional critical markers, which are known indicators of severe infections. Their role has been also confirmed in COVID-19, but still as single markers associated with severe COVID-19 [[39], [40], [41]]. Other hematological markers, such as erythrocyte dynamics and platelets, that have not shown critical predictive value in our model, may be also important for the diagnostic approach in severe COVID-19 [42,43]. Their role needs to be further refined.
Interestingly, our approach has documented that albumin is also an important prognostic marker. Although hypoalbuminemia has been largely under-studied in COVID-19 a few reports have indicated its association with disease severity, even independently of age and comorbidities [[44], [45], [46]]. Albumin may be a surrogate marker of the patient's status at admission (cachexia, drug-binding proteins). Our study also shows inter-correlation between these entities that may better delineate several pathophysiological processes in COVID-19. The strong association that we observed between albumin and calcium is well established from the pathophysiological point of view and explains why the addition of calcium in the model does not strengthen the alpha-index.Several underlying mechanisms may be implicated in the correlation of albumin with COVID-19 outcomes. Firstly, endothelial dysfunction is a common denominator in severe COVID-19 [47]. The process of endothelial dysfunction leads to loss of integrity of the epithelial–endothelial damage, contributing to hypoalbuminemia [48]. Secondly, neutrophil extracellular traps (NETs) are also major mediators in COVID-19 [49]. Since albumin inhibits NETs formation, patients with hypoalbuminemia may have a greater risk of morbidity and mortality. Additionally, albumin is essential for balancing hemodynamics and reducing D-dimers, suggesting that hypoalbuminemia is associated with a pro-coagulant phenotype [50].
Our study has some limitations. Despite the prospective patient recruitment, our findings cannot be considered as definitive, indicating the need for future studies Introduction of additional prognostic factors such as imaging might have improved the predictive accuract of our model. Nevertheless, our aim was to propose a model with a small number of easily accessible laboratory indices that could be useful in all settings. Furthermore, the suggested ANN needs to be further validated in larger real-world cohorts from different hospitals and patient populations. Although vaccination and different SARS-COV2 strains are not expected to directly influence our model, it should be noted that our patient population is homogeneous including only unvaccinated patients from the first two waves and alpha to delta variants in Greece.
In conclusion, only 5 routine and easily accessible laboratory indices were able to predict ICU hospitalizations in COVID-19 patients utilizing a novel approach of artificial intelligence based on our preliminary findings Additional data are needed to ensure the validity of our database and further studies are ongoing. Given that vaccinations and viral mutations are constantly change the landscape of COVID-19, a prediction tool based on such robust variables is of high importance. Such models could help not only to reduce cost of hospitalization, morbidity and mortality, but also to accurately predict patients at high-risk that would benefit from prophylactic or pre-emptive treatments. Lastly, this artificial intelligence approach paves the way for future applications of this novel methodology in other clinical entities, since the newly proposed alpha-index may be extremely useful in a plethora of diseases or other entities with classification problems [[51], [52], [53]].
Funding
This research received no financial support for the research, authorship, and/or publication of this article.
CRediT authorship contribution statement
Panagiotis G. Asteris: Conceptualization, Methodology, Writing – original draft. Styliani Kokoris: Conceptualization, Writing – original draft. Eleni Gavriilaki: Validation, Writing – original draft. Markos Z. Tsoukalas: Methodology. Panagiotis Houpas: Methodology. Maria Paneta: Data curation. Andreas Koutzas: Data curation. Theodoros Argyropoulos: Data curation. Nizar Faisal Alkayem: Methodology. Danial J. Armaghani: Methodology. Abidhan Bardhan: Methodology. Liborio Cavaleri: Methodology. Maosen Cao: Methodology. Iman Mansouri: Methodology. Ahmed Salih Mohammed: Methodology. Pijush Samui: Methodology. Gloria Gerber: Writing – review & editing. Dimitrios T. Boumpas: Writing – review & editing. Argyrios Tsantes: Writing – review & editing. Evangelos Terpos: Writing – review & editing. Meletios A. Dimopoulos: Writing – review & editing.
Declaration of Competing Interest
The authors declare no conflict of interest.
Acknowledgments
None.
Footnotes
Supplementary data to this article can be found online at https://doi.org/10.1016/j.clim.2022.109218.
Appendix A. Supplementary data
Supplementary material
Data availability
Data will be immediately available upon request.
References
- 1.Rubin E.J., Longo D.L. SARS-CoV-2 Vaccination - an Ounce (Actually, Much Less) of Prevention. N. Engl. J. Med. 2020;383:2677–2678. doi: 10.1056/NEJMe2034717. [DOI] [PMC free article] [PubMed] [Google Scholar]
- 2.Terpos E., Ntanasis-Stathopoulos I., Elalamy I., Kastritis E., Sergentanis T.N., Politou M., Psaltopoulou T., Gerotziafas G., Dimopoulos M.A. Hematological findings and complications of COVID-19. Am. J. Hematol. 2020;95:834–847. doi: 10.1002/ajh.25829. [DOI] [PMC free article] [PubMed] [Google Scholar]
- 3.Ponti G., Maccaferri M., Ruini C., Tomasi A., Ozben T. Biomarkers associated with COVID-19 disease progression. Crit. Rev. Clin. Lab. Sci. 2020;57:389–399. doi: 10.1080/10408363.2020.1770685. [DOI] [PMC free article] [PubMed] [Google Scholar]
- 4.Liu N., Zhang T., Ma L., Zhang H., Wang H., Wei W., Pei H., Li H. The impact of ABO blood group on COVID-19 infection risk and mortality: a systematic review and meta-analysis. Blood Rev. 2021;48 doi: 10.1016/j.blre.2020.100785. [DOI] [PMC free article] [PubMed] [Google Scholar]
- 5.Cheng L., Li H., Li L., Liu C., Yan S., Chen H., Li Y. Ferritin in the coronavirus disease 2019 (COVID-19): a systematic review and meta-analysis. J. Clin. Lab. Anal. 2020;34 doi: 10.1002/jcla.23618. [DOI] [PMC free article] [PubMed] [Google Scholar]
- 6.Martha J.W., Wibowo A., Pranata R. Prognostic value of elevated lactate dehydrogenase in patients with COVID-19: a systematic review and meta-analysis. Postgrad. Med. J. 2022;98:422–427. doi: 10.1136/postgradmedj-2020-139542. [DOI] [PubMed] [Google Scholar]
- 7.Gavriilaki E., Asteris P.G., Touloumenidou T., Koravou E.E., Koutra M., Papayanni P.G., Karali V., Papalexandri A., Varelas C., Chatzopoulou F., Chatzidimitriou M., Chatzidimitriou D., Veleni A., Grigoriadis S., Rapti E., Chloros D., Kioumis I., Kaimakamis E., Bitzani M., Boumpas D., Tsantes A., Sotiropoulos D., Sakellari I., Kalantzis I.G., Parastatidis S.T., Koopialipoor M., Cavaleri L., Armaghani D.J., Papadopoulou A., Brodsky R.A., Kokoris S., Anagnostopoulos A. Genetic justification of severe COVID-19 using a rigorous algorithm. Clin. Immunol. 2021;226 doi: 10.1016/j.clim.2021.108726. [DOI] [PMC free article] [PubMed] [Google Scholar]
- 8.Asteris P.G., Gavriilaki E., Touloumenidou T., Koravou E.E., Koutra M., Papayanni P.G., Pouleres A., Karali V., Lemonis M.E., Mamou A., Skentou A.D., Papalexandri A., Varelas C., Chatzopoulou F., Chatzidimitriou M., Chatzidimitriou D., Veleni A., Rapti E., Kioumis I., Kaimakamis E., Bitzani M., Boumpas D., Tsantes A., Sotiropoulos D., Papadopoulou A., Kalantzis I.G., Vallianatou L.A., Armaghani D.J., Cavaleri L., Gandomi A.H., Hajihassani M., Hasanipanah M., Koopialipoor M., Lourenco P.B., Samui P., Zhou J., Sakellari I., Valsami S., Politou M., Kokoris S., Anagnostopoulos A. Genetic prediction of ICU hospitalization and mortality in COVID-19 patients using artificial neural networks. J. Cell. Mol. Med. 2022;26:1445–1455. doi: 10.1111/jcmm.17098. [DOI] [PMC free article] [PubMed] [Google Scholar]
- 9.Upadhyay A.K., Shukla S. Correlation study to identify the factors affecting COVID-19 case fatality rates in India. Diabetes Metab. Syndr. 2021;15:993–999. doi: 10.1016/j.dsx.2021.04.025. [DOI] [PMC free article] [PubMed] [Google Scholar]
- 10.Niazkar H.R., Niazkar M. Application of artificial neural networks to predict the COVID-19 outbreak. Glob. Health Res. Policy. 2020;5:50. doi: 10.1186/s41256-020-00175-y. [DOI] [PMC free article] [PubMed] [Google Scholar]
- 11.Mahanty C., Kumar R., Asteris P.G., Gandomi A.H. COVID-19 patient detection based on fusion of transfer learning and fuzzy ensemble models using CXR images. Appl. Sci. 2021;11 [Google Scholar]
- 12.Rahimi I., Gandomi A.H., Asteris P.G., Chen F. Analysis and prediction of COVID-19 using SIR, SEIQR, and machine learning models: Australia, Italy, and UK cases. Information. 2021;12 [Google Scholar]
- 13.Asteris P.-G., Douvika M.-G., Karamani C.-A., Skentou A.-D., Chlichlia K., Cavaleri L., Daras T., Armaghani D.-J., Zaoutis T.-E. A novel heuristic algorithm for the Modeling and risk assessment of the COVID-19 pandemic phenomenon. Comput. Model. Eng. Sci. 2020;125:815–828. [Google Scholar]
- 14.Wu Y., Giger M.L., Doi K., Vyborny C.J., Schmidt R.A., Metz C.E. Artificial neural networks in mammography: application to decision making in the diagnosis of breast cancer. Radiology. 1993;187:81–87. doi: 10.1148/radiology.187.1.8451441. [DOI] [PubMed] [Google Scholar]
- 15.Kononenko I. Machine learning for medical diagnosis: history, state of the art and perspective. Artif. Intell. Med. 2001;23:89–109. doi: 10.1016/s0933-3657(01)00077-x. [DOI] [PubMed] [Google Scholar]
- 16.Mazurowski M.A., Habas P.A., Zurada J.M., Lo J.Y., Baker J.A., Tourassi G.D. Training neural network classifiers for medical decision making: the effects of imbalanced datasets on classification performance. Neural Netw. 2008;21:427–436. doi: 10.1016/j.neunet.2007.12.031. [DOI] [PMC free article] [PubMed] [Google Scholar]
- 17.Ciresan D.C., Giusti A., Gambardella L.M., Schmidhuber J. Mitosis detection in breast cancer histology images with deep neural networks. Med. Image Comput. Comput. Assist. Interv. 2013;16:411–418. doi: 10.1007/978-3-642-40763-5_51. [DOI] [PubMed] [Google Scholar]
- 18.Anthimopoulos M., Christodoulidis S., Ebner L., Christe A., Mougiakakou S. Lung pattern classification for interstitial lung diseases using a deep convolutional neural network. IEEE Trans. Med. Imaging. 2016;35:1207–1216. doi: 10.1109/TMI.2016.2535865. [DOI] [PubMed] [Google Scholar]
- 19.Shen D., Wu G., Suk H.I. Deep learning in medical image analysis. Annu. Rev. Biomed. Eng. 2017;19:221–248. doi: 10.1146/annurev-bioeng-071516-044442. [DOI] [PMC free article] [PubMed] [Google Scholar]
- 20.Ribeiro A.H., Ribeiro M.H., Paixao G.M.M., Oliveira D.M., Gomes P.R., Canazart J.A., Ferreira M.P.S., Andersson C.R., Macfarlane P.W., Meira W., Jr., Schon T.B., Ribeiro A.L.P. Automatic diagnosis of the 12-lead ECG using a deep neural network. Nat. Commun. 2020;11:1760. doi: 10.1038/s41467-020-15432-4. [DOI] [PMC free article] [PubMed] [Google Scholar]
- 21.Gandomi A.H., Fridline M.M., Roke D.A. Decision tree approach for soil liquefaction assessment. TheScientificWorldJournal. 2013;2013 doi: 10.1155/2013/346285. [DOI] [PMC free article] [PubMed] [Google Scholar]
- 22.Asteris P.G., Mokos V.G. Concrete compressive strength using artificial neural networks. Neural Comput. & Applic. 2020;32:11807–11826. [Google Scholar]
- 23.Asteris P.G., Lourenço P.B., Roussis P.C., Elpida Adami C., Armaghani D.J., Cavaleri L., Chalioris C.E., Hajihassani M., Lemonis M.E., Mohammed A.S., Pilakoutas K. Revealing the nature of metakaolin-based concrete materials using artificial intelligence techniques. Constr. Build. Mater. 2022;322 [Google Scholar]
- 24.Valenti L., Griffini S., Lamorte G., Grovetti E., Uceda Renteria S.C., Malvestiti F., Scudeller L., Bandera A., Peyvandi F., Prati D., Meroni P., Cugno M. Chromosome 3 cluster rs11385942 variant links complement activation with severe COVID-19. J. Autoimmun. 2021;117 doi: 10.1016/j.jaut.2021.102595. [DOI] [PMC free article] [PubMed] [Google Scholar]
- 25.Ramlall V., Thangaraj P.M., Meydan C., Foox J., Butler D., Kim J., May B., De Freitas J.K., Glicksberg B.S., Mason C.E., Tatonetti N.P., Shapira S.D. Immune complement and coagulation dysfunction in adverse outcomes of SARS-CoV-2 infection. Nat. Med. 2020;26:1609–1615. doi: 10.1038/s41591-020-1021-2. [DOI] [PMC free article] [PubMed] [Google Scholar]
- 26.Baker K.F., Hanrath A.T., Schim van der Loeff I., Kay L.J., Back J., Duncan C.J. National Early Warning Score 2 (NEWS2) to identify inpatient COVID-19 deterioration: a retrospective analysis. Clin. Med. (Lond. Engl.) 2021;21:84–89. doi: 10.7861/clinmed.2020-0688. [DOI] [PMC free article] [PubMed] [Google Scholar]
- 27.Pan P., Li Y., Xiao Y., Han B., Su L., Su M., Li Y., Zhang S., Jiang D., Chen X., Zhou F., Ma L., Bao P., Xie L. Prognostic assessment of COVID-19 in the intensive care unit by machine learning methods: model development and validation. J. Med. Internet Res. 2020;22 doi: 10.2196/23128. [DOI] [PMC free article] [PubMed] [Google Scholar]
- 28.Lorenzoni G., Azzolina D., Acar A.S., Silvestri L., Berchialla P., Gregori D. Understanding the factors affecting COVID-19 mortality in Italy: does a relationship exist with a sharp increase in intensive care unit admissions? Disaster Med. Public Health Prep. 2021:1–6. doi: 10.1017/dmp.2021.314. [DOI] [PMC free article] [PubMed] [Google Scholar]
- 29.Lorenzen S.S., Nielsen M., Jimenez-Solem E., Petersen T.S., Perner A., Thorsen-Meyer H.C., Igel C., Sillesen M. Using machine learning for predicting intensive care unit resource use during the COVID-19 pandemic in Denmark. Sci. Rep. 2021;11:18959. doi: 10.1038/s41598-021-98617-1. [DOI] [PMC free article] [PubMed] [Google Scholar]
- 30.Alabbad D.A., Almuhaideb A.M., Alsunaidi S.J., Alqudaihi K.S., Alamoudi F.A., Alhobaishi M.K., Alaqeel N.A., Alshahrani M.S. Machine learning model for predicting the length of stay in the intensive care unit for Covid-19 patients in the eastern province of Saudi Arabia. Inform. Med. Unlocked. 2022;30 doi: 10.1016/j.imu.2022.100937. [DOI] [PMC free article] [PubMed] [Google Scholar]
- 31.Garcia-Gutierrez S., Esteban-Aizpiri C., Lafuente I., Barrio I., Quiros R., Quintana J.M., Uranga A., C.-R.W. Group Machine learning-based model for prediction of clinical deterioration in hospitalized patients by COVID 19. Sci. Rep. 2022;12:7097. doi: 10.1038/s41598-022-09771-z. [DOI] [PMC free article] [PubMed] [Google Scholar]
- 32.Yang A.P., Liu J.P., Tao W.Q., Li H.M. The diagnostic and predictive role of NLR, d-NLR and PLR in COVID-19 patients. Int. Immunopharmacol. 2020;84 doi: 10.1016/j.intimp.2020.106504. [DOI] [PMC free article] [PubMed] [Google Scholar]
- 33.Jimeno S., Ventura P.S., Castellano J.M., Garcia-Adasme S.I., Miranda M., Touza P., Lllana I., Lopez-Escobar A. Prognostic implications of neutrophil-lymphocyte ratio in COVID-19. Eur. J. Clin. Investig. 2021;51 doi: 10.1111/eci.13404. [DOI] [PubMed] [Google Scholar]
- 34.Shang W., Dong J., Ren Y., Tian M., Li W., Hu J., Li Y. The value of clinical parameters in predicting the severity of COVID-19. J. Med. Virol. 2020;92:2188–2192. doi: 10.1002/jmv.26031. [DOI] [PMC free article] [PubMed] [Google Scholar]
- 35.Iba T., Miki T., Hashiguchi N., Tabe Y., Nagaoka I. Is the neutrophil a ‘prima donna’ in the procoagulant process during sepsis? Crit. Care. 2014;18:230. doi: 10.1186/cc13983. [DOI] [PMC free article] [PubMed] [Google Scholar]
- 36.Li X., Liu C., Mao Z., Xiao M., Wang L., Qi S., Zhou F. Predictive values of neutrophil-to-lymphocyte ratio on disease severity and mortality in COVID-19 patients: a systematic review and meta-analysis. Crit. Care. 2020;24:647. doi: 10.1186/s13054-020-03374-8. [DOI] [PMC free article] [PubMed] [Google Scholar]
- 37.Mahat R.K., Panda S., Rathore V., Swain S., Yadav L., Sah S.P. The dynamics of inflammatory markers in coronavirus disease-2019 (COVID-19) patients: a systematic review and meta-analysis. Clin. Epidemiol. Glob. Health. 2021;11 doi: 10.1016/j.cegh.2021.100727. [DOI] [PMC free article] [PubMed] [Google Scholar]
- 38.Simadibrata D.M., Calvin J., Wijaya A.D., Ibrahim N.A.A. Neutrophil-to-lymphocyte ratio on admission to predict the severity and mortality of COVID-19 patients: a meta-analysis. Am. J. Emerg. Med. 2021;42:60–69. doi: 10.1016/j.ajem.2021.01.006. [DOI] [PMC free article] [PubMed] [Google Scholar]
- 39.Zhan H., Chen H., Liu C., Cheng L., Yan S., Li H., Li Y. Diagnostic value of D-dimer in COVID-19: a meta-analysis and meta-regression, clinical and applied thrombosis/hemostasis : official journal of the international academy of. Clin. Appl. Thromb. Hemost. 2021;27 doi: 10.1177/10760296211010976. 10760296211010976. [DOI] [PMC free article] [PubMed] [Google Scholar]
- 40.Duz M.E., Balci A., Menekse E. D-dimer levels and COVID-19 severity: systematic review and meta-analysis. Tuberk Toraks. 2020;68:353–360. doi: 10.5578/tt.70351. [DOI] [PubMed] [Google Scholar]
- 41.Del Sole F., Farcomeni A., Loffredo L., Carnevale R., Menichelli D., Vicario T., Pignatelli P., Pastori D. Features of severe COVID-19: a systematic review and meta-analysis. Eur. J. Clin. Investig. 2020;50 doi: 10.1111/eci.13378. [DOI] [PMC free article] [PubMed] [Google Scholar]
- 42.Mendonca M.M., da Cruz K.R., Pinheiro D.D.S., Moraes G.C.A., Ferreira P.M., Ferreira-Neto M.L., da Silva E.S., Goncalves R.V., Pedrino G.R., Fajemiroye J.O., Xavier C.H. Dysregulation in erythrocyte dynamics caused by SARS-CoV-2 infection: possible role in shuffling the homeostatic puzzle during COVID-19. Hematol. Transfus Cell. Ther. 2022;44:235–245. doi: 10.1016/j.htct.2022.01.005. [DOI] [PMC free article] [PubMed] [Google Scholar]
- 43.Bomhof G., Mutsaers P., Leebeek F.W.G., Te Boekhorst P.A.W., Hofland J., Croles F.N., Jansen A.J.G. COVID-19-associated immune thrombocytopenia. Br. J. Haematol. 2020;190:e61–e64. doi: 10.1111/bjh.16850. [DOI] [PMC free article] [PubMed] [Google Scholar]
- 44.Wagner J., Garcia-Rodriguez V., Yu A., Dutra B., Larson S., Cash B., DuPont A., Farooq A. Elevated transaminases and hypoalbuminemia in Covid-19 are prognostic factors for disease severity. Sci. Rep. 2021;11:10308. doi: 10.1038/s41598-021-89340-y. [DOI] [PMC free article] [PubMed] [Google Scholar]
- 45.Huang J., Cheng A., Kumar R., Fang Y., Chen G., Zhu Y., Lin S. Hypoalbuminemia predicts the outcome of COVID-19 independent of age and co-morbidity. J. Med. Virol. 2020;92:2152–2158. doi: 10.1002/jmv.26003. [DOI] [PMC free article] [PubMed] [Google Scholar]
- 46.Viana-Llamas M.C., Arroyo-Espliguero R., Silva-Obregon J.A., Uribe-Heredia G., Nunez-Gil I., Garcia-Magallon B., Toran-Martinez C.G., Castillo-Sandoval A., Diaz-Caraballo E., Rodriguez-Guinea I., Dominguez-Lopez J. Hypoalbuminemia on admission in COVID-19 infection: an early predictor of mortality and adverse events. A retrospective observational study. Med. Clin. 2021;156:428–436. doi: 10.1016/j.medcli.2020.12.018. [DOI] [PMC free article] [PubMed] [Google Scholar]
- 47.Gavriilaki E., Anyfanti P., Gavriilaki M., Lazaridis A., Douma S., Gkaliagkousi E. Endothelial dysfunction in COVID-19: lessons learned from coronaviruses. Curr. Hypertens. Rep. 2020;22:63. doi: 10.1007/s11906-020-01078-6. [DOI] [PMC free article] [PubMed] [Google Scholar]
- 48.Zerbato V., Sanson G., De Luca M., Di Bella S., di Masi A., Caironi P., Marini B., Ippodrino R., Luzzati R. The impact of serum albumin levels on COVID-19 mortality. Infect. Dis. Rep. 2022;14:278–286. doi: 10.3390/idr14030034. [DOI] [PMC free article] [PubMed] [Google Scholar]
- 49.Skendros P., Mitsios A., Chrysanthopoulou A., Mastellos D.C., Metallidis S., Rafailidis P., Ntinopoulou M., Sertaridou E., Tsironidou V., Tsigalou C., Tektonidou M., Konstantinidis T., Papagoras C., Mitroulis I., Germanidis G., Lambris J.D., Ritis K. Complement and tissue factor-enriched neutrophil extracellular traps are key drivers in COVID-19 immunothrombosis. J. Clin. Invest. 2020;130:6151–6157. doi: 10.1172/JCI141374. [DOI] [PMC free article] [PubMed] [Google Scholar]
- 50.Ramadori G. Albumin infusion in critically ill COVID-19 patients: Hemodilution and anticoagulation. Int. J. Mol. Sci. 2021;22 doi: 10.3390/ijms22137126. [DOI] [PMC free article] [PubMed] [Google Scholar]
- 51.Barkhordari M.-S., Armaghani D.-J., Asteris P.-G. 2022. Structural Damage Identification Using Ensemble Deep Convolutional Neural Network Models, Computer Modeling in Engineering \& Sciences, {pages} [Google Scholar]
- 52.Asteris P.G., Rizal F.I.M., Koopialipoor M., Roussis P.C., Ferentinou M., Armaghani D.J., Gordan B. Slope stability classification under seismic conditions using several tree-based intelligent techniques. Appl. Sci. 2022;12:1753. [Google Scholar]
- 53.Lu S., Koopialipoor M., Asteris P.G., Bahri M., Armaghani D.J. A novel feature selection approach based on tree models for evaluating the punching shear capacity of steel Fiber-reinforced concrete flat slabs. Materials. 2020;13:3902. doi: 10.3390/ma13173902. [DOI] [PMC free article] [PubMed] [Google Scholar]
Associated Data
This section collects any data citations, data availability statements, or supplementary materials included in this article.
Supplementary Materials
Supplementary material
Data Availability Statement
Data will be immediately available upon request.