

Abstract
Mercury is one of the most toxic heavy metals causing harmful effects on the human body; meanwhile, mercury is found in some face cream products to give a whitening effect. The upper limit concentration of mercury in skin-lightening products defined by the Food and Drug Administration (FDA) is under one mg/L as Hg2+. A new green analytical spectrophotometric method for mercury analysis has been developed by employing a biological reagent from fruit skin extract of robusta coffee (Coffea canephora) as a bioreductor for silver ions as well as a stabilizer for the AgNPs product. The detection principle of this method is based on the decrease of the color intensity of silver nanoparticles (AgNPs) after the addition of Hg2+ ions due to the re-oxidization of the AgNPs by Hg2+ ions to colorless Ag+ ions. To achieve the most significant sensitivity, linearity of measurement, and validity, the method was optimized toward the volume of AgNPs and reaction time. In this research, the synthesized AgNPs were also characterized by UV–Vis Spectrometry as well as a particle size analyzer (PSA) to determine the size of nanoparticles. The result showed that the optimum conditions were attained at 4 mL AgNPs solution and 3-min reaction resulting in a linear measurement of Hg2+ in the range of 0–15 mg/L with LOD and LOQ of 0.039 and 0.130 mg/L, respectively. This method is quite selective and has been validated by applying it to real face cream samples with satisfactory results supported by average recoveries of close to 100%.
Graphical abstract

Keywords: Mercury, Green synthesis, Silver nanoparticles, Coffee fruit skin, Spectrophotometry
Introduction
In the last decade, the trend skincare business has been multiplying worldwide. These growing phenomena are associated with the elevation of appearance awareness, the change in beauty perception, the increasing elderly population, and the prevalence of skin disease. The outbreak of the COVID-19 pandemic supports the condition because consumers prefer the easy and convenient way to manage their skin instead of visiting dermatologists or skincare centers [21]. Face cream, as a part of skincare, is helpful to maintain the moistness of the skin, repairing skin barriers, and sometimes protect the skin from UV radiation from the sunlight. However, mercury is still found in some face cream products to give a whitening effect [5]. The Food and Drugs Administration (FDA) has defined the tolerance limit of mercury in cosmetics as less than one ppm. Long-term mercury exposure will inhibit the formation of melanin (melanogenesis) which is used as a light-absorbing pigment and responsible for the production of human skin and hair color [12].
Mercury is classified as part of the toxic heavy metals in the human body when exposed to our body through pollution. Mercury metal ions in the form of Hg2+ are the most stable and widespread pollutants. Various methods have been developed to monitor mercury concentration in good consumer samples, including cold vapor atomic absorption spectrophotometry or CV-AAS [31], inductively coupled plasma mass spectrometry or ICP-MS [39], and UV–Vis spectrophotometric using ligand complexes such as dithizone [36] and rhodamine B [16]. However, these methods have several weaknesses, including high-cost equipment and maintenance, complex sample preparation, time-consuming analysis, and inefficient routine monitoring [11]. This condition should be answered by developing low-cost dan rapid detection of mercury, especially in cosmetic samples.
Nanomaterials are one of the major exciting topics for many researchers. Nanomaterials have numerous beneficial properties, including chemical and physical stabilities, lower density, and wide surface area [19]. Nanomaterials can be defined as a nanostructure with at least a one-dimensional system size is less than 100 nm to enhance the chemical and physical properties of the bulk material. The classification of nanomaterials includes carbon-based nanomaterials, quantum dots, polymeric nanomaterials, metal oxide nanoparticles (MONPs), and metal nanoparticles (MNPs) [32]. Metal nanoparticles (MNPs) are commonly used in various fields such as medicine, food, chemistry, and technology. One of the most well-known MNPs is silver nanoparticles (AgNPs). AgNPs can be synthesized through chemical, physical, and biological approaches or green synthesis [38]. In the process, the synthesis of nanoparticles is carried out using top–down and bottom-up methods, whereas green synthesis is categorized as the bottom-up method by combining atoms or molecules into larger nanostructures to produce nano-sized materials. Green synthesized AgNPs are non-toxic, cheap, renewable, and easy to control. Furthermore, this method is widely developed to produce desired eco-friendly silver nanoparticles [24].
Recently, there has been an alternative green synthesis method for producing silver nanoparticles by employing natural materials such as plant extract as a reduction agent. The biosynthesis method of silver nanoparticles using plant extracts has several advantages because plants are the primary source of metabolite compounds which can accelerate the reaction time more than microbes [26]. Green synthesized silver nanoparticle is less toxic, low cost, easy to process and purify, and do not require a high amount of energy. In previous studies, plant extracts were reported as bioreductors to synthesize silver nanoparticles such as Myrmecodia pendans Extract [26], hazelnut leaf extract [22], and Cymbopogon citratus leaf extract [29], and green coffee bean extract [37]. However, the green synthesis of silver nanoparticles using robusta coffee fruit skin extract (Coffea canephora) has never been reported as a reducing agent in the synthesis of silver nanoparticles. Furthermore, robusta coffee skin has potential compounds for reducing agents and stabilizers of silver nanoparticles [1].
Coffee is a popular beverage with two main varieties: arabica (Coffea arabica) and robusta (Coffea canephora). Indonesia shares 6.10% of global coffee production, about 0.642 million tons. Robusta coffee in Indonesia is mainly produced in six provinces, i.e., Lampung, South Sumatera, Bengkulu, North Sumatera, South Sulawesi, and East Java [35]. Robusta coffee grows at an altitude for cultivation in 0–700 m above sea level, and its price is lower than arabica coffee. High production of coffee has a significant relationship with the production of fruit skin waste. The waste is usually directly disposed of or for feeding the livestock. Meanwhile, C. canephora contains several bioactive compounds, such as caffeine, tannin, and organic acid, with antioxidant activity, which can be used as a reducing agent and stabilizer for silver nanoparticles [2].
Silver nanoparticles (AgNPs) can be used in analytical methods as sensors for the colorimetric determination of analytes. Analytes can be determined based on changes in surface plasmon resonance (SPR) spectra from the results of silver nanoparticle aggregation. The presence of analyte metal ions influences the size of silver nanoparticles, characterized by changes in peak intensity, and can be observed directly in the form of discoloration. The interaction between the analyte and the AgNPs decreases the peak intensity proportional to the concentration of the analyte. This interaction can be used in measuring Hg2+ ions using capped-silver nanoparticles, which can detect the presence of mercury ions [15]. This condition is theoretically due to a spontaneous reaction between metallic silver and mercury ions. In this study, silver nanoparticles synthesized using Dampit robusta coffee fruit skin extract as a reducing agent are used for detecting mercury levels in a facial care cream product. The principal method of mercury measurement is based on the decrease of color intensity of silver nanoparticles in the presence of Hg2+ ions which is under the principle of colorimetry.
Experimental section
Materials
Coffea canephora fruit skin was purchased from a local farmer in Dampit, Malang, Indonesia. Silver nanoparticles were synthesized from the analytical grade of silver nitrate as a precursor (Merck). Other chemicals used in this study were mercury chloride (Merck), concentrated nitric acid (Merck), lead nitrate (Merck), aluminum chloride (SmartLab), copper sulfate (Merck), zinc sulfate heptahydrate (SmartLab), and iron sulfate heptahydrate (SmartLab). Deionized water was used throughout this study. Face cream samples were collected from local markets around Malang City, Indonesia.
Instruments
UV–Visible Spectrophotometer (Shimadzu UV-1601), pH meter, FTIR (Shimadzu IRSpirit), Zetasizer Nano (Malvern Nano ZS ZEN3500), X-Ray Diffraction (Panalytical X'Pert Pro), Scanning Electron Microscope (FEI Inspect-S50), oven (Memmert UN110), Freeze Dryer, and glassware.
Coffea canephora fruit skin extraction
200 g of C. canephora was dried at room temperature for 24 h and crushed by a dry mill blender. 25 g of C. canephora powder was transferred into a beaker glass containing 100 mL water and heated to 60 °C for 45 min. The solid particulates were centrifuged up to 1000 rpm for 20 min. The clear solution of supernatant extract was filtered using Whatman No. 1 filter paper. The filtered extract was stored in a dark glass bottle at 4 °C and used as a bioreduction agent of silver ions and capping agent of AgNPs.
Synthesis of AgNPs
Synthesis of AgNPs was carried out by slowly adding an appropriate volume of C. canephora fruit skin extract to the beaker glass containing 1 mM aqueous AgNO3 solutions. The volume ratio of C. canephora fruit skin extract to silver nitrate was 1:2, 1:3, and 1:4, with a total determined volume was 100 mL. Then the mixture was exposed directly to sunlight radiation for 40 min. The formation of AgNPs was visually confirmed by the color change of the mixture from faint yellow to dark reddish-orange. The AgNPs solution was scanned spectrophotometrically at a wavelength range from 200 to 800 nm to determine the optimum ratio and maximum wavelength. Figure 1 illustrates the schematic steps of the synthesis of the formation of AgNPs using C. canephora fruit skin extract. Freeze drying was carried out to acquire AgNPs solids for further characterization.
Fig. 1.

Schematic steps of AgNPs synthesized using C. canephora fruit skin extract
Characterization of AgNPs
Particle Size Analyzer (PSA) for size and zeta potential measurements were carried out using Malvern Zetasizer Nano Instruments. The freeze-dried powder of the synthesized AgNPs using C. canephora fruit skin extract was then characterized by several instruments. FTIR (Shimadzu IRSpirit) obtained the infrared spectra of synthesized AgNPs with wave numbers between 4000 and 400 cm−1. The obtained AgNPs were mixed with KBr powder and pelletized, and then the spectrum was recorded. The diffraction pattern of AgNPs was measured by X-ray Diffraction (XRD) in the range of 2θ from 20 to 90°. Scanning Electron Microscope (SEM) was observed to get the morphological images of the synthesized AgNPs. The spectrum and images obtained were compared with the appropriate standard data from various literature.
Selectivity test
The optimum volume of AgNps solution of 4 mL was placed in a 10 mL volumetric flask. Then, 1 mL of 1000 mg/L Hg2+ solutions was added and diluted into 10 mL, and homogenized until mixed. The change of color was observed, and absorbance was determined using a UV–Visible Spectrophotometer at the maximum wavelength to obtain Δ absorbance data. These procedures were repeated for 1000 mg/L of Pb2+, Al3+, Cu2+, Zn2+, Fe2+, Mix-1 (mixture of Pb2+, Al3+, Cu2+, Zn2+, Fe2+), and Mix-2 with addition of Hg2+. All the data were compared to determine the selectivity of synthesized AgNPs for Hg2+ detection.
Optimization of AgNPs volume
The optimum AgNPs volume was determined by varying the volume of AgNPs solutions in different compositions, as in Table 1. The composition of the solution consisted of synthesized AgNPs solution added with 1 mL of 100 mg/L Hg2+, then diluted until 10 mL and UV–Visible Spectrophotometer measured the absorbance of each solution. The data were compared to obtain Δ absorbance data. The optimum volume of AgNPs was determined by the greatest Δ absorbance.
Table 1.
Composition of solution for AgNPs volume optimization
| Solution | Added volume (mL) | ||
|---|---|---|---|
| AgNPs | Hg2+ 100 mg/L | Dilution water | |
| 1 | 0.5 | 1 | 8.5 |
| 2 | 1 | 1 | 8 |
| 3 | 1.5 | 1 | 7.5 |
| 4 | 2 | 1 | 7 |
| 5 | 2.5 | 1 | 6.5 |
| 6 | 3 | 1 | 6 |
| 7 | 3.5 | 1 | 5.5 |
| 8 | 4 | 1 | 5 |
| 9 | 4.5 | 1 | 4.5 |
| 10 | 5 | 1 | 4 |
Optimization of reaction time
The optimum reaction time was determined by pipetting the optimum volume of AgNPs into a 10 mL volumetric flask. Then, 1 mL of 100 mg/L Hg2+ was added and diluted until 10 mL and a UV–Visible spectrophotometer measured the absorbance. The solution was measured for 3, 5, 7, 9, and 11 min of reaction. The data were compared to a blank solution to obtain Δ absorbance data and decide the optimum reaction time.
Optimization of pH
The optimum reaction time was determined by pipetting the optimum volume of AgNPs into a 10 mL volumetric flask. The synthesized AgNPs are added 3 mL of phosphate buffer solution (pH 7). Then, the pH of AgNPs solution was adjusted using 1.0 M HCl and 0.1 M NaOH. After that, 1 mL of 100 mg/L Hg2+ was added and diluted until 10 mL and a UV–Visible spectrophotometer measured the absorbance. The solution was measured using optimum reaction times. The data were compared to a blank solution to obtain Δabsorbance data and decide the optimum reaction time.
Linear range and detection limit
Linearity tests were conducted to obtain the measurement range of mercury. The optimum volume of AgNPs was pipetted into a 10 mL volumetric flask. Then added with standard solutions of Hg2+ with concentration variations of 0, 0.2, 0.5, 1, 2, 3, 4, 5, 6, 7, 8, 9, 10, 15, 17, 20, and 25 mg/L and diluted until 10 mL. Then, the mixture solutions observed the color changes and measured their absorbances spectrophotometrically. The data were compared to a blank solution to obtain Δ absorbance data and determined the linearity of mercury measurement. The calibration curve was made by plotting the Δ absorbance data of the Hg2+ standard solution with concentration variations of 0, 0.2, 0.5, 1, 3, 5, 7, 11, 13, and 15 mg/L to obtain a linear equation and determination coefficient. The detection limit (LOD dan LOQ) was carried out by measuring the absorbance of the blank 10 times.
Analytical application
The practical applicability of this method was tested in 3 different face cream samples obtained from the local market around Malang City, Indonesia by dissolving 0.1-g face cream samples prepared using 1 M nitric acid and heated up to 80 °C. Then, the solution was filtered and diluted to 100 mL. The dilute sample solution of 1 mL was analyzed to determine the concentration of mercury using optimum volume AgNPs and reaction time. The proposed method's validity was tested using standard addition techniques. Standard addition techniques were carried out by adding 1, 3, and 5 mg/L of Hg2+ solution into the dilute solution, then calculated to measure % recovery.
Results and discussion
Synthesis of AgNPs
Silver nanoparticles capped with C. canephora fruit skin extract were prepared by reduction of 1 mM silver nitrate with amounts of extract. The silver nitrate solution after the addition of extract was pale yellow. After 45 min of irradiation using the sunlight, the color of the solution was changed to dark brown, indicating AgNPs existed and formed in the solution [29], as shown in Fig. 2.
Fig. 2.
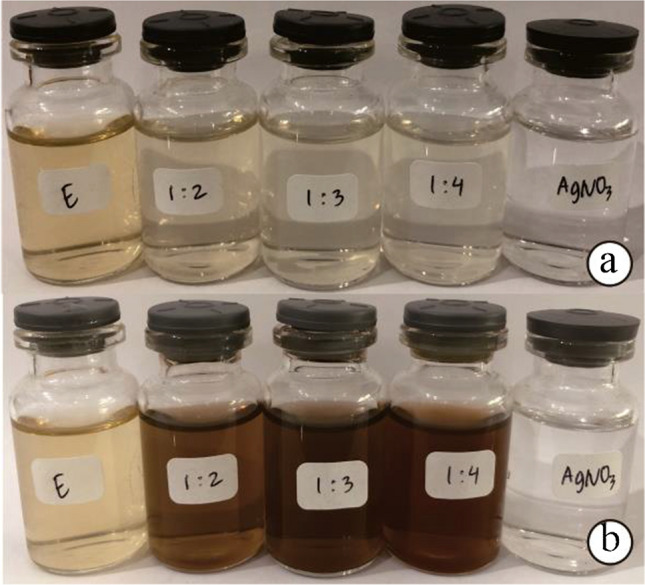
Synthesis of AgNPs (a) nanoparticle solution before irradiation and (b) nanoparticle solution after irradiation
The color of the solution and the profile of the UV–Vis spectrum results from a surface plasmon resonance of silver nanoparticles [15]. Several antioxidants in C. canephora fruit skin extract, such as chlorogenic acid, have successfully reduced the Ag+ to all ratios, and the pH during the process of reaction was maintained at 7 ± 1. UV–Vis spectrophotometer measurement ranging from 200 to 800 nm in Fig. 3 shows Surface Plasmon Resonance (SPR) spectra with the maximum wavelength of synthesized nanoparticle at 431 nm.
Fig. 3.
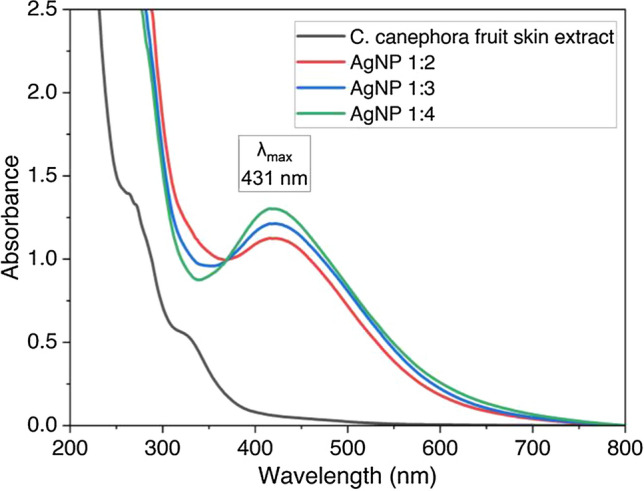
UV–Vis spectrum of synthesized silver nanoparticle with the variation of C. canephora fruit skin extract and 1 mM AgNO3 solution
The stability of AgNPs is pH-dependent because small amount of acids can prevent the growth of AgNPs. The intensity of AgNPs SPR spectrum is measured in the pH range from 2 to 9 as shown in Fig. 4. The effect of pH was studied on synthesized AgNPs by adding 3 mL of phosphate buffer solution (pH 7) to AgNPs solution. The pH was adjusted using 1.0 M HCl and 0.1 M NaOH. It is known that the intensity of SPR spectrum is increased by rising the pH that indicate the stability and growth of synthesized AgNPs take place through an electrostatic stabilization mechanism [9]. However, the sharpest and highest intensity is found at the blank solution (synthesized AgNPs in distilled water with pH of 7.5). Furthermore, the SPR peaks are blue shifted in the other solutions. These deviations can be linked to the use of phosphate buffer solution [9].
Fig. 4.
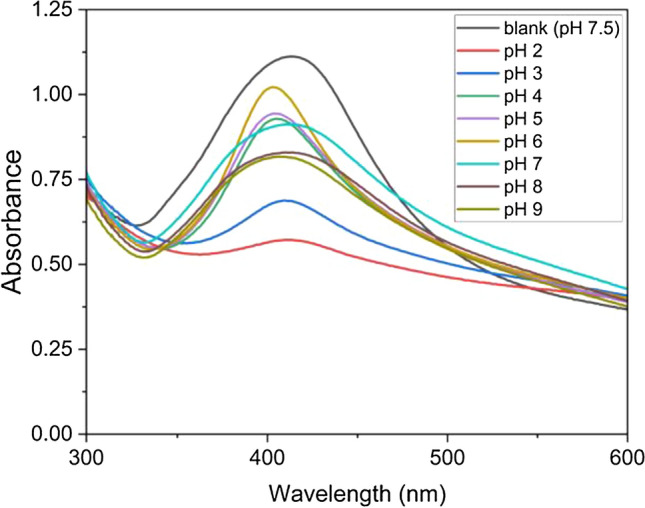
The SPR spectra of synthesized AgNPs at different pHs
FTIR analysis
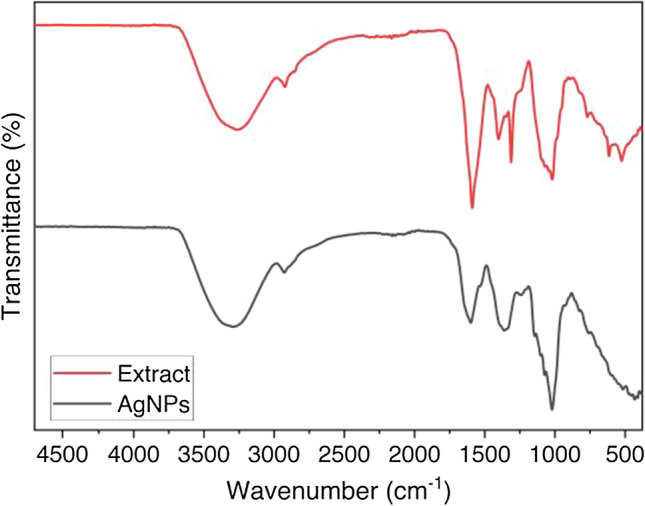
The FTIR spectra of synthesized AgNPs were analyzed using a Shimadzu IRSpirit with the KBR pellet technique. This measurement was carried out to identify the functional group correlated to bioactive compounds contained in C. canephora fruit skin extract. Colloidal silver nanoparticle before FTIR measurement was freeze-dried to obtain silver nanoparticle powder. The color of the silver nanoparticle powder was identified as a dark brown powder. In the FTIR spectrum shown in Fig. 5, the vibration received at the peak positions, 3263 cm−1, can be assigned to the absorption band of a hydroxyl group (O–H) vibration likely to originate from alcohol or carboxylic acid. Wavenumbers near 1600 cm−1 are typical vibrations of the carbonyl group (C=O) and C=C aromatic functional groups correlated to phenolic compounds.
Fig. 5.
FTIR spectrum of C. canephora fruit skin extract and synthesized AgNPs
Furthermore, a strong peak was found near 1200 cm−1, showing the ether or polyol group (C–O) bond indicating the presence of ether and polyol groups [30]. The shift of wavenumber can be observed by comparing the FTIR spectra of C. canephora fruit skin extract and silver nanoparticles (AgNPs). From the comparison, phenol and carboxylic acid were found in the extract and involved as reducing agents of Ag+ to Ag0 (silver nanoparticle) [34].
XRD analysis
A diffractogram of synthesized AgNPs is shown in Fig. 6. X-ray diffraction (XRD) patterns were conducted by PAN Analytical using Cu K radiation (K = 1.5406 Å) to confirm the crystal of silver nanoparticles. The peaks of synthesized AgNPs from the XRD pattern have well matched the face-centered cubic crystal system of metallic silver by the standard JCPDS file no. 04–0783 [18]. For details, the peak of diffraction appears at 2θ positions 38.14°, 44.31°, 64.56°, 77.48°, and 81.66°, which corresponds to the crystalline plane (1 1 1), (2 0 0), (2 2 0), and (3 1 1), respectively. The unassigned peak at 2θ position 25.81° could be inferred for the crystallite and amorphous organic phase [13].
Fig. 6.
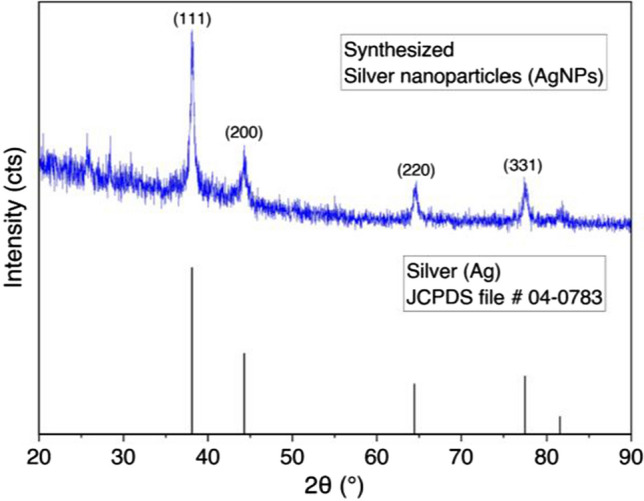
Diffraction pattern of synthesized silver nanoparticle (AgNP) and comparison with theoretical X-ray database for metallic silver
SEM analysis
The morphology of synthesized AgNPs was investigated using FEI Inspect-S50 with an operating voltage of 200,000 kV. The result of SEM images can be seen in Fig. 7. Figure 7b of SEM images at 50,000× magnification gives a more apparent morphology of silver nanoparticles than Fig. 7a at 20,000 × magnification. The shape of synthesized AgNPs was dominated by irregular, and some fractions resulted in spherical. The previous study reported the irregular shape using another reducing agent, such as Artocarpus heterophyllus lam [23]. Meanwhile, the spherical shape also has been reported using other plant extracts, including Azadirachta indica [27], Cinnamomum camphora [3], and Jatropha curcas [7]. The resulting irregular and roughly spherical shape of AgNPs may be caused by the bulky size of tannin and smaller molecules such as chlorogenic acid as stabilizers during the interaction for forming AgNPs [20].
Fig. 7.

Scanning electron microscopic image analysis of synthesized AgNP a 20,000 × and b 50,000× magnification
Particle size and zeta potential analysis
The size distribution, stability, and net surface of the synthesized AgNPs were determined using the zeta sizer nano-series (Malvern instrument). The result of the size distribution measurement shows that the z-average size was found at 65.09 ± 4.25 nm, as shown in Fig. 8a, indicating the successful formation of the nanoparticle. The potential stability of the colloidal solutions generally has a zeta potential magnitude that varies between − 30 and + 30 mV [18]. Figure 8b illustrates the zeta potential of synthesized AgNPs exhibited a sharp peak at − 30.9 ± 1.8 mV. The result can be inferred that synthesized AgNPs produce a negative charge and are well dispersed in their medium. Furthermore, the negative charge indicates a high electrical charge on the particle surface due to their strong repulsion forces and to prevent the possibility of aggregation of AgNPs. The negative value confirms the particles' repulsion and makes sure the synthesized AgNPs are stable [28].
Fig. 8.

Particle Size Analyzer (PSA) of synthesized AgNPs a size distribution analysis of AgNPs and b zeta potential analysis of AgNPs
Repeatability and reproducibility studies
The repeatability of the synthesized AgNPs is measured after ten consecutive measurement of the same AgNPs with 10 mg/L of Hg2+. The value of relative standard deviation (RSD) is detected at 1.42%. Also, the reproducibility of the synthesized AgNPs is measured after measuring the absorbance of ten different AgNPs and added to 5 mg/L of Hg2+ solutions prepared independently and the RSD is detected at 2.01%. These results shown that the synthesized AgNPs is applicable for repeatable measurement and highly reproducible as a sensor for mercury.
Selectivity test
The synthesized AgNPs were tested as a colorimetric probe for Hg2+ ion detectors. Initially, the effect of interference of cations, namely Pb2+, Al3+, Cu2+, Zn2+, and Fe2+ was tested to investigate the response of the synthesized AgNPs to these cations compared to Hg2+. Based on the UV–Visible spectrum, as shown in Fig. 9a, after adding Hg2+ solution, the spectrum decreased significantly in absorbance for the range 400–500 nm. It is confirmed visually that the color of the AgNPs solution was changed into a colorless solution due to the spontaneous redox reaction between AgNPs with Hg2+ ion. Ag0 in AgNPs was oxidized to form Ag+ as shown in the equation
Fig. 9.

Selectivity of AgNPs for various metal ions a UV–Visible spectrum and b The change in Δ absorbance of AgNPs after the addition of Hg2+ and other metal ions. "Mix" is a mixture of all the ions except mercury
This condition shows that the AgNPs are highly sensitive and selective against Hg2+ ions. Meanwhile, adding Pb2+, Al3+, Cu2+, Zn2+, and Fe2+ did not visually change the color of the colloidal solution. It is confirmed in the UV–Visible spectrum in Fig. 9a and the column chart of Δ absorbance in Fig. 9b. The positive interference of Fe2+ with negative Δ absorbance value was presumably from other mechanisms.
Optimization of mercury detection
The optimum added AgNPs volume and reaction time were investigated for optimization of mercury detection. The optimization of added AgNPs volume was performed to obtain the exact volume of AgNPs for reducing Hg2+ into Hg22+ by the color change of the AgNPs solution. Based on Fig. 10a, a significant turning point on a 4 mL volume of AgNPs in a 10 mL volumetric flask indicated that Ag0 nearly reacted with Hg2+ completely. The 4 mL volume is defined as the optimum added AgNPs volume. This result is used for further optimization.
Fig. 10.

Optimization of mercury detection using AgNPs; a added AgNPs volume, b reaction time, c SPR spectra of Hg detection at different pH, and d pH optimization curve
The optimization of reaction time was conducted to obtain the optimum reaction time needed by Hg2+ ions to reoxidize Ag0 into Ag+. It is clearly shown in Fig. 10b that the reaction time is relatively constant. Three minutes of reaction time is determined as optimum and used for further measurement. The mercury detection is also optimized in the pH range from 2 to 9 as shown at Fig. 10c. It found in the Fig. 10d that the optimum pH for Hg2+ detection using synthesized AgNPs is around 4.
Linear range and detection limit
Colorimetric measurement was conducted to investigate the linear range for this method. The color intensity of the AgNPs solution decreased according to the increase of Hg2+ ion concentrations. Linearity of measurement was conducted with a range of concentration of mercury ions from 0.1 to 25 mg/L. The absorbance value of Surface Plasmon Resonance (SPR) decreases with increasing Hg2+ concentration added to the silver nanoparticle solutions [11]. As shown in Fig. 11, the UV–Vis spectrum was shifted to a blue shift with increasing Hg2+ concentration. The range of mercury detection using this method was 0–15 mg/L with a coefficient (R2) of 0.998, shown in Fig. 12. These results indicate the excellent linearity of measurement and have the potential for analysis in real samples.
Fig. 11.
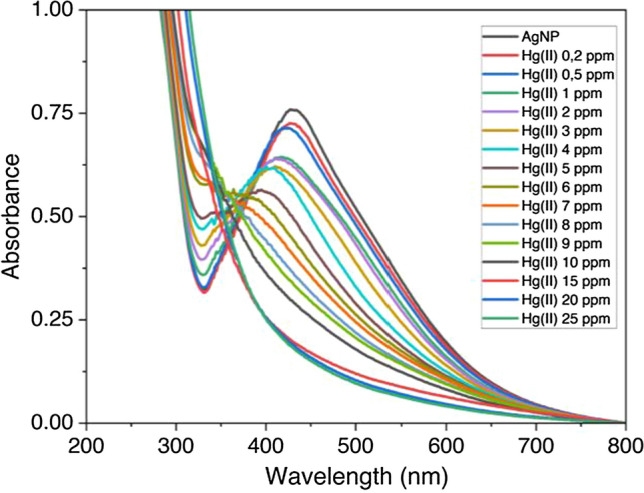
UV–Visible spectrum of increasing Hg2+ concentration that decreased the peak absorbance in a significant blue shift
Fig. 12.
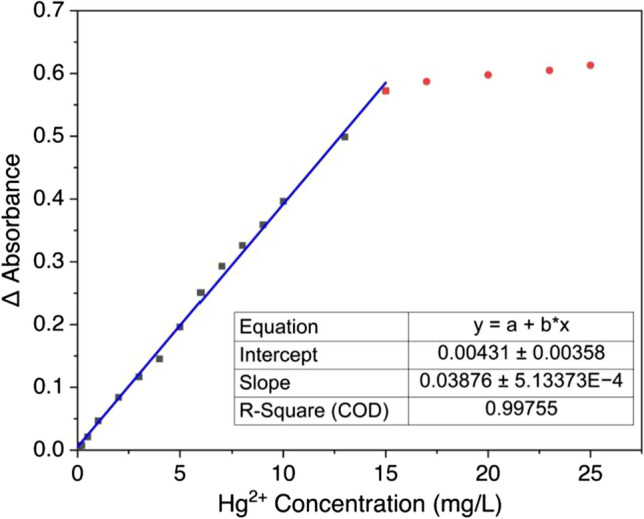
Linearity test of mercury detection for the determination of LOD and LOQ
Limit detection (LOD) and limit of quantification (LOQ) were determined by measuring the blank with ten replications. The standard deviation (s) of the blank sample was used to determine the LOD and LOQ against the slope (m) of the linearity curve [14]. LOD and LOQ are defined as 3 s/m and 10 s/m, respectively. This method results in a LOD of 0.039 mg/L and LOQ of 0.130 mg/L.
Several methods for the determination of Hg2+ were reported, as shown in Table 2. Various methods of limit detection (LOD) were compared based on their techniques and probes. Our method is comparable with previous studies using spectrophotometry with organic ligands, AuNPs, and AgNPs based on its detection limit. The lowest detection limit was obtained using CV-AAS [31] and ICP-MS [39]. Nevertheless, the complex procedure for preparing both methods makes the proposed AgNPs method could be an alternative low-cost, less toxic, and non-time-consuming procedure for mercury analysis.
Table 2.
The limit of detection (LOD) comparison for Hg2+ determination using the proposed AgNPs method with the previously reported method
| Method | Probe | LOD (mg/L) | References |
|---|---|---|---|
| ICP-MS | – | 2.10 × 10⁻⁵ | [39] |
| CV-AAS | – | 4.85 × 10⁻⁶ | [31] |
| Ligand spectrophotometry | Dithizone | 0.078 | [6] |
| Rhodamine B | 3.21 × 10⁻⁶ | [16] | |
| Nanomaterials spectrophotometry | AuNPs capped by histidine | 3.55 × 10⁻⁴ | [10] |
| AuNP using S. aromaticum extract | 0.002 | [8] | |
| AuNP capped by dithioerythritol | 4.81 × 10⁻⁵ | [17] | |
| AgNPs capped by carrageenan | 0.059 | [25] | |
| AgNPs using apple fruit extract | 0.017 | [11] | |
| AgNPs using A. bispores extract | 0.401 | [33] | |
| AgNPs-chitosan | 1.330 | [4] | |
| AgNPs using C. canephora fruit skin extract | 0.039 | Present work |
Real-sample analysis
The applicability of synthesized silver nanoparticles using C. canephora fruit skin extract to determine Hg2+ was tested with a real face cream sample. The whitening or brightening face cream was bought in Malang City. The samples were prepared by diluting the cream using 1 M nitric acid and heated up to 80 °C to dissolve the mercury. Then, the solution was filtered and diluted to 100 mL. 1 mL of sample diluted solution was analyzed to determine the concentration of mercury using optimum volume AgNPs and reaction time. The recovery test for this method was performed by standard addition techniques with 1, 3, and 5 mg/L standard solutions of Hg2+. From the triple measurement of the sample, as shown in Table 3, the %recovery value obtained varied from 94 to 111%. This result indicates the ability of synthesized AgNPs to determine the concentration of Hg2+ ions in the real sample.
Table 3.
Detection of Hg2+ in face cream samples (n = 3) and recovery test using standard addition techniques
| Cream sample | Measured Hg2+ concentration (mg/L ± SD) | Hg2+ added (mg/L) | Hg2+ found (mg/L) | % recovery |
|---|---|---|---|---|
| A | 0.71 ± 0.03 | 1 | 1.67 | 95.94 |
| 3 | 3.69 | 99.24 | ||
| 5 | 6.06 | 107.02 | ||
| B | 1.26 ± 0.10 | 1 | 2.22 | 95.94 |
| 3 | 4.29 | 100.89 | ||
| 5 | 6.83 | 111.37 | ||
| C | 2.91 ± 0.12 | 1 | 3.86 | 94.96 |
| 3 | 5.84 | 97.92 | ||
| 5 | 8.05 | 102.87 |
The ability of mercury detection using synthesized silver nanoparticles as a probe was known by measuring spiked recovery in water samples from the environment. From the triple measurement of the sample, as shown in Table 4, the recovery results also indicate good performance as a mercury detector.
Table 4.
Detection of Hg2+ in water samples from the environment (n = 3) and recovery test using standard addition techniques
| Water sample | Hg2+ added (mg/L) | Hg2+ found (mg/L) |
|---|---|---|
| Drainage water | 0 | Undetected |
| 3 | 2.94 | |
| 5 | 5.18 | |
| Pond water | 0 | Undetected |
| 3 | 3.07 | |
| 5 | 5.08 | |
| Sewage water | 0 | 0.08 |
| 3 | 2.99 | |
| 5 | 5.13 |
Conclusion
The new low-cost and green method of mercury ion detection using silver nanoparticles using C. canephora fruit skin extract was successfully developed. The silver nanoparticles can be synthesized using a volume ratio of 1:4 of extract and AgNO3 1 mM solution. The AgNPs can be produced entirely in under 45 min. The linearity range for Hg2+ detection was obtained from 0 to 15 mg/L under conditions of 4 mL of AgNPs solution, 3 min reaction time, and the optimum pH at 4. The limit of detection (LOD) and limit of quantification (LOQ) were found to be 0.039 and 0.130 mg/L, respectively. The method has been successfully applied for Hg2+ detection in face cream samples with satisfactory results.
Acknowledgements
The author would like to thank the financial support from the Ministry of Education, Culture, Research and Technology, Indonesia, through Student Creativity Program Fundings 2022, and Brawijaya University for facilitating this research.
References
- 1.Alafandi L, Nasaruddin R, Aziz A, Engliman N, Mastuli M. Green synthesis of silver nanoparticles using coffee extract for catalysis. Malaysian NANO-An Int. J. 2021;1:13–25. [Google Scholar]
- 2.Ameca GM, Cerrilla MEO, Córdoba PZ, Cruz AD, Hernández MS, Haro JH. Chemical composition and antioxidant capacity of coffee pulp. Ciênc. agrotec. 2018;42:307–313. doi: 10.1590/1413-70542018423000818. [DOI] [Google Scholar]
- 3.Aref MS, Salem SS. Bio-callus synthesis of silver nanoparticles, characterization, and antibacterial activities via Cinnamomum camphora callus culture. Biocatal. Agric. Biotechnol. 2020;27:101689. doi: 10.1016/j.bcab.2020.101689. [DOI] [Google Scholar]
- 4.Avissa M, Alauhdin M. Selective colorimetric detection of Mercury(II) using silver nanoparticles-chitosan. molekul. 2022;17:107. doi: 10.20884/1.jm.2022.17.1.5597. [DOI] [Google Scholar]
- 5.Boonchai W, Desomchoke R, Iamtharachai P. Trend of contact allergy to cosmetic ingredients in Thais over a period of 10 years. Contact Dermatitis. 2011;65:311–316. doi: 10.1111/j.1600-0536.2011.01978.x. [DOI] [PubMed] [Google Scholar]
- 6.Carrera S, Santiago G, Vega M. Spectrophotometric determination of dithizone–mercury complex by solid phase microextraction in micropipette tip syringe packed with activated carbon xerogel. Microchem. J. 2016;129:133–136. doi: 10.1016/j.microc.2016.04.013. [DOI] [Google Scholar]
- 7.Chauhan N, Tyagi AK, Kumar P, Malik A. Antibacterial potential of Jatropha curcas synthesized silver nanoparticles against food borne pathogens. Front. Microbiol. 2016 doi: 10.3389/fmicb.2016.01748. [DOI] [PMC free article] [PubMed] [Google Scholar]
- 8.De A, Kumari A, Jain P, Manna AK, Bhattacharjee G. Plasmonic sensing of Hg(II), Cr(III), and Pb(II) ions from aqueous solution by biogenic silver and gold nanoparticles. Inorganic Nano-Metal Chem. 2020;51(9):1214–1225. [Google Scholar]
- 9.El-Naka MA, El-Dissouky A, Ali GY, Ebrahim S, Shokry A. Garlic capped silver nanoparticles for rapid detection of cholesterol. Talanta. 2023;253:123908. doi: 10.1016/j.talanta.2022.123908. [DOI] [PubMed] [Google Scholar]
- 10.Eviane D, Siswanta D, Santosa SJ. pH dependence on colorimetric detection of Hg2+ by histidine-functionalized gold nanoparticles. Indones. J. Chem. 2020;20:941. doi: 10.22146/ijc.51824. [DOI] [Google Scholar]
- 11.Firdaus ML, Fitriani I, Wyantuti S, Hartati YW, Khaydarov R, Mcalister JA, Obata H, Gamo T. Colorimetric detection of Mercury(II) ion in aqueous solution using silver nanoparticles. Anal. Sci. 2017;33:831–837. doi: 10.2116/analsci.33.831. [DOI] [PubMed] [Google Scholar]
- 12.Fistarol SK, Itin PH. Disorders of pigmentation. J. Dtsch. Dermatol. Ges. 2009;8(3):187–202. doi: 10.1111/j.1610-0387.2009.07137.x. [DOI] [PubMed] [Google Scholar]
- 13.Gurunathan S, Han JW, Kwon D-N, Kim J-H. Enhanced antibacterial and anti-biofilm activities of silver nanoparticles against Gram-negative and Gram-positive bacteria. Nanoscale Res Lett. 2014;9:373. doi: 10.1186/1556-276X-9-373. [DOI] [PMC free article] [PubMed] [Google Scholar]
- 14.Gusrizal G, Alimuddin AH, Sapar A, Ridwan RN, Santosa SJ. Colorimetric detection of Hg(II) ion using silver nanoparticles capped with 3-hydroxybenzoic acid. Molekul. 2019;14:18. doi: 10.20884/1.jm.2019.14.1.460. [DOI] [Google Scholar]
- 15.Gusrizal G, Santosa SJ, Kunarti ES, Rusdiarso B. Two highly stable silver nanoparticles: surface plasmon resonance spectra study of silver nanoparticles capped with m-hydroxybenzoic acid and p-hydroxybenzoic acid. Molekul. 2018;13:30. doi: 10.20884/1.jm.2018.13.1.424. [DOI] [Google Scholar]
- 16.Hu J, Yu X, Zhang X, Jing C, Liu T, Hu X, Lu S, Uvdal K, Gao H-W, Hu Z. Rapid detection of mercury (II) ions and water content by a new rhodamine B-based fluorescent chemosensor. Spectrochim. Acta Part A Mol. Biomol. Spectrosc. 2020;241:118657. doi: 10.1016/j.saa.2020.118657. [DOI] [PubMed] [Google Scholar]
- 17.Huang D, Liu X, Lai C, Qin L, Zhang C, Yi H, Zeng G, Li B, Deng R, Liu S, Zhang Y. Colorimetric determination of mercury(II) using gold nanoparticles and double ligand exchange. Microchim Acta. 2019;186:31. doi: 10.1007/s00604-018-3126-6. [DOI] [PubMed] [Google Scholar]
- 18.Jayapriya M, Dhanasekaran D, Arulmozhi M, Nandhakumar E, Senthilkumar N, Sureshkumar K. Green synthesis of silver nanoparticles using Piper longum catkin extract irradiated by sunlight: antibacterial and catalytic activity. Res. Chem. Intermed. 2019;45:3617–3631. doi: 10.1007/s11164-019-03812-5. [DOI] [Google Scholar]
- 19.Keçili R, Büyüktiryaki S, Hussain CM. Handbook of nanomaterials in analytical chemistry. Elsevier; 2020. Membrane applications of nanomaterials; pp. 159–182. [Google Scholar]
- 20.Khodashenas B, Ghorbani HR. Synthesis of silver nanoparticles with different shapes. Arab. J. Chem. 2019;12:1823–1838. doi: 10.1016/j.arabjc.2014.12.014. [DOI] [Google Scholar]
- 21.Kim T-W, Lee C-H, Min H-J, Kim D-D, Kim D-H, Park S-Y, Kim H-W. Skincare device product design based on factor analysis of Korean anthropometric data. Cosmetics. 2022;9:42. doi: 10.3390/cosmetics9020042. [DOI] [Google Scholar]
- 22.Korkmaz N, Ceylan Y, Taslimi P, Karadağ A, Bülbül AS, Şen F. Biogenic nano silver: synthesis, characterization, antibacterial, antibiofilms, and enzymatic activity. Adv. Powder Technol. 2020;31:2942–2950. doi: 10.1016/j.apt.2020.05.020. [DOI] [Google Scholar]
- 23.Krishnan Sundarrajan S, Pottail L. Green synthesis of bimetallic Ag@Au nanoparticles with aqueous fruit latex extract of Artocarpus heterophyllus and their synergistic medicinal efficacies. Appl Nanosci. 2021;11:971–981. doi: 10.1007/s13204-020-01657-8. [DOI] [Google Scholar]
- 24.Lee S, Jun B-H. Silver nanoparticles: synthesis and application for nanomedicine. IJMS. 2019;20:865. doi: 10.3390/ijms20040865. [DOI] [PMC free article] [PubMed] [Google Scholar]
- 25.Lobregas MOS, Bantang JPO, Camacho DH. Carrageenan-stabilized silver nanoparticle gel probe kit for colorimetric sensing of mercury (II) using digital image analysis. Sensing Bio-Sensing Res. 2019;26:100303. doi: 10.1016/j.sbsr.2019.100303. [DOI] [Google Scholar]
- 26.Maarebia RZ, Wahid Wahab A, Taba P. Synthesis and characterization of silver nanoparticles using water extract of Sarang Semut (Myrmecodiapendans) for blood glucose sensors. ICA. 2019;12:29. doi: 10.20956/ica.v12i1.5881. [DOI] [Google Scholar]
- 27.Mankad M, Patil G, Patel D, Patel P, Patel A. Comparative studies of sunlight mediated green synthesis of silver nanoparaticles from Azadirachta indica leaf extract and its antibacterial effect on Xanthomonas oryzae pv. oryzae. Arab. J. Chem. 2020;13:2865–2872. doi: 10.1016/j.arabjc.2018.07.016. [DOI] [Google Scholar]
- 28.Manke A, Wang L, Rojanasakul Y. Mechanisms of nanoparticle-induced oxidative stress and toxicity. Biomed. Res. Int. 2013;2013:1–15. doi: 10.1155/2013/942916. [DOI] [PMC free article] [PubMed] [Google Scholar]
- 29.Rakib-Uz-Zaman SM, Hoque Apu E, Muntasir MN, Mowna SA, Khanom MG, Jahan SS, Akter N, Khan MA, Shuborna NS, Shams SM, Khan K. Biosynthesis of silver nanoparticles from Cymbopogon citratus leaf extract and evaluation of their antimicrobial properties. Challenges. 2022;13:18. doi: 10.3390/challe13010018. [DOI] [Google Scholar]
- 30.Rengga WDP, Yufitasari A, Adi W. Synthesis of silver nanoparticles from silver nitrate solution using green tea extract (Camelia sinensis) as bioreductor. JBAT. 2017;6:32–38. doi: 10.15294/jbat.v6i1.6628. [DOI] [Google Scholar]
- 31.Safitri E, Irmawati I, Suhud K, Islami N. Mercury analysis of body lotion cosmetic using CVAAS method: case study of distributed product in Banda Aceh. IJFAC. 2020;5:35–41. doi: 10.24845/ijfac.v5.i2.35. [DOI] [Google Scholar]
- 32.Saleem H, Zaidi SJ. Developments in the application of nanomaterials for water treatment and their impact on the environment. Nanomaterials. 2020;10:1764. doi: 10.3390/nano10091764. [DOI] [PMC free article] [PubMed] [Google Scholar]
- 33.Sebastian M, Aravind A, Mathew B. Green silver-nanoparticle-based dual sensor for toxic Hg(II) ions. Nanotechnology. 2018;29:355502. doi: 10.1088/1361-6528/aacb9a. [DOI] [PubMed] [Google Scholar]
- 34.Serunting MA, Maryana OFT, Syafitri E, Balqis S, Windiastuti E. Green synthesis silver nanoparticles (AgNPs) using lamtoro pods extract (Leucaena leucocephala) and their potential for mercury ion detection. Evergreen. 2021;8:63–68. doi: 10.5109/4372261. [DOI] [Google Scholar]
- 35.Suhandy D, Yulia M. Classification of Lampung robusta specialty coffee according to differences in cherry processing methods using UV spectroscopy and chemometrics. Agriculture. 2021;11:109. doi: 10.3390/agriculture11020109. [DOI] [Google Scholar]
- 36.Sulistyarti H, Wijaya MM, Setyowati D, Sutrisno S, Sulistyo E. Simple and rapid device for mercury detection based on the formation of Mercury(II)-Dithizonate on polytetrafluoroethylene (PTFE) membrane. J. Pure App. Chem. Res. 2019;8:185–196. doi: 10.21776/ub.jpacr.2019.008.02.473. [DOI] [Google Scholar]
- 37.Wang M, Zhang W, Zheng X, Zhu P. Antibacterial and catalytic activities of biosynthesized silver nanoparticles prepared by using an aqueous extract of green coffee bean as a reducing agent. RSC Adv. 2017;7:12144–12149. doi: 10.1039/C6RA27706C. [DOI] [Google Scholar]
- 38.Zahoor M, Nazir N, Iftikhar M, Naz S, Zekker I, Burlakovs J, Uddin F, Kamran AW, Kallistova A, Pimenov N, Ali Khan F. A review on silver nanoparticles: classification, various methods of synthesis, and their potential roles in biomedical applications and water treatment. Water. 2021;13:2216. doi: 10.3390/w13162216. [DOI] [Google Scholar]
- 39.Zhao Y, Zheng J, Fang L, Lin Q, Wu Y, Xue Z, Fu F. Speciation analysis of mercury in natural water and fish samples by using capillary electrophoresis–inductively coupled plasma mass spectrometry. Talanta. 2012;89:280–285. doi: 10.1016/j.talanta.2011.12.029. [DOI] [PubMed] [Google Scholar]