Abstract
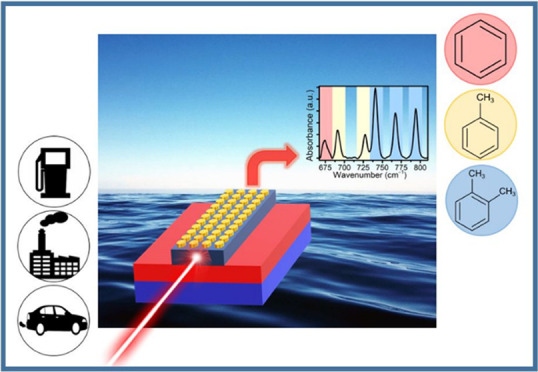
Priority substances likely to pollute water can be characterized by mid-infrared spectroscopy based on their specific absorption spectral signature. In this work, the detection of volatile aromatic molecules in the aqueous phase by evanescent-wave spectroscopy has been optimized to improve the detection efficiency of future in situ optical sensors based on chalcogenide waveguides. To this end, a hydrophobic polymer was deposited on the surface of a zinc selenide prism using drop and spin-coating methods. To ensure that the water absorption bands will be properly attenuated for the selenide waveguides, two polymers were selected and compared: polyisobutylene and ethylene/propylene copolymer coating. The system was tested with benzene, toluene, and ortho-, meta-, and para-xylenes at concentrations ranging from 10 ppb to 40 ppm, and the measured detection limit was determined to be equal to 250 ppb under these analytical conditions using ATR-FTIR. The polyisobutylene membrane is promising for pollutant detection in real waters due to the reproducibility of its deposition on selenide materials, the ease of regeneration, the short response time, and the low ppb detection limit, which could be achieved with the infrared photonic microsensor based on chalcogenide materials. To improve the sensitivity of future infrared microsensors, the use of metallic nanostructures on the surface of chalcogenide waveguides appears to be a relevant way, thanks to the plasmon resonance phenomena. Thus, in addition to preliminary surface-enhanced infrared absorption tests using these materials and a functionalization via a self-assembled monolayer of 4-nitrothiophenol, heterostructures combining gold nanoparticles/chalcogenide waveguides have been successfully fabricated with the aim of proposing a SEIRA microsensor device.
Introduction
For several years, environmental problems caused by population and industrialization growth have been at the heart of the news. In particular, ocean pollution is one of the most important challenges. It is common knowledge that a huge amount of plastics is present in the oceans. However, plastics are not the only pollutants present in natural water, and even more invisible, other molecules of concern for the health of ecosystems and humans must be carefully monitored. In addition to industrial pollution with the discharge of chemical products from factories, such as hydrocarbons or persistent organic pollutants (POPs), environmental organizations have highlighted an important source of water pollution generated by shipping and off-shore oil and gas operations contamination.1,2 These various origins of pollution require the implementation of different control and remediation strategies depending on the nature of the products spilled and the characteristics of the affected environments. The quality of the world’s waters, whether groundwater, surface water, or seawater, is affected by these priority substances (PSs). Many molecules must therefore be monitored frequently to control water quality. They constitute a real threat to the environment and human health according to the European Union Directive 2013/39/EU and the Watch List of Decision 2015/495/EU with concentrations ranging from a few ng/L to a few hundred mg/L in the case of accidental pollution on site. In this work, we were interested in benzene, toluene, and ortho-, meta-, and para-xylenes (BTXs). Indeed, the BTX group presents a strong point of environmental vigilance because of its mobility and toxicity. Exposure to BTX, even at low concentrations, can cause damage to the nervous system. They act as depressants and can cause drowsiness, dizziness, fatigue, and even death. They can also cause respiratory, genetic, and cardiac damage, as well as damage to the excretory system.3 BTXs share some acute effects but differ significantly in chronic toxicity. These are the reasons why their sensitive detection is the current aim of several research groups.4−7
Currently, most of the monitoring is carried out in the laboratory after water sampling. Detection of diluted BTXs in water, which are often referred to as volatile organic compounds (VOCs), with a high vapor pressure and low water solubility, is usually performed using gas chromatography-mass spectrometry (GC-MS) analysis or high-pressure liquid chromatography (HPLC).8,9 Although the methods used are reliable and sensitive, they are time-consuming, the equipment is expensive, and there is always a risk of degradation and/or contamination of the samples during collection and storage. To carry out these mandatory monitoring measurements, the development of technological tools allowing rapid in situ measurements appears necessary.
Indeed, there is a growing demand for portable monitoring systems with high stability, high sensitivity, wide detection range, and short response times.10−16 A number of chemical sensors are commercially available for field measurements (e.g., portable gas chromatographs, surface acoustic wave sensors, optical instruments).13,16−18 However, in situ chemical sensors suitable for contaminant-monitoring applications are still lacking due to cost, multiple detection failures, actual portability, and/or reliability for long-term detection in a complex aquatic environment.8,19 Infrared spectroscopy is a powerful tool: a simple, reliable, fast, cost-efficient, and nondestructive method for detecting and determining the composition of complex samples.13 Due to the intrinsic characteristics of optical sensors, the evanescent field is sensitive to the changes induced by the analyte on the sensor surface such as scattering, fluorescence, and notably absorption. Indeed, evanescent field spectroscopy using infrared absorption is a versatile and nondestructive analysis technique, and pretreatment steps of samples are not required (Figure 1).13 It is commonly used for the detection of organic molecules due to the presence of fundamental vibrational transitions of these molecules in the mid-infrared spectral range (2.5–25 μm).10,14,20
Figure 1.
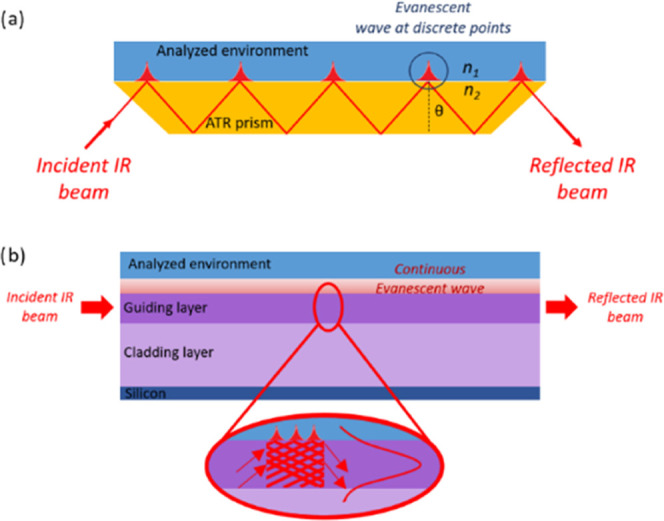
Schematic of light propagation in (a) an ATR crystal and (b) an optical waveguide.
The laser beam is totally internally reflected at both sides of the waveguide if the incident light beam is at an angle of incidence θi larger than the critical angle θc. This means that the refractive index of the waveguide n1 has to be superior to the refractive index of the surrounding medium n2, as defined by the law of Snell–Descartes 1
| 1 |
| 2 |
The evanescent field has a penetration depth (d) that depends on the angle of incidence and the refractive index of the selenide waveguide or selenide prism n1 and the polymer layer n2 (2), while the intensity of the evanescent field inside the polymer layer follows a decreasing exponential law. The probed thickness of the surrounding medium is of the order of a few hundred nanometers to a few micrometers. If the thickness of the waveguide used is of the same order as the infrared wavelength, then the individual reflections allowed in the ATR prism are no longer distinguishable from each other and the evanescent field appears continuously along the surface of the waveguide during the propagation of the infrared light within it (Figure 1).21−23 Due to their wide transparency in the infrared range and their tailored refractive index, chalcogenide glasses are attractive materials for mid-infrared (MIR) sensing applications.24,25 The feasibility of fabricating chalcogenide waveguides for MIR detection of organic molecules in water has been reported previously.26−28 The surface of the chalcogenide waveguide needs to be coated with a hydrophobic film to avoid the large absorption bands of water present in the MIR range, which interfere with the specific absorption features of the analyzed molecules. Although different materials can be used to functionalize a surface, it has been shown that polymers are the most suitable for the detection of hydrocarbons.29 Functionalization is achieved by coating the polymer on the surface of the transducer to capture the analytes through specific affinity interactions. Several studies have been conducted on different polymers.30−33 According to the literature, two polymers were expected to be suitable for the functionalization of chalcogenide-based IR sensors: polyisobutylene (PIB) and the ethylene-propylene copolymer (EP-co). Indeed, the polymer should not show IR absorption bands in the characteristic regions of the molecules to be analyzed. It should be mechanically robust, insoluble in aqueous media, and resistant to organic compounds. It is also necessary that the time constant of the enrichment process does not exceed a certain limit to obtain short response times. The polymer must also be easy to prepare, must not react with the components being analyzed, and must have good adhesion to a selenide-based surface. It has been reported that polymers with low density, low glass-transition temperature, and amorphous structure appear to be the most efficient for hydrocarbon extraction. The most suitable polymers are those with a high partition coefficient, indicating the difference in solubility of the compound between two phases. This coefficient is significant from a thermodynamic point of view of the preconcentration of the molecules. However, it does not reveal the kinetics influencing the response time of the sensor, which is rather associated with the diffusion coefficient of the hydrocarbons in the polymer. The crystallinity, glass-transition temperature, or density of the polymer will have a pronounced effect on the speed of the diffusion process. Thus, for the detection of BTX pollutants using a selenide-based transducer, we will exploit their chemical properties and their interaction with the polymer layers, which will thus be brought into intimate contact with the chalcogenide waveguide and its evanescent infrared wave. The functionalization of chalcogenide planar waveguides by PIB, tested for BTX,21 needs to be further investigated to be definitively transferred to the final IR microsensor. In particular, it is essential to determine the limit of detection (LOD) in the case of the ATR-FTIR spectrometer to confirm a theoretical LOD of the IR microsensor, to estimate precisely the analysis time, and, above all, to check the repeatability of the cycle and its regeneration. It also seemed important to compare the PIB to another promising copolymer EP-co, which could replace PIB in the final device for reasons of postprocess compatibility in microfluidics. To easily transfer the polymer coating process without encountering any particular difficulty when switching to selenide waveguides, a selenide ATR prism is chosen to perform detection measurements by evanescent-wave spectroscopy via ATR-FTIR spectroscopy.
The detection sensitivity is limited when using conventional infrared absorption detection. For example, by FTIR-ATR spectrometry or evanescent-wave spectroscopy via IR fiber (FEWS), an LOD in the range of 60–339 μg/L has been demonstrated for toluene in an aqueous medium.10,15 This LOD can be improved using an IR microsensor with an optimized evanescent field; a theoretical study shows that the detection threshold of toluene dissolved in water will reach a value equal to 26 μg/L at λ = 6.66 μm.22,23 The use of plasmon resonance to increase the sensitivity of the IR microsensor has not yet been studied despite the interest that can represent the improvement of IR absorption to reduce the duration of interaction necessary between the analyte and the light beam. When noble metal nanoparticles are illuminated with appropriate light, localized plasmons are generated within the particles.34 The electric field around the particles is then stronger than the incident field. The absorption of light being proportional to the square of the electric field is then reinforced, and this phenomenon is called surface-enhanced IR absorption (SEIRA). Developments in microfluidic infrared detection involving a SEIRA effect are promising approaches for studying liquids with low analyte concentrations,13,35 as illustrated by Figure 2.
Figure 2.

Various stages of detection and regeneration using chalcogenide (Chg) waveguides for the propagation of the evanescent IR wave whose sensitivity is increased by the presence of gold nanoantennas (NAs) for IR absorption enhancement and a hydrophobic polymer freeing from detrimental water absorption (Step 1: SEIRA IR sensor in contact with complex water; Step 2: hydrocarbon detection by the SEIRA IR sensor; Step 3: regeneration of the hydrophobic polymer).
Nanostructured SEIRA interfaces for these microfluidic chips are needed to give the possibility to improve the LOD by an IR absorption enhancement effect.34,36 The specific chemical affinity of chalcogenide with gold may be a key point to develop an integrated chalcogenide optofluidic platform with quantum cascade laser sources for exalted IR spectroscopy.37−40
The optical design and fabrication of the chalcogenide waveguide proposed as the IR transducer were previously described.22,23,26,41 Single-mode selenide ridge waveguides fabricated by RF sputtering and reactive ion etching coupled with an inductive conductive plasma process were thus designed according to the dimensions previously obtained by simulation. Light injection and confinement experiments were performed and optical losses were determined at 7.7 μm. The study of the coupling between the mid-IR evanescent wave from the chalcogenide waveguide and the gold nanostructure allowing the SEIRA effect has been previously demonstrated theoretically.42
Here, we will present the last achievements involving the functionalization of chalcogenide waveguides used as IR transducers. The aim of this study was to optimize the functionalization of a selenide surface waveguide to improve the sensitivity of future MIR chalcogenide sensors dedicated to the in situ detection of organic molecules by means of a hydrophobic polymer membrane and a SEIRA effect (Figure 2).
Experimental Methods
Polymer Coating Functionalization
The PIB was purchased from Sigma-Aldrich, while EP-co (60:40) was purchased from Boc Science.
The polymers were dissolved in a xylene mixture (≥98.5%) by the reflux heating method. Heating of the solution was carried out under stirring by means of a magnetic rod and a magnetic stirrer. Solutions of 10% w/v for PIB and around 2.3% w/v for EP-co were obtained. Trapezoidal ZnSe prisms from PIKE Technologies (Madison, WI) were used as MIR-transparent multireflection waveguides. They were 80 mm long, 10 mm wide, and 4 mm high, and the angle of incidence was 45°. The PIB was deposited on the top surface of ZnSe prisms by spin-coating (WS-400B-6NPP-Lite Spin Processor, Laurell Technologies, North Wales, PA), while the EP-co was deposited by drop-coating.
The appropriate polymer thickness was estimated according to the penetration depth dp of the evanescent field that emanates from the ZnSe prism 3.43
| 3 |
where λ is the wavelength of the incident light, n1 and n2 are the refractive indices of the waveguide (i.e., ZnSe) and the superstrate (i.e., polymer), respectively, and θi is the angle of incidence. It was previously shown that polymer thickness should be roughly three times the penetration depth to ensure high detection sensitivity and short response times.30,44 In this configuration, the appropriate hydrophobic polymer thickness should be around 4 μm. The polymer thickness was calculated using a gravimetric technique 4(45)
| 4 |
where t is the thickness of the deposited polymer film, m is the film mass, d is the polymer density, and A the coated surface area.
BTX and 4-Nitrothiophenol (4-NTP) Solution Preparation
Benzene (≥99.0%), toluene (≥99.5%), and ortho-(≥99.0%), meta-(≥99.5%), and para-xylenes (≥99.5%) were purchased from Sigma-Aldrich. Compounds were diluted in methanol at 50,000 mg/L each to obtain benzene, toluene, and the three xylenes’ stock solutions. Aqueous solutions in concentrations ranging from 10 weight ppb to 40 weight ppm (10, 25, 50, 100, 250, 500 ppb, 1, 5, 10, 20, and 40 ppm) were prepared by diluting appropriate volumes of the stock solutions in Milli-Q water under stirring. A solution of 4-nitrothiophenol of concentration 10–5 mol·L–1 was prepared.
Instrumentation and Data Processing
A Nicolet 6700 spectrometer equipped with a horizontal ATR accessory (Pike Technologies), a ZnSe prism, and a fluid flow cell were used to perform Fourier transform infrared measurements. Aqueous solutions containing BTX molecules were directed onto the functional surface of the ZnSe prism using a peristaltic pump at a flow rate of approximately 3 mL/min. The measurement data were recorded in the spectral range 400–4000 cm–1 using a spectral resolution of 4 cm–1. To avoid loss of hydrocarbons by evaporation, all solutions were freshly prepared and contained in quasi-hermetically sealed glass bottles before and during the measurements. The characteristic bands for BTX determination are 674 cm–1 for benzene, 692 and 727 cm–1 for toluene, and 741, 767, and 794 cm–1 for ortho-, meta-, and para-xylenes, respectively. The same spectrometer was used to perform transmission measurements in order to assess the advantages of SEIRA. The gold-coated planar waveguide was immersed into a solution of 4-NTP and dried on air, and then, its transmission was measured.
SEIRA Interface Fabrication and Enhancement Factor Calculations
Gold microstructures were fabricated using the laser interference lithography (LIL) technique with a two-layer resin followed by a lift-off. The gold microstructures were prepared on a chalcogenide planar waveguide deposited on a silicon substrate. The planar waveguide consists of a cladding layer of composition Ge31Sb6Se63 (named Se2) and a guiding layer of composition Ge19Sb17Se64 (named Se4), allowing MIR light propagation. Fabricated gold micro- and submicrometer structures were dots with a typical diameter of 1.4 μm and ellipses with dimensions of about 1.4 μm for the major axis and 0.9 μm for the minor axis. As for submicrometer ellipses, dimensions are 0.85 and 0.62 μm for the major and minor axes, respectively. After fabrication of the gold structures on the chalcogenide planar waveguide by the LIL technique, ridge waveguides of different widths were then fabricated using a classical i-line photolithographic process (MJB4 Suss Microtech mask aligner) followed by a two-step dry etching procedure using Ar (Corial 200IL) first to remove the gold structures from the unwanted area and then a dry etching procedure at low pressure combining reactive ion etching (RIE) and inductively coupled plasma (ICP) etching (5 sccm CHF3, 5 mTorr, 75 W ICP, 25 W RF) to etch the chalcogenide guiding layer.
Several methods exist to estimate the value of the enhancement factor. For this purpose, we compared the transmission results obtained with 4-NTP on gold nanoparticles and on KBr pellets. Thus, for the estimation of the enhancement coefficient from these experiments, the following equation was used (5).
| 5 |
According to the Beer–Lambert law, any monochromatic radiation passing through a sample of thickness l at a fixed wavelength satisfies the following equation (eq 6)
| 6 |
where A is the absorbance, ε is the molar absorption coefficient, l is the length of the sample through which the light beam passes, and C is the concentration of the absorbing element in the sample.
Therefore, the absorption of the SEIRA spectrum can be expressed as follows 7
| 7 |
where n is the number of analyzed moles, S is the irradiated surface, and Cs is the surface concentration, which is 3.106 mol/μm2 in the case of the self-assembled monolayer of 4-NTP.46
KBr pellets containing different concentrations of 4-NTP were thus synthesized to determine ε. Indeed, the slope of the A = f(C) curve gives us the value of εl and l, which is the thickness of the pellet, and can be calculated using the following formula (formula 8)
| 8 |
where m and ρ are the mass and the density of KBr (4-NTP neglected), respectively, and d is the diameter of the pellet.
Results and Discussion
The various stages of BTX detection and regeneration using chalcogenide waveguides for the propagation of the evanescent IR wave are presented in this study (Figure 2). The objective is to increase the detection sensitivity of the selenide-based transducer. Two ways are explored and tested. The first is the functionalization by a hydrophobic polymer of the surface of the transducer in selenide, allowing one to overcome the detrimental absorption of water, limiting the sensitivity of detection. The second way of improving the sensitivity is studied by considering the presence of a gold nanostructure for IR absorption enhancement. The possibility of depositing a hydrophobic film on a chalcogenide waveguide has been previously demonstrated.21 However, it remains to optimize the nature of the polymer envisaged as well as its deposition to determine the limit of detection of individual BTXs, to discuss the competitivity of different polluting molecules and to confirm its regeneration in an easy way. The coupling of these two types of functionalization to increase the sensitivity is possible insofar as the feasibility of the fabrication of nanoantennas on a chalcogenide waveguide is demonstrated. These different aspects are approached and discussed to tend toward the manufacture of IR chalcogenide sensors of high sensitivity and selectivity.
Detection of Aromatic Hydrocarbons by Means of Polymer Functionalization of the Selenide IR Transducer
Comparison between PIB and EP-co Membrane
In this study, we started by comparing the results obtained with a PIB film with those obtained with an E/Pco film to determine which of these two polymers allowed optimal detection. To obtain a polymer film about 5 μm thick, PIB was coated on the top surface of the ZnSe prism using a rotation speed of 500 rpm and then dried overnight at room temperature under a fume hood. The viscosity of the EP-co solution was too low to obtain a film of about 5 μm on the surface of the ZnSe prism by spin-coating. Using the drop-coating method, an EP-co film with a thickness of about 5 μm was also successfully obtained on the top surface of a ZnSe prism. However, as shown in Figure 3, the surface appearance of the EP-co film obtained by drop-coating is less smooth than the spin-coated film obtained in the case of the PIB polymer membrane.
Figure 3.
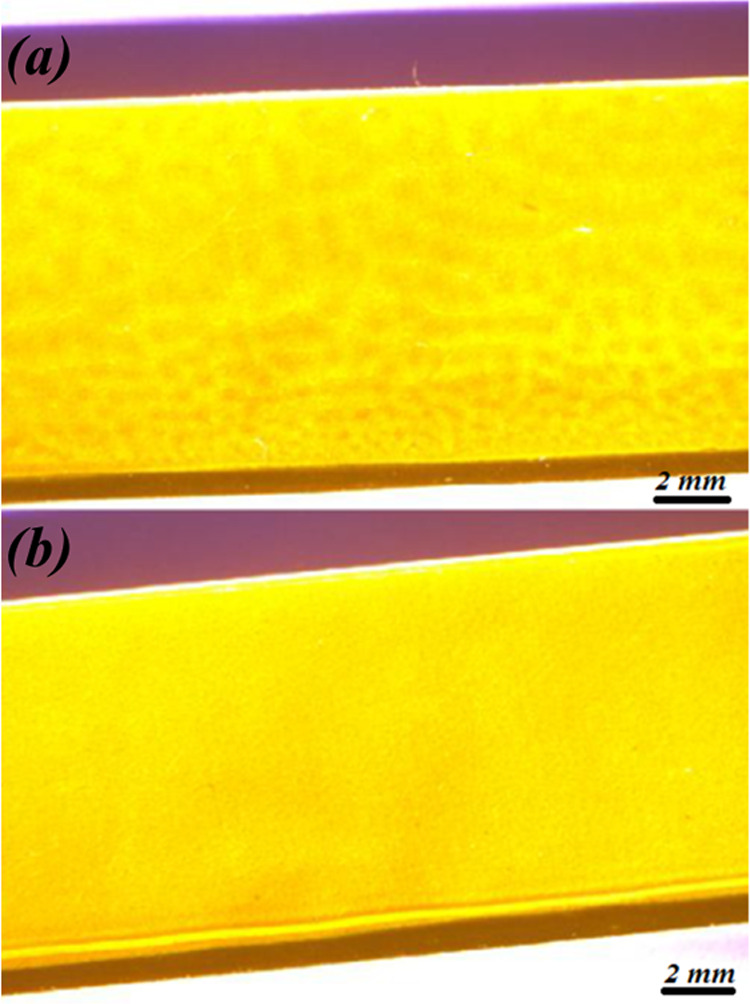
Microscopic images of the selenide prism top surface (yellow part) coated with the EP-co polymer deposited by drop-coating (a) and the PIB polymer deposited by spin-coating (b).
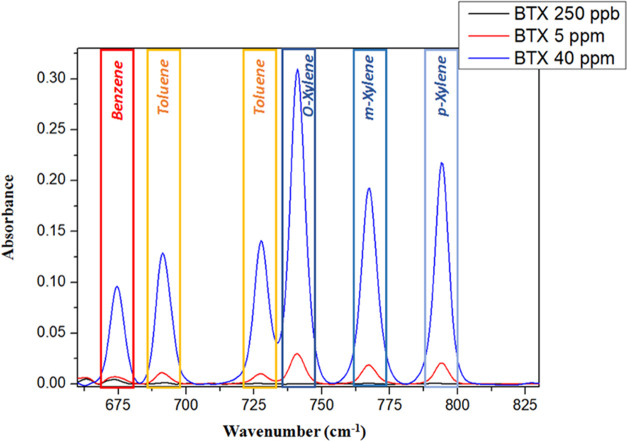
Then, a solution containing BTXs at 5 ppm was studied using a ZnSe prism covered by the PIB film or the EP-co film. Figure 4 shows the absorption peaks obtained after the solution containing BTXs was circulated for 90 min. Detection was slightly less efficient with the EP-co polymer membrane compared to that with the PIB. The fact that only the peak at 727 cm–1 has a higher intensity with EP-co compared to PIB can be explained by absorption of the polymer itself. Indeed, the EP-co has an intrinsic absorption peak at about 720 cm–1, which, if it does not completely overlap with the one of the BTX peaks, will nevertheless disrupt the measurement of the peak at 727 cm–1 by adding an additional contribution. The spectra are therefore corrected for the intrinsic polymer absorption bands using the water spectrum as a reference.
Figure 4.
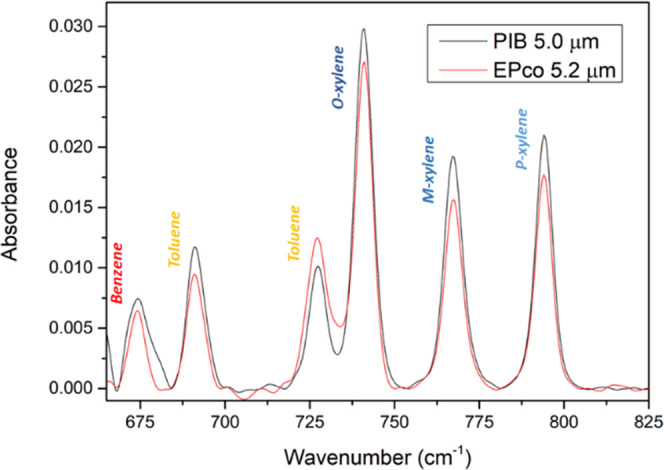
MIR-ATR absorption spectra of the BTX obtained with ZnSe prisms coated with 5.0 μm PIB (in black) and 5.2 μm EP-co (in red).
Figure 5 shows the enrichment curves of the BTX mixture at a concentration of 5 ppm using a prism covered with PIB and EP-co films about 5 μm thick each.
Figure 5.
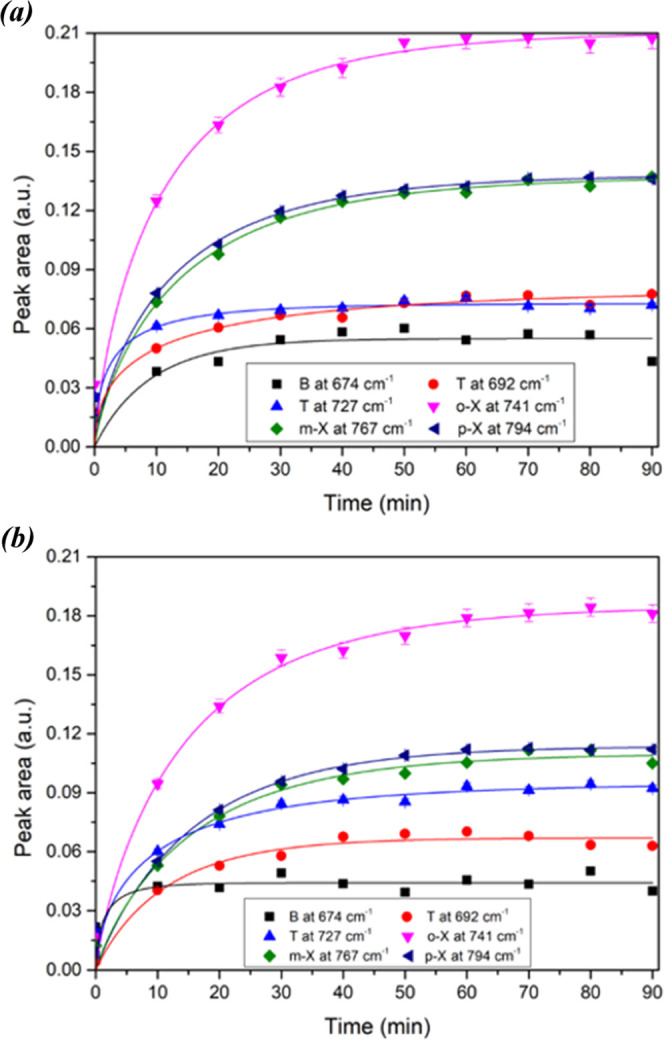
Enrichment curves for the BTX mixture at a 5 ppm concentration using a prism covered with PIB (a) and EP-co (b) films.
The BTX diffusion is fast and BTXs were detected as soon as the solution was in contact with the polymer coating (t = 0 min). Enrichment by the polymer corresponds to the pollutant molecules extracted from the water that diffuse through the hydrophobic polymer, i.e., the quantity of hydrocarbons in the PIB or the EP-co. After 50 minutes of enrichment, there was a plateau for each monoaromatic hydrocarbon. This plateau can mean that the diffusion process reaches an equilibrium between the incoming and outgoing molecules, i.e., an equilibrium between the molecules in solution and the free sites in the polymer coating. Thus, benzene reached the plateau after 10–20 min of enrichment, toluene after 20–30 min, followed by xylenes after 40–50 min.
The response rate is directly related to the diffusion coefficient, which depends on molecule size.30 Therefore, the response was nearly instantaneous for benzene, toluene, and xylenes, which are all small molecules. Moreover, smaller compounds (i.e., benzene) appeared to diffuse faster and therefore reached the plateau first. It can be noticed that the peak area of ortho-xylene was higher than those of meta- and para-xylenes.
For concentrations from 40 ppm to 250 ppb (Figure 6), BTXs were simultaneously and quickly detected. Spin-coating deposition of the polymer leads to a better control of thickness and homogeneity of the hydrophobic coating, putatively leading to faster diffusion and therefore faster equilibrium times. In conclusion, the limit of BTX detection obtained on a PIB-coated ZnSe crystal was experimentally measured at 250 ppb. These results are comparable to those of other infrared evanescent field sensors for detection of volatile organic compounds in an aquatic environment in the literature.47
Figure 6.
MIR-ATR absorption spectra of the BTX mixture at 250 ppb, 5 ppm, and 40 ppm after an enrichment times of 90 min with PIB of 5 μm.
To conclude, the measurement analysis determined that PIB was better suited considering the sensitivity for BTX detection than EP-co. In addition to its higher sensitivity, its deposition is also more homogeneous and is more easily achieved since its adjustable viscosity in xylene allows deposition by spin-coating. On the other hand, the EP-co has an absorption peak around 720 cm–1, which induces additional data processing and greater uncertainty in the detection of the peak at 727 cm–1 (toluene). However, the adhesion of EP-co on selenide materials is confirmed, which allows an easy functionalization of a chalcogenide platform. Moreover, the EP-co allows BTX detection in aqueous media and could be a good candidate for surface functionalization of chalcogenide sensors dedicated to the detection of other pollutant organic molecules such as chlorinated hydrocarbons.45
Subsequently, all of the results presented thereafter were obtained using a prism covered with a PIB film about 5 μm thick.
Detection Linearity versus Concentration of the PIB Polymer
The peak area increased with the concentration of BTXs; as shown in Figure 7, the response is linear (correlation coefficient greater than 0.99 for all of the BTXs) in the range from 1 to 20 ppm as expected by the Beer–Lambert law. The PIB response is generally linear over the 0–80 ppm concentration range.44,48
Figure 7.
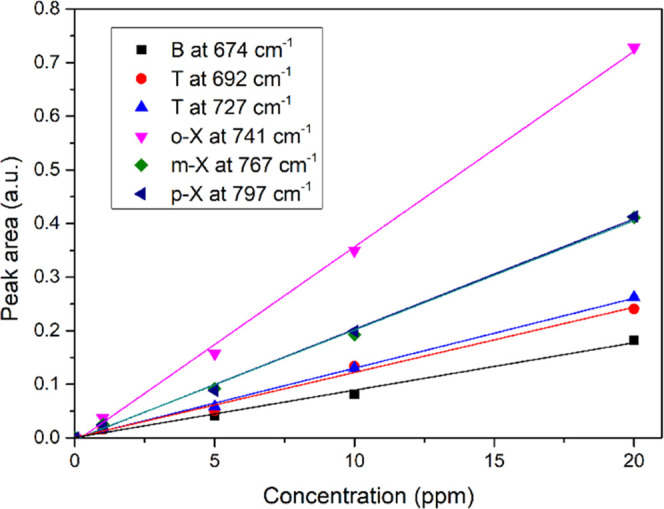
Peak areas of BTXs as a function of concentration after 90 min of enrichment.
As the response is linear in the used concentration range, one can determine the LOD for each pollutant molecule. Thus, LODs of 250, 235, 170, 162, and 110 ppb were obtained for benzene, toluene, p-xylene, m-xylene, and o-xylene, respectively.
Regeneration of PIB Membrane
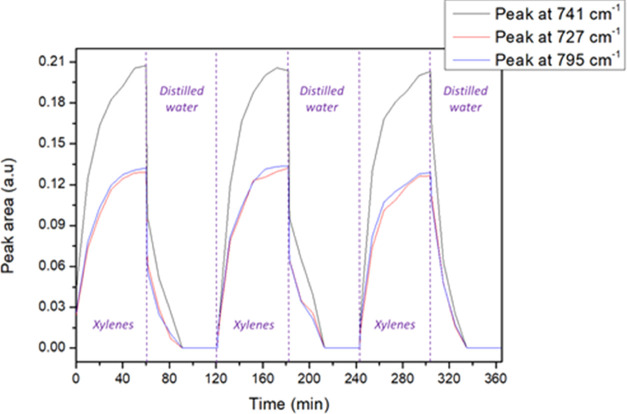
The hydrophobic PIB coating appears to be promising for the detection of monoaromatic hydrocarbons; however, it has to be regenerated. To develop a reusable microsensor, it is necessary to remove all molecules from the sensing surface. Figure 8 shows the MIR-ATR spectra of a three-xylene mixture at 5 ppm of each compound after 60 min of enrichment following a 60 min rinse with distilled water. This molecule concentration was chosen because it allowed the absorption peaks to be observed very distinctly without using a high quantity of harmful analytes. This rinse step leads to a total regeneration of the PIB coating ready for use to detect pollutants using the same ZnSe ATR prism in less than 40 min.
Figure 8.
MIR-ATR absorption spectra of xylenes (ortho-, meta-, and para-xylenes) obtained after the circulation of solutions at 5 ppm and distilled water both during 60 min.
The curves are not shown here, but the same experiment was conducted with benzene and toluene separately. The results were similar; the regeneration times obtained were even slightly shorter due to the fact that benzene and toluene molecules are smaller in size than xylene ones.
Competitive Absorption Studies
Competitive absorption studies of different polluting molecules were also conducted. First, a solution containing one type of pollutant only (benzene, toluene, or the three isomers of xylene) was used. Then, a solution containing the first type of molecules plus another one was used with the same PIB-coated ZnSe prism. The third investigated solution was a solution of benzene, toluene, and the three isomers of xylene together. The pollutant concentrations were the same, i.e., 5 ppm for each molecule.
It can be seen in Figure 9 that the area of the toluene peak at 727 cm–1 is almost constant during the experiment. The toluene peak area at 692 cm–1 increases with the addition of xylenes. This is due to the overlap of this peak with the 690 cm–1 meta-xylene peak. Finally, the obtained absorption peak areas are pretty much the same as those obtained when all of the pollutant molecules are inserted at the same time.
Figure 9.
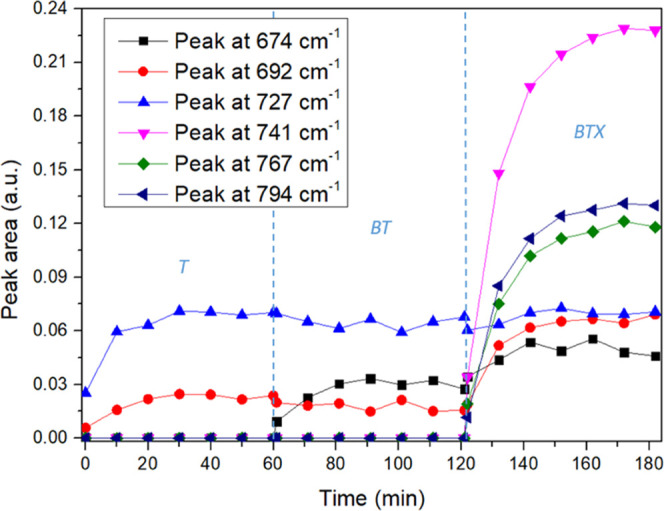
ATR measurements with alternatively a toluene (T) solution, a benzene and toluene (BT) solution, and a solution with benzene, toluene, and xylenes (BTX) at 5 ppm each.
The measurements were also carried out by changing the order of introduction of the BTX molecules. These experiments do not reveal any significant competition between these different volatile hydrocarbon molecules. Indeed, the peaks are not impacted by the addition of other molecules, and the peak areas corresponding to the first molecules introduced are almost constant during the experiment, whatever the order of introduction of the molecules.
Detection of BTX in Seawater
Studies were carried out to ensure that the constituents of salt matrices did not interfere with the detection of the molecules nor with the regeneration of the polymer. ATR measurements were carried out with a 5 ppm solution of BTX in seawater followed by a rinse with a distilled water (Figure 10). The results are in agreement with a previous study performed in complex matrices such as seawater and groundwater.21
Figure 10.
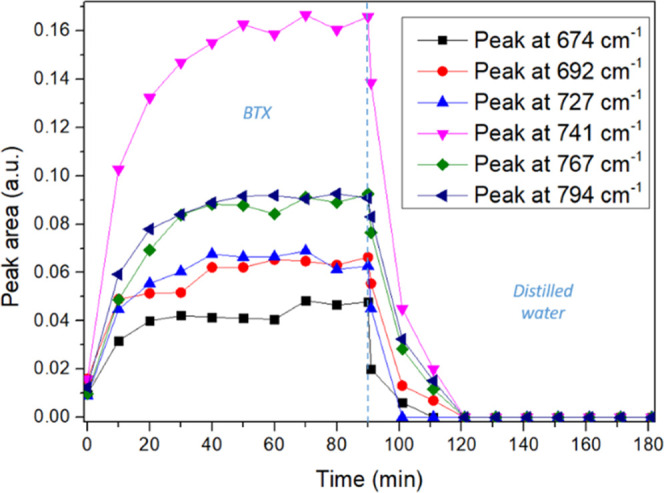
ATR measurements with alternatively a 5 ppm BTX in seawater solution and a distilled water.
Although rarely studied, a major aspect enabling selenide sensor development is the possibility of regenerating the polymer for such complex matrices. The PIB polymer regeneration after immersion in complex natural matrices is achieved without particular difficulty in about 30 min.
Functionalization of the Selenide IR Transducer by Gold Nanostructures for SEIRA Effect
However, the detection limit currently reached using the polymer membrane by ATR-FTIR (BTX LOD range: 300–50 ppb) is still too high if it is to be used not as a warning sensor but as a real-time measurement for lower concentrations. Thus, the sensitivity of future sensors must be improved using an IR integrated platform to decrease the LOD in the range of 50–10 ppb. If we want to gain further in the detection limit because some optical sensors must be able to detect BTX concentrations on the order of a few ppb, it is then time to look for a new technological breakthrough.
Previous studies showed that chalcogenide glasses are efficient substrates for carrying out SEIRA experiments. Indeed, gold nanoparticles and gold nanoantennas were deposited on chalcogenide glasses (Ge25Sb10Se65 and As2S3) by direct current sputtering and electron-beam lithography, respectively. These heterostructures have resulted in an enhancement factor for the detection of the NO2 symmetric stretching vibration band of 4-NTP at 1336 cm–1 of about 24 (nanoparticles) and nearly 106 (nanoantennas).37−39
Nanostructure Fabrication on a Selenide Surface
The approach developed for this study consisted in fabricating the nanostructures before transferring the waveguide, allowing it to work on flat chalcogenide substrates. This approach made possible the use of photolithography techniques and in particular LIL technique, which, combined with the lift-off technique, allowed for obtaining structures of high reproducibility and well controlled dimensions. To date, while LIL is large-scale compatible, it has been for a while until 201449 seldom used for plasmonic structure fabrication.50 The structures were also modeled and characterized after fabrication, and in a free field, a network effect or coupling between particles is rather observed. The quality of the structures is attested by the homogeneity of the diffraction at the edge of the structures (Figure 11).
Figure 11.
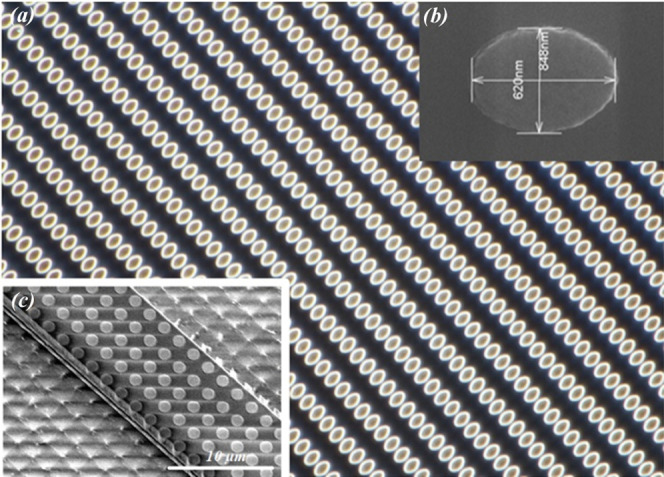
Holographic ellipses and integrated dots. Background image in the dark field of an array of micron gold ellipses resonating at 7 μm (a). Example and submicron ellipses achievable by LIL and the lift-off technique (b). Integrated holographic dots on a chalcogenide waveguide (c).
SEIRA Effect of Heterostructure Selenide Planar Waveguide
To assess SEIRA benefits on prepared selenide planar waveguide, we used a self-assembled monolayer of 4-NTP randomly oriented with the strongest absorption bands located at 1336 and 1512 cm–1 assigned to NO2 symmetric and antisymmetric stretching modes, respectively. Figure 12 shows that 4-NTP was detected with a substrate coated with gold, which was not the case with the bare substrate. An exaltation factor of around 150 could be observed. The results obtained in our study are comparable to those obtained with As2S3 bulk glass.39
Figure 12.
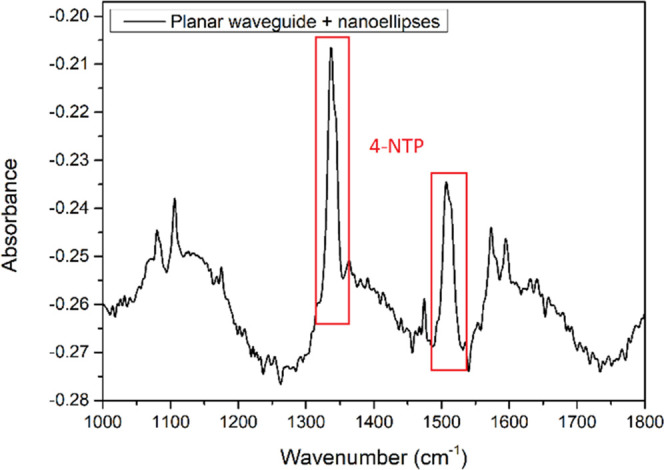
Absorbance spectra of 4-NTP on a chalcogenide waveguide coated by gold nanoparticle substrates.
Described results are promising for the possible improvement of the sensitivity of the future sensor. Nevertheless, it has to be noted that the results were obtained by infrared spectroscopy on a planar waveguide.
SEIRA Chalcogenide Sensor Manufacturing
To realize the SEIRA chalcogenide sensors, a theoretical study was performed to design single-mode structures in the MIR and to optimize the evanescent part of the waveguide modes.42,51 Indeed, the 3D model described the section of the waveguide before the region containing the transducers (i.e., metallic particles arranged on the surface of the waveguide for mid-infrared detection), the transducer region itself, and the downstream part of the selenide waveguide. To fabricate depicted SEIRA integrated sensor, the gold nanoplots deposited by LIL on the surface of the planar chalcogenide guides were locally etched with argon plasma. The riblike waveguides were then fabricated by photolithography and dry etching with CHF3 plasma (Figure 13). The dimensions of the selenide waveguides were fixed (height h = 2.2 μm, width w = 14 μm for a wavelength of 7.7 μm) with an array of gold microdots of 1.5 μm diameter with a periodicity of 2 μm.
Figure 13.
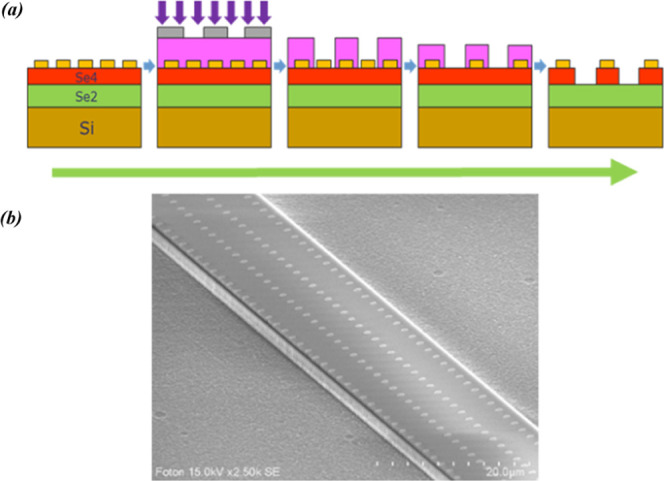
Main steps of the technological procedure for the fabrication of SEIRA integrated selenide waveguides: (1) deposition of gold nanostructure; (2) photolithography; (3) development of the resin; (4) etching of the gold nanostructure; (5) fabrication of the rib waveguides by local etching of the chalcogenide guiding layer (a); SEM image of the SEIRA interface on selenide Se4/Se2 rib waveguides (b).
Since the etching of planar waveguides coated with gold nanostructures has been successfully performed, detection measurements using etched and functionalized waveguides should be performed in the near future.
Conclusions
In this study, it was shown that PIB was more suitable (sensitivity, spin-coating deposition) than EP-co for the functionalization of a selenide transducer surface, allowing detection of BTXs in water. LODs of 250, 235, 170, 162, and 110 ppb were determined for benzene, toluene, p-xylene, m-xylene, and o-xylene, respectively. The ease of regeneration of the polymer coating, even in the case of seawater, has also been confirmed. Finally, in addition to the interest in BTX detection and regeneration demonstrated by polymer functionalization of an IR optical transducer, the SEIRA effect to gain sensitivity has been demonstrated on a chalcogenide waveguide coated with gold nanostructures. Gold nanoantennas with an appropriate ratio between the short and long axes deposited on a planar selenide waveguide achieved an enhancement factor of order 102.
Presented results will lead to the development of a chalcogenide-based optical microsensor device that can couple polymer or gold nanostructure functionalization for in situ monitoring of pollutants in natural waters offering high selectivity and enhanced sensitivity.
Acknowledgments
The authors would like to acknowledge the ANR LOUISE (ANR-15-CE04-0001-01) and ANR AQUAE (ANR-21-CE04-0011-04) projects of French National Research Agency (ANR) for financial support. They would like to thank the BRGM and the IFREMER for PhD funds. They would also like to thank 22-05179S project from the Czech Science Foundation (GAČR).
The authors declare no competing financial interest.
This paper was published ASAP on December 9, 2022, with the nineth author’s last name misspelled. The name was corrected, and the corrected version was reposted on December 12, 2022.
References
- Tornero V.; Hanke G. Chemical contaminants entering the marine environment from sea-based sources: A review with a focus on European seas. Mar. Pollut. Bull. 2016, 112, 17–38. 10.1016/j.marpolbul.2016.06.091. [DOI] [PubMed] [Google Scholar]
- Cunha I.; Moreira S.; Santos M. M. Review on hazardous and noxious substances (HNS) involved in marine spill incidents-An online database. J. Hazard. Mater. 2015, 285, 509–516. 10.1016/j.jhazmat.2014.11.005. [DOI] [PubMed] [Google Scholar]
- Rahmani M.; Kaykhaii M.; Ghasemi E.; Tahernejad M. Application of In-Syringe Dispersive Liquid-Liquid Microextraction and Narrow-Bore Tube Dispersive Liquid-Liquid Microextraction for the Determination of Trace Amounts of BTEX in Water Samples. J. Chromatogr. Sci. 2015, 53, 1210–1216. 10.1093/chromsci/bmu163. [DOI] [PubMed] [Google Scholar]
- El Mohajir A.; Castro-Gutierrez J.; Canevesi R. L. S.; Bezverkhyy I.; Weber G.; Bellat J. P.; Berger F.; Celzard A.; Fierro V.; Sanchez J. B. Novel Porous Carbon Material for the Detection of Traces of Volatile Organic Compounds in Indoor Air. ACS Appl. Mater. Interfaces 2021, 13, 40088–40097. 10.1021/acsami.1c10430. [DOI] [PubMed] [Google Scholar]
- Wang Z. L.; Liu K.; Chang X. M.; Qi Y. Y.; Shang C. D.; Liu T. H.; Liu J.; Ding L. P.; Fang Y. Highly Sensitive and Discriminative Detection of BTEX in the Vapor Phase: A Film-Based Fluorescent Approach. ACS Appl. Mater. Interfaces 2018, 10, 35647–35655. 10.1021/acsami.8b13747. [DOI] [PubMed] [Google Scholar]
- Shen Z.; Zhang X. D.; Ma X. H.; Mi R. N.; Chen Y.; Ruan S. P. The significant improvement for BTX (benzene, toluene and xylene) sensing performance based on Au-decorated hierarchical ZnO porous rose-like architectures. Sens. Actuator B-Chem. 2018, 262, 86–94. 10.1016/j.snb.2018.01.205. [DOI] [Google Scholar]
- Khan S.; Le Calve S.; Newport D. A review of optical interferometry techniques for VOC detection. Sens. Actuators, A 2020, 302, 111782 10.1016/j.sna.2019.111782. [DOI] [Google Scholar]
- Nightingale A. M.; Hassan S. U.; Warren B. M.; Makris K.; Evans G. W. H.; Papadopoulou E.; Coleman S.; Niu X. Z. A Droplet Microfluidic-Based Sensor for Simultaneous in Situ Monitoring of Nitrate and Nitrite in Natural Waters. Environ. Sci. Technol. 2019, 53, 9677–9685. 10.1021/acs.est.9b01032. [DOI] [PubMed] [Google Scholar]
- Gavrilescu M.; Demnerova K.; Aamand J.; Agathoss S.; Fava F. Emerging pollutants in the environment: present and future challenges in biomonitoring, ecological risks and bioremediation. New Biotechnol. 2015, 32, 147–156. 10.1016/j.nbt.2014.01.001. [DOI] [PubMed] [Google Scholar]
- Sieger M.; Haas J.; Jetter M.; Michler P.; Godejohann M.; Mizaikoff B. Mid-Infrared Spectroscopy Platform Based on GaAs/AIGaAs Thin-Film Waveguides and Quantum Cascade Lasers. Anal. Chem. 2016, 88, 2558–2562. 10.1021/acs.analchem.5b04144. [DOI] [PubMed] [Google Scholar]
- Pejcic B.; Eadington P.; Ross A. Environmental monitoring of hydrocarbons: A chemical sensor perspective. Environ. Sci. Technol. 2007, 41, 6333–6342. 10.1021/es0704535. [DOI] [PubMed] [Google Scholar]
- Kim S. S.; Young C.; Mizaikoff B. Miniaturized mid-infrared sensor technologies. Anal. Bioanal. Chem. 2008, 390, 231–237. 10.1007/s00216-007-1673-5. [DOI] [PubMed] [Google Scholar]
- Kratz C.; Furchner A.; Sun G. G.; Rappich J.; Hinrichs K. Sensing and structure analysis byin situIR spectroscopy: from mL flow cells to microfluidic applications. J. Phys.: Condes. Matter 2020, 32, 393002 10.1088/1361-648X/ab8523. [DOI] [PubMed] [Google Scholar]; Review.
- Mittal V.; Mashanovich G. Z.; Wilkinson J. S. Perspective on Thin Film Waveguides for on-Chip Mid-Infrared Spectroscopy of Liquid Biochemical Analytes. Anal. Chem. 2020, 92, 10891–10901. 10.1021/acs.analchem.0c01296. [DOI] [PubMed] [Google Scholar]
- Dettenrieder C.; Turkmen D.; Mattsson A.; Osterlund L.; Karlsson M.; Mizaikoff B. Determination of Volatile Organic Compounds in Water by Attenuated Total Reflection Infrared Spectroscopy and Diamond-Like Carbon Coated Silicon Wafers. Chemosensors 2020, 8, 75. 10.3390/chemosensors8030075. [DOI] [Google Scholar]
- Hänsel A.; Heck M. J. R. Opportunities for photonic integrated circuits in optical gas sensors. J. Phys. Photonics 2020, 2, 012002 10.1088/2515-7647/ab6742. [DOI] [Google Scholar]
- Alahi M. E. E.; Mukhopadhyay S. C. Detection methods of nitrate in water: A review. Sens. Actuators, A 2018, 280, 210–221. 10.1016/j.sna.2018.07.026. [DOI] [Google Scholar]
- Alahi M. E. E.; Mukhopadhyay S. C.. IoT Enabled Smart Sensing System. In Smart Nitrate Sensor: Internet of Things Enabled Real-Time Water Quality Monitoring; Springer International Publishing, 2019; pp 115–130. [Google Scholar]
- Mahmud M. A. P.; Ejeian F.; Azadi S.; Myers M.; Pejcic B.; Abbassi R.; Razmjou A.; Asadnia M. Recent progress in sensing nitrate, nitrite, phosphate, and ammonium in aquatic environment. Chemosphere 2020, 259, 127492 10.1016/j.chemosphere.2020.127492. [DOI] [Google Scholar]
- Heath C.; Pejcic B.; Myers M. B. Block Copolymer-Coated ATR-FTIR Spectroscopic Sensors for Monitoring Hydrocarbons in Aquatic Environments at High Temperature and Pressure. ACS Appl. Polym. Mater. 2019, 1, 2149–2156. 10.1021/acsapm.9b00420. [DOI] [Google Scholar]
- Baillieul M.; Baudet E.; Michel K.; Moreau J.; Nemec P.; Boukerma K.; Colas F.; Charrier J.; Bureau B.; Rinnert E.; Nazabal V. Toward Chalcogenide Platform Infrared Sensor Dedicated to the In Situ Detection of Aromatic Hydrocarbons in Natural Waters via an Attenuated Total Reflection Spectroscopy Study. Sensors 2021, 21, 2449. 10.3390/s21072449. [DOI] [PMC free article] [PubMed] [Google Scholar]
- Gutierrez-Arroyo A.; Baudet E.; Bodiou L.; Nazabal V.; Rinnert E.; Michel K.; Bureau B.; Colas F.; Charrier J. Theoretical study of an evanescent optical integrated sensor for multipurpose detection of gases and liquids in the Mid-Infrared. Sens. Actuator, B 2017, 242, 842–848. 10.1016/j.snb.2016.09.174. [DOI] [Google Scholar]
- Baudet E.; Gutierrez-Arroyo A.; Baillieul M.; Charrier J.; Němec P.; Bodiou L.; Lemaitre J.; Rinnert E.; Michel K.; Bureau B.; et al. Development of an evanescent optical integrated sensor in the mid-infrared for detection of pollution in groundwater or seawater. Adv. Device Mater. 2017, 3, 23–29. 10.1080/20550308.2017.1338211. [DOI] [Google Scholar]
- Boussard-Plédel C.12 - Chalcogenide waveguides for infrared sensing. In Chalcogenide Glasses; Adam J.-L.; Zhang X., Eds.; Woodhead Publishing, 2014; pp 381–410. [Google Scholar]
- Jin T. N.; Zhou J. C.; Lin H. Y. G.; Lin P. T. Mid-Infrared Chalcogenide Waveguides for Real-Time and Nondestructive Volatile Organic Compound Detection. Anal. Chem. 2019, 91, 817–822. 10.1021/acs.analchem.8b03004. [DOI] [PubMed] [Google Scholar]
- Gutierrez-Arroyo A.; Bodiou L.; Lemaitre J.; Baudet E.; Baillieul M.; Hardy I.; Caillaud C.; Colas F.; Boukerma K.; Rinnert E.. et al. Development of an integrated platform based on chalcogenides for sensing applications in the mid-infrared. In Integrated Optics: Devices, Materials, and Technologies Xxii; Proceedings of SPIE, GarciaBlanco S. M.; Cheben P., Eds.; Spie-Int Soc Optical Engineering, 2018; Vol. 10535. [Google Scholar]
- Lu R.; Li W. W.; Mizaikoff B.; Katzir A.; Raichlin Y.; Sheng G. P.; Yu H. Q. High-sensitivity infrared attenuated total reflectance sensors for in situ multicomponent detection of volatile organic compounds in water. Nat. Protoc. 2016, 11, 377–386. 10.1038/nprot.2016.013. [DOI] [PubMed] [Google Scholar]
- Nam C.; Zimudzi T. J.; Wiencek R. A.; Chung T. C. M.; Hickner M. A. Improved ATR-FTIR detection of hydrocarbons in water with semi-crystalline polyolefin coatings on ATR elements. Analyst 2018, 143, 5589–5596. 10.1039/c8an01280f. [DOI] [PubMed] [Google Scholar]
- Pejcic B.; Myers M.; Crooke E.; Ross A.; Baker M.. Improvements to ATR-FTIR based Chemical Sensors for the Detection of Organic Contaminants Dissolved in Water; IEEE, 2009; pp 299–303 10.1109/icsens.2009.5398158. [DOI]
- Flavin K.; Hughes H.; Dobbyn V.; Kirwan P.; Murphy K.; Steiner H.; Mizaikoff B.; McLoughlin P. A comparison of polymeric materials as pre-concentrating media for use with ATR/FTIR sensing. Int. J. Environ. Anal. Chem. 2006, 86, 401–415. 10.1080/03067310500291585. [DOI] [Google Scholar]
- Lu R.; Mizaikoff B.; Li W. W.; Qian C.; Katzir A.; Raichlin Y.; Sheng G. P.; Yu H. Q. Determination of Chlorinated Hydrocarbons in Water Using Highly Sensitive Mid-Infrared Sensor Technology. Sci. Rep. 2013, 3, 2525 10.1038/srep02525. [DOI] [PMC free article] [PubMed] [Google Scholar]
- Murphy B.; Kirwan P.; McLoughlin R. Investigation into polymer-diffusant interactions using ATR-FTIR spectroscopy. Vib. Spectrosc. 2003, 33, 75–82. 10.1016/s0924-2031(03)00091-2. [DOI] [Google Scholar]
- Howley R.; MacCraith B. D.; O’Dwyer K.; Kirwan P.; McLoughlin P. A study of the factors affecting the diffusion of chlorinated hydrocarbons into polyisobutylene and polyethylene-co-propylene for evanescent wave sensing. Vib. Spectrosc. 2003, 31, 271–278. 10.1016/s0924-2031(03)00020-1. [DOI] [Google Scholar]
- Neubrech F.; Pucci A.; Cornelius T. W.; Karim S.; Garcia-Etxarri A.; Aizpurua J. Resonant Plasmonic and Vibrational Coupling in a Tailored Nanoantenna for Infrared Detection. Phys. Rev. Lett. 2008, 101, 157403 10.1103/PhysRevLett.101.157403. [DOI] [PubMed] [Google Scholar]
- Pi M. Q.; Zheng C. A. T.; Ji J. L.; Zhao H.; Peng Z. H.; Lang J. M.; Liang L.; Zhang Y.; Wang Y. D.; Tittel F. K. Surface-Enhanced Infrared Absorption Spectroscopic Chalcogenide Waveguide Sensor Using a Silver Island Film. ACS Appl. Mater. Interfaces 2021, 13, 32555–32563. 10.1021/acsami.1c08177. [DOI] [PubMed] [Google Scholar]
- Pucci A.; Neubrech F.; Weber D.; Hong S.; Toury T.; de la Chapelle M. L. Surface enhanced infrared spectroscopy using gold nanoantennas. Phys. Status Solidi B 2010, 247, 2071–2074. 10.1002/pssb.200983933. [DOI] [Google Scholar]
- Verger F.; Colas F.; Sire O.; Shen H.; Rinnert E.; Boukerma K.; Nazabal V.; Boussard-Pledel C.; Bureau B.; Toury T.; et al. Surface enhanced infrared absorption by nanoantenna on chalcogenide glass substrates. Appl. Phys. Lett. 2015, 106, 073103 10.1063/1.4913308. [DOI] [Google Scholar]
- Verger F.; Nazabal V.; Colas F.; Nemec P.; Cardinaud C.; Baudet E.; Chahal R.; Rinnert E.; Boukerma K.; Peron I.; et al. RF sputtered amorphous chalcogenide thin films for surface enhanced infrared absorption spectroscopy. Opt. Mater. Express 2013, 3, 2112–2131. 10.1364/ome.3.002112. [DOI] [Google Scholar]
- Verger F.; Pain T.; Nazabal V.; Boussard-Pledel C.; Bureau B.; Colas F.; Rinnert E.; Boukerma K.; Compere C.; Guilloux-Viry M.; et al. Surface enhanced infrared absorption (SEIRA) spectroscopy using gold nanoparticles on As2S3 glass. Sens. Actuator, B 2012, 175, 142–148. 10.1016/j.snb.2012.01.038. [DOI] [Google Scholar]
- Anne M. L.; Keirsse J.; Nazabal V.; Hyodo K.; Inoue S.; Boussard-Pledel C.; Lhermite H.; Charrier J.; Yanakata K.; Loreal O.; et al. Chalcogenide Glass Optical Waveguides for Infrared Biosensing. Sensors 2009, 9, 7398–7411. 10.3390/s90907398. [DOI] [PMC free article] [PubMed] [Google Scholar]
- Baudet E.; Gutierrez-Arroyo A.; Nemec P.; Bodiou L.; Lemaitre J.; De Sagazan O.; Lhermitte H.; Rinnert E.; Michel K.; Bureau B.; et al. Selenide sputtered films development for MIR environmental sensor. Opt. Mater. Express 2016, 6, 2616–2627. 10.1364/ome.6.002616. [DOI] [Google Scholar]
- Renversez G.; Nazabal V.; Charrier J.; Demésy G.. Full-vector finite element 3D model for waveguide-based plasmonic sensors in the infrared. In Advanced Photonics 2018 (BGPP, IPR, NP, NOMA, Sensors, Networks, SPPCom, SOF), Zurich, 2 July 2018; Optical Society of America, 2018; p SeW1E.6. 10.1364/SENSORS.2018.SeW1E.6. [DOI] [Google Scholar]
- Stach R.; Pejcic B.; Crooke E.; Myers M.; Mizaikoff B. Mid-Infrared Spectroscopic Method for the Identification and Quantification of Dissolved Oil Components in Marine Environments. Anal. Chem. 2015, 87, 12306–12312. 10.1021/acs.analchem.5b03624. [DOI] [PubMed] [Google Scholar]
- Pejcic B.; Boyd L.; Myers M.; Ross A.; Raichlin Y.; Katzir A.; Lu R.; Mizaikoff B. Direct quantification of aromatic hydrocarbons in geochemical fluids with a mid-infrared attenuated total reflection sensor. Org. Geochem. 2013, 55, 63–71. 10.1016/j.orggeochem.2012.11.011. [DOI] [Google Scholar]
- Gobel R.; Seitz R. W.; Tomellini S. A.; Krska R.; Kellner R. Infrared attenuated total-reflection spectroscopic investigations of the diffusion behavior of chlorinated hydrocarbons into polymer membranes. Vib. Spectrosc. 1995, 8, 141–149. 10.1016/0924-2031(94)00045-i. [DOI] [Google Scholar]
- Mendes P. M.; Christman K. L.; Parthasarathy P.; Schopf E.; Ouyang J.; Yang Y.; Preece J. A.; Maynard H. D.; Chen Y.; Stoddart J. F. Electrochemically controllable conjugation of proteins on surfaces. Bioconjugate Chem. 2007, 18, 1919–1923. 10.1021/bc7002296. [DOI] [PubMed] [Google Scholar]
- Dettenrieder C.; Raichlin Y.; Katzir A.; Mizaikoff B. Toward the Required Detection Limits for Volatile Organic Constituents in Marine Environments with Infrared Evanescent Field Chemical Sensors. Sensors 2019, 19, 3644 10.3390/s19173644. [DOI] [PMC free article] [PubMed] [Google Scholar]
- Karlowatz M.; Kraft M.; Mizalkoff B. Simultaneous quantitative determination of benzene, toluene, and xylenes in water using mid-infrared evanescent field spectroscopy. Anal. Chem. 2004, 76, 2643–2648. 10.1021/ac0347009. [DOI] [PubMed] [Google Scholar]
- Bagheri S.; Giessen H.; Neubrech F. Large-Area Antenna-Assisted SEIRA Substrates by Laser Interference Lithography. Adv. Opt. Mater. 2014, 2, 1050–1056. 10.1002/adom.201400218. [DOI] [Google Scholar]
- Lérondel G.; Kostcheev S.; Plain J.. Nanofabrication for Plasmonics. In Plasmonics: From Basics to Advanced Topics; Enoch S.; Bonod N., Eds.; Springer Berlin: Heidelberg, 2012; pp 269–316. [Google Scholar]
- Demesy G.; Renversez G.. Discontinuities in photonic waveguides: rigorous Maxwell-based 3D modeling with the finite element method. In J. Opt. Soc. Am. A-Opt. Image Sci. Vis. 2020; Vol. 37, pp 1025–1033 10.1364/josaa.390480. [DOI] [PubMed] [Google Scholar]


